principal licensure exams and future job performance · principal licensure exams and future job...
TRANSCRIPT

[email protected] vu.edu/TNEdResearchAlliance 615.322.5538 @TNEdResAlliance
Principal Licensure Exams and Future Job Performance Evidence from the School Leaders Licensure Assessment Jason A. Grissom, Hajime Mitani, Richard S.L. Blissett
Abstract
Manystatesrequireprospectiveprincipalstopassalicensureexamtoobtainanadministrativelicense,butweknowlittleaboutthepotentialeffectsofprincipallicensureexamsonthepoolofavailableprincipalsorwhetherscorespredictlaterjobperformance.Weinvestigatethemostcommonlyusedexam,theSchoolLeadersLicensureAssessment(SLLA),usingtenyearsofdataonTennesseetesttakers.Weuncoversubstantialdifferencesinpassageratesbytest-takercharacteristics.Inparticular,nonwhitesare12percentagepointslesslikelythanotherwisesimilarwhitetest-takerstoattaintherequiredlicensurescore.Althoughcandidateswithhigherscoresaremorelikelytobehiredasprincipals,wefindlittleevidencethatSLLAscorespredictmeasuresofprincipaljobperformance,includingsupervisors’evaluationratingsorteachers’assessmentsofschoolleadershipfromastatewidesurvey.OurresultsraisequestionsaboutwhetherconditioningadministrativelicensureonSLLApassageisconsistentwithprincipalworkforcediversitygoals.
Thisisaworkingpaper.Workingpapersarepreliminaryversionsmeantfordiscussionpurposesonlyinordertocontributetoongoingconversationsaboutresearchandpractice.Workingpapershavenotundergoneexternalpeerreview.
WORKING PAPER 2017-01
1
Effective principals are essential to school performance and school improvement
(Leithwood, Louis, Anderson, & Wahlstrom, 2004). The school’s principal serves a variety of
central roles in the school, including establishing its mission and goals, building its culture and
climate, leading its instructional program, and making decisions about teacher hiring, assignment,
professional development, and dismissal, among others (e.g., Goldring et al., 2014; Bredeson,
2000; Cohen-Vogel, 2011; Cohen-Vogel & Osborne-Lampkin, 2007; Hallinger & Heck, 1998;
Hord, 1997; Jacob, 2011; Leithwood et al., 2004; Rutledge, Harris, Thompson, & Ingle, 2008).
Research has linked effective school leadership to greater teacher morale and satisfaction, lower
teacher turnover, higher parent ratings of the school, higher quality of professional development
and coherence of programs, better learning climate, and greater student achievement (Boyd et al.,
2011; Branch, Hanushek, & Rivkin, 2012; Grissom, 2011; Grissom & Loeb, 2011; Sebastian &
Allensworth; Supovitz, Sirinides, & May, 2010). Means for ensuring quality in the principal
workforce are thus of keen interest to policymakers (Doyle & Locke, 2014).
States’ principal licensure systems aim to serve as a primary means for guaranteeing
some level of leadership quality by establishing minimum requirements for new school leaders.
These systems typically require prospective school leaders to complete a state-approved school
administrator preparation program, earn a master’s degree in educational leadership or a related
field, and have three to five years of teaching experience to be licensed in school administration
(Kaye & Makos, 2012). In addition, many states also require principal candidates to pass a
standardized licensure exam before they are licensed to work as a public school principal or
assistant principal. The most common of these exams is the School Leaders Licensure
Assessment (SLLA), administered by Educational Testing Service (ETS).
2
The SLLA is designed to measure whether principal job candidates possess the
knowledge and/or skills necessary to perform school administration tasks competently in their
initial years of school leadership (ETS, 2009; Tannenbaum & Robustelli, 2008). In its current
format, the SLLA is a four-hour computer-based standardized exam whose content is aligned
with the Interstate School Leaders Licensure Consortium (ISLLC) leadership standards (ETS,
n.d.-a); Tannenbaum & Robustelli, 2008). As of 2016, 18 states, the District of Columbia, and
two territories require principal candidates to obtain some minimum score as a condition of
becoming a school leader (ETS, n.d.-b).
Despite this widespread use of the assessment among states, the properties of the SLLA
have not received much research attention. In particular, we know little about the distribution of
scores across different groups of test takers or about the usefulness of SLLA scores for
identifying and hiring leaders who are likely to be successful as principals once entering the
principalship. The distributional question is important given evidence from teacher licensure
exams and standardized exams in other professions of different score distributions or passage
rates by such test-taker characteristics as race, ethnicity, and gender (Angrist & Guryan, 2008;
Anrig, Goertz, & McNeil, 1986; Esmail & Roberts, 2013; Fernandez, Studnek, & Margolis,
2008; Garcia, 1986; Gitomer, Latham, & Ziomek, 1999; Nettles, Scatton, Steinberg, & Tyler,
2011; Wightman, 1998). Nonwhite and female educators are, and historically have been,
underrepresented in the principalship (Bitterman, Goldring, & Gray, 2013; Riehl & Byrd, 1997).
Although possible inequitable access to school leadership positions by both race/ethnicity and
gender raises basic fairness concerns, underrepresentation among nonwhite educators is
particularly concerning in light of evidence on the positive impacts of school leadership diversity
on outcomes for an increasingly diverse population of students and teachers (see Grissom &

3
Keiser, 2011; Grissom, Rodriguez, & Kern, in press; Irvine, 1988; Lomotey & Lowery, 2014).
An examination of whether differential licensure examination performance might contribute to
this underrepresentation thus has relevance for policymakers seeking to diversify the school
leadership workforce.
The usefulness question speaks to the presumed goals of including a professional
examination as a component of entering a new occupation, which typically are either to screen
out candidates who are unlikely to be effective (while, conversely, allowing effective
practitioners to be licensed) or to provide prospective principals with a score that signals how
effective they are likely to be, especially in their first few years in a school leadership position
(Goldhaber & Hansen, 2010). If empirically the test serves no practical screening or signaling
function, then not only is the utility of the test called into question, but concerns about possible
inequities in scores—or, especially, passage rates—by immutable test-taker characteristics would
be redoubled. On the other hand, if the test is successful in screening candidates or signaling
performance, states may consider policy strategies such as raising minimum cut scores or
reporting scores to districts seeking to hire principals as means to increase the quality of the
principal workforce.
This study addresses these questions using unique data on all SLLA test takers in
Tennessee over approximately a ten-year period, which we link to administrative records on
principals, schools, and students. To be specific, we use these data to answer three questions.
First, how are scores distributed by prospective principal characteristics and the schools in which
they work, and how do those characteristics predict the probability of failing to meet Tennessee’s
cut score to be eligible for licensure? Second, to what extent do SLLA scores predict school
leader labor market outcomes, including future hiring as an assistant principal or principal and
4
principal turnover? Third, does SLLA “failure” screen less effective principals, and to what
degree do SLLA scores signal future job performance of principal candidates? Based on our
answers to these questions, we also assess how increasing Tennessee’s cut score to the higher
scores of nearby states would, given the current distribution of scores, likely affect the
composition of licensed principal workforce and overall principal job performance.
Of course, linking SLLA performance to job performance only makes sense if valid
measures of principal job performance exist. Given the difficulties researchers have documented
in creating valid measures of principal performance (e.g., Chiang, Lipscomb, & Gill, 2012;
Condon & Clifford, 2012; Grissom, Kalogrides, & Loeb, 2015), we eschew reliance on any
single measure. Instead, we test for associations between SLLA scores and a variety of potential
performance metrics gathered from statewide evaluation, teacher survey, and administrative data,
which allows for more nuanced findings regarding potential associations between SLLA scores
and some areas of principal effectiveness but not others.
The next section provides background on principal licensure requirements and the SLLA.
We then discuss the potential screening and signaling functions of the SLLA and other licensure
exams. Next, we describe our data and methodological approaches before reporting our results.
We conclude with a discussion of the implications of our findings for use of the SLLA to
improve principal quality and the consistency of its usage with the goals of increasing diversity
in the principal workforce.
Background on Principal Licensure Requirements
5
All states require public school principals to hold a school administration license (Kaye
& Makos, 2012; Roberts, 2009).1 While there are some differences in licensure requirements,
states typically require a valid teaching license; multiple years of teaching experience in the K-12
setting; the completion of a state-approved school administrator preparation program, usually
provided by a college or university; and a master’s degree (or higher) in school administration or
related field (Kaye & Makos, 2012; Zimmerman, 2002). Other requirements that some states
impose include a residency requirement, a practicum as a principal, or work experience as an
assistant principal (Kaye & Makos, 2012). States also increasingly require principal candidates to
pass a standardized assessment that tests their knowledge of school administration or educational
leadership topics (Robert, 2009). These assessments aim to raise the caliber of principal
candidates entering the profession by ensuring a minimum standard for what school leaders need
to know (Latham & Pearlman, 1999; Tannenbaum, 1999). As of 2011-12, at least 30 states
required such an exam for initial licensure.2 Among them, 17 states currently require candidates
to take the SLLA, for which each state sets their own minimum qualifying score (ETS, n.d.-b).
Other states use other standardized assessments or their own assessments. For example, in Texas,
principal candidates must pass the Principal TExES administered by ETS to be certified as
principal (Texas Education Agency, 2014). In New York, candidates need to pass the New York
State Teacher Certification Examination Program assessments for school building leaders (New
York State Education Department, 2013).
1 Licensure and certification are not synonymous. The former is mandatory and issued by governments, whereas the latter is voluntary and often granted by private nongovernmental organizations (Mehrens, 1987; Tannenbaum, 1999). 2 This number is based on the authors’ review of the following website: http://www.teaching-certification.com/principal-certification.html. It includes states that allow waivers for applicants who meet other state-specific criteria. In addition to the 30 states, Arkansas requires an exam for a standard license after an initial license. Florida requires an exam for educational leadership positions including principal positions but does not require an exam specific to principal positions. Maryland does not require an exam for assistant principal positions but does so for principal positions. California and Michigan require an exam if candidates seek a license through an alternative route. Nevada does not require an exam but most of the state’s college/university programs in school administration require a passage on Praxis II Educational Leadership: Administration and Supervision exam.

6
In Tennessee, which is the focus of our study, principal candidates are required to
complete a state-approved school administrator preparation program, hold a valid Tennessee
educator license, and have at least three years of education work experience to be licensed in
school administration. In addition, they must score at or above 160 on the SLLA (TDOE, n.d.-a).
This cut score is the lowest in the United States (tied with Kentucky); cut scores across states
range from 160 to 169 (ETS, n.d.-b).
The School Leaders Licensure Assessment
The foundation of the SLLA is the ISLLC standards, which aim to define strong school
leadership for use in leadership training, licensure, and principal evaluation (Council of Chief
State School Officers (CCSSO), 1996; 2008; Murphy & Shipman, 1999). The ISLLC standards
are comprised of six domains, spanning school vision, school culture, learning environment,
collaboration with the faculty and community members, ethics, and understanding of the school
context (CCSSO, 2008). ISLLC states contracted with ETS to develop the SLLA as a tool for
ensuring that new leaders were prepared for leadership work in the standards’ areas (Latham &
Pearlman, 1999). The first version, SLLA form 1010, was developed in 1999. It was a six-hour,
paper-based assessment with 25 constructed-response questions in four domains. The second
version, SLLA form 1011, replaced the earlier version in 2009, and was further succeeded by the
6011version in 2011. This last version covers the same content as the 1011 version but is
computer-based.
SLLA form 6011 is a four-hour standardized exam and is comprised of two sections
covering the following six domains that correspond to the ISLLC leadership domains: vision and
goals, teaching and learning, managing organizational systems and safety, collaborating with key
stakeholders, ethics and integrity, and the education system. The first section asks 100 multiple-
7
choice questions, and the second section asks seven constructed-response questions (ETS, n.d.-a).
The score ranges from 100 to 200, and ETS recommends a score of 163 points as a passing score
(ETS, 2009). Among participating states and Washington D.C., five states set their passing
scores higher than 163 points, with Mississippi requiring the highest score of 169 points.3
The SLLA is designed to measure whether principal candidates possess knowledge and
skills necessary to perform job responsibilities expected of beginning principals effectively
(Reese & Tannenbaum, 1999; Tannenbaum & Robustelli, 2008). With this aim in mind, the
content of the questions was based on a national job analysis of beginning school principals. The
job analysis collected information on knowledge and skills necessary for satisfactory
performance among novice school leaders through a series of meetings with experts and current
principals and a review of the literature. ETS verified content validity of the assessment by
establishing a link between the ISLLC standards and the scope of knowledge and skills defined
by the job analysis (Tannebaum, 1999; Tannenbaum & Robustelli, 2008).The evaluation of
principal responses also is guided by the ISLLC standards (Latham & Pearlman, 1999;
Tannenbaum, 1999; Reese & Tanneubaum, 1999; Tannenbaum, 1999).
Screening and Signaling Value of the SLLA
For policymakers, principal licensure examination requirements have two goals. First, by
setting a minimum qualifying score or a cut score, states can specify a minimum level of
knowledge and skills that principal candidates should possess to be licensed in school
administration, excluding from the candidate pool individuals not meeting this minimum
requirement. This function is called screening (Goldhaber, 2007; Goldhaber & Hansen, 2010).
Second, among those surpassing the qualifying score, licensure scores can be used as an 3 California Department of Education used the SLLA as an optional exam requirement for licensure until February 2011 (Association of California School Administrators, n.d.; California Department of Education, n.d.; Commission on Teacher Credentialing, n.d.). At the time, the cut score was set at 173.

8
indicator of future principal job performance, especially in the first few years in the profession
before substantial on-the-job experience might build (or supplant) the knowledge and skills
measured by the exam. This function is called signaling (Goldhaber, 2007; Goldhaber & Hansen,
2010) or, more generally, predictive validity. If exam scores are a useful performance signal,
policymakers or district leaders might use them for human resource decisions, such as making
hiring decisions, setting initial salary, or placing effective principals in schools where they are
needed most.
The hypothesis that the SLLA will predict future job performance relies on at least three
expectations, and the failure of any of them could negate such a relationship. First, we need to
expect that the SLLA is pegged to standards that are preconditions for good job performance—
that is, that the standards indeed describe the skills and competencies that effective principals
require. The ISLLC standards were based on prior research that examined the linkages between
educational leadership and school and student outcomes, changes in student demographics (e.g.,
race, poverty, language, and culture), and the societal shift toward market-based solutions to
social needs (CCSSO, 1996; 2008). Critics contend, however, that this research was often limited
in scientific or empirical rigor and lacking in specific or operational guidance for principals to
use the standards for action (Achilles & Price, 2001; English, 2000). Studies have not examined
the relationship between principals’ ratings on these standards and school and student outcomes,
with the exception of one descriptive study that found evidence of positive correlations (Kaplan,
Owings, & Nunnery, 2005). An experimental evaluation of a multi-year professional
development program for principals covering content similar to content emphasized by the
ISLLC standards found no impact on measures of school climate or student achievement (Jacob
et al., 2014).

9
Second, we have to expect that the knowledge and skills the SLLA measures lead to
leadership behaviors that are effective. That is, the test purports to measure knowledge and skills,
not whether the candidates can or will apply them in leadership action. If the connection between
knowledge and skills and effective behaviors is weak, even very knowledgeable (or skilled)
principals may show no better leadership performance in practice.
Third, we have to expect that the SLLA is itself a valid and reliable tool for measuring
these knowledge and skills. A test that does not appropriately capture the underlying leadership
knowledge and skill constructs is unlikely to correlate with future performance. Unfortunately,
published research on the psychometric properties of the SLLA is limited (Tannebaum, 1999;
Tannenbaum & Robustelli, 2008), making construct validity and reliability difficult to assess.4
Even if the SLLA predicts future principal job performance, however, the likelihood that
it correlates with measures of future job performance rests on a fourth expectation, which is that
valid and reliable measures of principal job performance are available. This expectation is not a
trivial one. In the past, few such measures have existed (Reese & Tannebaum, 1999), and even
now, the properties of many measures of principal performance used by researchers and
policymakers are understudied. For example, many empirical studies have utilized student or
school achievement scores as performance measures (e.g., Hallinger & Heck, 1998; Robinson,
Lloyd, & Rowe, 2008), but research has documented the difficulties inherent in attributing test
score changes to principals (Grissom, Kalogrides, & Loeb, 2015). Similarly, the reliability and
validity of subjective ratings of principal performance from supervisors or teachers increasingly
utilized in principal evaluation systems have received only limited attention (Grissom, Blissett,
& Mitani, 2016).
4 The SLLA appears not to have been reviewed as part of the Mental Measurements Yearbook series, which provides evaluative information about commercially available instruments.
10
Poor predictive validity of the SLLA would undermine its capacity to successfully screen
principal candidates. If the SLLA has only weak power to differentiate future high and low
performers, a cutoff score requirement may result in many false negatives and false positives
(Goldhaber, 2007; Goldhaber & Hansen, 2010). In other words, the licensure system would
reject principal candidates who could perform well as school leaders (false negatives) and accept
candidates who turn out to be ineffective school leaders (false positives). False negatives are
particularly problematic if they are unequally distributed across subgroups of candidates. For
example, if racial or ethnic minority candidates tend not to perform well on the exam for reasons
unrelated to their potential skills as principals, resulting in disproportionately high failure rates,
the SLLA becomes a significant barrier for policymakers seeking to increase demographic
diversity in the school leadership population and contributes to inequitable access to school
leadership positions for historically disadvantaged populations. In addition, the existence of false
positives potentially reduces the overall quality of the principal workforce by permitting less
effective candidates to lead schools. These concerns motivate our investigation of the
relationships among SLLA scores, test taker and school characteristics, and future job
performance of principal candidates.
Prior Research on the SLLA
Current school leadership research provides little insight into how SLLA scores are
distributed or the extent to which they are associated with later principal or school outcomes.
Most of the prior studies of the SLLA have focused on how SLLA scores are associated with
principal candidates’ course grades or internship performance during their graduate studies in
school administration, or have examined whether the assessment’s short vignette questions are
valid in terms of differentiating individuals trained in school administration preparation
11
programs from those with little background in education (Bryant, Isernhagen, LeTendre, & Neu,
2003; Kelly & Koonce, 2012; Kelly, 2013; Koonce & Kelly, 2013). For example, Kelly and
Koonce (2012) explored correlations between the SLLA scores and cumulative grade point
averages (GPA) of graduate students in educational leadership programs as well as their
internship performance ratings, assigned by mentors. They found a weak positive correlation
between student GPA and SLLA scores but no correlation with internship performance ratings.
One recent descriptive report published by the California Department of Education
examined the passage rates of all test takers on SLLA form 1010 between 2005-06 and 2009-10
by race and gender (California Department of Education, 2011). Principal candidates and other
school administrator candidates were required, until 2011, to score 173 or above to be licensed.
The report shows that while the pass rate was around 80%, there was wide variation by race and
gender. For example, during the five-year period, the pass rate was 84% for women but only
71% for men. The report also finds that pass rates among test takers identifying as racial and
ethnic minorities were substantially lower than those of white test takers. During the time period
studied, 84% of white test takers passed the exam, whereas only 62% of African-American test
takers and 72% of Hispanic test takers did so.
Given limited evidence on principal licensure exams, the best available evidence
regarding the likelihood that they predict other outcomes may come from study of tests used for
teacher licensures, such as the Praxis examinations. These studies generally have found that
teacher licensure exams are somewhat effective in weeding out less competent teacher
candidates (Goldhaber, 2007; Goldhaber & Hansen, 2010). However, the exams appear to be at
best weakly associated with future teacher job performance (Clotfelter, Ladd, & Vigdor, 2006;
Clotfelter, Ladd, & Vigdor, 2007; D’Agostino & Powers, 2009; Goldhaber, 2007; Goldhaber &
12
Hansen, 2010). The nature of a teacher’s work, the licensure exams themselves, and the
measures of job performance all differ from the principal context, necessitating a closer look at
pre-service testing for principals.
The connections between SLLA scores and principal labor market outcomes are similarly
unexplored, though there are reasons to hypothesize that these connections exist. For example,
we might expect that SLLA scores predict the likelihood that a candidate is hired as a principal
or assistant principal if districts view a candidate’s score as an important signal, either of useful
skills or competencies the test purports to measure or of some other trait, such as general
intelligence or capacity for leadership. Even if districts do not know the scores themselves—and
typically they would not, unless the candidate self-reported, because scores are reported to states
rather than districts—they could be correlated with competencies or traits the districts value that
will be reflected in the interview or other aspect of the hiring process. Once a candidate becomes
a principal, we might also expect SLLA scores to be associated with turnover probabilities.
Given evidence that more effective principals are less likely to leave their positions, for example,
we hypothesize that high scorers have lower propensities for turnover than principals with lower
SLLA scores. Because of the value of leadership stability for school performance and
improvement (Béteille, Kalogrides, & Loeb, 2012; Hargreaves & Fink, 2004; Hargreaves, Moore,
Fink, Brayman, & White, 2003; Miller, 2013), if SLLA scores indeed predict future principal
turnover or retention, they conceivably could have value to districts in making strategic human
resource decisions—for example, around principal placement—even if they did not provide a
strong signal about future job performance.
Data and Measures

13
Our analysis uses data on complete SLLA score histories—i.e., all test scores, even non-
passing scores or retakes—for any person taking the test as a condition of licensure to work in
Tennessee between 2003 (the first year the test was required) and 2013, provided by ETS. The
total number of test scores, which includes anyone taking the test at a Tennessee testing center or
who requested their score be reported to the Tennessee Department of Education (TDOE), is
8,589. The data also include information about which school leader preparation program test
takers completed (or currently attend) as part of the state’s licensure requirements, which we
utilize in some analyses.
We matched score histories to longitudinal administrative data files on all public
education personnel from the 2003-04 to 2013-14 school years, provided by TDOE via the
Tennessee Consortium on Research, Evaluation, and Development at Vanderbilt University.5 In
matching, we identified 7,951 test scores for 7,633 individuals with a valid Tennessee educator
licensure record.6 The administrative files provide rich information about test takers’ personal
and professional characteristics, including job positions, gender, race and ethnicity, age, years of
experience, and highest degree earned. We used these data files to construct additional
experience measures, such as years of experience as a principal in Tennessee (for those observed
entering new principal positions after 2003-04, top-coded otherwise) and years employed in their
current school. We merged these data with information on the characteristics of the schools and
districts in which the test takers currently work from annual student demographic and enrollment
data files from TDOE and the National Center for Education Statistics’ Common Core of Data
files.
5 To match scores with administrative data, we used test takers’ social security number, or, if not available, their names and dates of birth. We then matched on name only, but given the completeness of the social security number and date of birth information, the number of observations added was small. 6 Among these 7,633 individuals, 232 (3%) took the test twice; 27 (0.4%) took it three times; and 11 (0.1%) took the test four times.
14
Measuring Principal Job Performance
Measures of principal job performance data come from multiple sources. First, TDOE
provided us with principal evaluation information from the Tennessee Educator Acceleration
Model (TEAM) for the 2011-12, 2012-13, and 2013-14 school years. TEAM is the statewide
educator evaluation system that TDOE created as part of its Race to the Top education reforms.
For principals, TEAM evaluations are comprised of two portions, with each accounting for 50%
of the final evaluation score. The first portion comes from supervisor ratings of principal
performance on a rubric derived from the Tennessee Instructional Leadership Standards.7 As of
2013-14, the rubric defines principal leadership across 22 items in 7 domains, such as
Instructional Leadership and Culture for Teaching and Learning. Principal ratings are based on
formal observations typically conducted by the principal’s supervisor, the superintendent, or
another central office leader. Because not all principals received mid-year observations in the
initial years of TEAM implementation, we use the end-of-year summative rating for all
principals. In other work, we show that principals’ scores across the 22 items are so highly inter-
correlated that they can be reduced to a single underlying performance score using factor
analysis (Grissom, Blissett, & Mitani, 2016). In this analysis, we use the predicted score from
this factor model as the TEAM subjective rating (the average across items is correlated with the
factor score at 0.97). Because the items included in the TEAM rubric varied somewhat across
years, we analyze the data on these subjective ratings separately by year; however, because
factor analysis shows a single performance factor, we also show results pooling across years.
These subjective rating scores are referred to as “TEAM scores” for the remainder of this paper.
Note that assistant principals similarly were rated summatively by their building principals using
7 For more information about TEAM, see http://team-tn.org/evaluation/administrator-evaluation/.

15
the same rubric in the same years. We utilize parallel factor-analyzed scores for assistant
principals in some analyses.
The second portion comes from student achievement measures, including 35% from
school-level value-added scores calculated via the Tennessee Value-Added Assessment System
(TVAAS) (the other 15% is an achievement measure mutually agreed upon by the principal and
rater, which we do not include here given that it can vary from person to person). For 2012-13
and 2013-14, TDOE provided us with composite school-level value-added scores from TVAAS,
which combine performance across all tested classrooms, subjects, and tests (e.g., end-of-course
exams, SAT-10). Although not clearly an accurate measure of principal performance (Grissom,
Kalogrides, & Loeb, 2015), we make use of TVAAS scores because of the emphasis given to
them as a performance measure in the state evaluation and accountability systems.
To supplement our analysis of TVAAS, we also test for associations with student-level
growth from models we run using TDOE-provided data on student demographics, enrollment,
and achievement on the Tennessee Comprehensive Assessment Program (TCAP) for all
Tennessee students from 2007-08 to 2013-14. TCAP is a timed, multiple choice assessment and
is designed to measure skills in reading, language arts, mathematics, science, and social studies
(TDOE, n.d.-b). We use test scores in reading and mathematics for grades 3 through 8. A school
identifier permitted student data to be matched to schools and principals.8
TDOE also provided responses to the school leadership module on a statewide 2012-13
survey of Tennessee teachers: the Teaching, Empowering, Leading, and Learning (TELL) survey.
This module includes a series of approximately 20 questions that assess perspectives of teachers,
8 Standardized testing in high schools comes at the end of some courses only. We exclude these tests from the student growth analyses because it is unclear what prior-year score would be appropriate. Thus, nearly all high schools are excluded from these analyses, with the exception of the very small number whose grade span includes tested grades.

16
assistant principals, and principals on their school’s leadership.9 Items ask, for example, whether
the school’s leadership consistently supports teachers, whether teachers are recognized for their
accomplishments, and whether they make an effort to address teachers’ concerns. We use
responses by respondent type (e.g., teacher, assistant principal) to measure the quality of the
school’s leadership.10 Using factor analysis conducted separately by respondent type (e.g.,
teacher, assistant principal), we again found that responses measured one underlying latent
construct, which we take to be perception of leadership effectiveness.11 Respondent-level factor
scores were averaged at the school level by respondent.12
Finally, we create a binary principal turnover variable from the longitudinal
administrative data files. It takes a value of 1 if a principal leaves his or her current school in
year t+1, and zero otherwise. Note that this variable does not distinguish turnover decisions
made by the principal from those made by the school district.
Methods
9 Items do not necessarily refer just to the performance of the school principal. For more information about TELL, see http://www.telltennessee.org/. 10 In our original sample, 57% of the principals responded to the TELL leadership module. Forty-six percent of schools have TELL responses from at least one assistant principal. Almost all of the principals (97 percent) have responses from at least one teacher in their school (overall teacher response rate = 71%). We compared characteristics of principals and their schools between principals with and without TELL scores for each respondent type (i.e., by principal, assistant principal, and teacher) through a series of simple t-tests. For TELL responses by principals, we found that principals with the scores tend to be female and white and work at schools with a smaller proportion of black students in rural areas. For TELL responses by assistant principals, we found that principals with the scores are significantly different from those without the scores in many observable characteristics. For example, principals with the scores tend to be white and work at larger schools in less populated areas with a smaller proportion of disadvantaged students (note that only approximately 58% of schools in Tennessee employ at least one assistant principal in 2012-13). On the other hand, for TELL responses by teachers, principals with and without the scores are comparable on most of the characteristics. Note that because surveys were anonymous within school, we do not have identifying information for respondents and thus could not compare characteristics of responding and non-responding assistant principals and teachers. 11 Correlations in these school-level factor scores are 0.11 between principals and assistant principals, 0.17 between principals and teachers, and 0.26 between assistant principals and teachers. 12 Following the methodology proposed by Schweig (2013), we additionally used MPlus software to create factor scores that account for possible violations of measurement invariance at the school level. The correlation of the between-cluster factor scores and our original factor scores was 0.97; thus we do not find practical differences between the multilevel and the single-level factor scores. These analyses were conducted using our original, single-level factors.
17
Our analysis consists of three parts: an analysis of the distribution of SLLA scores and
failure rates, an analysis of the association between SLLA score and principal hiring and
turnover, and an analysis of the SLLA as a performance screen or signal. We describe each in
turn.
Analysis of Distribution of Test Scores and Test Failure
The first part explores what characteristics are associated with SLLA scores and failure
rates. Prior to the 2009-10 school year, the cut score in Tennessee was 156. In the 2009-10
school year, a new form of the SLLA test (SLLA form 1011) was instituted, and the cut score
was raised to 160. The cut score remained the same when TDOE switched to SLLA form 6011 in
the 2011-12 school year. We use these cut scores to create a binary passage/failure indicator for
each test observation.
We begin by describing scores and passage rates overall and by different principal
candidate and school characteristics using t-tests. The idea is to assess whether scores and pass
rates vary according to personal characteristics of the test takers and, given the likelihood that
they will become principals in schools similar to the ones in which they have worked previously
(Bastian & Henry, 2014), the schools in which they are currently employed, typically as teachers.
We then model the probability of failure as a function of principal candidates’ characteristics,
school characteristics, district characteristics, and year effects, plus administrator preparation
program fixed effects and region fixed effects defined by TDOE’s eight geographic support
regions (e.g., Northwest, South Central).13 Models are estimated using logistic regression. More
formally, for example, for failure we estimate the following logistic regression model:
Pr #$%&'() ist =.f
01.f, (1)
13 Models of test scores instead of test failures yielded similar results.
18
where # = 40 + 7ist41 + 9st42 + ;st43 + =t + >i + ?s + @ist.
The probability that a principal candidate i (who may take the test more than once) in
school s in year t fails is a function of candidate characteristics Xjst (gender, age, nonwhite status,
total years of experience as educator in the state of Tennessee , and education specialist or
doctoral degree), school characteristics Sst at the time of the test administration (locale type,
percent of students eligible for the federal free/reduced lunch program, percent of black students,
percent of Hispanic students, school level, and school enrollment size), a similar set of district
characteristics Dst, year fixed effects θt, and a random error term εist, and, in some models,
administrator preparation program indicators δi and/or region indicators τs. We include
administration preparation program indicators to control for differences in the selectivity and
quality of the programs, which can vary substantially (e.g., Levine, 2005; Murphy, 2007).
Region effects control for region-specific differences in test scores that may arise from
differences in labor markets or other factors that may attract different kinds of candidates to the
principalship.
School Leader Hiring and Turnover
The second part of our analysis explores the extent to which SLLA scores predict school
leader labor market outcomes, namely candidates’ future hiring as a school leader and turnover
among current principals. For hiring, because principal candidates need to meet multiple
licensure requirements in addition to passing the exam, we limit our analytic sample to principal
candidates who have successfully obtained a license in school administration. Note that not all
licensed candidates are on the market for such a position, so any estimated association between
SLLA score and hiring will not separate the propensity for candidates with different scores to
19
seek leadership positions at different rates from the likelihood that higher or lower scoring
candidates are hired after applying.
We use a Cox proportional hazard model to estimate time to hire.14 A hazard model is
appropriate here because of the censored nature of the dependent variable. More formally, we
estimate the following hazard model:
Bist C DEF$(%$C)Gist = B0 C exp 40 + KL9Ki41 + 7ist42 + 9st43 + ?s + @ist (2)
The hazard rate that a licensed principal candidate i in school s is hired as a principal in
year t+1 is a function of the baseline hazard λ0(t), SLLA test score TESTi, candidate
characteristics Xjst, school characteristics Sis, region fixed effects τs, and a random error term εist.
Vectors X and S contain the same variables as in the failure analysis above. We further stratify by
school district to take into account district-level differences in hiring probabilities. We cluster
standard errors at the candidate level.
One of the key assumptions of a Cox proportional hazard model is the proportionality
assumption. We test this assumption for each covariate by examining Schoenfeld residuals (Box-
Steffensmeier & Zorn, 2001; Keele, 2010; Klein & Moeschberger, 2003). When a covariate
violates the proportionality assumption, we interact it with time in logarithmic form to address
this violation.
To test for non-linear associations between SLLA scores and hiring, we insert different
forms of the SLLA scores (e.g., quadratic, categorical across different score ranges). We also
estimate the similar hazard models for alternative outcomes, replacing time to first principal job
with time to becoming (a) an assistant principal or (b) any school administrator (i.e., either
principal or assistant principal). 14 We also estimated logistic regression models and competing risk models (i.e., cumulative incidence functions) where becoming a principal is an event of interest and becoming an assistant principal is a competing event. We found similar patterns.
20
Our analysis of turnover estimates a similar Cox proportional hazards model of Equation
2, except that the outcome is time to leaving the district (equation omitted for brevity). The
sample is all principals we observe entering the principalship during the time period of the data.
Time to exit (hazard rate) is modeled as a function of SLLA score, school characteristics,
principal characteristics, and a random error term. As in the hiring analysis, we test the
proportionality assumption and include an interaction with time for variables that may be in
violation. In addition, we stratify the model by school district to account for unobserved district-
specific factors that may affect turnover, such as district working conditions or local alternative
employment opportunities. We also test for non-linearities between SLLA score and turnover by
inserting different forms of the score variable, as described above for the hiring analysis.
Screening and Signaling Analyses
The last group of analyses includes only working principals. It examines the two
functions of testing polices: screening of weak principal candidates from the candidate pool and
signaling of future job performance. The screening analysis focuses on whether passing a cut
score set by the state differentiates between those who pass and those who fail in terms of their
future job performance. The signaling analysis assesses whether—conditional on passing the
screen—higher SLLA test scores are associated with better job performance, particularly within
the first few years of a school leadership career.
Screening. Obviously, a central challenge for an analysis of screening is a classic
selection problem: we cannot observe the job performance of a principal candidate if he or she
fails the exam and thus never becomes licensed to be a school principal. To address this problem,
we take advantage of the arbitrary nature of states’ chosen cut scores and implement three
approaches similar to those in Goldhaber’s (2007) analysis of the screening value of teacher
21
licensure testing. For these analyses, we limit the sample to the form 1010 test takers from the
time period prior to 2009 when—we will show later—the very low cut score employed in
Tennessee (156) meant that only about 1% of test takers failed. First, we compare the future
performance of those who passed under the pre-2009 cut score of 156 but would have failed had
the post-2009 cut score of 160 been in place to those who would have passed under either cut
score. Second, we compare the future performance of those who passed under the pre-2009 cut
score of 156 but would have failed had Tennessee implemented ETS’s recommended cut score
of 163 (a cut score employed in at least two neighboring states) to those who scored 163 or
higher. In a final analysis, we set a hypothetical cut score at 169, the highest cut score currently
used by any state in the United States (Mississippi) to assess whether the SLLA’s screening
capacity might be different at a much higher cut point.15 The idea behind each of these analyses
is that, if the SLLA is an effective screening tool at any of these three cut score choices,
Tennessee principals scoring below the cut score should have lower performance, on average,
than those scoring above it. This evidence, however, must be interpreted with appropriate caution,
given that we do not in fact observe outcomes for a small number of principals in the far left tail
of the distribution who would serve as the most appropriate counterfactual for Tennessee’s actual
chosen cut score.
The screening model estimates principal job outcomes as a function of the various
indicators for passage or failure, plus school controls. Note that other principal characteristics are
not included in these models because the licensure policy screens principal candidates based
15 We also performed the same analysis using principals who took form 1011 or 6011. These models were limited by sample sizes. For 2013 TEAM and TELL scores, we could estimate screening models for the 169 cut score only. For 2012 TEAM, 2014 TEAM, TEAM combined, and TVAAS, we could estimate models for cut scores of 163 and 169. We found no evidence of a correlation between obtaining the cut scores and performance for any of these measures. For TCAP scores, we found negative correlations in both math and reading when the cut score is 160 or 163. When the cut score is 169, we found a negative, marginally significant coefficient for reading but no significant coefficient for math. Results available upon request.
22
solely on test performance and does not consider any other indicators of leadership ability
(Goldhaber & Hansen, 2010). The model takes the following form:
Nis = 40 + O$GGi41 + 9is42 + ;st43 + ?s + @is (3)
in which job performance Y (i.e., TEAM, TVAAS, and TELL) of a principal i at school s is a
function of Passi, an indicator for scoring at or above the SLLA cut score (i.e., 160, 163, or 169);
school characteristics Sis (school enrollment size, percent of female students, percent of nonwhite
students, percent of students eligible for the federal free/reduced lunch program, percent of
students whose first language is not English, percent of immigrant students, percent of
intellectually gifted students, percent of students with disabilities, mean attendance rate, locale
type, and school level), district characteristics Dst (district enrollment size in natural log form,
percent of students eligible for the federal free/reduced lunch program, percent of nonwhite
students, district enrollment size, locale code), region effects τs, and a random error term@is.
For TEAM scores, given changes in the rubric across years, we estimate models
separately for 2011-12, 2012-13, and 2013-14, plus an additional model pooling all three years.
For TELL, models are limited to a single year of data (2012-13). TVAAS models combine 2012-
13 and 2013-14. For models that pool across years, we add year fixed effects and cluster standard
errors at the school level. For cross-sectional models, we cluster standard errors at the district
level.
We also estimate screening models using student-level TCAP test scores from grades 3–8
in math and reading.16 These models include all of the variables included in Equation 3 and add
student-level control variables (including lagged test scores), year fixed effects, and grade fixed
effects. Specifically, we estimate the following growth model:
16 High school students are not included because they take end-of-course tests, which vary by grade.
23
PQRST = 40 + PQRSTU0SVW._SYZR41 + PQRSTU0
[T\.]_SYZR42 + O$GGQ43 + 7ijst44 + 9ST45 + ;st46 + ?s + bc +=T + @ijst(4)
That is, the TCAP score in subject j (either math or reading) for student i in school s in year t
(Aijst) is a function of prior achievement in the same subject subjsameijstA
_1- , prior achievement in the
other subject subjotherijstA
_1- , SLLA passage indicator Passi, student characteristics Xijst (gender, age
in months, black, Hispanic, eligible for the free lunch program, eligible for the reduced lunch
program, not native English speaker, immigrant status, gifted, disability, and attendance rate), the
same characteristic vectors for schools and districts (Sst and Dst) detailed above, region effects τs,
grade fixed effects ρg, year fixed effects θt, and a random error term εijst. We also check for non-
linearities by using different forms of SLLA scores (e.g., quadratic). We cluster standard errors
at the school level.17
Signaling. The signaling analysis does not limit the sample to principals taking the SLLA
prior to 2009 (form 1010). Instead, to increase power, we standardize SLLA scores within test
form (i.e., 1010, 1011, 6011) and combine across all years for which we have scores. Otherwise,
the set-up for the signaling analysis is similar to the screening analysis, except that we substitute
the standardized SLLA score for the passage indicator and add principal characteristics to the
models. The parallel regression model to Equation 2 for the TEAM, TVAAS, and TELL
outcomes is:
Nis = 40 + K)GCi41 + 9is42 + ;st43 + Oi44 + ?s + @is (5)
where Test indicates the standardized SLLA score of principal i, P contains principal
characteristics (gender, age, highest degree, black or Hispanic minority status, total years of
17 We also ran TCAP models clustering standard errors at the student level. Student-level clustering produced smaller standard errors. We provide the more conservative standard errors in the main text.
24
experience as educator in the state of Tennessee, indicators for years of experience as a principal),
and other variables are as described above. We also test for non-linearities by estimating different
forms of the SLLA scores (e.g., quadratic, categorical across different score ranges).
We also estimate a student-level achievement model similar to Equation 4 that replaces
the passage indicator with the standardized SLLA score and adds principal characteristics
(equation omitted for brevity). As with the screening analysis, for signaling models that pool
across years, we add year fixed effects and cluster standard errors at the school level. For cross-
sectional models, we cluster standard errors at the district level.
Additional Sources of Bias. In addition to the selection problem faced in the screening
analysis, there are two potential sources of bias facing our screening and signaling models. A
first potential source of bias is a non-random sorting of principals into schools (Goldhaber, 2007;
Goldhaber & Hansen, 2010). It is well documented that principals have preferences for working
in more advantaged schools, and their sorting patterns tend to reflect these preferences (e.g.,
Baker, Punswick, & Belt, 2010; Gates, Ringel, Santibañez, Guarino, Ghosh-Dastidar, & Brown,
2006; Loeb, Kalogridges, & Horng, 2010). If high-scoring principals are more likely to sort in
this way, perhaps because the skills measured by the SLLA afford them greater sorting
opportunities, estimates of the association between scores and outcomes may be affected. To
help mitigate this bias, we estimate alternatives to the main screening and signaling models that
drop the district characteristics and region fixed effects in favor of a district fixed effect. District
fixed effects control for district-level factors that may influence sorting, but it sacrifices
substantial degrees of freedom relative to the sample sizes for some of the analyses, and is an
incomplete adjustment if sorting across schools within districts is important. Results, which are
very similar to those shown in the main text, are provided in the Appendix.
25
A second potential source of bias comes from non-random attrition of principals. If
ineffective principals are more likely to exit early in their careers, our models may overestimate
the predictive power of SLLA scores. We address this potential problem by limiting our analytic
samples to principals within less than three years of experience within the Tennessee system for
some models. We also check the robustness of our findings by limiting to only first-year
principals and expanding to all principals with SLLA scores. Results from these models are
presented in the Appendix as well and are consistent with the results shown in the main text.
Patterns in SLLA Scores and Failure Rates
We first descriptively examine the personal characteristics of personnel who took the
SLLA between the 2003-04 and 2013-14 school years.18 The top part of Table 1 reports that
seventy percent of the test takers are women and less than one-quarter are nonwhite. The average
age is 38, and more than three-quarters of the test takers hold at least a master’s degree. Twenty
percent hold an education specialist degree or doctoral degree. The average test taker has 9.4
years of experience in Tennessee schools.
Table 2 displays the number of test takers matched to Tennessee personnel data by SLLA
type, the number of test takers whose scores were below a minimum qualifying score (i.e., 156
until 2008-09 and 160 from 2009-10), and the percentage of failures each year. The number of
test takers gradually increased from 292 to 1,244 for the first six years. The number substantially
declined to 788 in the 2009-10, when SLLA 1011 replaced the old version. Although the number
jumped to 1,591 next year, it fell to 782 when SLLA 6011 was introduced. It further declined to
574 in 2012-13 (numbers reported for 2013-14 are incomplete because the test score file only
included scores for administrations in the first half of the school year).
18 This descriptive analysis includes one observation per test taker. Duplicates due to multiple test administrations are dropped.
26
The number of failures and the failure rates substantially increased when SLLA form
1011 was introduced and the minimum qualifying score was raised simultaneously to 160. Prior
to these changes, the failure rate was never above 4% in any year and was as low as 0.6% in
2008-09. Of the 4,104 tests taken in this period, only 57 were below the cutoff, a failure rate of
1.4%. This very low failure rate means that very few potential principals are missing in the
screening analysis below, limiting the impact of selection bias. When the form and cut score
changed in the 2009-10 school year, the failure rate rose to 17%, the highest rate in any year. In
subsequent years, it declined somewhat and was approximately 10% in 2012-13. The average
failure rate in the later period is 14.2%.
Figure 1 displays the score distribution by test type. While the spread of the test scores is
similar between forms 1010 and 1011/6011, the average test score is clearly higher for the older
version (174.9) than the newer versions (170.3), suggesting that the test became more difficult
with the version change.19 Both the decline in the average test score and the increase in the
minimum qualifying score appear to have contributed to the substantial increase in the failure
rate.
Table 3 reports SLLA scores and the proportion of test takers who failed by their
personal and school characteristics at the time they took the test.20 We pool scores across test
types. One important pattern is that nonwhite test takers score significantly lower than their
white counterparts and thus are much less likely to pass the test. Fifteen percent of nonwhite test
19 There were also some changes in the personal and professional characteristics of the test takers between the two versions. Individuals who took the newer version are more likely to be female and white, and they tend to have less education but longer years of teaching experience. Given the pattern of correlations among these characteristics and test scores on the two test forms, it is unlikely that changes in the composition of the tested group explains the change in the distribution of scores. 20 The analysis treats multiple test scores for the same individual as independent. Although not reported, we also examined test scores and the proportion of test takers who failed for each test type and found similar patterns for forms 1011 and 6011. Patterns for form 1010 are trivial because of the very low rate of test failure.

27
takers, including multiple test takers, failed the test across years, whereas only 5% of white test
takers did so. Although not reported in Table 3, we also examined whether or not test takers
passed the exam on their first try by their characteristics. We observed the same patterns: only
80% of nonwhite test takers pass the exam on their first try, while 93% of white test takers do so.
We also found differences in scores and failure rates by gender, age, locale type, and
schools’ demographic characteristics. In particular, female test-takers substantially outscore men
and are much less likely to fail (6% vs. 10%, on average). Failure rates were also higher for test
takers older than age 40 and those in urban schools but lower for those in schools with fewer
black students and students eligible for free or reduced price lunch.
The fact that Tennessee employs the lowest SLLA cut score for licensure in the United
States permits analysis of raising the cut score on the characteristics of the licensed administrator
candidate pool, given the current distribution of scores. Figure 2 shows the distribution of test
scores for SLLA 1011/6011 by race. The dashed line is the distribution for white test takers and
the solid line is for nonwhite test takers. The leftmost vertical line shows the state’s current
minimum qualifying score set at 160 points. The second vertical line indicates a score of 163
points, which is an ETS’s recommended score and the one used by many states, including, as of
2014, neighboring states Missouri and Arkansas. The last vertical line displays the cut score used
by Mississippi—also a neighbor of Tennessee—which sets its cut score at 169 points, the highest
of any state. The figure shows that the score distribution for whites is significantly to the right of
that for nonwhites. As a result, raising the minimum qualifying score would fail more nonwhite
test takers and substantially widen the racial gap in the failure rate. If the minimum qualifying
score in Tennessee was raised to 163, the failure rate among nonwhite test takers would increase
to 39%, whereas among white test takers it would rise to only 15%, a gap of 24 percentage points.
28
If the score was further lifted to 169, the gap would become 32 percentage points (65% for
nonwhites and 33% for whites).
To investigate determinants of test failures controlling for other factors, we estimated a
series of logistic regression models for binary passage or failure. Table 4 shows the results, with
coefficients as odds ratios. Model 1 includes test takers’ characteristics only. We add school
characteristics in Model 2 and district characteristics in Model 3. Model 4 adds region indicators,
and Model 5 adds administrator preparation program indicators.21
Even after controlling for numerous other factors, the main result from Table 3 holds:
nonwhite test takers fail at substantially higher rates. In the most saturated model, on average, the
odds that a nonwhite test taker fails the exam are approximately four times larger than the odds
for their white counterparts. Adjusting for other variables, the predicted failure rate—calculated
from column 5—for nonwhite test takers is 18%, compared to 6% for white test takers.
Other results from the bivariate analyses are similar in the multivariate context as well. In
particular, female and younger test takers are less likely to fail. In addition, failure is more likely
among test takers working in schools with larger numbers of black and Hispanic students and in
districts with larger numbers of low-income students.
School Leader Hiring
We now turn to whether SLLA scores are associated with time to future hiring as a
school leader. We estimated a series of Cox proportional hazard models based on Equation 2 for
personnel receiving administrator licenses. Because many principal candidates start their school
administration careers as assistant principals, we also estimated the same models for being hired
as assistant principals, and also for becoming any kind of school leader, i.e., becoming either a
21 We also ran versions of the models shown in Column 5 limiting the sample to principals completing preparation programs in Tennessee. The results were virtually identical.
29
principal or assistant principal. Table 5 reports the results for being hired as a principal (Models
1 and 2), as an assistant principal (Models 3 and 4), and as either kind of school administrator
(Models 5 and 6), with coefficients shown as hazard ratios.
SLLA scores are positively associated with being hired as a school principal, as an
assistant principal, and as a school administrator.22 In each even-numbered model, the hazard
ratio is greater than 1 at the 0.01 level (ranging from 1.3 to 1.4), suggesting that higher scorers
are at substantially higher “risk” of being hired each year following licensure. We also find some
evidence of non-linearities in the association, with candidates scoring 169 or above generally
showing much higher hazard ratios than lower scorers.
The SLLA as a Performance Screen
Next, we examine whether the SLLA serves as a performance screen for beginning
principals. Here, our analytic sample changes from test takers (principal candidates) to current
principals with SLLA scores. The bottom half of Table 1 reports characteristics of current
principals. Just over half of the principals are female and the average age is 50. Only 18% of the
principals are nonwhite. Because TDOE requires a completion of school administrator
preparation program, which usually comes with a master’s degree in school administration,
almost all of the principals have at least a Master’s degree, and 44% of them have an education
specialist degree or doctoral degree. Average years of principal experience in the sample is
relatively short, with 54% of them being in their first five years, a function of the fact that our
22 In this analysis, the analytic sample includes principal candidates who are not in any school administrative position yet and those who already work as assistant principals. We narrowed the sample to the latter group of candidates and estimated competing risk models (i.e., cumulative incidence functions with becoming a principal as an event of interest and turnover as a competing risk) with different forms of the SLLA scores (results not reported). We found stronger evidence that SLLA scores predict future hiring as a school principal and that assistant principals with higher SLLA scores are much more likely to be hired as principals.
30
sample is limited to principals with SLLA scores, which have only been required for licensure
since the 2003-04 school year.
If the exam sifts principal candidates and fails only those with weak potential for high
future performance, passing the exam should predict principals’ job performance, and raising the
minimum qualifying score should magnify the screening effects. Besides the current cut score of
160, we investigate 163 (ETS’s recommended minimum) and 169 (the highest cut score
currently employed by any state) as hypothetical minimum qualifying scores as well. We
estimated three regression models with different qualifying score based on Equation 3 for each
outcome for principals in the first three years of the principal career. Table 6 shows results. As
discussed in the Methods section, this analysis focuses on SLLA form 1010.23
Table 6 finds little evidence that the SLLA serves as an effective performance screen at
any of the cut scores. For the TEAM models, in no case do those passing the hypothetical cut
score receive significantly higher evaluation ratings, even when the three years of evaluation
ratings are pooled, and in several cases, the coefficients are negative. Momentarily setting
concerns about statistical power aside, taken at face value, Model 4 would suggest that test takers
scoring at least 160 received subjective evaluation ratings nearly a third of a standard deviation
higher in than those who scored lower in 2013, but the prior year scored 0.1 standard deviation
lower than that group. A similar inconsistency is evident for TELL, where, power aside, those
passing through the three hypothetical screens are rated lower by teachers and assistant
principals more often than they are rated higher. All three coefficients for the TVAAS models
are negative. For TCAP, no coefficients are substantively meaningful, and in fact the coefficients
in the reading models are all negative. 23 As a sensitivity check, we also estimated the screening models for 1011/6011. Although we could not estimate some models due to small sample sizes, we found no evidence of significant screening effects except in the TCAP models, which showed negative signs.
31
Because of the size of the standard errors in Table 6, we caution against over-interpreting
the pattern of null results. The 95% confidence intervals (CIs) for many of the estimates include
potentially substantively meaningful values (see Appendix Figure 1 for an illustration).24 Taking
the 163 cut score as an example, the 95% CI for the pooled TEAM model ranges from -0.22 to
0.40; a true difference in TEAM rating between passers and non-passers of 0.40 s.d. would be
quite substantial, as would the 0.43 s.d. difference in TELL teacher survey ratings and 0.34 s.d.
in TVAAS at the upper CI bounds of those estimates.25 Thus, although the point estimates from
these models generally are wrong-signed or positive but substantively small, statistical
imprecision means that we cannot rule out the possibility that larger samples might show results
more consistent with the expectation that the SLLA is an effective performance screen.
As a robustness check, we also estimated the same models for 1st year principals and all
principals and found similar results, with hypothetical SLLA passage associated with negative
outcomes approximately as often as positive outcomes (see Appendix Tables 1 and 2). Appendix
Table 3 shows results for models substituting district fixed effects for district covariates. These
models suggest that the 160 cut score is associated with higher TEAM ratings in 2012 but not in
other years, and the pooled TEAM models show substantively trivial coefficients for all cut
scores. TELL and TVAAS coefficients are all negative, as are five of the six TCAP coefficients.
Again, little evidence is consistent with the idea that the SLLA is useful as a performance
screen.26
24Likely because of the small number of test takers who fail to attain a score of 160, the CIs for the 160 cut score coefficients are particularly large.25The upper CI bounds for the 169 cut score estimates are systematically are closer to 0 and in several cases do exclude substantively meaningful values. 26 In addition, we re-estimated the main screening models for principals without prior experience as an assistant principal because of concerns that accumulating school leadership experience may mask the true screening effectiveness of the SLLA. Pooled results for TEAM, TCAP, and TELL teacher and principal responses are all similar to Table 6. The 163 cut score is positive and significant for TVAAS; the others are nonsignificant though negative. The AP TELL rating is positively associated with the 160 cut score only.
32
The SLLA as a Signal of Future Job Performance
Table 7 displays the signaling analysis results for principals in the first three years of
their careers. 27 Positive coefficients indicate that, among those hired into principal positions,
higher SLLA scores are associated with more positive measures of job performance.
For TEAM evaluations (Models 1 and 2), the SLLA coefficient is positive for two years
and negative for the other; in all three cases, the coefficient is small, with a 1-s.d. increase in
SLLA score associated with less than a 0.1 s.d. difference in TEAM subjective ratings. In the
pooled model (Model 4), the correlation is similarly very small and not statistically different
from zero. Similarly, none of the SLLA coefficients in the three TELL models are statistically
significant, and, in fact, all three are negative (Models 6–8). For TVAAS, the coefficient is
negative and significant at the 0.05 level (β = -0.13). For TCAP, the coefficients are both
precisely estimated zeros. In fact, 95% CIs on each coefficient in Table 7 generally suggest we
can rule out substantively meaningful values (see Appendix Figure 2). In sum, the SLLA seems
to have little signaling value in these models.
As a check on these results, we again estimated models for first-year principals only and
for all principals (see Appendix Table 4). The patterns are similar to those shown in Table 7. We
also re-estimated the main models with district fixed effects (Appendix Table 5). Here the pooled
TEAM model shows some small evidence of signaling, with principals within the same district
scoring 1 s.d. higher on the SLLA receiving TEAM ratings approximately 0.08 s.d. higher than
average scorers in the same district. Yet the table also shows a negative and significant signal for
TVAAS and negative (though statistically insignificant) signals for all three TELL ratings, as
27 We again combine test scores across all test types. As a sensitivity check, we estimated our models with test scores on SLLA 1010 only but found the same patterns. Because we observe outcome measures for so few principals with the other test types (i.e., 1011/6011), we did not estimate separate models with those scores.

33
well as precise zeros for TCAP. We interpret this evidence as consistent with the findings in
Table 7.28
Finding little evidence of a linear relationship between SLLA scores and a principal’s
later job performance, we also tested for possible nonlinear relationships, estimating models with
(a) a quadratic term, (b) SLLA scores entered as indicators for quartiles, and (c) SLLA scores
entered as indicator variables for being between 163 and 168 (that is, between the ETS
recommended cut score and the high cut score set by Mississippi) and being above 169. Because
the conclusions were similar across each of these approaches, we show only the results for (c).
Results are shown in Table 8; results with district fixed effects are shown in Appendix Table 5.
The findings are very similar to those in Table 7 and cast further doubt on the signaling value of
the SLLA. Across principal outcomes, in no case is either of the higher test score groups
statistically distinguishable from the lowest group, and often (e.g., 2012 TEAM evaluation
ratings, the teacher TELL ratings) the signs for both indicator variables are negative, suggesting
that, if anything, the lowest scoring SLLA group outperforms the higher scorers.
The SLLA and Assistant Principals’ Job Performance
Our signaling and screening analyses so far have focused on beginning principals. Many
principal candidates enter school leadership as assistant principals, however, and it is possible
that the SLLA serves a screening or signaling function for these leaders. To investigate this
possibility, we re-estimated the same screening and signaling models for assistant principals’
TEAM evaluation ratings for 2012, 2013, and 2014, plus a pooled model. TEAM evaluation
ratings (assigned by building principals) are the only assistant principal-specific job performance
measures available in the data.
28 Signaling results for principals with no AP experience are virtually identical to the results shown in Table 7.
34
Panel A in Table 9 reports results for the screening analysis, and Panel B shows results
for the signaling analysis. Panel A shows some positive evidence of screening in 2012 and (for
the lowest cut score) in 2014. No coefficients in the pooled model are statistically significant,
though the coefficient for the 160 cut score is just outside the 90% confidence interval and is
substantively meaningful, with scorers passing the screen rated approximately half a standard
deviation higher than other assistant principals. Panel B shows some signaling evidence as well,
with SLLA scores statistically positively correlated with TEAM ratings in two of three years and
in the combined model. In the latter case, each 1 s.d. increase in SLLA score is associated with
about 0.1 s.d. higher TEAM rating for assistant principals. Although not shown, results for
models with district fixed effects generally are similar.
Principal Turnover Analysis
Our final analysis examines whether SLLA score is associated with principal turnover.
We define principal turnover as the event that a principal leaves a district, exits the state
education system, or takes a position other than principal. The logic behind this analysis is that
even if SLLA scores do not reliably predict other job performance outcomes, the SLLA score
still may be useful to school districts seeking to increase stability in the principal workforce if it
helps identify which principals are more likely to stay in the district once hired.
We estimate three Cox proportional hazard models based on Equation 2 with SLLA
scores entered different ways.29 Table 10 reports the results with coefficients transformed into
hazard ratios. The first two models show no evidence that SLLA scores predict turnover. The
29 These models are based on form 1010. Sample sizes for form 1011/6011 are very small in this analysis.
35
third model shows evidence that high scorers are, in fact, more likely than low scorers to leave
the district.30
Discussion and Conclusions
As the demand for effective school leadership increases, state policymakers and district
leaders need fair and accurate tools for identifying future effective leaders. Presumably, such
tools could be used to help ensure that all new principals or assistant principals have a minimal
level of competency—the goal of leadership licensure systems—or to assist with meeting key
human capital needs, such as getting the most effective principals into the schools that need them
most. We assess the potential for a widely used standardized leadership instrument, the SLLA,
employed as a component of many states’ administrator licensure systems to provide leverage in
screening less competent leadership candidates or signaling their future performance. A strength
of the analysis is that we examine performance using multiple measures utilized for principal
evaluation and accountability in Tennessee and others states. We also document differences in
scores by the characteristics of leadership candidates and the schools they work in at the time
they take the SLLA and whether candidates’ SLLA scores are informative about their labor
market outcomes, including the likelihood they are hired into an administrative position and,
conditional on being hired, whether they stay in those positions.
We uncover two main results. First, nonwhite candidates perform systematically worse
than their white counterparts on the SLLA, which translates into substantially higher failure rates.
This result is similar to one observed for teacher licensure examinations (e.g., Anrig et al., 1986;
Cole, 1986; Epstein, 2005; Gitomer et al., 1999; Goldhaber & Hansen, 2010). This finding—that
failure rates among nonwhite candidates are approximately three times as high as for their white 30 We also estimated the same models by redefining principal turnover as the event that a principal does not return to his/her school next year as a principal. We find no evidence that SLLA scores predict this type of turnover, either linearly or non-linearly.
36
colleagues—suggests that failure to obtain the required cut score may be an important barrier to
increasing racial and ethnic diversity in a principal workforce that is overwhelmingly white. In
Tennessee, as of 2013, nonwhites make up approximately 30% of the student enrollment but
only about 20% of those in principal positions. Our results raise concerns that use of the SLLA
as part of the principal licensure process may be inconsistent with leadership diversity goals. We
also find evidence of other gaps in scores and failure rates by demographic characteristics, such
as a relatively large gap between male and female test takers, but this gap likely is less
concerning from a policy perspective because the group historically underrepresented in the
principalship—women—are not the group disadvantaged by the test.
Discrepancies in scores and passage rates across demographic groups may be justifiable
if in fact the SLLA is successful at identifying competent or effective candidates for school
leadership positions. We do find that high scorers are more likely to be hired as school leaders,
which suggests that the SLLA is related to factors districts are looking for in principal selection,
including, presumably, factors the district thinks are important for job performance. Our analysis
of possible screening and signaling functions of the SLLA, however, calls into question the
utility of the instrument for identification purposes. In our second main result, we find that,
across a variety of job outcomes, numerous specifications, and different samples of principals by
level of experience, neither surpassing the SLLA cut score nor obtaining a higher score on the
exam serves as a useful predictor of future job performance in our samples. SLLA measures are
rarely statistically positively associated with outcomes, and scores and outcomes are in fact more
often negatively correlated, though both cases the correlations typically are substantively
unimportant. Although low statistical power in several of the screening models means that we
cannot rule out the possibility that the SLLA indeed screens out principal candidates with
37
meaningfully lower future job performance, the signaling models estimate relatively precise null
(or negative) coefficients. In short, if the goal for the state or district is to license or select school
leaders whose job performance will be high as measured by the indicators chosen as part of the
state’s own performance evaluation system, such as supervisor ratings or test score growth, or by
low-stakes measures, such as teachers’ survey assessments, the evidence here does not support
the conclusion that SLLA scores are useful for meeting these objectives.
One caveat to these results is that we find some evidence that the SLLA might be useful
as a screen or signal for assistant principal job performance. Although we only have one job
performance measure for assistant principals in the data set, and the SLLA does not predict this
outcome in every year, the results provide suggestive evidence of usefulness of the SLLA for this
group that deserves further attention.
It is unclear why the SLLA fails to predict potential job performance measures for
building principals. Perhaps the ISLLC standards on which they are based do not accurately
specify the knowledge and skills required for successful building leadership. Perhaps they are the
right standards, but the SLLA does not capture competency on these standards well. Perhaps the
standards are correct and the SLLA is an adequate test of the standards, but simply knowing a
principal’s skills and knowledge prior to hire does not tell us much about how the principal
enacts leadership in his or her school once in the job. In any of these cases, policymakers would
need to take a hard look at continued usage of the SLLA as a condition of principal licensure.
Or perhaps the measures of job performance employed here, regardless of their relevance
for principal evaluation, accountability, and other decision-making, are not in fact reliable or
valid performance measures. Measurement error in these variables would reduce the likelihood
of finding a correlation with SLLA scores, even if the test was a good predictor of actual

38
performance on-the-job. This criticism clearly is important for measures based on student test
scores (Grissom, Kalogrides, & Loeb, 2015) but may be relevant for other outcomes as well. If
the null relationship between SLLA score and the other measures lies here, we should not be so
quick to dismiss the usefulness of the instrument, particularly given evidence from the hiring
analysis that districts may respond to the competencies the test measures in choosing new
principals and assistant principals. That is, it could be that the SLLA helps districts identify
school leaders who are prepared to be successful in areas of the work not captured well by the
performance measures used in this study. In addition, we cannot be sure that patterns of sorting
and unobserved heterogeneity in principal candidate quality across districts do not serve to
attenuate the correlation between licensure scores and future outcomes. Also, for the screening
analysis in particular, interpretation of the results is tempered not only by the aforementioned
power concerns but by the potential for selection bias from the fact that we do not observe later
performance outcomes for the lowest scoring test takers, though this number is relatively small
given Tennessee’s low cut score.
In other words, we might interpret the study’s evidence as clear on the point that SLLA
scores and passage rates differ by some key, policy-relevant principal candidate characteristics,
such as race and ethnicity, and not in support of the idea that scores are useful for most screening
or signaling purposes examined here, but with several caveats. States considering the utility of
continued use of the SLLA in their licensure processes would need to weigh the apparent costs to
the composition of the principal candidate pool against the possibility that additional research
might uncover benefits of the assessment not observed here.
To this point, this line of research would benefit from replication of our results with
other data sets in other states. Although we are advantaged by access to score histories for a large
39
number of principals over roughly a ten-year time period and to a variety of job performance
measures, our screening and signaling analyses are limited by the fact that some of these
measures are only available for single years. Additional years of data or larger samples of
principals may provide additional power. Adding years of data would also allow us to assess
more fully whether scores on the more recent forms of the SLLA (1011/6011) have more power
to predict later principal outcomes, an analysis limited in this study by the relatively small
number principal candidates taking these new versions who have to this point advanced to school
leadership positions.
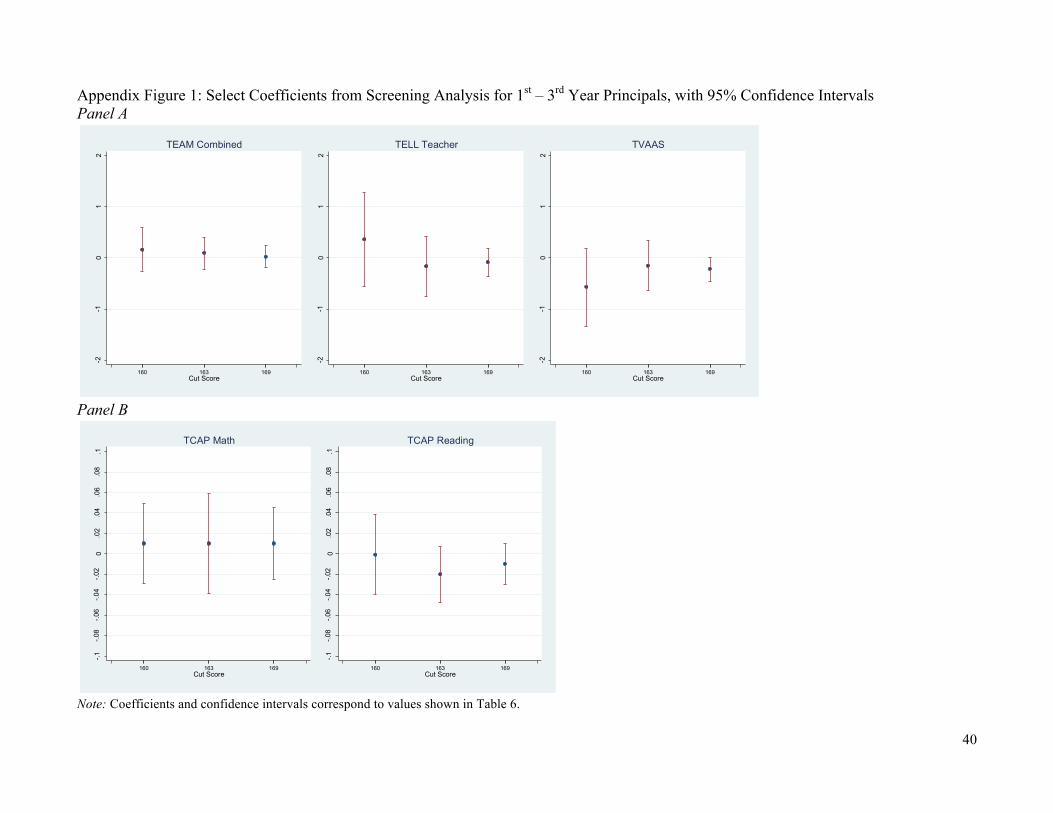
40
Appendix Figure 1: Select Coefficients from Screening Analysis for 1st – 3rd Year Principals, with 95% Confidence Intervals Panel A
Panel B
Note: Coefficients and confidence intervals correspond to values shown in Table 6.
-2-1
01
2
160 163 169Cut Score
TEAM Combined
-2-1
01
2
160 163 169Cut Score
TELL Teacher
-2-1
01
2
160 163 169Cut Score
TVAAS
-.1-.0
8-.0
6-.0
4-.0
20
.02
.04
.06
.08
.1
160 163 169Cut Score
TCAP Math
-.1-.0
8-.0
6-.0
4-.0
20
.02
.04
.06
.08
.1
160 163 169Cut Score
TCAP Reading
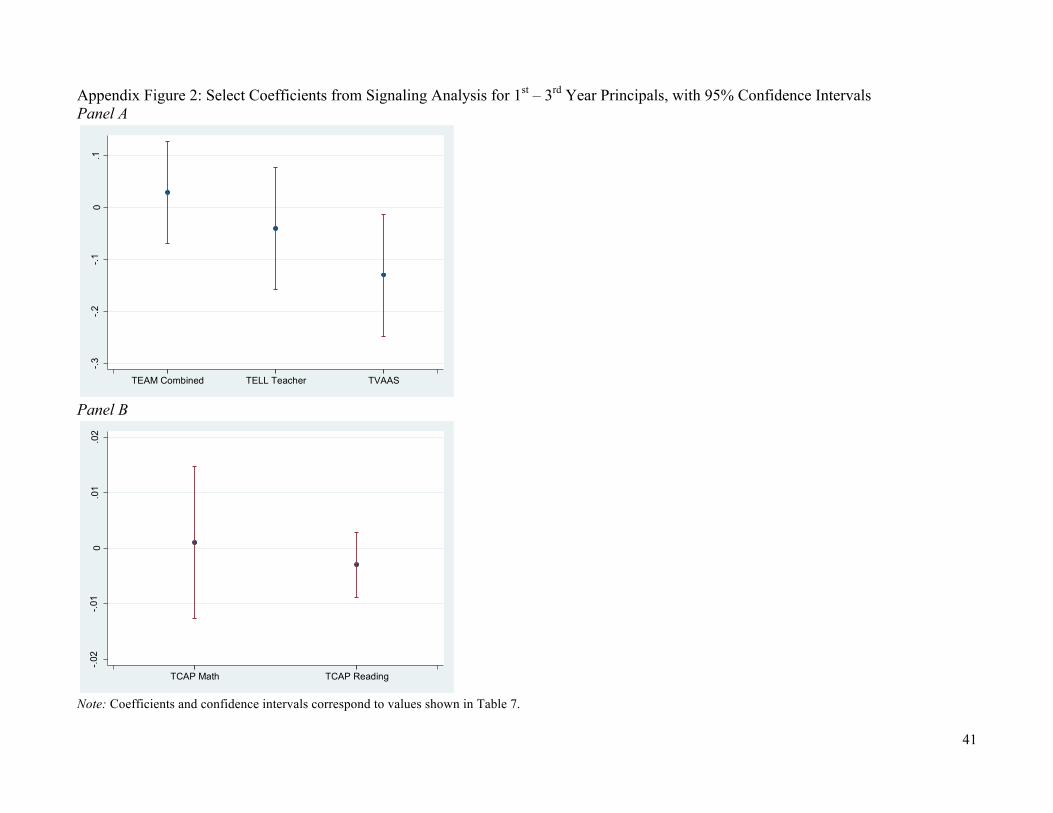
41
Appendix Figure 2: Select Coefficients from Signaling Analysis for 1st – 3rd Year Principals, with 95% Confidence Intervals Panel A
Panel B
Note: Coefficients and confidence intervals correspond to values shown in Table 7.
-.3-.2
-.10
.1
TEAM Combined TELL Teacher TVAAS
-.02
-.01
0.0
1.0
2
TCAP Math TCAP Reading
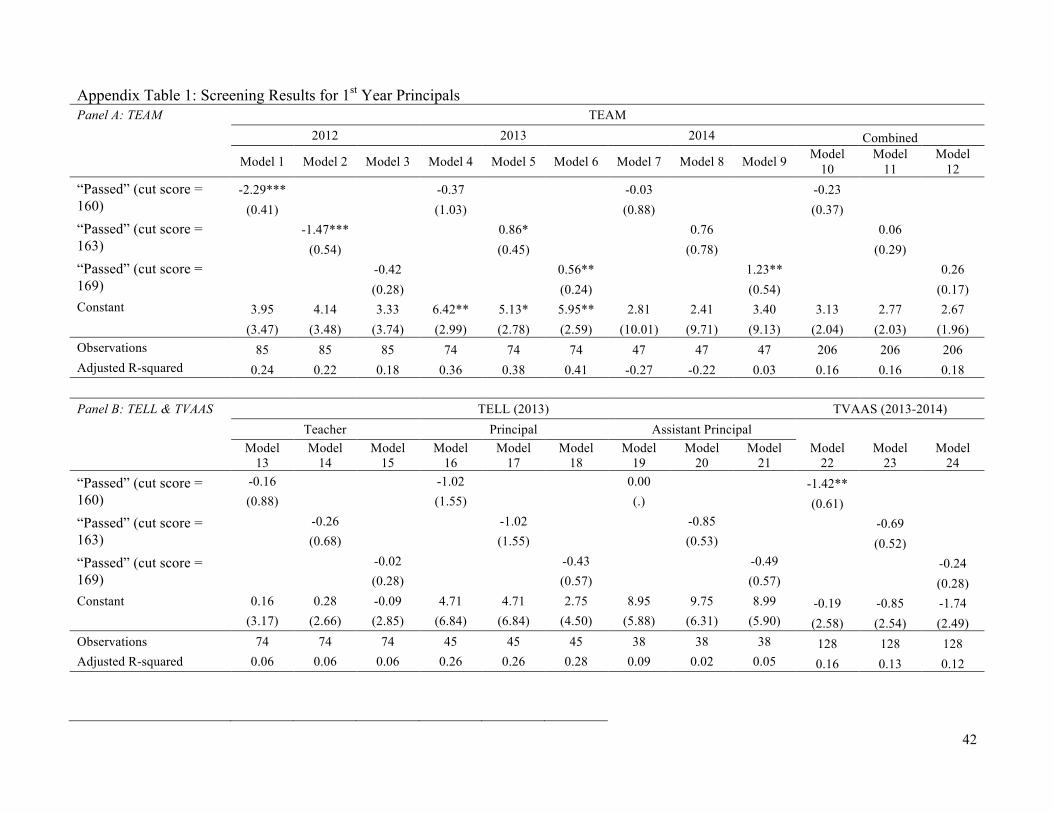
42
Appendix Table 1: Screening Results for 1st Year Principals Panel A: TEAM TEAM
2012 2013 2014 Combined
Model 1 Model 2 Model 3 Model 4 Model 5 Model 6 Model 7 Model 8 Model 9 Model 10
Model 11
Model 12
“Passed” (cut score = 160)
-2.29***
-0.37
-0.03
-0.23 (0.41)
(1.03)
(0.88)
(0.37)
“Passed” (cut score = 163)
-1.47***
0.86*
0.76
0.06
(0.54)
(0.45)
(0.78)
(0.29)
“Passed” (cut score = 169)
-0.42
0.56**
1.23**
0.26
(0.28)
(0.24)
(0.54)
(0.17)
Constant 3.95 4.14 3.33 6.42** 5.13* 5.95** 2.81 2.41 3.40 3.13 2.77 2.67 (3.47) (3.48) (3.74) (2.99) (2.78) (2.59) (10.01) (9.71) (9.13) (2.04) (2.03) (1.96) Observations 85 85 85 74 74 74 47 47 47 206 206 206 Adjusted R-squared 0.24 0.22 0.18 0.36 0.38 0.41 -0.27 -0.22 0.03 0.16 0.16 0.18 Panel B: TELL & TVAAS TELL (2013) TVAAS (2013-2014)
Teacher Principal Assistant Principal Model
13 Model
14 Model
15 Model
16 Model
17 Model
18 Model
19 Model
20 Model
21 Model
22 Model
23 Model
24 “Passed” (cut score = 160)
-0.16 -1.02 0.00 -1.42** (0.88) (1.55) (.) (0.61) “Passed” (cut score =
163) -0.26 -1.02 -0.85
-0.69
(0.68) (1.55) (0.53)
(0.52)
“Passed” (cut score = 169)
-0.02 -0.43 -0.49
-0.24
(0.28) (0.57) (0.57)
(0.28) Constant 0.16 0.28 -0.09 4.71 4.71 2.75 8.95 9.75 8.99 -0.19 -0.85 -1.74 (3.17) (2.66) (2.85) (6.84) (6.84) (4.50) (5.88) (6.31) (5.90) (2.58) (2.54) (2.49) Observations 74 74 74 45 45 45 38 38 38 128 128 128 Adjusted R-squared 0.06 0.06 0.06 0.26 0.26 0.28 0.09 0.02 0.05 0.16 0.13 0.12

43
Panel C: TCAP TCAP (2008-2014)
Math Reading Model
25 Model
26 Model
27 Model
28 Model
29 Model
30 “Passed” (cut score = 160) 0.08 -0.01
(0.08) (0.04) “Passed” (cut score = 163) -0.00 -0.06***
(0.05) (0.02) “Passed” (cut score = 169) 0.03 -0.02
(0.02) (0.01) Constant -1.74*** -1.70*** -1.71*** -0.76* -0.66 -0.76* (0.57) (0.60) (0.58) (0.43) (0.44) (0.43) Observations 104677 104677 104677 104677 104677 104677 Adjusted R-squared 0.63 0.63 0.63 0.69 0.69 0.69
Notes: Analysis is based on test scores from SLLA 1010 only, which was required until 2008-09. The sample includes first year principals. All outcome variables are standardized. The TCAP analysis uses test scores for 3rd to 8th graders. All models include school characteristics, district characteristics, and region fixed effects. Models 10 to 12 and 22 to 24 include year fixed effects. The student growth models add student characteristics and grade fixed effects. Standard errors shown in parentheses are clustered at the district level in cross-sectional models and at the school level when multiple years of data are used. * p<0.10, ** p<0.05, *** p<0.01
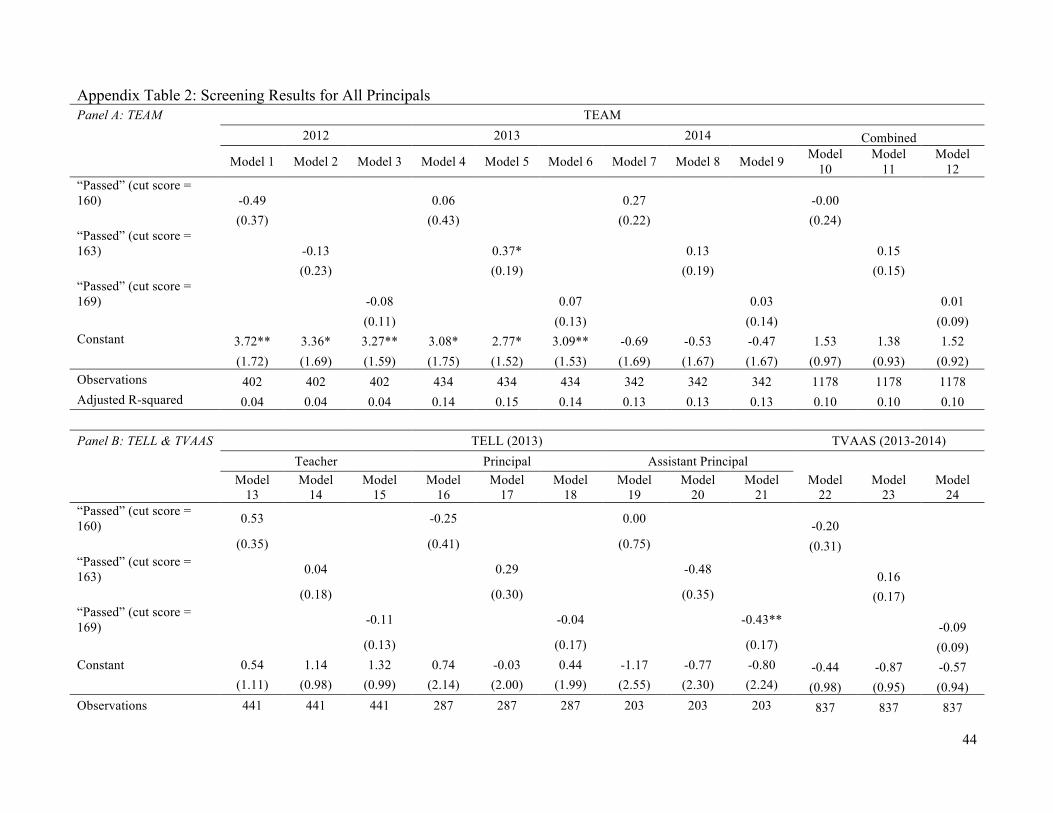
44
Appendix Table 2: Screening Results for All Principals Panel A: TEAM TEAM
2012 2013 2014 Combined
Model 1 Model 2 Model 3 Model 4 Model 5 Model 6 Model 7 Model 8 Model 9 Model 10
Model 11
Model 12
“Passed” (cut score = 160) -0.49
0.06
0.27
-0.00
(0.37)
(0.43)
(0.22)
(0.24) “Passed” (cut score =
163)
-0.13
0.37*
0.13
0.15
(0.23)
(0.19)
(0.19)
(0.15)
“Passed” (cut score = 169)
-0.08
0.07
0.03
0.01
(0.11)
(0.13)
(0.14)
(0.09) Constant 3.72** 3.36* 3.27** 3.08* 2.77* 3.09** -0.69 -0.53 -0.47 1.53 1.38 1.52 (1.72) (1.69) (1.59) (1.75) (1.52) (1.53) (1.69) (1.67) (1.67) (0.97) (0.93) (0.92) Observations 402 402 402 434 434 434 342 342 342 1178 1178 1178 Adjusted R-squared 0.04 0.04 0.04 0.14 0.15 0.14 0.13 0.13 0.13 0.10 0.10 0.10 Panel B: TELL & TVAAS TELL (2013) TVAAS (2013-2014)
Teacher Principal Assistant Principal Model
13 Model
14 Model
15 Model
16 Model
17 Model
18 Model
19 Model
20 Model
21 Model
22 Model
23 Model
24 “Passed” (cut score = 160) 0.53 -0.25 0.00 -0.20
(0.35) (0.41) (0.75) (0.31)
“Passed” (cut score = 163) 0.04 0.29 -0.48
0.16
(0.18) (0.30) (0.35)
(0.17)
“Passed” (cut score = 169) -0.11 -0.04 -0.43**
-0.09
(0.13) (0.17) (0.17)
(0.09) Constant 0.54 1.14 1.32 0.74 -0.03 0.44 -1.17 -0.77 -0.80 -0.44 -0.87 -0.57 (1.11) (0.98) (0.99) (2.14) (2.00) (1.99) (2.55) (2.30) (2.24) (0.98) (0.95) (0.94) Observations 441 441 441 287 287 287 203 203 203 837 837 837
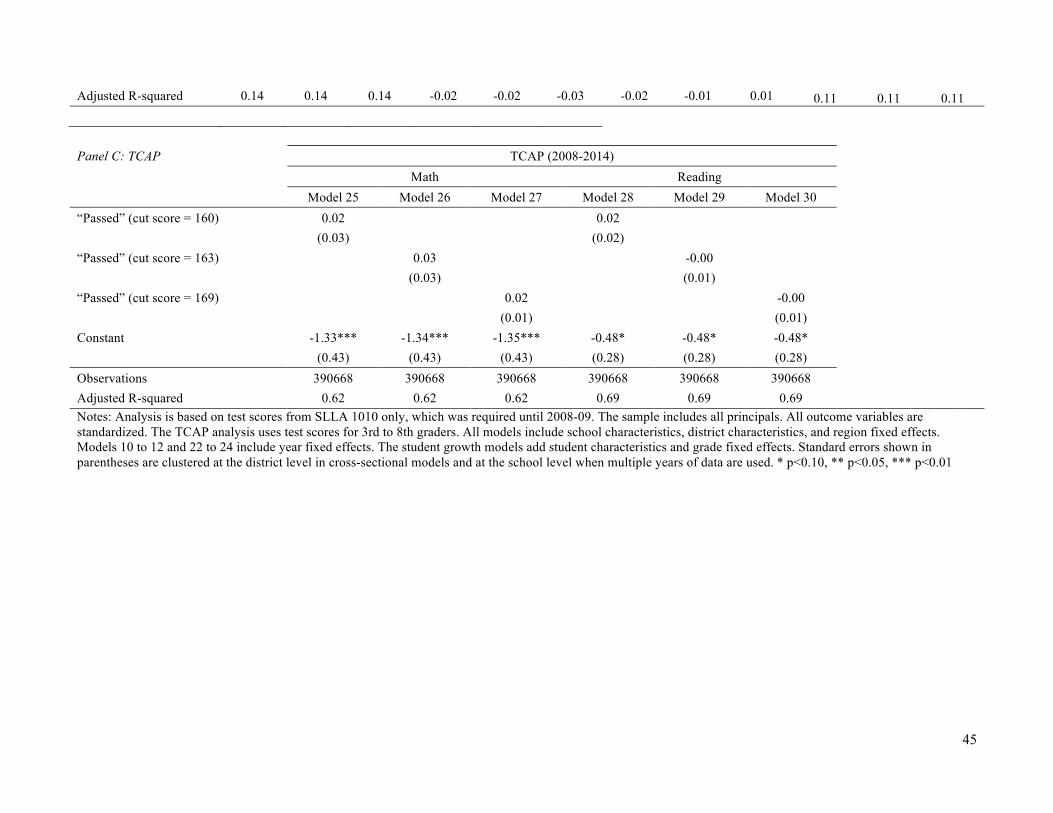
45
Adjusted R-squared 0.14 0.14 0.14 -0.02 -0.02 -0.03 -0.02 -0.01 0.01 0.11 0.11 0.11
Panel C: TCAP TCAP (2008-2014)
Math Reading
Model 25 Model 26 Model 27 Model 28 Model 29 Model 30 “Passed” (cut score = 160) 0.02 0.02
(0.03) (0.02) “Passed” (cut score = 163) 0.03 -0.00
(0.03) (0.01) “Passed” (cut score = 169) 0.02 -0.00
(0.01) (0.01) Constant -1.33*** -1.34*** -1.35*** -0.48* -0.48* -0.48* (0.43) (0.43) (0.43) (0.28) (0.28) (0.28) Observations 390668 390668 390668 390668 390668 390668 Adjusted R-squared 0.62 0.62 0.62 0.69 0.69 0.69
Notes: Analysis is based on test scores from SLLA 1010 only, which was required until 2008-09. The sample includes all principals. All outcome variables are standardized. The TCAP analysis uses test scores for 3rd to 8th graders. All models include school characteristics, district characteristics, and region fixed effects. Models 10 to 12 and 22 to 24 include year fixed effects. The student growth models add student characteristics and grade fixed effects. Standard errors shown in parentheses are clustered at the district level in cross-sectional models and at the school level when multiple years of data are used. * p<0.10, ** p<0.05, *** p<0.01
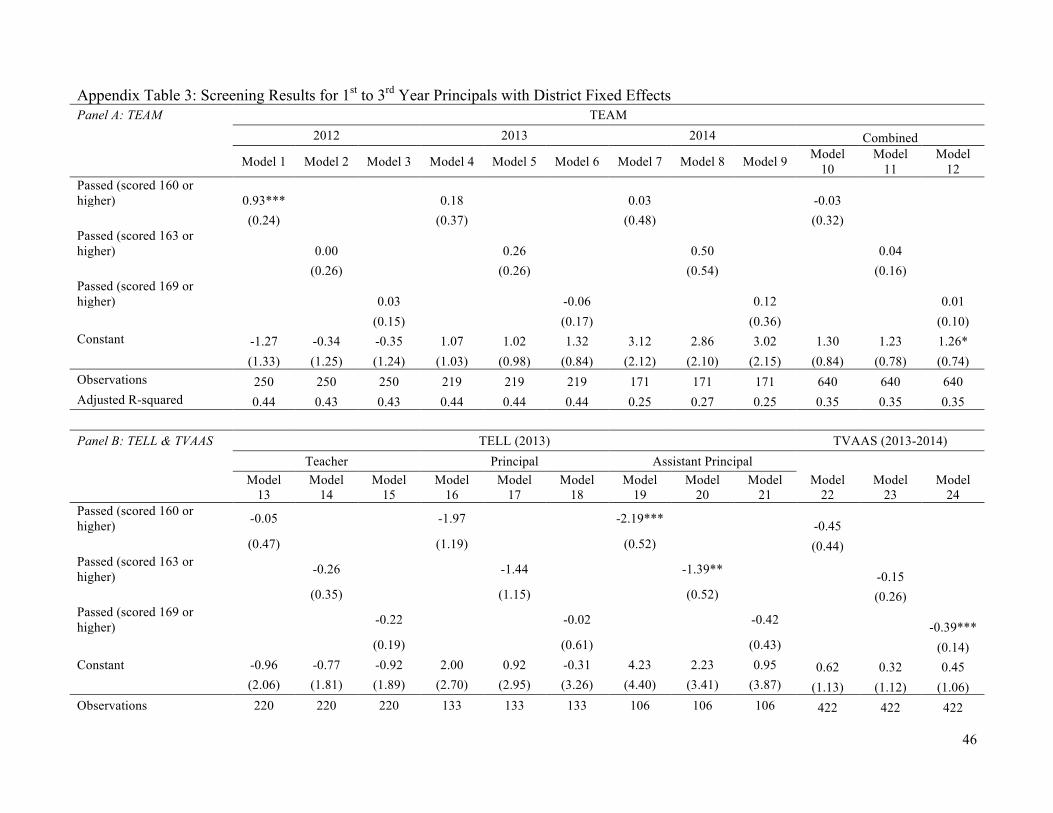
46
Appendix Table 3: Screening Results for 1st to 3rd Year Principals with District Fixed Effects Panel A: TEAM TEAM
2012 2013 2014 Combined
Model 1 Model 2 Model 3 Model 4 Model 5 Model 6 Model 7 Model 8 Model 9 Model 10
Model 11
Model 12
Passed (scored 160 or higher) 0.93***
0.18
0.03
-0.03
(0.24)
(0.37)
(0.48)
(0.32)
Passed (scored 163 or higher)
0.00
0.26
0.50
0.04
(0.26)
(0.26)
(0.54)
(0.16)
Passed (scored 169 or higher)
0.03
-0.06
0.12
0.01
(0.15)
(0.17)
(0.36)
(0.10) Constant -1.27 -0.34 -0.35 1.07 1.02 1.32 3.12 2.86 3.02 1.30 1.23 1.26* (1.33) (1.25) (1.24) (1.03) (0.98) (0.84) (2.12) (2.10) (2.15) (0.84) (0.78) (0.74) Observations 250 250 250 219 219 219 171 171 171 640 640 640 Adjusted R-squared 0.44 0.43 0.43 0.44 0.44 0.44 0.25 0.27 0.25 0.35 0.35 0.35 Panel B: TELL & TVAAS TELL (2013) TVAAS (2013-2014)
Teacher Principal Assistant Principal Model
13 Model
14 Model
15 Model
16 Model
17 Model
18 Model
19 Model
20 Model
21 Model
22 Model
23 Model
24 Passed (scored 160 or higher) -0.05 -1.97 -2.19*** -0.45
(0.47) (1.19) (0.52) (0.44)
Passed (scored 163 or higher) -0.26 -1.44 -1.39**
-0.15
(0.35) (1.15) (0.52)
(0.26)
Passed (scored 169 or higher) -0.22 -0.02 -0.42
-0.39***
(0.19) (0.61) (0.43)
(0.14) Constant -0.96 -0.77 -0.92 2.00 0.92 -0.31 4.23 2.23 0.95 0.62 0.32 0.45 (2.06) (1.81) (1.89) (2.70) (2.95) (3.26) (4.40) (3.41) (3.87) (1.13) (1.12) (1.06) Observations 220 220 220 133 133 133 106 106 106 422 422 422
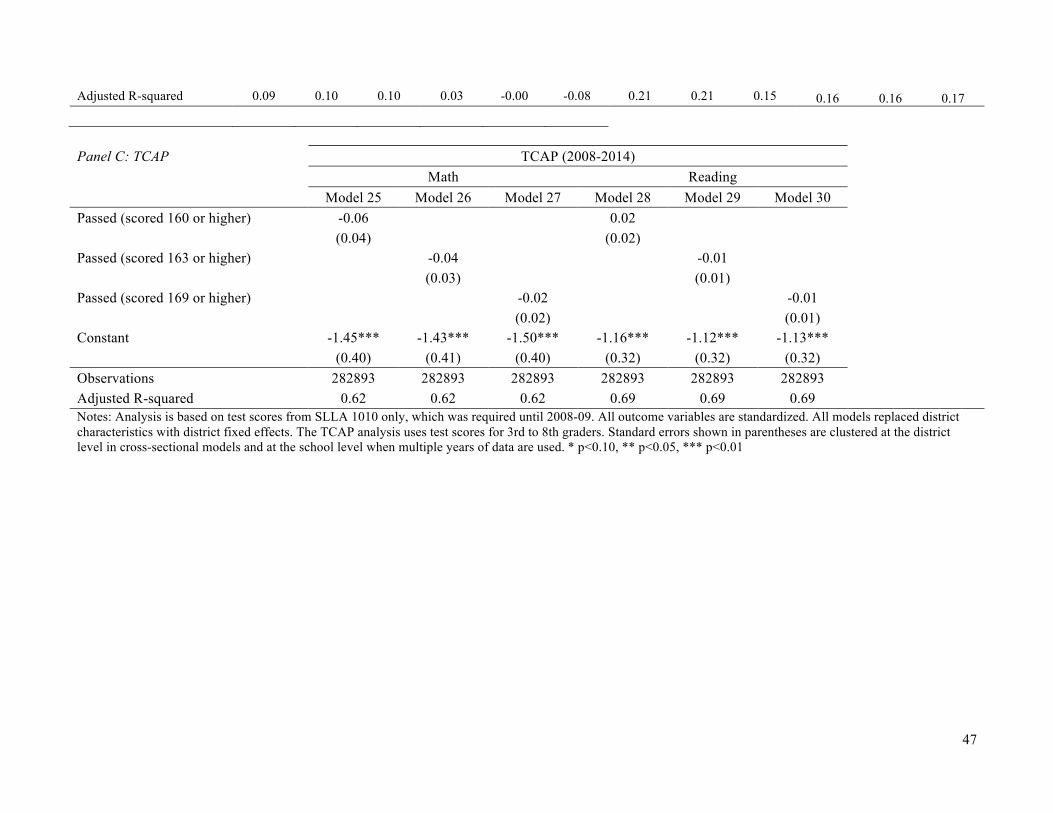
47
Adjusted R-squared 0.09 0.10 0.10 0.03 -0.00 -0.08 0.21 0.21 0.15 0.16 0.16 0.17
Panel C: TCAP TCAP (2008-2014)
Math Reading
Model 25 Model 26 Model 27 Model 28 Model 29 Model 30 Passed (scored 160 or higher) -0.06 0.02
(0.04) (0.02) Passed (scored 163 or higher) -0.04 -0.01
(0.03) (0.01) Passed (scored 169 or higher) -0.02 -0.01
(0.02) (0.01) Constant -1.45*** -1.43*** -1.50*** -1.16*** -1.12*** -1.13*** (0.40) (0.41) (0.40) (0.32) (0.32) (0.32) Observations 282893 282893 282893 282893 282893 282893 Adjusted R-squared 0.62 0.62 0.62 0.69 0.69 0.69
Notes: Analysis is based on test scores from SLLA 1010 only, which was required until 2008-09. All outcome variables are standardized. All models replaced district characteristics with district fixed effects. The TCAP analysis uses test scores for 3rd to 8th graders. Standard errors shown in parentheses are clustered at the district level in cross-sectional models and at the school level when multiple years of data are used. * p<0.10, ** p<0.05, *** p<0.01
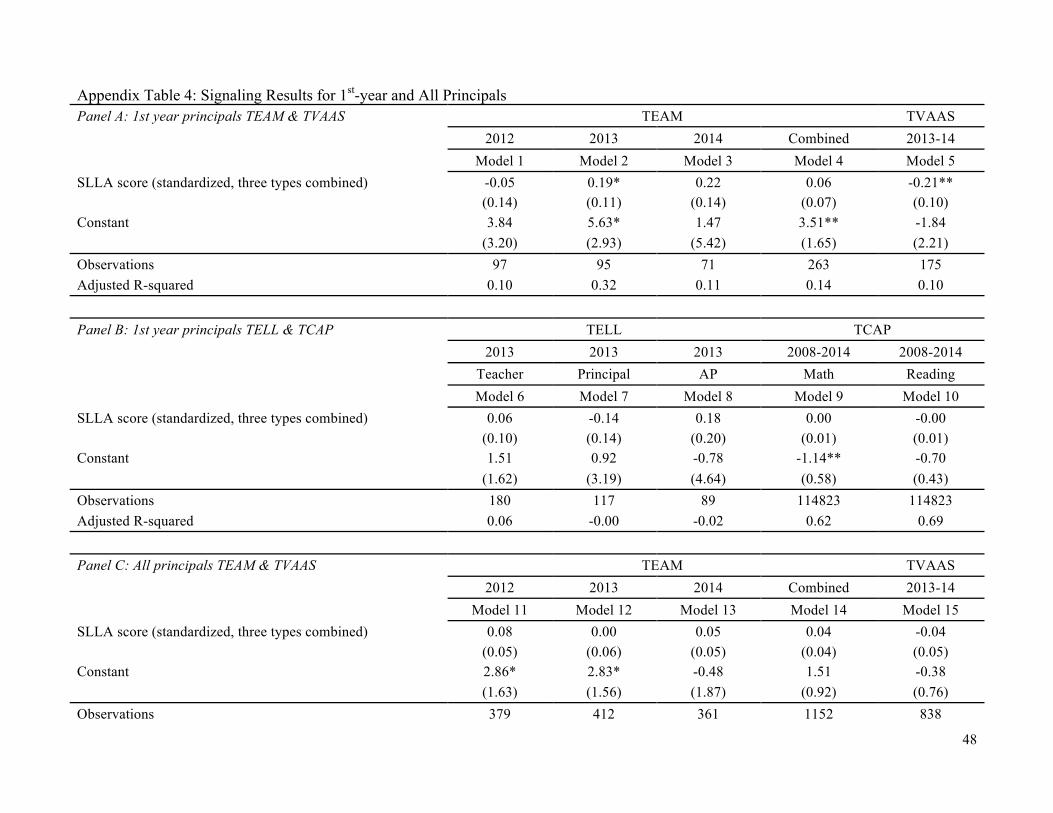
48
Appendix Table 4: Signaling Results for 1st-year and All Principals Panel A: 1st year principals TEAM & TVAAS TEAM TVAAS
2012 2013 2014 Combined 2013-14
Model 1 Model 2 Model 3 Model 4 Model 5
SLLA score (standardized, three types combined) -0.05 0.19* 0.22 0.06 -0.21**
(0.14) (0.11) (0.14) (0.07) (0.10)
Constant 3.84 5.63* 1.47 3.51** -1.84 (3.20) (2.93) (5.42) (1.65) (2.21) Observations 97 95 71 263 175 Adjusted R-squared 0.10 0.32 0.11 0.14 0.10
Panel B: 1st year principals TELL & TCAP TELL TCAP
2013 2013 2013 2008-2014 2008-2014
Teacher Principal AP Math Reading
Model 6 Model 7 Model 8 Model 9 Model 10
SLLA score (standardized, three types combined) 0.06 -0.14 0.18 0.00 -0.00
(0.10) (0.14) (0.20) (0.01) (0.01)
Constant 1.51 0.92 -0.78 -1.14** -0.70 (1.62) (3.19) (4.64) (0.58) (0.43) Observations 180 117 89 114823 114823 Adjusted R-squared 0.06 -0.00 -0.02 0.62 0.69
Panel C: All principals TEAM & TVAAS TEAM TVAAS
2012 2013 2014 Combined 2013-14
Model 11 Model 12 Model 13 Model 14 Model 15
SLLA score (standardized, three types combined) 0.08 0.00 0.05 0.04 -0.04
(0.05) (0.06) (0.05) (0.04) (0.05)
Constant 2.86* 2.83* -0.48 1.51 -0.38 (1.63) (1.56) (1.87) (0.92) (0.76) Observations 379 412 361 1152 838
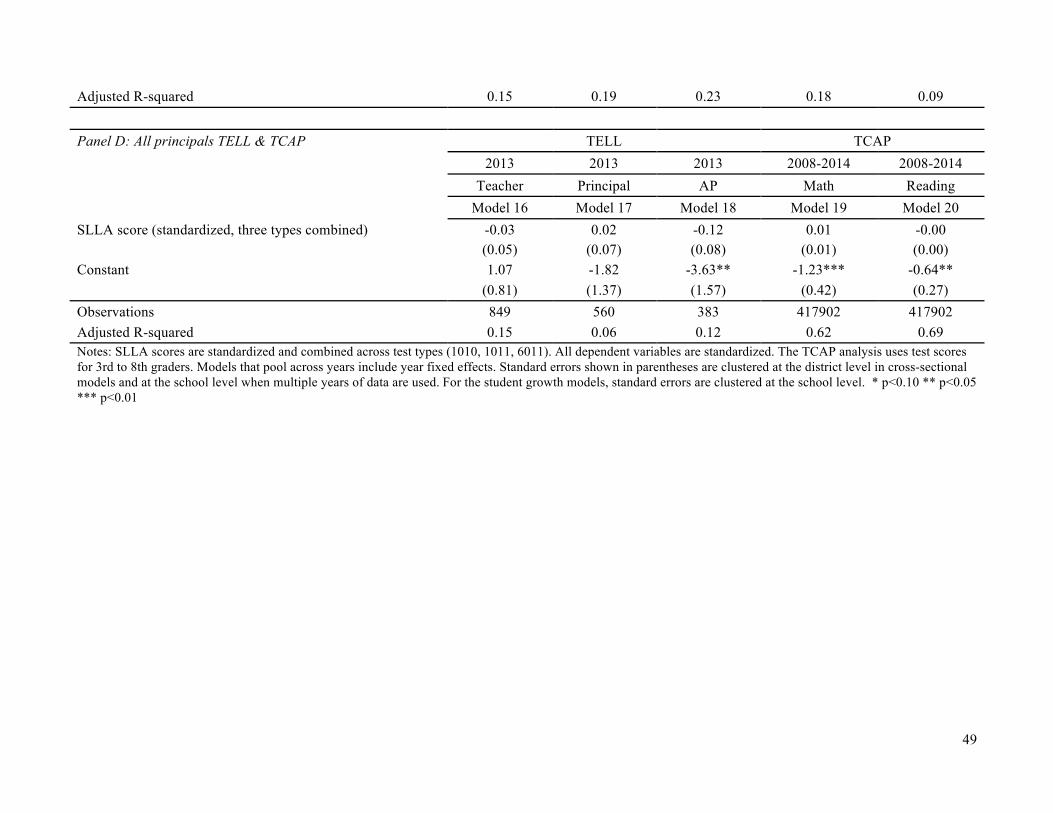
49
Adjusted R-squared 0.15 0.19 0.23 0.18 0.09
Panel D: All principals TELL & TCAP TELL TCAP
2013 2013 2013 2008-2014 2008-2014
Teacher Principal AP Math Reading
Model 16 Model 17 Model 18 Model 19 Model 20
SLLA score (standardized, three types combined) -0.03 0.02 -0.12 0.01 -0.00
(0.05) (0.07) (0.08) (0.01) (0.00)
Constant 1.07 -1.82 -3.63** -1.23*** -0.64** (0.81) (1.37) (1.57) (0.42) (0.27) Observations 849 560 383 417902 417902 Adjusted R-squared 0.15 0.06 0.12 0.62 0.69 Notes: SLLA scores are standardized and combined across test types (1010, 1011, 6011). All dependent variables are standardized. The TCAP analysis uses test scores for 3rd to 8th graders. Models that pool across years include year fixed effects. Standard errors shown in parentheses are clustered at the district level in cross-sectional models and at the school level when multiple years of data are used. For the student growth models, standard errors are clustered at the school level. * p<0.10 ** p<0.05 *** p<0.01
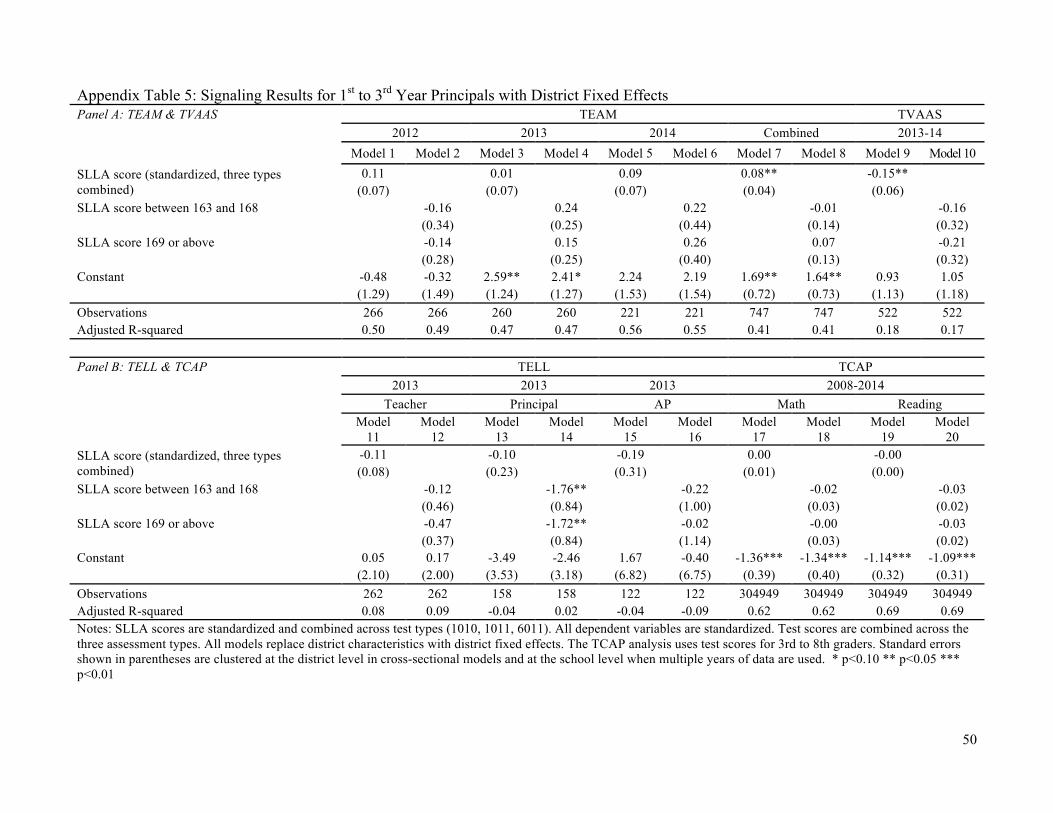
50
Appendix Table 5: Signaling Results for 1st to 3rd Year Principals with District Fixed Effects Panel A: TEAM & TVAAS TEAM TVAAS
2012 2013 2014 Combined 2013-14
Model 1 Model 2 Model 3 Model 4 Model 5 Model 6 Model 7 Model 8 Model 9 Model 10
SLLA score (standardized, three types combined)
0.11 0.01 0.09 0.08** -0.15** (0.07) (0.07) (0.07) (0.04) (0.06)
SLLA score between 163 and 168 -0.16 0.24 0.22 -0.01 -0.16
(0.34) (0.25) (0.44) (0.14) (0.32) SLLA score 169 or above -0.14 0.15 0.26 0.07 -0.21
(0.28) (0.25) (0.40) (0.13) (0.32)
Constant -0.48 -0.32 2.59** 2.41* 2.24 2.19 1.69** 1.64** 0.93 1.05 (1.29) (1.49) (1.24) (1.27) (1.53) (1.54) (0.72) (0.73) (1.13) (1.18) Observations 266 266 260 260 221 221 747 747 522 522 Adjusted R-squared 0.50 0.49 0.47 0.47 0.56 0.55 0.41 0.41 0.18 0.17
Panel B: TELL & TCAP TELL TCAP
2013 2013 2013 2008-2014
Teacher Principal AP Math Reading
Model 11
Model 12
Model 13
Model 14
Model 15
Model 16
Model 17
Model 18
Model 19
Model 20
SLLA score (standardized, three types combined)
-0.11 -0.10 -0.19 0.00 -0.00 (0.08) (0.23) (0.31) (0.01) (0.00)
SLLA score between 163 and 168 -0.12 -1.76** -0.22 -0.02 -0.03
(0.46) (0.84) (1.00) (0.03) (0.02) SLLA score 169 or above -0.47 -1.72** -0.02 -0.00 -0.03
(0.37) (0.84) (1.14) (0.03) (0.02)
Constant 0.05 0.17 -3.49 -2.46 1.67 -0.40 -1.36*** -1.34*** -1.14*** -1.09*** (2.10) (2.00) (3.53) (3.18) (6.82) (6.75) (0.39) (0.40) (0.32) (0.31) Observations 262 262 158 158 122 122 304949 304949 304949 304949 Adjusted R-squared 0.08 0.09 -0.04 0.02 -0.04 -0.09 0.62 0.62 0.69 0.69 Notes: SLLA scores are standardized and combined across test types (1010, 1011, 6011). All dependent variables are standardized. Test scores are combined across the three assessment types. All models replace district characteristics with district fixed effects. The TCAP analysis uses test scores for 3rd to 8th graders. Standard errors shown in parentheses are clustered at the district level in cross-sectional models and at the school level when multiple years of data are used. * p<0.10 ** p<0.05 *** p<0.01
51
References Achilles, C. M., & Price, W. J. (2001). What is missing in the current debate about EDAD
standards. AASA Professor, 24(2), 8-14. Angrist, J. D., & Guryan, J. (2008). Does teacher testing raise teacher quality? Evidence from
state certification requirements. Economics of Education Review, 27(5), 483-503. Anrig, G. R., Goertz, M. E., & McNeil, R. C. (1986). Teacher competency testing: Realities of
supply and demand in this period of educational reform. Journal of Negro Education, 55(3), 316-325.
Association of California School Administrators. (n.d.). California preliminary administrative
services credential overview. Retrieved on May 7, 2015, from http://www.acsa.org/mainmenucategories/professionallearning/credentialing/cpasc.aspx. Sacramento, CA: Author.
Baker, B. D., Punswick, E., & Belt, C. (2010). School leadership stability, principal moves, and
departures: Evidence from Missouri. Educational Administration Quarterly, 46(4), 523-557.
Bastian, K. C., & Henry, G. T. (2014). The apprentice: Pathways to the principalship and student
achievement. Educational Administration Quarterly. Advance online publication. Béteille, T., Kalogrides, D., & Loeb, S. (2012). Stepping Stones: Principal career paths and
school outcomes. Social Science Research, 41, 904-919. Bitterman, A., Goldring, R., & Gray, L. (2013). Characteristics of public and private elementary
and secondary school principals in the United States: Results from the 2011-12 Schools and Staffing Survey (NCES 2013-313). Washington, D.C.: U.S. Department of Education, National Center for Education Statistics.
Box-Steffensmeier, J. M., & Zorn, C. J. W. (2001). Duration models and proportional hazards in
political science. American Journal of Political Science, 45(4), 972-988. Boyd, D., Grossman, P., Ing, M., Lankford, H., Loeb, S., & Wyckoff, J. (2011). The influence of
school administrators on teacher retention decisions. American Educational Research Journal, 48(2), 303-333.
Branch, G. F., Hanushek, E. A., & Rivkin, S. G. (2012). Estimating the effect of leaders on
public sector productivity: The case of school principals (Working paper No. 17803). Retrieved from National Bureau of Economic Research website: http://www.nber.org/papers/w17803
Bredeson, P. V. (2000). The school principal’s role in teacher professional development. Journal
of In-Service Education, 26(2), 385-401.
52
Bryant, M., Isernhagen, J., LeTendre, B., & Neu, B. (2003). Alternative paths to administrative
practice : The new school leader’s licensure assessment. Paper presented at the annual meeting of the American Educational Research Association.
California Department of Education (2011). Report on passing rates of Commission-approved
examinations from 2005-06 to 2009-2010. Retrieved on October 1, 2014, from http://www.ctc.ca.gov/commission/agendas/2011-06/2011-06-5c.pdf.
Chiang, H., Lipscomb, S., & Gill, B. (2012). Is school value-added indicative of principal
quality? Cambridge, MA: Mathematica Policy Research. Clotfelter, C. T., Ladd, H. F., & Vidgor, J. L. (2006). Teacher-student matching and the
assessment of teacher effectiveness. Journal of Human Resources, 41(4), 778-820. Clotfelter, C. T., Ladd, H. F., & Vidgor, J. L. (2007). How and why do teacher credentials matter
for student achievement? (Working Paper No. 12828). Cambridge, MA: National Bureau of Economic Research. Retrieved on June 13, 2014, from http://www.nber.org/papers/w12828.
Cohen-Vogel, L. (2011). “Staffing to the test”: Are today’s school personnel practices evidence
based? Educational Evaluation and Policy Analysis, 33(4), 483-505. Cohen-Vogel, L., & Osborne-Lampkin, L. (2007). Allocating quality: Collective bargaining
agreements and administrative discretion over teacher assignment. Educational Administration Quarterly, 43(4), 433-461.
Cole, B. P. (1986). The black educator: An endangered species. Journal of Negro Education,
55(3), 326-334. Commission on Teacher Credentialing. (n.d.). Administrative services credential for individuals
prepared in California. Retrieved on May 7, 2015, from http://www.ctc.ca.gov/credentials/leaflets/cl574c.pdf. Sacramento, CA: California Department of Education.
Condon, C., & Clifford, M. (2012). Measuring principal performance: How rigorous are
commonly used principal performance assessment instruments? Washington, D.C.: American Institutes for Research.
Council of Chief State School Officers. (1996). Interstate school leaders licensure consortium
(ISLLC) standards for school leaders. Washington, DC: Author. Council of Chief State School Officers. (2008). Performance expectations and indicators for
education leaders: All ISLLC-based guide to implementing leader standards and a companion guide to the educational leadership policy standards: ISLLC 2008. Washington, DC: Author.

53
D’Agostino, J. V., & Powers, S. J. (2009). Predicting teacher performance with test scores and
grade point average: A meta-analysis. American Educational Research Journal, 46(1), 146-182.
Doyle, D., & Locke, G. (2014). Lacking leaders: The challenges of principal recruitment,
selection, and placement. Washington, D.C.: Thomas B. Fordham Institute Educational Testing Service (2009). Multi-state standard setting report: School Leaders
Licensure Assessment (SLLA). Princeton, NJ: Educational Testing Service. Retrieved on July 15, 2014, from http://www.tn.gov/sbe/2009Julypdfs/IIICPraxis%20SLLA%20Exam%20Passing%20Score%20Policy.pdf.
Educational Testing Service (n.d.a). The SLSTM study companion: School Leaders Licensure
Assessment 6011. Princeton, NJ: Educational Testing Service. Retrieved on September 6, 2013, from https://www.ets.org/Media/Tests/SLS/pdf/1011.pdf.
Educational Testing Service (n.d.b). School leadership series: State requirements. Princeton, NJ:
Educational Testing Service. Retrieved from https://www.ets.org/sls/states/. English, F. W. (2000). Psst! What does one call a set of non-empirical beliefs required to be
accepted on faith required to be accepted on faith and enforced by authority? [Answer: A religion, aka the ISLLC standards]. International Journal of Leadership in Education: Theory and Practice, 3(2), 159-168.
Epstein, K. K. (2005). The whitening of the American teaching force: A problem of recruitment
or a problem of racism? Social Justice, 32(3), 89-102. Esmail, A., & Roberts, C. (2013). Academic performance of ethnic minority candidates and
discrimination in the MRCGP examinations between 2010 and 2012: Analysis of data. The British Medical Journal, 347.
Fernandez, A. R., Studnek, J. R., & Margolis, G. S. (2008). Estimating the probability of passing
the national paramedic certification examination. Academic Emergency Medicine, 15(3), 258-264.
Garcia, P. A. (1986). The impact of national testing on ethnic minorities: With proposed
solutions. Journal of Negro Education, 55(3), 347-357. Gates, S. M., Ringel, J. S., Santibanez, L., Guarino, C., Ghosh-Dastidar, B., & Brown, A. (2006).
Mobility and turnover among school principals. Economics of Education Review, 25(3), 289-302.
54
Gitomer, D. H., Latham, A. S., & Ziomek, R. (1999). The academic quality of prospective teachers: The impact of admission and licensure testing. Princeton, NJ: The Teaching and Learning Division of Educational Testing Service.
Goldhaber, D. (2007). Everyone’s doing it but what does teacher testing tell us about teacher
effectiveness? Journal of Human Resources, 42(4), 765-794. Goldhaber, D., & Hansen, M. (2010). Race, gender, and teacher testing: How informative a tool
is teacher licensure testing? American Educational Research Journal, 47(1), 218-251. Goldring, E.B., Neumerski, C.M., Cannata, M., Drake, T.A., Grissom, J.A., Rubin, M., &
Schuermann, P. (2014). Principals’ use of teacher effectiveness data for talent management decisions. Seattle, WA: Bill & Melinda Gates Foundation. Retrieved from http://principaldatause.org.
Grissom, J. A. (2011). Can good principals keep teachers in disadvantaged schools? Linking
principal effectiveness to teacher satisfaction and turnover in hard-to-staff environments. Teachers College Record, 113(11), 2552-2585.
Grissom, J.A., Blissett, R.S.L., & Mitani, M. (2016). Supervisor ratings as measures of principal
job performance: Evidence from the TEAM evaluation system in Tennessee. Paper presented at the annual meeting of the Association for Public Policy Analysis and Management, Washington, DC.
Grissom, J. A., Kalogrides, D., & Loeb, S. (2015). Using student test scores to measure principal
performance. Educational Evaluation and Policy Analysis, 37(1), 3-28. Grissom, J. A., & Keiser, L. R. (2011). A supervisor like me: Race, representation, and the
satisfaction and turnover decisions of public sector employees. Journal of Policy Analysis and Management, 30(3), 557-580.
Grissom, J. A., & Loeb, S. (2011). Triangulating principal effectiveness how perspectives of
parents, teachers, and assistant principals identify the central importance of managerial skills. American Educational Research Journal, 48(5), 1091-1123.
Grissom, J.A., Rodriguez, L.A., & Kern, E.C. (in press). Teacher and principal diversity and the
representation of students of color in gifted programs: Evidence from national data. Elementary School Journal.
Hallinger, P. & Heck, R. H. (1998). Exploring the principal’s contribution to school
effectiveness: 1980-1995. School Effectiveness and School Improvement, 9(2), 157-191. Hargreaves, A., & Fink, D. (2004). The seven principles of sustainable leadership. Educational
Leadership, 61(7), 8-13.

55
Hargreaves, A., Moore, S., Fink, D., Brayman, C., & White, R. (2003). Succeeding leaders? A study of principal succession and sustainability. Toronto, Ontario: Ontario Principal’s Council.
Hord, S.M. (1997). Professional learning communities: Communities of continuous inquiry and
improvement. Austin, TX: Southwest Educational Development Laboratory. Irvine, J. J. (1988). An analysis of the problem of disappearing black educators. Elementary
School Journal, 88(5), 503-513. Jacob, B. A. (2011). Do principals fire the worst teachers? Educational Evaluation and Policy
Analysis, 33(4), 403-434. Jacob, R., Goddard, R., Kim, M., Miller, R., & Goddard, Y. (2014). Exploring the causal impact
of the McREL Balanced Leadership Program on leadership, principal efficacy, instructional climate, educator turnover, and student achievement. Educational Evaluation and Policy Analysis, 37(3), 314-332.
Kaplan, L. S., Owings, W. A., & Nunney, J. (2005). Principal quality: A Virginia study
connecting Interstate School Leaders Licensure Consortium Standards with student achievement. NASSP Bulletin, 89(643), 28-44.
Kaye, E. A., & Makos, J. J. (2012). Requirements for certification of teachers, counselors,
librarians, administrators for elementary and secondary schools. Chicago, IL: University of Chicago Press.
Keele, L. (2010). Proportionally difficult: Testing for nonproportional hazards in Cox models.
Political Analysis, 18(2), 189-205. Kelly, M. D. (2013). Analysis of School Leaders Licensure Assessment content category I-V
scores and principal internship self-assessment scores for ISLLC Standards I-V. Journal of International Education and Leadership, 3(3), 1-11.
Kelly, M. D., & Koonce, G. L. (2012). The relationship between student grade point average,
principal internship mentor’s assessment scores and school leaders licensure assessment scores. Journal of Human Resources and Adult Learning, 8(2), 1-9
Klein, J. P., & Moeshberger, M. L. (2003). Survival analysis: Techniques for censored and
truncated data. New York, NY: Springer. Koonce, G. L., & Kelly, M. D. (2013). Analysis of school leaders licensure assessment content
category I-V scores and principal internship mentor’s assessment scores for standards 1-5. International Journal of Humanities and Social Science, 3(5), 10-18.
56
Latham, A. S., & Pearlman, M. A. (1999). From standards to licensure: Developing an authentic assessment for school principals. Journal of Personnel Evaluation in Education, 13(3), 245-262.
Leithwood, K., Louis, K. S., Anderson, S., & Wahlstrom, K. (2004). How leadership influences
student learning: A review of research for the Learning from Leadership Project. New York, NY: The Wallace Foundation.
Levine, A. (2005). Educating school leaders. Washington, DC: Education Schools Project. Loeb, S., Kalogrides, D., & Horng, E. L. (2010). Principal preferences and the uneven
distribution of principals across schools. Educational Evaluation and Policy Analysis, 32(2), 205-229.
Lomotey, K., & Lowery, K. (2014). Black students, urban schools, and black principals. In H.R.
Milner IV and K. Lomotey (Eds.), Handbook of Urban Education (pp. 325-350). New York: Routledge.
Mehrens, W. A. (1987). Validity issues in teacher licensure tests. Journal of Personnel
Evaluation in Education, 1(2), 195-229. Miller, A. (2013). Principal turnover and student achievement. Economics of Education Review,
36(1), 60-72. Murphy, J., & Shipman, N. J. (1999). The interstate school leaders licensure consortium: A
standards-based approach to strengthening educational leadership. Journal of Personnel Evaluation in Education, 13(3), 205-224.
Murphy, J. (2007). Questioning the core of university-based programs for preparing school
leaders. The Phi Delta Kappan, 88(8), 582-585. Nettles, M. T., Scatton, L. H., Steinberg, J. H., & Tyler, L. L. (2011). Performance and passing
rate differences of African American and White prospective teachers on PraxisTM examinations. Research Report ETS RR-11-08. Retrieved on May 7, 2015, from http://www.ets.org/Media/Research/pdf/RR-11-08.pdf. Princeton, NJ: Educational Testing Service.
New York State Education Department. (2013). Update on new exams for initial certification of
teachers and school building leaders. Retrieved on February 18, 2015, from http://www.highered.nysed.gov/tcert/certificate/certexamsl2012.html.
Reese, C. M., & Tannenbaum, R. J. (1999). Gathering content-related validity evidence for the
School Leaders Licensure Assessment. Journal of Personnel Evaluation in Education, 13(3), 263-282.
57
Riehl, C., & Byrd, M. A. (1997). Gender differences among new recruits to school administration: Cautionary footnotes to an optimistic tale. Educational Evaluation and Policy Analysis, 19(1), 45-64.
Roberts, B. (2009). School leadership preparation: A national view. Delta Kappa Gamma
Bulletin, 75(2), 5-7 and 19. Robinson, V. M. J., Lloyd, C. A., & Rowe, K. J. (2008). The impact of leadership on student
outcomes: An analysis of the differential effects of leadership types. Educational Administration Quarterly, 44(5), 635-674.
Rutledge, S. A., Harris, D. N., Thompson, C. T., & Ingle, W. K. (2008). Certify, blink, hire: An
examination of the process and tools of teacher screening and selection. Leadership and Policy in Schools, 7(3), 237-263.
Schweig, J. (2013). Cross-level measurement invariance in school and classroom environment
surveys: Implications for policy and practice. Educational Evaluation and Policy Analysis, 36(3), 259–280.
Sebastian, J., & Allensworth, E. (2012). The influence of principal leadership on classroom
instruction and student learning: a study of mediated pathways to learning. Educational Administration Quarterly, 48(4), 626-663.
Supovitz, J., Sirinides, P., & May, H. (2010). How principals and peers influence teaching and
learning. Educational Administration Quarterly, 46(1), 31-56. Tannenbaum, R. J. (1999). Laying the groundwork for a licensure assessment. Journal of
Personnel Evaluation in Education, 13(3), 225-244. Tannenbaum, R. J., & Robustelli, S. L. (2008). Validity evidence to support the development of a
licensure assessment for education leaders: A job-analytic approach. Princeton, NJ: Educational Testing Service.
Tennessee Department of Education (n.d.-a). Applying for a new administrator license.
Retrieved in 2014 from http://www.state.tn.us/education/licensing/new_administrator.shtml.
Tennessee Department of Education (n.d.-b). Grades 3-8 TCAP Achievement Test. Retrieved on
October 5, 2014, from http://www.tn.gov/education/assessment/grades_3-8.shtml. Nashville, TN: Tennessee Department of Education.
Texas Education Agency. (2014). Required tests for Texas certification. Retrieved on February
18, 2015, from http://tea.texas.gov/WorkArea/linkit.aspx?LinkIdentifier=id&ItemID=25769807769&libID=25769807771.

58
Wightman, L. F. (1998). LSAC national longitudinal bar passage study. Retrieved on March 22, 2015, from http://www.unc.edu/edp/pdf/NLBPS.pdf. Newtown, PA: The Law School Admission Council.
Zimmerman, S. (2002). Handbook of certification requirements for school administrators.
Lanham, MD: University Press of America.
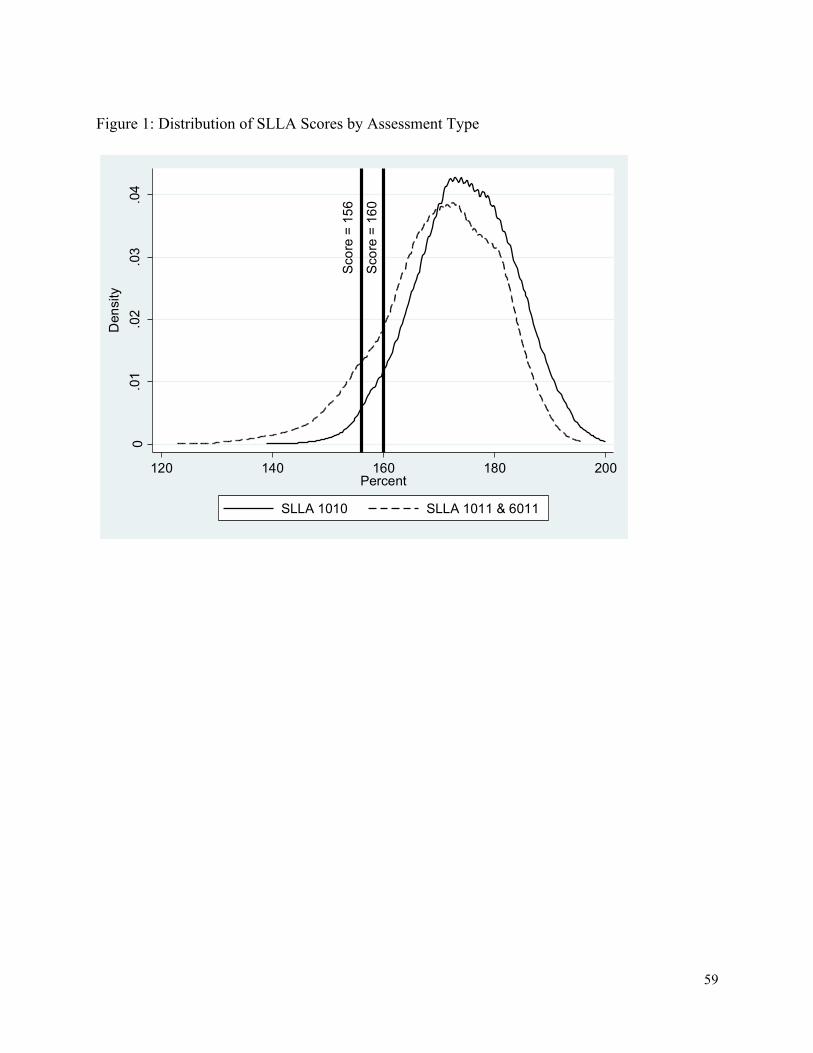
59
Figure 1: Distribution of SLLA Scores by Assessment Type
Scor
e =
156
Scor
e =
160
0.0
1.0
2.0
3.0
4D
ensi
ty
120 140 160 180 200Percent
SLLA 1010 SLLA 1011 & 6011

60
Figure 2: Distribution of SLLA Scores by Race, Test Form 1011/6011
TN =
160
AR, M
O =
163
MS
= 16
9
0.0
1.0
2.0
3.0
4D
ensi
ty
120 140 160 180 200Percent
Nonwhite White
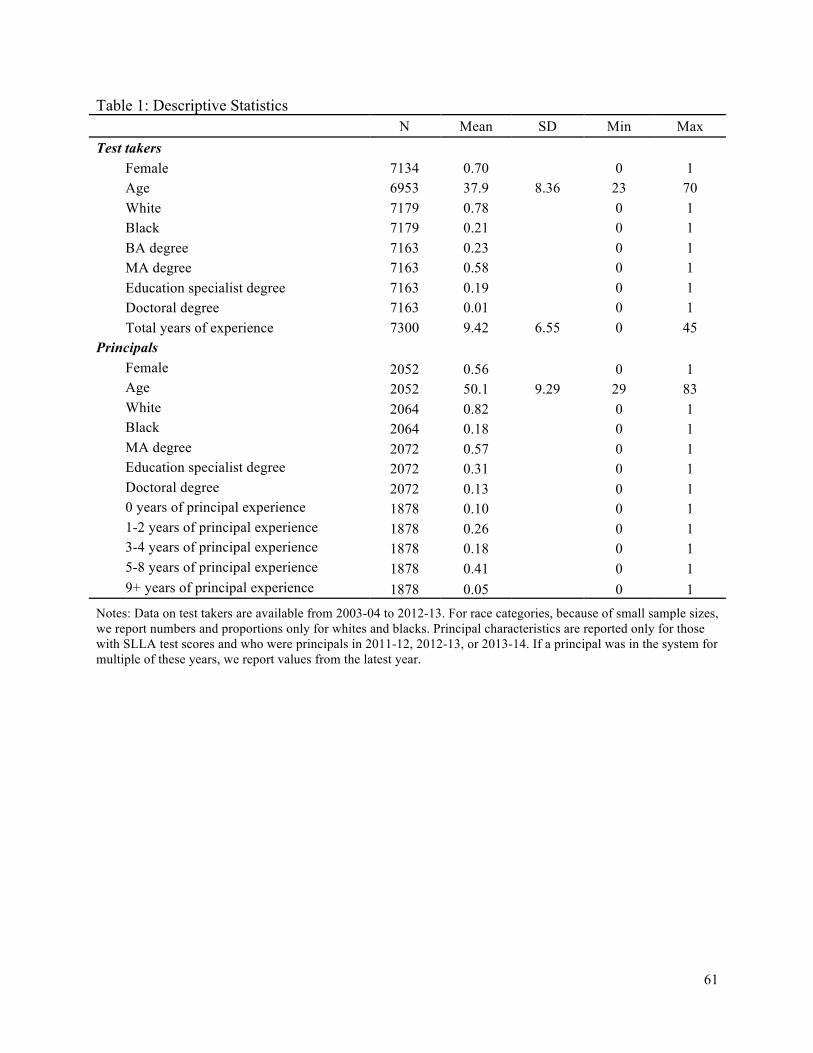
61
Table 1: Descriptive Statistics N Mean SD Min Max Test takers
Female 7134 0.70 0 1 Age 6953 37.9 8.36 23 70 White 7179 0.78 0 1 Black 7179 0.21 0 1 BA degree 7163 0.23 0 1 MA degree 7163 0.58 0 1 Education specialist degree 7163 0.19 0 1 Doctoral degree 7163 0.01 0 1 Total years of experience 7300 9.42 6.55 0 45
Principals Female 2052 0.56
0 1
Age 2052 50.1 9.29 29 83 White 2064 0.82
0 1
Black 2064 0.18
0 1 MA degree 2072 0.57
0 1
Education specialist degree 2072 0.31
0 1 Doctoral degree 2072 0.13
0 1
0 years of principal experience 1878 0.10
0 1 1-2 years of principal experience 1878 0.26
0 1
3-4 years of principal experience 1878 0.18
0 1 5-8 years of principal experience 1878 0.41
0 1
9+ years of principal experience 1878 0.05
0 1 Notes: Data on test takers are available from 2003-04 to 2012-13. For race categories, because of small sample sizes, we report numbers and proportions only for whites and blacks. Principal characteristics are reported only for those with SLLA test scores and who were principals in 2011-12, 2012-13, or 2013-14. If a principal was in the system for multiple of these years, we report values from the latest year.
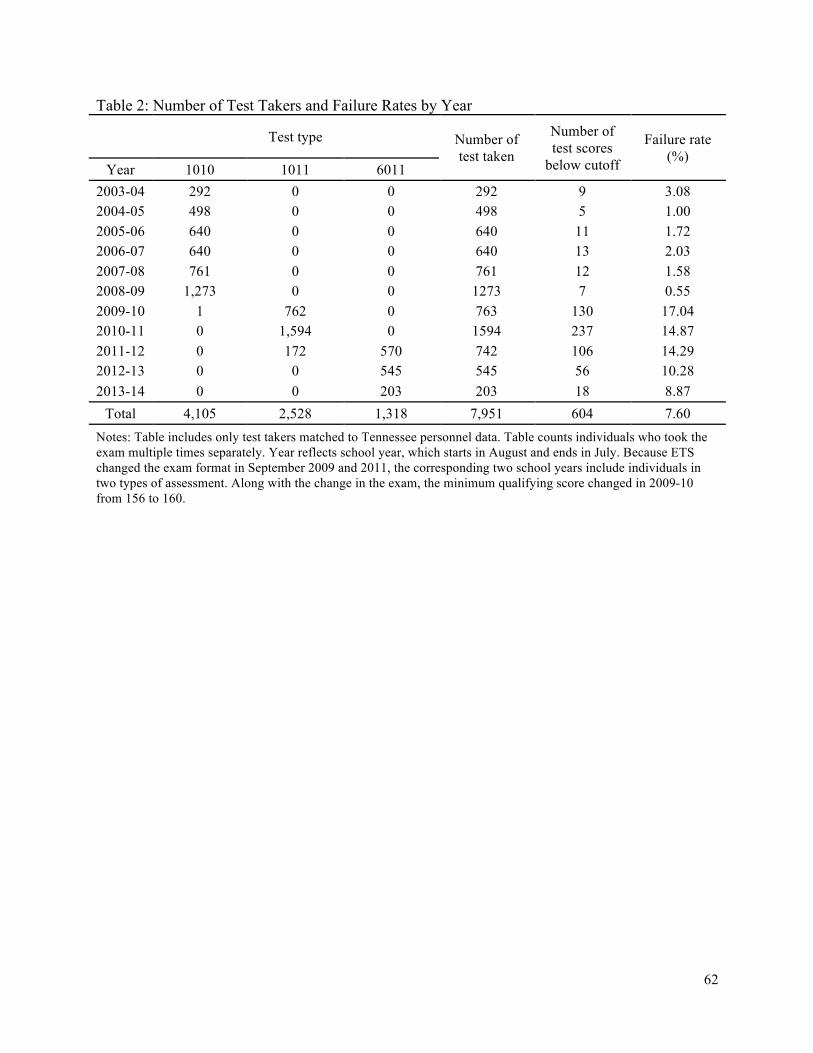
62
Table 2: Number of Test Takers and Failure Rates by Year
Test type Number of test taken
Number of test scores
below cutoff
Failure rate (%)
Year 1010 1011 6011 2003-04 292 0 0 292 9 3.08 2004-05 498 0 0 498 5 1.00 2005-06 640 0 0 640 11 1.72 2006-07 640 0 0 640 13 2.03 2007-08 761 0 0 761 12 1.58 2008-09 1,273 0 0 1273 7 0.55 2009-10 1 762 0 763 130 17.04 2010-11 0 1,594 0 1594 237 14.87 2011-12 0 172 570 742 106 14.29 2012-13 0 0 545 545 56 10.28 2013-14 0 0 203 203 18 8.87
Total 4,105 2,528 1,318 7,951 604 7.60 Notes: Table includes only test takers matched to Tennessee personnel data. Table counts individuals who took the exam multiple times separately. Year reflects school year, which starts in August and ends in July. Because ETS changed the exam format in September 2009 and 2011, the corresponding two school years include individuals in two types of assessment. Along with the change in the exam, the minimum qualifying score changed in 2009-10 from 156 to 160.
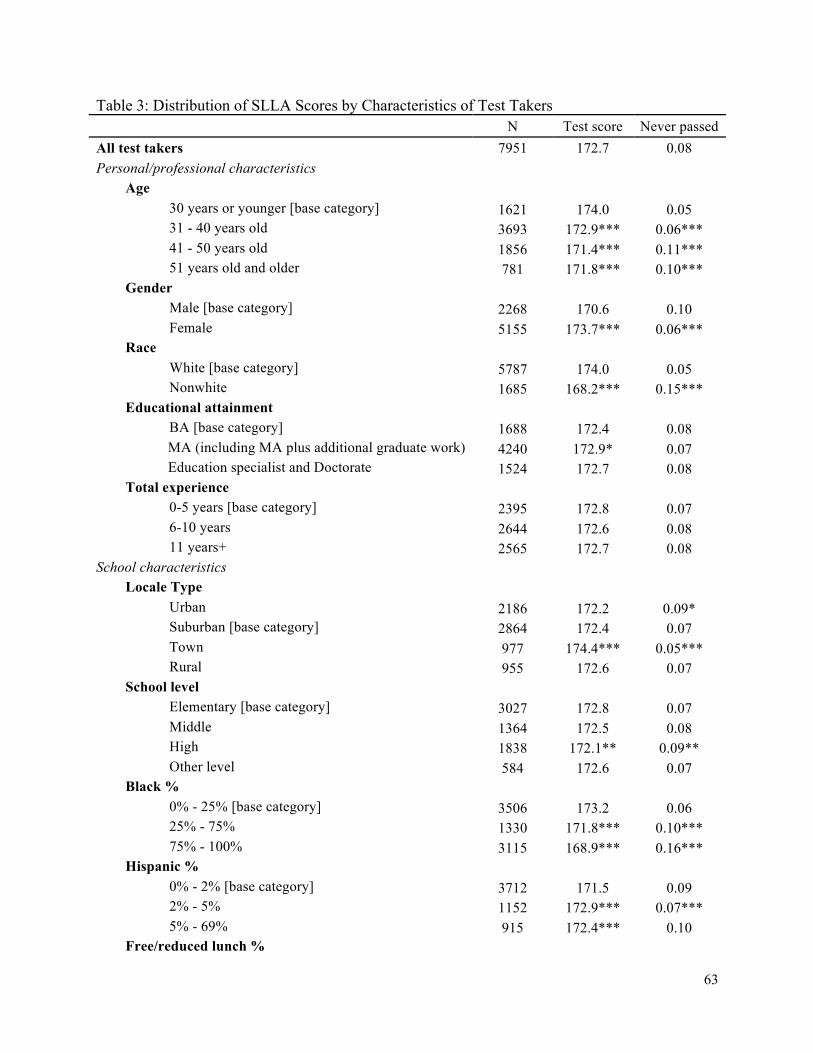
63
Table 3: Distribution of SLLA Scores by Characteristics of Test Takers N Test score Never passed All test takers 7951 172.7 0.08 Personal/professional characteristics
Age 30 years or younger [base category] 1621 174.0 0.05 31 - 40 years old 3693 172.9*** 0.06*** 41 - 50 years old 1856 171.4*** 0.11*** 51 years old and older 781 171.8*** 0.10***
Gender Male [base category] 2268 170.6 0.10 Female 5155 173.7*** 0.06***
Race White [base category] 5787 174.0 0.05 Nonwhite 1685 168.2*** 0.15***
Educational attainment BA [base category] 1688 172.4 0.08 MA (including MA plus additional graduate work) 4240 172.9* 0.07 Education specialist and Doctorate 1524 172.7 0.08
Total experience 0-5 years [base category] 2395 172.8 0.07 6-10 years 2644 172.6 0.08 11 years+ 2565 172.7 0.08
School characteristics Locale Type
Urban 2186 172.2 0.09* Suburban [base category] 2864 172.4 0.07 Town 977 174.4*** 0.05*** Rural 955 172.6 0.07
School level Elementary [base category] 3027 172.8 0.07 Middle 1364 172.5 0.08 High 1838 172.1** 0.09** Other level 584 172.6 0.07
Black % 0% - 25% [base category] 3506 173.2 0.06 25% - 75% 1330 171.8*** 0.10*** 75% - 100% 3115 168.9*** 0.16***
Hispanic % 0% - 2% [base category] 3712 171.5 0.09 2% - 5% 1152 172.9*** 0.07*** 5% - 69% 915 172.4*** 0.10
Free/reduced lunch %
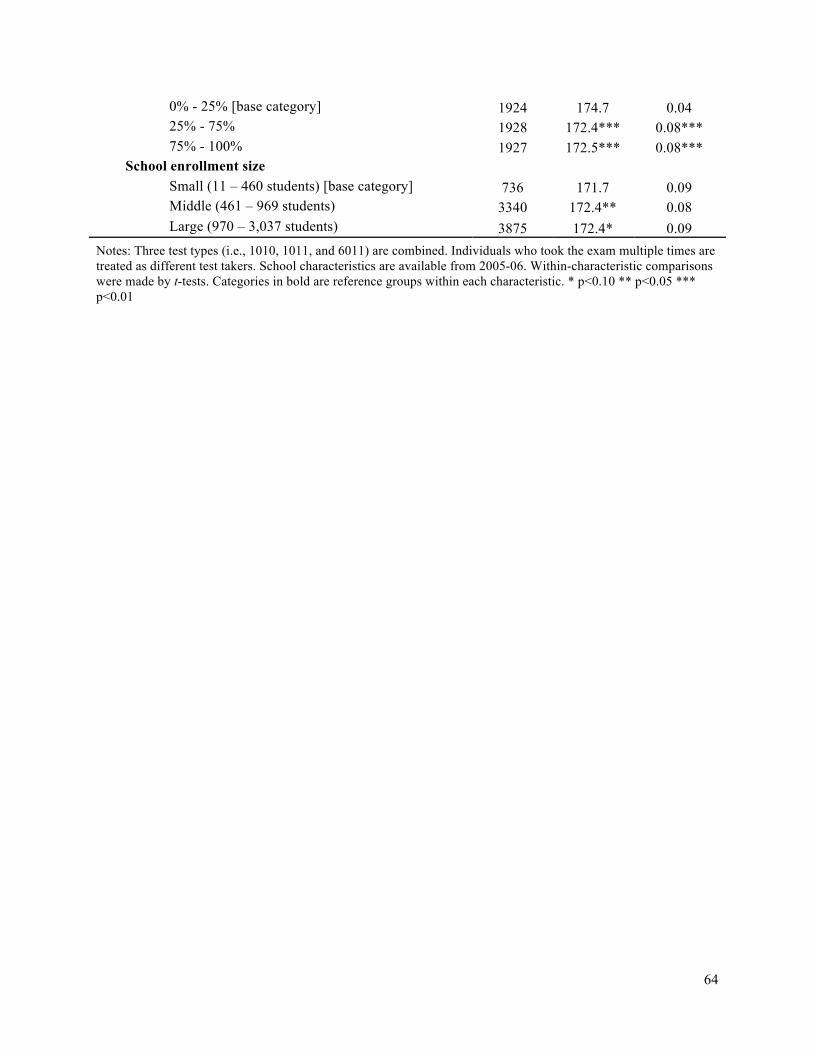
64
0% - 25% [base category] 1924 174.7 0.04 25% - 75% 1928 172.4*** 0.08*** 75% - 100% 1927 172.5*** 0.08***
School enrollment size Small (11 – 460 students) [base category] 736 171.7 0.09 Middle (461 – 969 students) 3340 172.4** 0.08 Large (970 – 3,037 students) 3875 172.4* 0.09
Notes: Three test types (i.e., 1010, 1011, and 6011) are combined. Individuals who took the exam multiple times are treated as different test takers. School characteristics are available from 2005-06. Within-characteristic comparisons were made by t-tests. Categories in bold are reference groups within each characteristic. * p<0.10 ** p<0.05 *** p<0.01
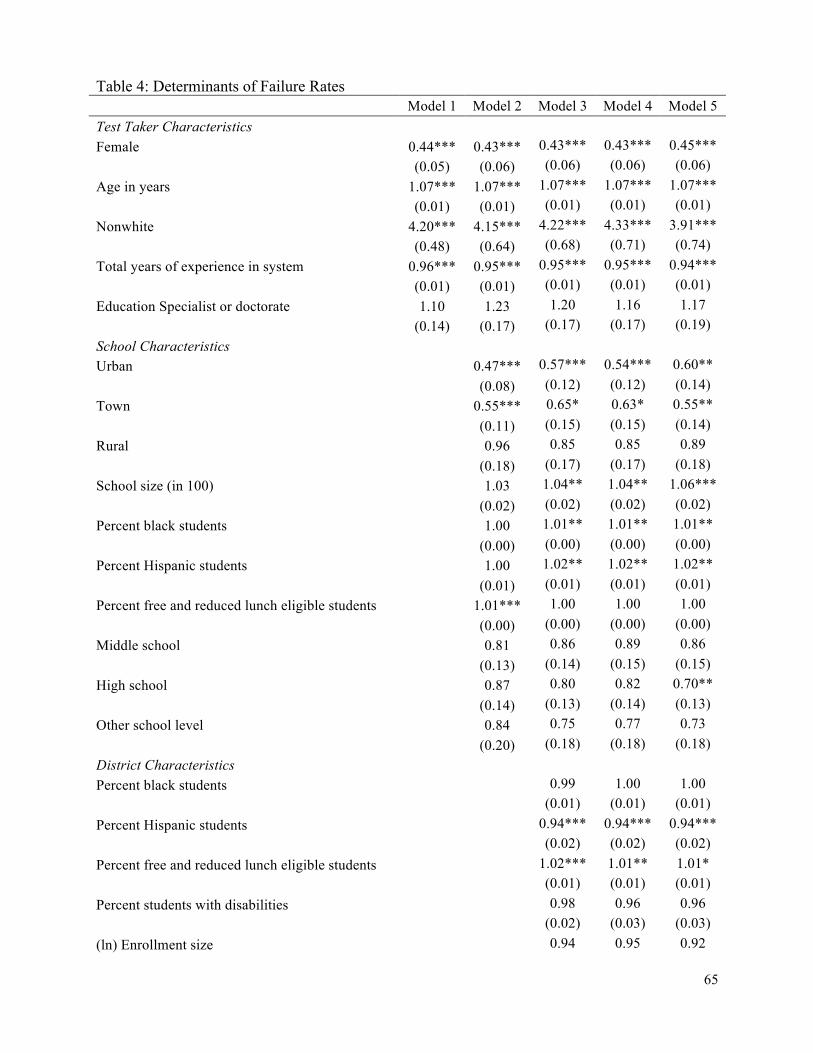
65
Table 4: Determinants of Failure Rates Model 1 Model 2 Model 3 Model 4 Model 5 Test Taker Characteristics Female 0.44*** 0.43*** 0.43*** 0.43*** 0.45***
(0.05) (0.06) (0.06) (0.06) (0.06)
Age in years 1.07*** 1.07*** 1.07*** 1.07*** 1.07***
(0.01) (0.01) (0.01) (0.01) (0.01)
Nonwhite 4.20*** 4.15*** 4.22*** 4.33*** 3.91***
(0.48) (0.64) (0.68) (0.71) (0.74)
Total years of experience in system 0.96*** 0.95*** 0.95*** 0.95*** 0.94***
(0.01) (0.01) (0.01) (0.01) (0.01)
Education Specialist or doctorate 1.10 1.23 1.20 1.16 1.17
(0.14) (0.17) (0.17) (0.17) (0.19)
School Characteristics
Urban 0.47*** 0.57*** 0.54*** 0.60**
(0.08) (0.12) (0.12) (0.14)
Town 0.55*** 0.65* 0.63* 0.55**
(0.11) (0.15) (0.15) (0.14)
Rural 0.96 0.85 0.85 0.89
(0.18) (0.17) (0.17) (0.18)
School size (in 100) 1.03 1.04** 1.04** 1.06***
(0.02) (0.02) (0.02) (0.02)
Percent black students 1.00 1.01** 1.01** 1.01**
(0.00) (0.00) (0.00) (0.00)
Percent Hispanic students 1.00 1.02** 1.02** 1.02**
(0.01) (0.01) (0.01) (0.01)
Percent free and reduced lunch eligible students 1.01*** 1.00 1.00 1.00
(0.00) (0.00) (0.00) (0.00)
Middle school 0.81 0.86 0.89 0.86
(0.13) (0.14) (0.15) (0.15)
High school 0.87 0.80 0.82 0.70**
(0.14) (0.13) (0.14) (0.13)
Other school level 0.84 0.75 0.77 0.73
(0.20) (0.18) (0.18) (0.18)
District Characteristics
Percent black students 0.99 1.00 1.00
(0.01) (0.01) (0.01)
Percent Hispanic students 0.94*** 0.94*** 0.94***
(0.02) (0.02) (0.02)
Percent free and reduced lunch eligible students 1.02*** 1.01** 1.01*
(0.01) (0.01) (0.01)
Percent students with disabilities 0.98 0.96 0.96
(0.02) (0.03) (0.03)
(ln) Enrollment size 0.94 0.95 0.92
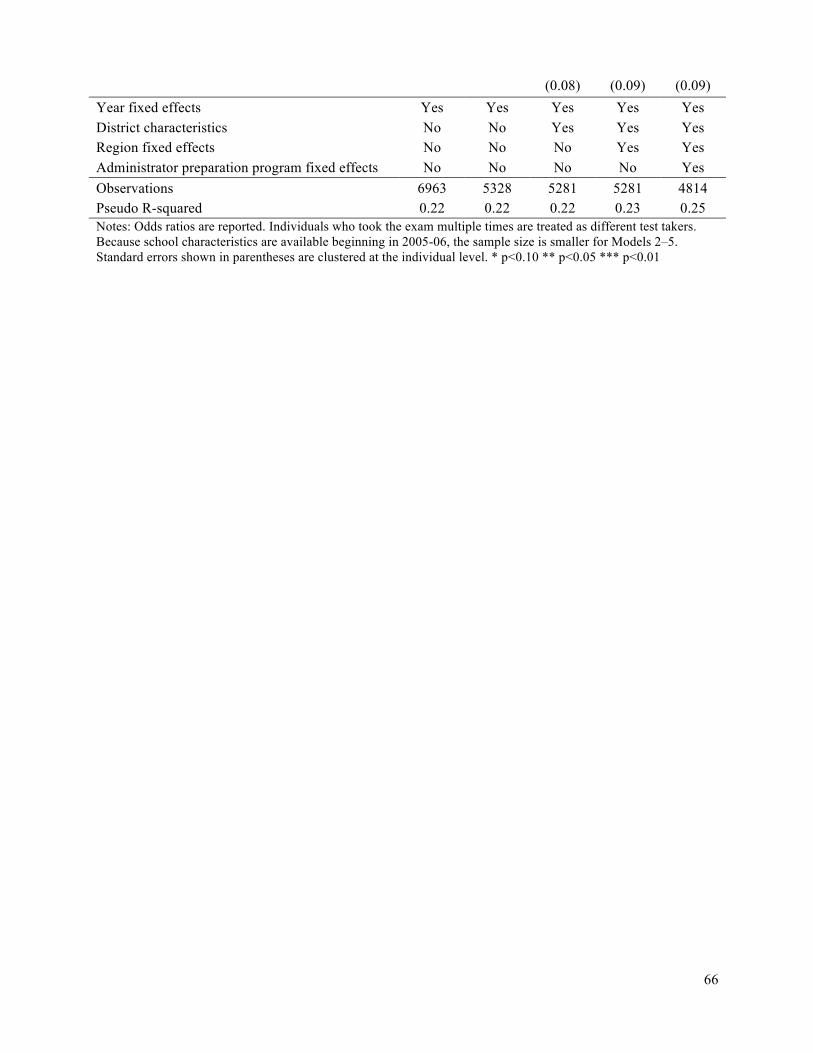
66
(0.08) (0.09) (0.09) Year fixed effects Yes Yes Yes Yes Yes District characteristics No No Yes Yes Yes Region fixed effects No No No Yes Yes Administrator preparation program fixed effects No No No No Yes Observations 6963 5328 5281 5281 4814 Pseudo R-squared 0.22 0.22 0.22 0.23 0.25 Notes: Odds ratios are reported. Individuals who took the exam multiple times are treated as different test takers. Because school characteristics are available beginning in 2005-06, the sample size is smaller for Models 2–5. Standard errors shown in parentheses are clustered at the individual level. * p<0.10 ** p<0.05 *** p<0.01
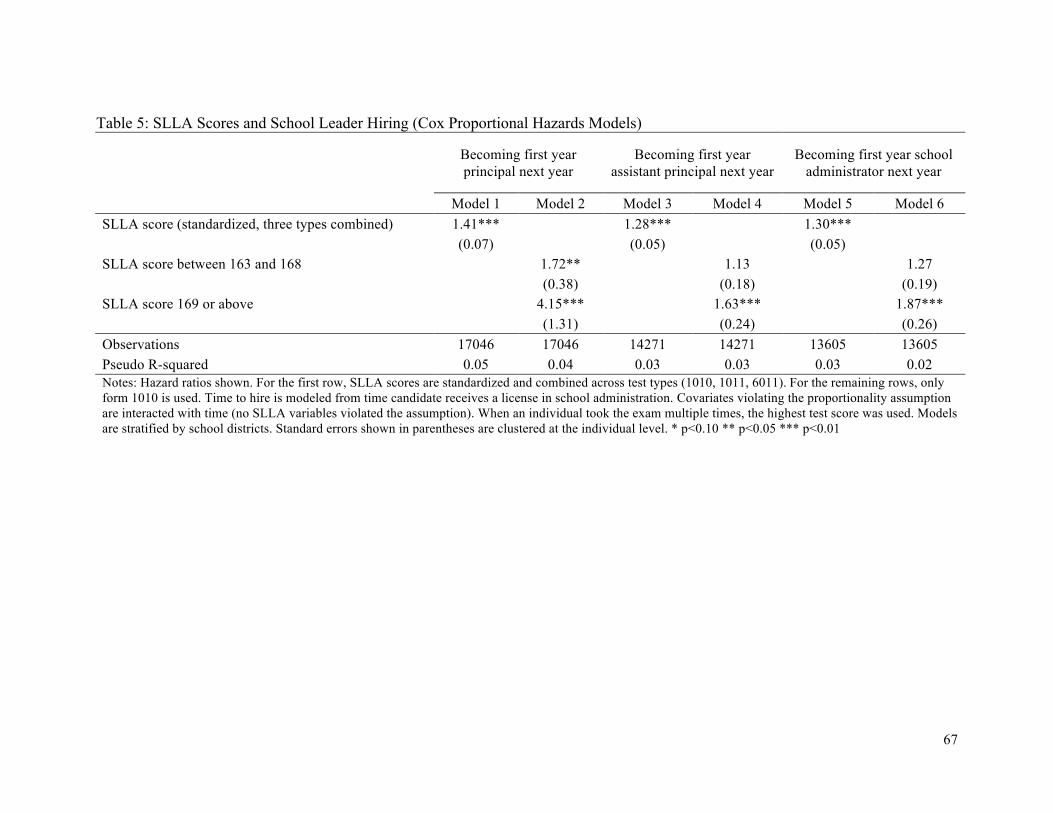
67
Table 5: SLLA Scores and School Leader Hiring (Cox Proportional Hazards Models)
Becoming first year principal next year
Becoming first year assistant principal next year
Becoming first year school administrator next year
Model 1 Model 2 Model 3 Model 4 Model 5 Model 6 SLLA score (standardized, three types combined) 1.41***
1.28*** 1.30***
(0.07)
(0.05) (0.05) SLLA score between 163 and 168
1.72** 1.13 1.27
(0.38) (0.18) (0.19) SLLA score 169 or above
4.15*** 1.63*** 1.87***
(1.31) (0.24) (0.26) Observations 17046 17046 14271 14271 13605 13605 Pseudo R-squared 0.05 0.04 0.03 0.03 0.03 0.02 Notes: Hazard ratios shown. For the first row, SLLA scores are standardized and combined across test types (1010, 1011, 6011). For the remaining rows, only form 1010 is used. Time to hire is modeled from time candidate receives a license in school administration. Covariates violating the proportionality assumption are interacted with time (no SLLA variables violated the assumption). When an individual took the exam multiple times, the highest test score was used. Models are stratified by school districts. Standard errors shown in parentheses are clustered at the individual level. * p<0.10 ** p<0.05 *** p<0.01
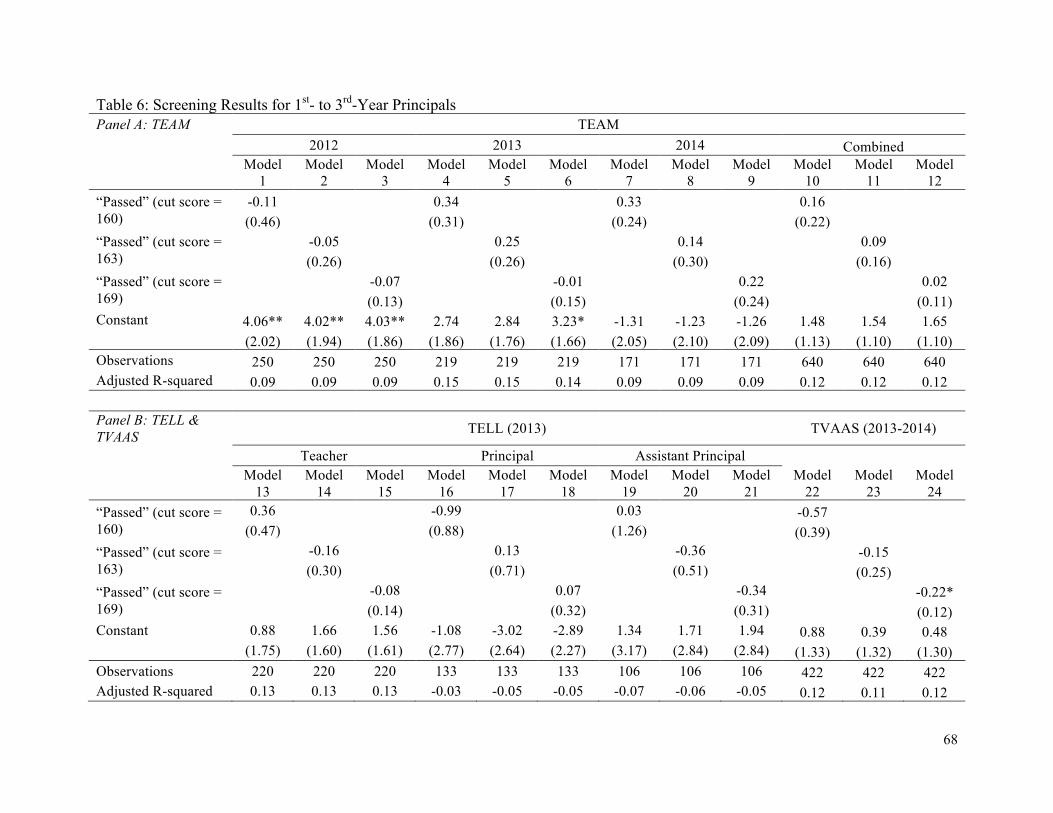
68
Table 6: Screening Results for 1st- to 3rd-Year Principals Panel A: TEAM TEAM
2012 2013 2014 Combined
Model 1
Model 2
Model 3
Model 4
Model 5
Model 6
Model 7
Model 8
Model 9
Model 10
Model 11
Model 12
“Passed” (cut score = 160)
-0.11
0.34
0.33
0.16 (0.46)
(0.31)
(0.24)
(0.22)
“Passed” (cut score = 163)
-0.05
0.25
0.14
0.09
(0.26)
(0.26)
(0.30)
(0.16)
“Passed” (cut score = 169)
-0.07
-0.01
0.22
0.02
(0.13)
(0.15)
(0.24)
(0.11)
Constant 4.06** 4.02** 4.03** 2.74 2.84 3.23* -1.31 -1.23 -1.26 1.48 1.54 1.65 (2.02) (1.94) (1.86) (1.86) (1.76) (1.66) (2.05) (2.10) (2.09) (1.13) (1.10) (1.10) Observations 250 250 250 219 219 219 171 171 171 640 640 640 Adjusted R-squared 0.09 0.09 0.09 0.15 0.15 0.14 0.09 0.09 0.09 0.12 0.12 0.12 Panel B: TELL & TVAAS TELL (2013) TVAAS (2013-2014)
Teacher Principal Assistant Principal Model
13 Model
14 Model
15 Model
16 Model
17 Model
18 Model
19 Model
20 Model
21 Model
22 Model
23 Model
24 “Passed” (cut score = 160)
0.36 -0.99 0.03 -0.57 (0.47) (0.88) (1.26) (0.39) “Passed” (cut score =
163) -0.16 0.13 -0.36
-0.15
(0.30) (0.71) (0.51)
(0.25)
“Passed” (cut score = 169)
-0.08 0.07 -0.34
-0.22*
(0.14) (0.32) (0.31)
(0.12) Constant 0.88 1.66 1.56 -1.08 -3.02 -2.89 1.34 1.71 1.94 0.88 0.39 0.48 (1.75) (1.60) (1.61) (2.77) (2.64) (2.27) (3.17) (2.84) (2.84) (1.33) (1.32) (1.30) Observations 220 220 220 133 133 133 106 106 106 422 422 422 Adjusted R-squared 0.13 0.13 0.13 -0.03 -0.05 -0.05 -0.07 -0.06 -0.05 0.12 0.11 0.12
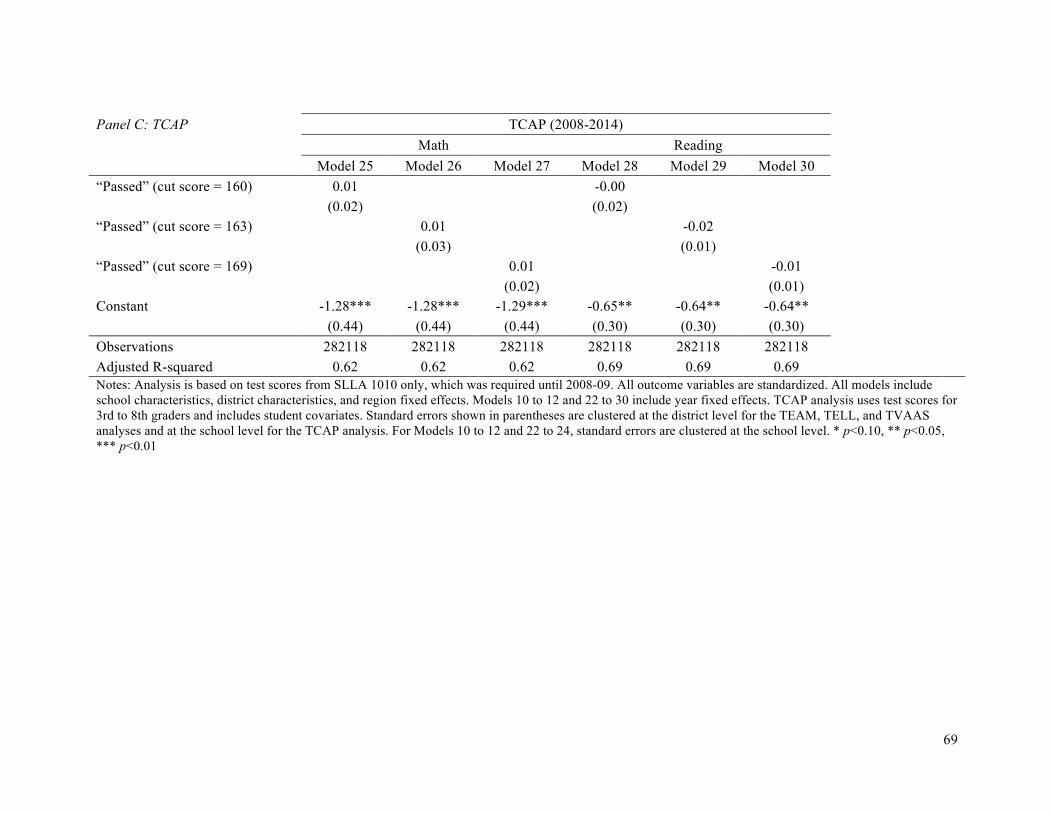
69
Panel C: TCAP TCAP (2008-2014)
Math Reading
Model 25 Model 26 Model 27 Model 28 Model 29 Model 30 “Passed” (cut score = 160) 0.01 -0.00
(0.02) (0.02) “Passed” (cut score = 163) 0.01 -0.02
(0.03) (0.01) “Passed” (cut score = 169) 0.01 -0.01
(0.02) (0.01) Constant -1.28*** -1.28*** -1.29*** -0.65** -0.64** -0.64** (0.44) (0.44) (0.44) (0.30) (0.30) (0.30) Observations 282118 282118 282118 282118 282118 282118 Adjusted R-squared 0.62 0.62 0.62 0.69 0.69 0.69
Notes: Analysis is based on test scores from SLLA 1010 only, which was required until 2008-09. All outcome variables are standardized. All models include school characteristics, district characteristics, and region fixed effects. Models 10 to 12 and 22 to 30 include year fixed effects. TCAP analysis uses test scores for 3rd to 8th graders and includes student covariates. Standard errors shown in parentheses are clustered at the district level for the TEAM, TELL, and TVAAS analyses and at the school level for the TCAP analysis. For Models 10 to 12 and 22 to 24, standard errors are clustered at the school level. * p<0.10, ** p<0.05, *** p<0.01

70
Table 7: Signaling Results for 1st- to 3rd-Year Principals Panel A: TEAM & TVAAS TEAM TVAAS
2012 2013 2014 Combined 2013-2014 Model 1 Model 2 Model 3 Model 4 Model 5 SLLA score (standardized, three types combined) 0.08 -0.03 0.07 0.03 -0.13**
(0.07) (0.07) (0.07) (0.05) (0.06) Constant 2.85 3.58* -0.32 1.99* 0.99 (1.85) (1.80) (2.15) (1.03) (1.16) Observations 266 260 221 747 522 Adjusted R-squared 0.14 0.16 0.19 0.16 0.11 Panel B: TELL & TCAP TELL TCAP
2013 2008-2014 2008-2014
Teacher Principal AP Math Reading
Model 6 Model 7 Model 8 Model 9 Model 10 SLLA score (standardized, three types combined) -0.04 -0.02 -0.09 0.00 -0.00
(0.06) (0.12) (0.14) (0.01) (0.00) Constant 0.85 -3.02 -1.22 -1.09** -0.65** (1.48) (2.49) (3.07) (0.42) (0.30) Observations 262 158 122 304174 304174 Adjusted R-squared 0.16 0.00 -0.14 0.62 0.69 Notes: SLLA scores are standardized and combined across test types (1010, 1011, 6011). All dependent variables are standardized. Models 1 to 8 include principal characteristics, school characteristics, district characteristics, and region fixed effects. Models 4 and 5 include year fixed effects. TCAP analysis uses test scores for 3rd to 8th graders. Models 9 and 10 add student characteristics, grade fixed effects, and year fixed effects. Standard errors shown in parentheses are clustered at the district level in Models 1, 2, 3, 6, 7, and 8, and at the school level in Models 4, 5, 9, and 10. * p<0.10 ** p<0.05 *** p<0.01
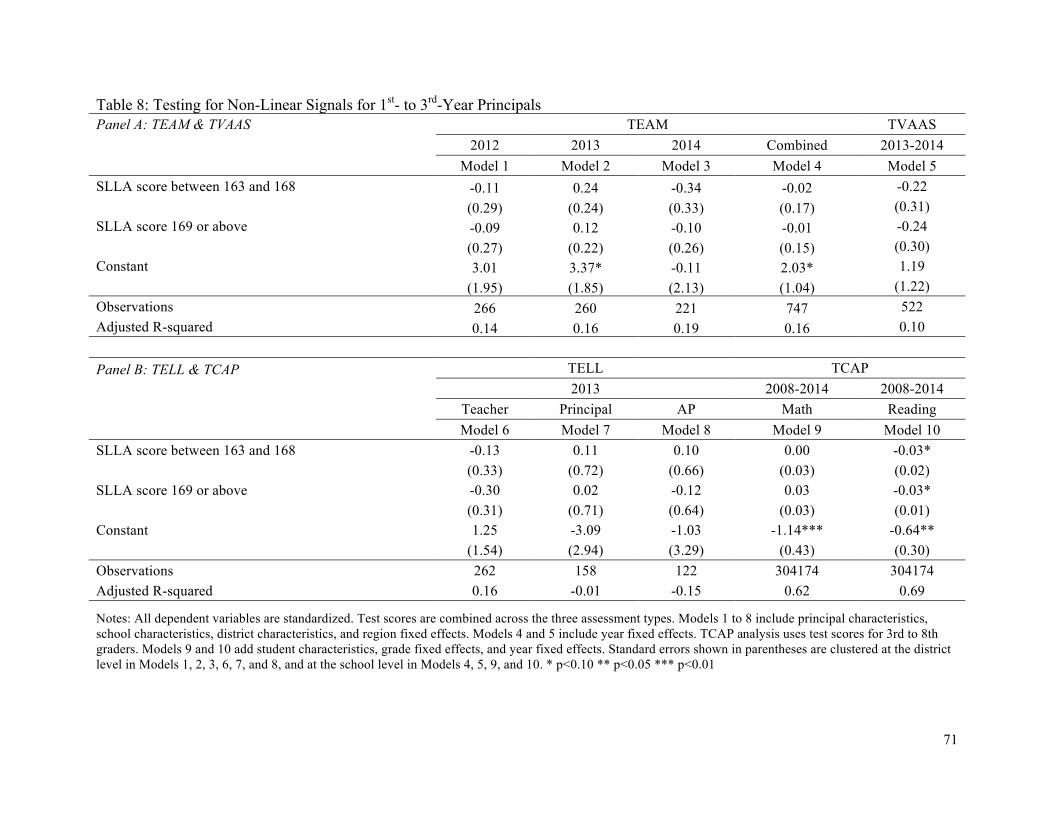
71
Table 8: Testing for Non-Linear Signals for 1st- to 3rd-Year Principals Panel A: TEAM & TVAAS TEAM TVAAS
2012 2013 2014 Combined 2013-2014 Model 1 Model 2 Model 3 Model 4 Model 5 SLLA score between 163 and 168 -0.11 0.24 -0.34 -0.02 -0.22
(0.29) (0.24) (0.33) (0.17) (0.31) SLLA score 169 or above -0.09 0.12 -0.10 -0.01 -0.24
(0.27) (0.22) (0.26) (0.15) (0.30) Constant 3.01 3.37* -0.11 2.03* 1.19 (1.95) (1.85) (2.13) (1.04) (1.22) Observations 266 260 221 747 522 Adjusted R-squared 0.14 0.16 0.19 0.16 0.10 Panel B: TELL & TCAP TELL TCAP
2013 2008-2014 2008-2014
Teacher Principal AP Math Reading Model 6 Model 7 Model 8 Model 9 Model 10 SLLA score between 163 and 168 -0.13 0.11 0.10 0.00 -0.03*
(0.33) (0.72) (0.66) (0.03) (0.02) SLLA score 169 or above -0.30 0.02 -0.12 0.03 -0.03*
(0.31) (0.71) (0.64) (0.03) (0.01) Constant 1.25 -3.09 -1.03 -1.14*** -0.64** (1.54) (2.94) (3.29) (0.43) (0.30) Observations 262 158 122 304174 304174 Adjusted R-squared 0.16 -0.01 -0.15 0.62 0.69
Notes: All dependent variables are standardized. Test scores are combined across the three assessment types. Models 1 to 8 include principal characteristics, school characteristics, district characteristics, and region fixed effects. Models 4 and 5 include year fixed effects. TCAP analysis uses test scores for 3rd to 8th graders. Models 9 and 10 add student characteristics, grade fixed effects, and year fixed effects. Standard errors shown in parentheses are clustered at the district level in Models 1, 2, 3, 6, 7, and 8, and at the school level in Models 4, 5, 9, and 10. * p<0.10 ** p<0.05 *** p<0.01
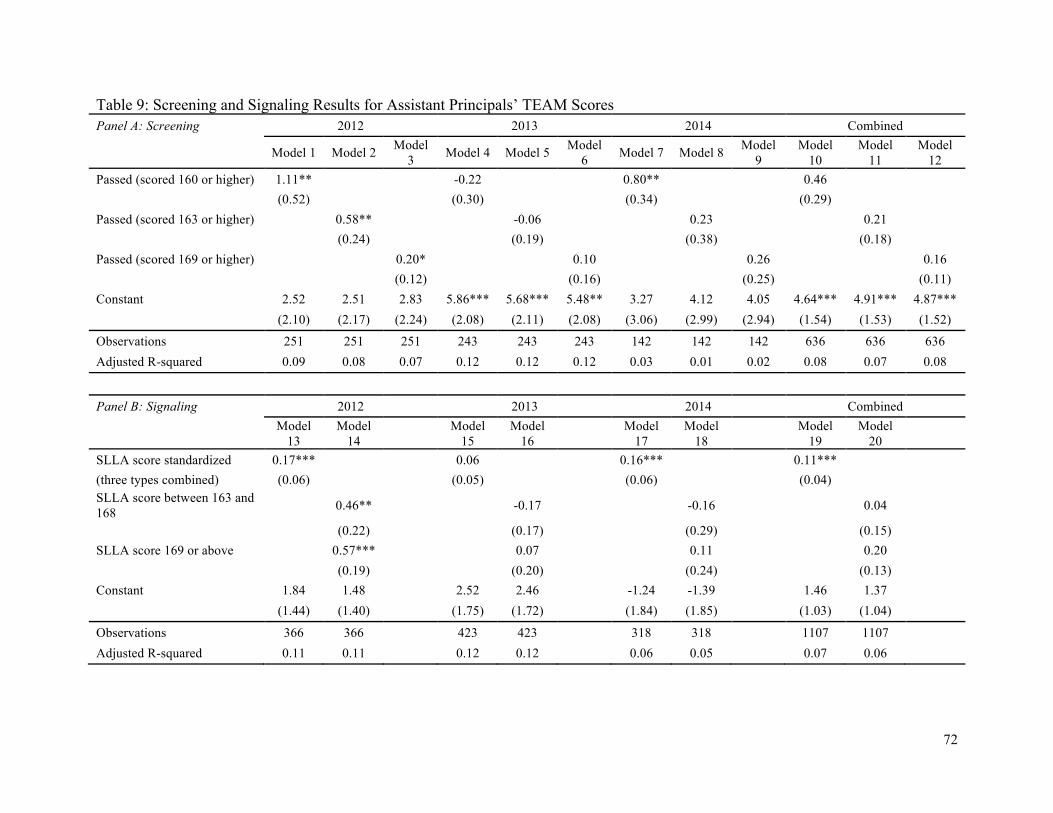
72
Table 9: Screening and Signaling Results for Assistant Principals’ TEAM Scores Panel A: Screening 2012 2013 2014 Combined
Model 1 Model 2 Model 3 Model 4 Model 5 Model
6 Model 7 Model 8 Model 9
Model 10
Model 11
Model 12
Passed (scored 160 or higher) 1.11**
-0.22
0.80**
0.46
(0.52)
(0.30)
(0.34)
(0.29) Passed (scored 163 or higher)
0.58**
-0.06
0.23
0.21
(0.24)
(0.19)
(0.38)
(0.18)
Passed (scored 169 or higher)
0.20*
0.10
0.26
0.16
(0.12)
(0.16)
(0.25)
(0.11) Constant 2.52 2.51 2.83 5.86*** 5.68*** 5.48** 3.27 4.12 4.05 4.64*** 4.91*** 4.87*** (2.10) (2.17) (2.24) (2.08) (2.11) (2.08) (3.06) (2.99) (2.94) (1.54) (1.53) (1.52)
Observations 251 251 251 243 243 243 142 142 142 636 636 636 Adjusted R-squared 0.09 0.08 0.07 0.12 0.12 0.12 0.03 0.01 0.02 0.08 0.07 0.08
Panel B: Signaling 2012 2013 2014 Combined
Model 13
Model 14 Model
15 Model
16 Model 17
Model 18 Model
19 Model
20
SLLA score standardized 0.17*** 0.06 0.16*** 0.11*** (three types combined) (0.06) (0.05) (0.06) (0.04) SLLA score between 163 and 168 0.46** -0.17
-0.16
0.04
(0.22) (0.17)
(0.29)
(0.15)
SLLA score 169 or above 0.57*** 0.07
0.11
0.20
(0.19) (0.20)
(0.24)
(0.13) Constant 1.84 1.48 2.52 2.46
-1.24 -1.39
1.46 1.37
(1.44) (1.40) (1.75) (1.72) (1.84) (1.85) (1.03) (1.04)
Observations 366 366 423 423 318 318 1107 1107 Adjusted R-squared 0.11 0.11 0.12 0.12 0.06 0.05 0.07 0.06

73
Notes: Screening analysis is based on test scores from SLLA 1010 only, which was required until 2008-09. Signaling analysis utilizes SLLA scores that are standardized and combined across test types (1010, 1011, 6011). TEAM scores are standardized. All screening models include school characteristics, district characteristics, and region fixed effects. All signaling models add characteristics of assistant principals. Models 10 to 12 and 19 and 20 include year fixed effects. Standard errors are clustered at the district level in Models 1 to 9 and 13 to 18, and at the school level in Models 10 to 12 and 19 and 20. * p<0.10, ** p<0.05, *** p<0.01
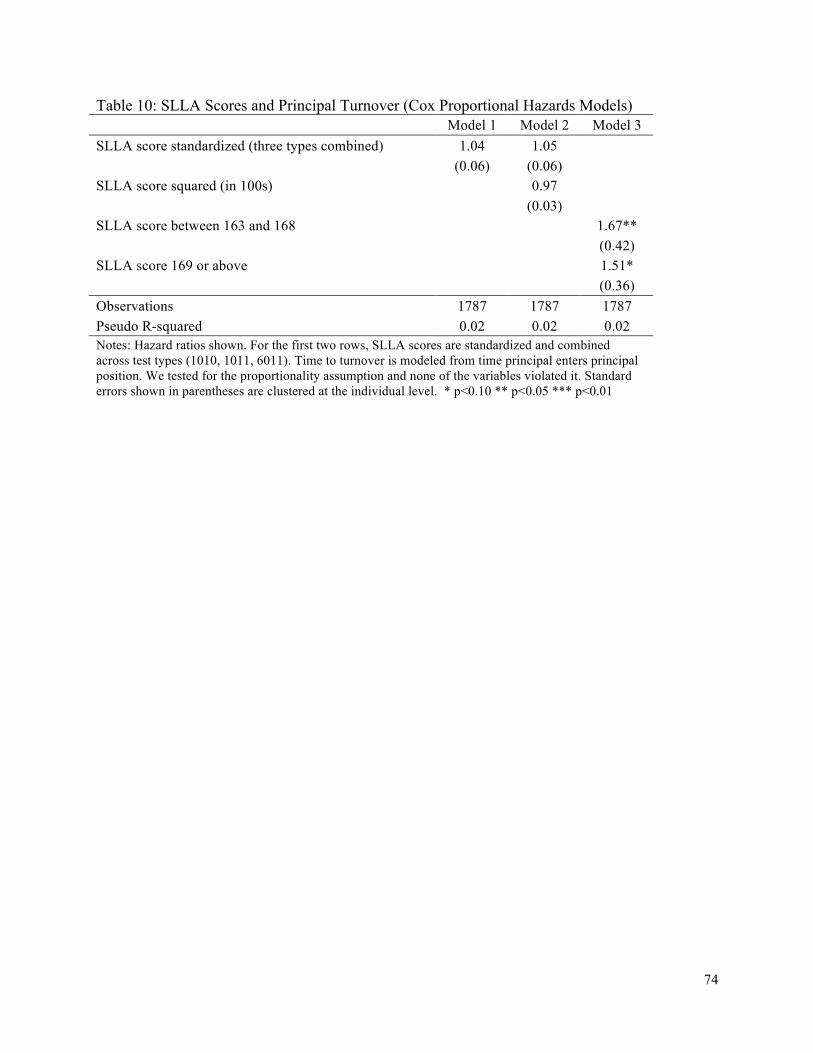
74
Table 10: SLLA Scores and Principal Turnover (Cox Proportional Hazards Models) Model 1 Model 2 Model 3 SLLA score standardized (three types combined) 1.04 1.05 (0.06) (0.06) SLLA score squared (in 100s) 0.97 (0.03) SLLA score between 163 and 168 1.67**
(0.42) SLLA score 169 or above 1.51* (0.36) Observations 1787 1787 1787 Pseudo R-squared 0.02 0.02 0.02 Notes: Hazard ratios shown. For the first two rows, SLLA scores are standardized and combined across test types (1010, 1011, 6011). Time to turnover is modeled from time principal enters principal position. We tested for the proportionality assumption and none of the variables violated it. Standard errors shown in parentheses are clustered at the individual level. * p<0.10 ** p<0.05 *** p<0.01