principal global investors funds · 2017-09-23 · principal global investors funds annual report...
TRANSCRIPT
An umbrella trust governed by the laws of Ireland
ANNUAL REPORT AND AUDITED FINANCIAL STATEMENTS
For the year ended 30 September 2008
PRINCIPAL GLOBAL
INVESTORS FUNDS
An umbrella trust governed by the laws of Ireland
Annual Report and Audited Financial Statements
For the year ended 30 September 2016
PRINCIPAL GLOBAL INVESTORS FUNDS
ANNUAL REPORT AND AUDITED FINANCIAL STATEMENTS FOR THE YEAR ENDED 30 SEPTEMBER 2016
CONTENTS
General Information 4 - 13
Investment Adviser’s Report
Independent Auditors’ Report
Depositary’s Report
14 - 25
26 - 27
28
Statement of Manager’s and Depositary’s Responsibilities 29
Portfolio of Investments Global Equity Fund (“GEF”) 30 - 32
Asian Equity Fund (“AEF”) 32 - 34
European Equity Fund (“EEF”) 35 - 37
Emerging Markets Equity Fund (“EMEF”) 38 - 40
Japanese Equity Fund (“JEF”) 40 - 41
Preferred Securities Fund (“PSF”) 42 - 48
U.S. Equity Fund (“USEF”) 49 - 50
High Yield Fund (“HYF”) 51 - 57
Global Property Securities Fund (“GPSF”) 58 - 59
Global Equity (ex-Japan) Fund (“GEJF”) 60 - 62
Post Global Limited Term High Yield Fund (“GLTHY”) 63 - 65
Global Time Diversified Absolute Return Fund (“GTDARF”) 66 - 67
Global Small Cap Equity Fund (“GSCEF”) 68 - 70
Origin Global Emerging Markets Fund (“OGEMF”) 70 - 72
Origin Global Equity Fund (“OGEF”) 72 - 74
Origin Global Smaller Companies Fund (“OGSCF”) 75 - 78
Long/Short Global Opportunities Equity Fund (“LSGOF”) 79 - 81
Claritas Latin American Equity Fund (“CLAF”) 81 - 83
Finisterre Emerging Market Debt Fund (“FEMDF”) 84 - 91
Spectrum Global Capital Securities Fund (“GCSF”) 92 - 93
Global Capital Structure Opportunities Fund (“CSOF”) 94 - 95
Global Credit Alpha Fund (“GCAF”) 96 - 98
Real Estate Debt Fund (“REDF”) 99
Statement of Financial Position as at 30 September 2016 100 – 105
Statement of Financial Position as at 30 September 2015 106 - 111
Statement of Comprehensive Income for the year ended 30 September 2016 112 – 114
Statement of Comprehensive Income for the year ended 30 September 2015 115 – 117
Statement of Movement in Net Assets Attributable to Redeemable
Participating Unitholders for the year ended 30 September 2016 118 – 120
Statement of Movement in Net Assets Attributable to Redeemable
Participating Unitholders for the year ended 30 September 2015 121 – 123
Notes to the Annual Report and Financial Statements 124 - 202
Supplementary Information (Unaudited)
Fund Performance & Leverage 203 – 212 Total Expense Ratios 213 – 214
UCITS V Remuneration Policy 215 – 221
PRINCIPAL GLOBAL INVESTORS FUNDS
ANNUAL REPORT AND AUDITED FINANCIAL STATEMENTS FOR THE YEAR ENDED 30 SEPTEMBER 2016
CONTENTS (continued)
Statement of Material Portfolio Changes (Unaudited) Global Equity Fund (“GEF”) 222
Asian Equity Fund (“AEF”) 223
European Equity Fund (“EEF”) 224
Emerging Markets Equity Fund (“EMEF”) 225
Japanese Equity Fund (“JEF”) 226
Preferred Securities Fund (“PSF”) 227
U.S. Equity Fund (“USEF”) 228
High Yield Fund (“HYF”) 229
Global Property Securities Fund (“GPSF”) 230
Global Equity (ex-Japan) Fund (“GEJF”) 231
Post Global Limited Term High Yield Fund (“GLTHY”) 232
Global Time Diversified Absolute Return Fund (“GTDARF”) 233
EDGE Small/Mid-Cap Equity Income Fund (“EEIF”) 234
Global Small Cap Equity Fund (“GSCEF”) 235
Origin Global Emerging Markets Fund (“OGEMF”) 236
Origin Global Equity Fund (“OGEF”) 237
Origin Global Smaller Companies Fund (“OGSCF”) 238
Long/Short Global Opportunities Equity Fund (“LSGOF”) 239
Claritas Latin American Equity Fund (“CLAF”) 240
Finisterre Emerging Market Debt Fund (“FEMDF”) 241
Spectrum Global Capital Securities Fund (“GCSF”) 242
Global Short Duration High Yield Fund (“SDHY”) 243
Global Capital Structure Opportunities Fund (“CSOF”) 244
Global Credit Alpha Fund (“GCAF”) 245
Real Estate Debt Fund (“REDF”) 246
Securities Financing Transaction Regulation (Unaudited)
247
Directory 248 – 249 Information for Investors in Switzerland 249 Enquiries 250
PRINCIPAL GLOBAL INVESTORS FUNDS
4
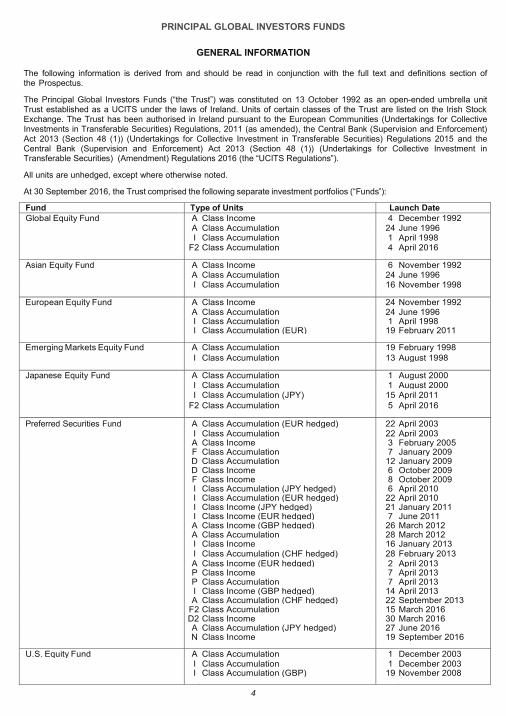
GENERAL INFORMATION
The following information is derived from and should be read in conjunction with the full text and definitions section of the Prospectus.
The Principal Global Investors Funds (“the Trust”) was constituted on 13 October 1992 as an open-ended umbrella unit Trust established as a UCITS under the laws of Ireland. Units of certain classes of the Trust are listed on the Irish Stock Exchange. The Trust has been authorised in Ireland pursuant to the European Communities (Undertakings for Collective Investments in Transferable Securities) Regulations, 2011 (as amended), the Central Bank (Supervision and Enforcement) Act 2013 (Section 48 (1)) (Undertakings for Collective Investment in Transferable Securities) Regulations 2015 and the Central Bank (Supervision and Enforcement) Act 2013 (Section 48 (1)) (Undertakings for Collective Investment in Transferable Securities) (Amendment) Regulations 2016 (the “UCITS Regulations”).
All units are unhedged, except where otherwise noted.
At 30 September 2016, the Trust comprised the following separate investment portfolios (“Funds”):
Fund
Type of Units
Launch Date Global Equity Fund A Class Income 4 December 1992
A Class Accumulation 24 June 1996 I Class Accumulation 1 April 1998 F2 Class Accumulation 4 April 2016 Asian Equity Fund A Class Income 6 November 1992 A Class Accumulation 24 June 1996 I Class Accumulation 16 November 1998 European Equity Fund A Class Income 24 November 1992 A Class Accumulation 24 June 1996 I Class Accumulation 1 April 1998 I Class Accumulation (EUR) 19 February 2011 Emerging Markets Equity Fund A Class Accumulation 19 February 1998 I Class Accumulation 13 August 1998 Japanese Equity Fund A Class Accumulation 1 August 2000 I Class Accumulation 1 August 2000 I Class Accumulation (JPY) 15 April 2011 F2 Class Accumulation 5 April 2016 Preferred Securities Fund A Class Accumulation (EUR hedged) 22 April 2003 I Class Accumulation 22 April 2003 A Class Income 3 February 2005 F Class Accumulation 7 January 2009 D Class Accumulation 12 January 2009 D Class Income 6 October 2009 F Class Income 8 October 2009 I Class Accumulation (JPY hedged) 6 April 2010 I Class Accumulation (EUR hedged) 22 April 2010 I Class Income (JPY hedged) 21 January 2011 I Class Income (EUR hedged) 7 June 2011 A Class Income (GBP hedged) 26 March 2012 A Class Accumulation 28 March 2012 I Class Income 16 January 2013 I Class Accumulation (CHF hedged) 28 February 2013 A Class Income (EUR hedged) 2 April 2013 P Class Income 7 April 2013 P Class Accumulation 7 April 2013 I Class Income (GBP hedged) 14 April 2013 A Class Accumulation (CHF hedged) 22 September 2013 F2 Class Accumulation 15 March 2016 D2 Class Income 30 March 2016 A Class Accumulation (JPY hedged) 27 June 2016 N Class Income 19 September 2016 U.S. Equity Fund A Class Accumulation 1 December 2003 I Class Accumulation 1 December 2003 I Class Accumulation (GBP) 19 November 2008

PRINCIPAL GLOBAL INVESTORS FUNDS
5
GENERAL INFORMATION (continued)
At 30 September 2016, the Trust comprised the following separate investment portfolios (“Funds”): (continued)
Fund Type of Units Launch Date
High Yield Fund I Class Accumulation 15 March 2004 A Class Accumulation 26 November 2009 I Class Accumulation (BRL hedged) 20 March 2013 I Class Accumulation (EUR hedged) 10 October 2013 A Class Income 27 June 2014 A Class Income (AUD hedged) 9 January 2015 D Class Accumulation 6 February 2015 F Class Accumulation 24 February 2016 Global Property Securities Fund I Class Accumulation (USD hedged) 20 April 2007 I Class Accumulation 27 November 2008 I2 Class Income 26 June 2014 I Class Income (JPY hedged) 18 May 2015 A
Clas Class Accumulation 22 January 2016
F Class Accumulation 20 April 2016
Global Equity (ex-Japan) Fund I Class Accumulation (JPY) 1 August 2008 I Class Accumulation 30 August 2010
Post Global Limited Term High Yield Fund
I Class Accumulation (JPY hedged) 4 May 2011 Fund I Class Accumulation (EUR hedged) 4 May 2011 I Class Accumulation 4 May 2011 I Class Accumulation (GBP hedged) 4 May 2011 I Class Income (GBP hedged) 5 June 2012 I Class Accumulation (CHF hedged) 8 September 2015 I2 Class Accumulation (EUR hedged) 6 October 2015 I2 Class Accumulation 6 October 2015 I2 Class Accumulation (GBP hedged) 6 October 2015 A Class Accumulation 9 February 2016 A Class Income 1 March 2016 I Class Accumulation (SGD hedged) 17 May 2016 I Class Income (EUR hedged) 23 August 2016 Global Time Diversified Absolute Return Fund
I Class Accumulation 2 January 2015 Fund EDGE Small/Mid-Cap Equity Income 11Fund
A Class Accumulation 1 May 2014 Fund* I
Class Accumulation 1 May 2014
Global Small Cap Equity Fund A Class Accumulation 22 October 2012 I Class Accumulation 22 October 2012 Origin Global Emerging Markets Fund I Class Accumulation (GBP) 15 April 2013 I Class Accumulation 31 January 2014 F2 Class Accumulation 4 April 2016 Origin Global Equity Fund I
Class Accumulation (GBP) 15 April 2013
Origin Global Smaller Companies Fund I Class Accumulation 15 April 2013 I Class Accumulation (GBP) 15 April 2013 Long/Short Global Opportunities Equity Fund
I Class Accumulation 8 August 2013 Fund
* EDGE Small/Mid-Cap Equity Income Fund terminated on 31 May 2016.

PRINCIPAL GLOBAL INVESTORS FUNDS
6
GENERAL INFORMATION (continued)
At 30 September 2016, the Trust comprised the following separate investment portfolios (“Funds”): (continued)
Fund Type of Units Launch Date
Claritas Latin American Equity Fund I Class Accumulation 23 September 2013 Finisterre Emerging Market Debt Fund I Class Accumulation 4 October 2013 I2 Class Income (EUR hedged) 24 April 2014 I Class Accumulation (EUR hedged) 29 May 2014 I Class Accumulation (GBP hedged) 26 March 2015 A Class Accumulation 26 March 2015 A Class Accumulation (EUR hedged) 26 March 2015 A Class Accumulation (GBP hedged) 26 March 2015 A Class Accumulation (CHF hedged) 26 March 2015 A Class Accumulation (SGD hedged) 26 March 2015 A Class Income 2 April 2015 Spectrum Global Capital Securities Fund I Class Accumulation 30 October 2014 I Class Accumulation (EUR hedged) 7 August 2015 A Class Accumulation 22 August 2016 Global Short Duration High Yield Fund** I Class Accumulation 10 December 2014 Global Capital Structure Opportunities I Class Accumulation 11 December 2014 Fund Global Credit Alpha Fund I Class Accumulation 23 June 2015 Real Estate Debt Fund*** I Class Income 21 March 2016 I Class Accumulation 21 March 2016
**Global Short Duration High Yield Fund terminated on 1 July 2016. ***Real Estate Debt Fund launched on 21 March 2016.
PRINCIPAL GLOBAL INVESTORS FUNDS
7
GENERAL INFORMATION (continued)
Principal Global Investors (Ireland) Limited (the “Manager”) may, with the prior consent of the Central Bank and approval of the Trustee and the Board of Directors of the Manager, add additional Funds.
The financial statements are published on the www.principalglobal.com website. The Directors, together with the Manager and Investment Adviser are responsible for the maintenance and integrity of the financial information included on this website.
PRICES There will be a single price for buying, selling and switching units in each of the Funds. This will be represented by the Net Asset Value per Unit rounded to the nearest cent (less/plus duties and charges where applicable).
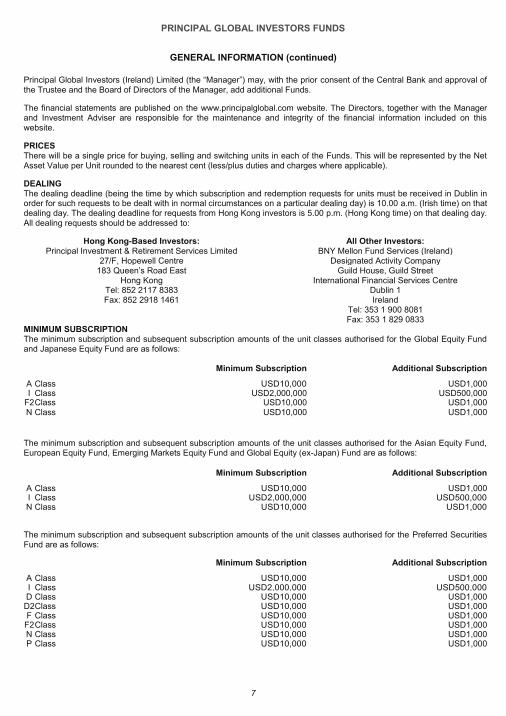
DEALING The dealing deadline (being the time by which subscription and redemption requests for units must be received in Dublin in order for such requests to be dealt with in normal circumstances on a particular dealing day) is 10.00 a.m. (Irish time) on that dealing day. The dealing deadline for requests from Hong Kong investors is 5.00 p.m. (Hong Kong time) on that dealing day. All dealing requests should be addressed to:
Hong Kong-Based Investors: All Other Investors: Principal Investment & Retirement Services Limited BNY Mellon Fund Services (Ireland)
27/F, Hopewell Centre Designated Activity Company 183 Queen’s Road East Guild House, Guild Street
Hong Kong International Financial Services Centre Tel: 852 2117 8383 Dublin 1 Fax: 852 2918 1461 Ireland
Tel: 353 1 900 8081 Fax: 353 1 829 0833
MINIMUM SUBSCRIPTION The minimum subscription and subsequent subscription amounts of the unit classes authorised for the Global Equity Fund and Japanese Equity Fund are as follows: Minimum Subscription Additional Subscription
A Class USD10,000 USD1,000 I Class USD2,000,000 USD500,000
F2 Class USD10,000 USD1,000 N Class USD10,000 USD1,000
The minimum subscription and subsequent subscription amounts of the unit classes authorised for the Asian Equity Fund, European Equity Fund, Emerging Markets Equity Fund and Global Equity (ex-Japan) Fund are as follows:
Minimum Subscription Additional Subscription
A Class USD10,000 USD1,000 I Class USD2,000,000 USD500,000 N Class USD10,000 USD1,000
The minimum subscription and subsequent subscription amounts of the unit classes authorised for the Preferred Securities Fund are as follows:
Minimum Subscription Additional Subscription
A Class USD10,000 USD1,000 I Class USD2,000,000 USD500,000 D Class USD10,000 USD1,000 D2 Class USD10,000 USD1,000 F Class USD10,000 USD1,000 F2 Class USD10,000 USD1,000 N Class USD10,000 USD1,000 P Class USD10,000 USD1,000
PRINCIPAL GLOBAL INVESTORS FUNDS
8
GENERAL INFORMATION (continued)
MINIMUM SUBSCRIPTION (continued)
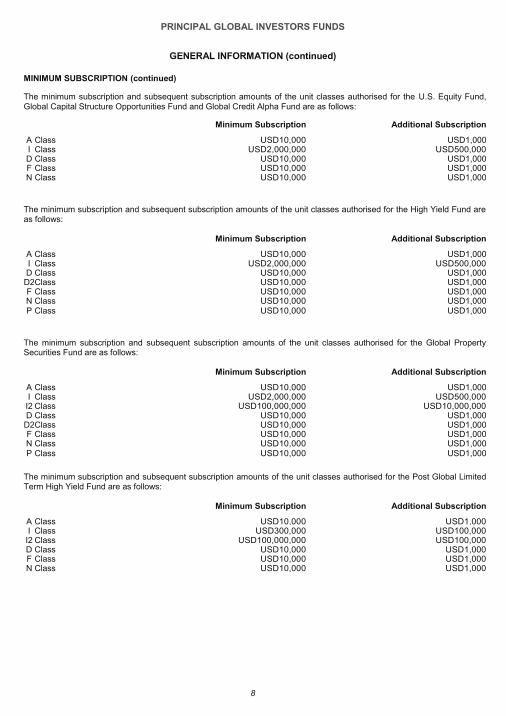
The minimum subscription and subsequent subscription amounts of the unit classes authorised for the U.S. Equity Fund, Global Capital Structure Opportunities Fund and Global Credit Alpha Fund are as follows:
Minimum Subscription Additional Subscription
A Class USD10,000 USD1,000 I Class USD2,000,000 USD500,000 D Class USD10,000 USD1,000 F Class USD10,000 USD1,000 N Class USD10,000 USD1,000
The minimum subscription and subsequent subscription amounts of the unit classes authorised for the High Yield Fund are as follows: Minimum Subscription Additional Subscription
A Class USD10,000 USD1,000 I Class USD2,000,000 USD500,000 D Class USD10,000 USD1,000 D2 Class USD10,000 USD1,000 F Class USD10,000 USD1,000 N Class USD10,000 USD1,000 P Class USD10,000 USD1,000
The minimum subscription and subsequent subscription amounts of the unit classes authorised for the Global Property Securities Fund are as follows: Minimum Subscription Additional Subscription
A Class USD10,000 USD1,000 I Class USD2,000,000 USD500,000 I2 Class USD100,000,000 USD10,000,000 D Class USD10,000 USD1,000 D2 Class USD10,000 USD1,000 F Class USD10,000 USD1,000 N Class USD10,000 USD1,000 P Class USD10,000 USD1,000
The minimum subscription and subsequent subscription amounts of the unit classes authorised for the Post Global Limited Term High Yield Fund are as follows:
Minimum Subscription Additional Subscription
A Class USD10,000 USD1,000 I Class USD300,000 USD100,000 I2 Class USD100,000,000 USD100,000 D Class USD10,000 USD1,000 F Class USD10,000 USD1,000 N Class USD10,000 USD1,000
PRINCIPAL GLOBAL INVESTORS FUNDS
9
GENERAL INFORMATION (continued)
MINIMUM SUBSCRIPTION (continued)
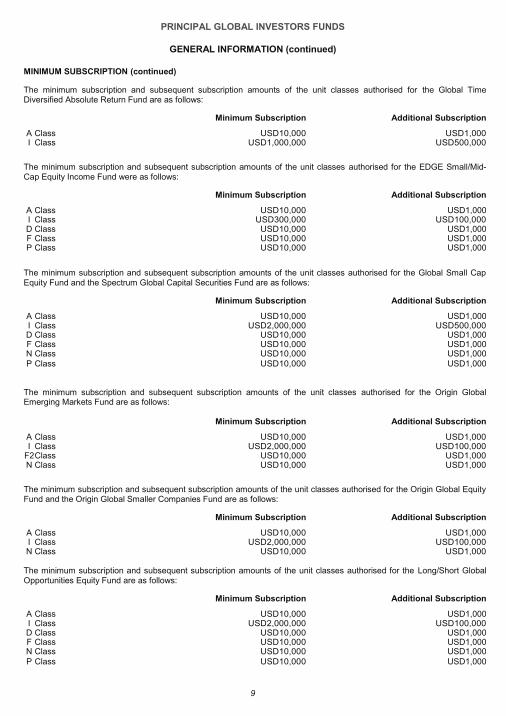
The minimum subscription and subsequent subscription amounts of the unit classes authorised for the Global Time Diversified Absolute Return Fund are as follows:
Minimum Subscription Additional Subscription
A Class USD10,000 USD1,000 I Class USD1,000,000 USD500,000
The minimum subscription and subsequent subscription amounts of the unit classes authorised for the EDGE Small/Mid-Cap Equity Income Fund were as follows:
Minimum Subscription Additional Subscription
A Class USD10,000 USD1,000 I Class USD300,000 USD100,000 D Class USD10,000 USD1,000 F Class USD10,000 USD1,000 P Class USD10,000 USD1,000
The minimum subscription and subsequent subscription amounts of the unit classes authorised for the Global Small Cap Equity Fund and the Spectrum Global Capital Securities Fund are as follows:
Minimum Subscription Additional Subscription
A Class USD10,000 USD1,000 I Class USD2,000,000 USD500,000 D Class USD10,000 USD1,000 F Class USD10,000 USD1,000 N Class USD10,000 USD1,000 P Class USD10,000 USD1,000
The minimum subscription and subsequent subscription amounts of the unit classes authorised for the Origin Global Emerging Markets Fund are as follows:
Minimum Subscription Additional Subscription
A Class USD10,000 USD1,000 I Class USD2,000,000 USD100,000
F2 Class USD10,000 USD1,000 N Class USD10,000 USD1,000
The minimum subscription and subsequent subscription amounts of the unit classes authorised for the Origin Global Equity Fund and the Origin Global Smaller Companies Fund are as follows:
Minimum Subscription Additional Subscription
A Class USD10,000 USD1,000 I Class USD2,000,000 USD100,000 N Class USD10,000 USD1,000
The minimum subscription and subsequent subscription amounts of the unit classes authorised for the Long/Short Global Opportunities Equity Fund are as follows:
Minimum Subscription Additional Subscription
A Class USD10,000 USD1,000 I Class USD2,000,000 USD100,000 D Class USD10,000 USD1,000 F Class USD10,000 USD1,000 N Class USD10,000 USD1,000 P
Class USD10,000 USD1,000
PRINCIPAL GLOBAL INVESTORS FUNDS
10
GENERAL INFORMATION (continued)
MINIMUM SUBSCRIPTION (continued)
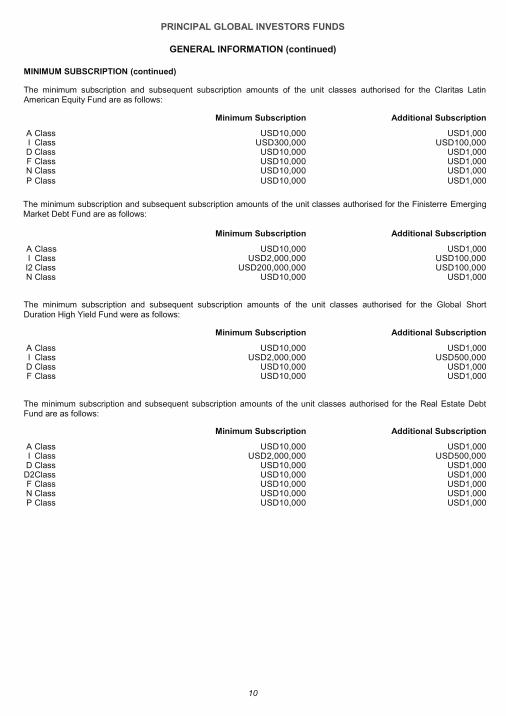
The minimum subscription and subsequent subscription amounts of the unit classes authorised for the Claritas Latin American Equity Fund are as follows:
Minimum Subscription Additional Subscription
A Class USD10,000 USD1,000 I Class USD300,000 USD100,000 D Class USD10,000 USD1,000 F Class USD10,000 USD1,000 N Class USD10,000 USD1,000 P Class USD10,000 USD1,000
The minimum subscription and subsequent subscription amounts of the unit classes authorised for the Finisterre Emerging Market Debt Fund are as follows:
Minimum Subscription Additional Subscription
A Class USD10,000 USD1,000 I Class USD2,000,000 USD100,000 I2 Class USD200,000,000 USD100,000 N Class USD10,000 USD1,000
The minimum subscription and subsequent subscription amounts of the unit classes authorised for the Global Short Duration High Yield Fund were as follows:
Minimum Subscription Additional Subscription
A Class USD10,000 USD1,000 I Class USD2,000,000 USD500,000 D Class USD10,000 USD1,000 F Class USD10,000 USD1,000
The minimum subscription and subsequent subscription amounts of the unit classes authorised for the Real Estate Debt Fund are as follows:
Minimum Subscription Additional Subscription
A Class USD10,000 USD1,000 I Class USD2,000,000 USD500,000 D Class USD10,000 USD1,000 D2 Class USD10,000 USD1,000 F Class USD10,000 USD1,000 N Class USD10,000 USD1,000 P Class USD10,000 USD1,000
PRINCIPAL GLOBAL INVESTORS FUNDS
11
GENERAL INFORMATION (continued)
DISTRIBUTIONS AND DISTRIBUTOR STATUS The Trust Deed provides for the Manager to decide to make, and for the Trustee on each distribution date to make, distributions among holders of income units in each of the Funds. It is the intention of the Manager to make distributions to the extent that they are covered by income received from underlying investments. It is also the intention of the Manager that distributions will be declared on 30 September each year or nearest business day for all income unit classes where possible. Quarterly distributions will be payable in respect of the A, I, D, F, N and P Income Unit Classes on the Preferred Securities Fund, the A Income Unit Classes on the High Yield Fund, the A and I Income Unit Classes on the Post Global Limited Term High Yield Fund and the I Income Unit Class on the Real Estate Debt Fund. Monthly distributions will be payable in respect of the D2 Income Unit Classes on the Preferred Securities Fund, High Yield Fund, Global Property Securities Fund and Real Estate Debt Fund.
CORPORATE GOVERNANCE The Board of Directors has adopted and applied the Irish Funds (“IF”) Corporate Governance Code for the year ended 30 September 2016.
CONNECTED PERSONS Irish UCITS Regulations 2015, Section 41, Restrictions on transactions with connected persons - requires that any transaction carried out with a UCITS by a promoter, manager, trustee, depositary, investment adviser and/or associated or group companies of these (“connected persons”) must be carried out as if negotiated at arm’s length. Transactions must be in the best interests of the Unitholders.
The Board of Directors has been informed of the connected person transactions in relation to the Trust, and has been provided with evidence they were conducted on an arm’s length basis, and with sufficient information to conclude they were conducted in investors’ best interests.
SIGNIFICANT EVENTS DURING THE YEAR On 27 January 2016, the Administrator, BNY Mellon Fund Services (Ireland) Limited converted to a designated activity company under the Companies Act 2014 and changed its name to BNY Mellon Fund Services (Ireland) Designated Activity Company.
In response to the CBI publishing the Central Bank (Supervision and Enforcement) Act 2013 (Section 48(1)) Investor Money Regulations 2015 for Fund Service Providers (the “Investor Money Regulations” or “IMR”) in March 2015 (effective from 1 July 2016), the Investment Manager undertook, together with BNY Mellon Fund Services (Ireland) Designated Activity Company a review of the way in which subscription, distribution and redemption monies are channelled to and from the Trust. As a result of this review, subscription and redemption monies will (effective from 1 July 2016), be channelled through an umbrella cash collection account in the name of the Trust and, in respect of any sub-funds considered to be highly leveraged, sub-fund cash collection accounts in the name of the relevant sub-fund(s). Pending issue of the units and/or payment of subscription proceeds to an account in the name of the Trust or the relevant sub-fund(s), and pending payment of redemption proceeds or distributions, the relevant investor will be an unsecured creditor of the relevant sub-fund in respect of amounts paid by or due to it. For the avoidance of doubt the sub-funds of the Trust are not considered highly leveraged.
The Trust deed and Prospectus of the PGIF Umbrella have been amended in accordance with the requirement of the EU Directive 2014/91/EU (“UCITS V”) and the Prospectus updated in line with current regulatory standards. These documents and the relevant Fund Supplements were noted by the Central Bank of Ireland on 30 March 2016. In accordance with the requirements of UCITS V: BNY Mellon Trust Company (Ireland) Limited was the Custodian for the Funds until 17 March 2016 and from 18 March 2016 will assume the role of Depositary for the Funds.
Supplement changes
· Global Equity Fund - addition of F2 class on 20 October 2015.
· Japanese Equity Fund - addition of F2 class on 20 October 2015.
· Preferred Securities Fund - addition of F2 class and clarification of existing hedging strategy on 20 October 2015.
· Origin Global Emerging Markets Fund - addition of F2 class on 20 October 2015.
· Preferred Securities Fund - addition of monthly distributing D2 class – 6 November 2015.
· High Yield Fund - addition of monthly distributing D2 class - 6 November 2015.
· Global Property Securities Fund - addition of monthly distributing D2 class - 6 November 2015.
· Preferred Securities Fund - clarification of hedging arrangements, Monthly income distributing share class USD on 30 March 2016.
· Preferred Securities Fund - addition of JPY and Singapore dollar hedged share classes on 30 March 2016.
PRINCIPAL GLOBAL INVESTORS FUNDS
12
GENERAL INFORMATION (continued)
SIGNIFICANT EVENTS DURING THE YEAR (continued) Supplement changes (continued)
· Global Property Securities Fund - clarification of hedging arrangements, Monthly income distributing share class USD on 30 March 2016.
· Post Global Limited Term High Yield Fund - clarification of hedging arrangements on 30 March 2016.
· Post Global Limited Term High Yield Fund - addition of I2 share class on 30 March 2016.
· Post Global Limited Term High Yield Fund - addition of A Income share class on 30 March 2016.
· High Yield Fund F class management fee rate changed from 0.75% to 0.65% effective from 30 August 2016.
· Global Property Securities Fund F class management fee rate changed from 1.00% to 0.80% effective from 30 August 2016.
· Origin Global Emerging Markets Fund F2 class management fee rate changed from 0.75% to 0.85% effective from 30 August 2016.
· Launch of trail free N classes across all PGIF funds effective from 30 August 2016.
· Changes were made to reflect the requirements of the Irish Investor Money Regulations (Fund Asset Model) adopted by the Management Company effective from 30 August 2016.
· New Trustee fee rates were agreed as part of the UCITS V implementation programme effective from 1 July 2016.
Launches during the year:
Fund
· Real Estate Debt Fund launched on 21 March 2016.
Share Class
· Post Global Limited Term High Yield Fund I2 Class Accumulation 6 October 2015. · Post Global Limited Term High Yield Fund EUR Hedged I2 Class Accumulation 6 October 2015. · Post Global Limited Term High Yield Fund GBP Hedged I2 Class Accumulation 6 October 2015. · Global Property Securities Fund A Class Accumulation 22 January 2016. · Post Global Limited Term High Yield Fund A Class Accumulation 9 February 2016. · High Yield Fund F Class Accumulation 24 February 2016. · Post Global Limited Term High Yield Fund A Class Income 1 March 2016 via a full switch out of the Post Global
Limited Term High Yield Fund A Class Accumulation Units. · Preferred Securities Fund USD F2 Class Accumulation 15 March 2016. · Real Estate Debt Fund USD I Class Income 21 March 2016. · Real Estate Debt Fund USD I Class Accumulation 21 March 2016. · Preferred Securities Fund USD D2 Class Accumulation 30 March 2016. · Global Equity Fund USD F2 Class Accumulation 4 April 2016. · Origin Global Emerging Markets Fund USD F2 Class Accumulation 4 April 2016. · Japanese Equity Fund USD F2 Class Accumulation 5 April 2016. · Global Property Securities Fund USD F Class Accumulation 20 April 2016. · Post Global Limited Term High Yield Fund SGD Hedged I Class Accumulation 17 May 2016. · Preferred Securities Fund JPY Hedged A Class Accumulation 27 June 2016. · Spectrum Global Capital Securities Fund USD A Class Accumulation 22 August 2016. · Post Global Limited Term High Yield Fund EUR Hedged I Class Income 23 August 2016. · Preferred Securities Fund USD N Class Income 19 September 2016.
Closures during the year
Funds
· EDGE Small/Mid-Cap Equity Income Fund terminated on 31 May 2016. · Global Short Duration High Yield Fund terminated on 1 July 2016.
Share Class
· Global Property Securities Fund USD F Class Accumulation 16 March 2016. · Global Property Securities Fund USD A Class Accumulation 20 May 2016. · Finisterre Emerging Market Debt Fund EUR Hedged I Class Accumulation 26 August 2016.
PRINCIPAL GLOBAL INVESTORS FUNDS
13
GENERAL INFORMATION (continued)
SIGNIFICANT EVENTS AFTER THE YEAR END
Supplement changes
· Global Equity Fund - I class management fee rate change from a tiered structure to 0.75% effective from 30 November 2016.
· Asian Equity Fund - I class management fee rate change from a tiered structure to 0.75% effective from 30 November 2016.
· European Equity Fund - I class management fee rate change from a tiered structure to 0.75% effective from 30 November 2016.
· Emerging Markets Equity Fund - I class management fee rate change from a tiered structure to 0.75% effective from 30 November 2016.
· Japanese Equity Fund - I class management fee rate change from a tiered structure to 0.75% effective from 30 November 2016.
· U.S. Equity Fund - I class management fee rate change from a tiered structure to 0.75% effective from 30 November 2016.
· High Yield Fund - D, D2 and I class management fee rate change from 0.75% to 0.65% effective from 30 November 2016.
· Global Property Securities Fund - I class management fee rate change from a tiered structure to 0.80% effective from 30 November 2016.
· Global Equity Fund (Ex Japan) - I class management fee rate change from a tiered structure to 0.75% effective from 30 November 2016.
· Global Time Diversified Absolute Return Fund - I class management fee rate change from 1.50% to 1.00% effective from 30 November 2016.
· Global Small Cap Equity Fund - I class management fee rate change from a tiered structure to 0.75% effective from 30 November 2016.
· Origin Global Emerging Markets Fund - I class management fee rate change from 1.00% to 0.85% effective from 30 November 2016.
· Origin Global Equity Fund - I class management fee rate change from 0.65% to 0.75% effective from 30 November 2016.
· Origin Global Smaller Companies Fund - I class management fee rate change from 1.00% to 0.85% effective from 30 November 2016.
· Long/Short Global Opportunities Equity Fund - I class management fee rate change from 1.00% to 0.85% effective from 30 November 2016.
· Changes were made to comply with the CBI’s gating language requirements on 1 November 2016. The new language does not give priority to redemptions not fully completed and rolled over to the next business day.
PRINCIPAL GLOBAL INVESTORS FUNDS
INVESTMENT ADVISER’S REPORT
for the year ended 30 September 2016
14
Global Equity Fund
For the 12 months ending 30 September 2016, the Global Equity Fund reported net performance of 5.92% compared to 11.96% for the benchmark, MSCI AC World Index.
With the exception of a few European markets and Japan, market performance for the full year was generally disappointing, especially for emerging markets. The disparity of returns across countries, sectors and style classifications was striking. Emerging markets as a group underperformed their developed peers by over 14% for the year, with Latin America and the EEMEA block faring even worse.
From a global sector perspective, Technology, Health Care and Consumer stocks all delivered broad based gains, while the Energy and Materials complex suffered deep losses for the year despite a fleeting bounce early in the fourth quarter. In the U.S., the largest tier of companies outpaced smaller cap shares, reflecting a low degree of breadth. Conversely, in international markets, small caps shined, outpacing their large company peers by average margins exceeding 8% for the year.
For the 12 months under review, the Fund posted a positive absolute return of 5.92%. Within the portfolio, all sectors were positive except for Materials, Industrials and Real Estate. Within the top contributing sector, Telecommunication Services, Nippon Telegraph and Telephone and NTT DoCoMo out of Japan were the standout performers. Adidas AG was a top performer within the portfolio overall. Fundamental change at Adidas comes in the form of less drag from weak performing segments, solid industry growth for sports apparel and footwear, a move to increase direct sales to the consumer, high profile sporting events in 2016 that allow for good exposure, a move toward automation and management changes and optionality. Other top contributors over the past year were Qualicorp, Kinross Gold and 3i Group.
On the other hand, the portfolio was negatively impacted by holdings within the Materials sector, particularly Barrick Gold and BHP Billiton. After significant share appreciation in 2016, share prices for gold companies pulled back with a further headwind coming in the form of the expectation for rate hikes to continue by year end. Specific to the portfolio, Barrick Gold was the largest detractor. Other top detractors over the year were ConocoPhillips, Leidos Holdings, Boeing Company, AMN Healthcare Services and JBS. 2016 has provided challenges for “Growth at a Reasonable Price” (“GARP”) investing. However, the good news is that the customary growth premiums and valuation discounts embedded in our portfolios are among the best we have seen in quite some time, providing extremely compelling opportunities on a forward looking basis once GARP style attributes inevitably return to favour.
The Fund continues to emphasize on stocks with improving business fundamentals, rising investor expectations and attractive relative valuations. Stock selection remains the primary source of outperformance, and we continue to primarily focus on large and mid-cap companies with selective exposure to smaller companies. The portfolio continues to pursue its “borderless” approach across a truly global opportunity set of both developed and emerging markets. We invest where we see the most compelling growth opportunities with attractive valuations, rather than positioning in relation to a market index.
Asian Equity Fund
For the 12 months ending 30 September 2016, the Asian Equity Fund reported net performance of 13.68% compared to 16.84% for the benchmark, MSCI AC Asia ex-Japan Index.
During the last 12 months, the most significant contributors to performance were Alibaba Group, the largest e-commerce player in China; Tencent Holdings, a leading Chinese internet platform; and Telekomunikasi Indonesia, the largest telecom operator in Indonesia. The most significant detractors were China Taiping Insurance Holdings Co., a relatively small insurer in China; NetEase, Inc., a Chinese gaming and internet media platform; and Shinsegae Co., a South Korean retailer.
The Asia region detracted from relative performance during the last twelve months. Strong stock selection in China was offset by losses in India, South Korea, and Taiwan. The Pacific region also underperformed the benchmark primarily driven by stock selection in Hong Kong. Being underweight Singapore helped the portfolio as the country underperformed the region.
Looking to the future, we remain cautious on most of the region except Indonesia where the outlook has brightened a little. The Indian economy also remains in an extended bottoming out process which continued in September. We remain structurally positive and overweight India. Taiwan remains attractive with its high dividend yield, strong free cash flow and liquidity supports, therefore we remain overweight the country. The information technology sector continues to lead the “new economy” and is now the largest sector in the MSCI Emerging Markets Index. We remain overweight in the sector.
PRINCIPAL GLOBAL INVESTORS FUNDS
INVESTMENT ADVISER’S REPORT
for the year ended 30 September 2016 (continued)
15
European Equity Fund
For the 12 months ending 30 September 2016, the European Equity Fund reported net performance of 2.26% compared to 2.49% for the benchmark, MSCI Europe Index.
During the year under review, we saw very positive stock selection in the Financial and Technology sectors, as well as in France. French manufacturer of computer games Ubisoft rallied 86% reflecting strong sales of new games following the introduction of new hardware to the sector. Vestas, the Danish manufacturer of wind turbines, rose 60%. In addition, Danish healthcare group Genmab rallied 85% after their anti-CD38 monoclonal antibody for the treatment of multiple myeloma demonstrated very positive results. We saw negative attribution in the U.K. as the market was very volatile both ahead of and after the Brexit referendum. In addition we saw negative attribution in the Consumer Discretionary and Industrial sectors.
European equity markets enjoyed strong, broad based gains during the end of the year under review, following the turbulence seen in the market in the lead up to and immediately following the Brexit referendum. Markets rebounded sharply following the initial jolt from the referendum result at the end of June. The quarter also featured better than expected corporate earnings performance in most areas, including signs of stabilizing earnings trends in the previously beleaguered energy and commodity linked industries.
Within Europe, quantitative easing by the European Central Bank (“ECB”) and the Bank of England (“BoE”) remains a key theme, even more so now with the unknown ramifications of the Brexit vote on economic growth. While it will take time for this to play out, the question remains if this will end up being a soft or hard “Brexit” following Prime Minister Theresa May’s initiative to invoke Article 50 in March of 2017. As more becomes known from the fall out, the Central Banks have made it known they’re ready to act wherever is needed. With a wave of slowing global growth, the region is likely to be reliant on better domestic spending, corporate profitability and margin expansion leading to stable growth. While a weak euro would be welcomed to enhance growth, the lower level yields could prove problematic for banks.
2016 has provided challenges for earnings focused investing as investors have swung between the extremes of deep value commodity related companies that pose an insolvency risk and very richly valued, low growth, defensive dividend paying “bond proxy” stocks. However, the Fund remains true to our investment philosophy and maintains our focus on bottom up stock selection rather than top down macro calls. The good news is that the customary growth premiums and valuation discounts embedded in our portfolios are among the best we have seen in quite some time, providing extremely compelling opportunities on a forward looking basis once earnings style attributes inevitably return to favour.
We continue to be optimistic for equity markets over the long run, based on earnings, margin growth, as well as favourable comparisons to bonds. However, our view is tempered by potential capital flows, liquidity risks that may arise globally, as well as the outlook for Central Bank policies. Bond yields continue to hover around historic lows with downward pressure coming from global growth concerns, Central Banks’ credibility and investors reach for yield. The tyranny of “lower for longer” interest rates is likely to remain for some time and has led to defensive “bond proxy” type stocks trading near all-time high relative valuations. In the long run, it is earnings that matter most to shareholders, and that truism will remain our focus and mantra.
Emerging Markets Equity Fund
For the 12 months ending 30 September 2016, the Emerging Markets Equity Fund reported net performance of 12.85% compared to 16.78% for the benchmark, MSCI Emerging Markets Index.
During the 12 months, the most significant contributors to performance were Itausa-Investimentos Itau, the largest private financial institution in Brazil; Telekomunikasi Indonesia, the largest telecom operator in Indonesia; and Taiwan Semiconductor Manufacturing Co., the largest semi-conductor foundry in the world. The most significant detractors were JBS S.A., a food company headquartered in Brazil; Petrobras, a Brazilian company engaged in oil and gas exploration, production, and distribution activities; and Fubon Financial, a Taiwan financial conglomerate.
EMEA was the best performing region on a relative basis. Underweighting Poland, Qatar, and Greece provided significant gains with these countries all declining, while South Africa, the Czech Republic, and Russia detracted from performance.
Relative performance in Asia added to performance during the last twelve months. China, led by information technology, the Philippines, and Indonesia contributed to performance while India, Malaysia, and Taiwan were notable detractors.
Latin America detracted from relative performance, held back by the surge in Brazil, which was underweighted in our portfolio. Energy, financials, and consumer discretionary sectors were up almost triple digits during the twelve months. Mexico and Peru were slight detractors while Colombia and Chile were in-line with the index.
PRINCIPAL GLOBAL INVESTORS FUNDS
INVESTMENT ADVISER’S REPORT
for the year ended 30 September 2016 (continued)
16
Emerging Markets Equity Fund (continued)
Looking to the future, we remain cautious on most of the ASEAN region except Indonesia where the outlook has brightened a little. The Indian economy also remains in an extended bottoming out process which continued in September. We remain structurally positive and overweight India. Taiwan remains attractive with its high dividend yield, strong free cash flow and liquidity supports, therefore we remain overweight the country. The information technology sector continues to lead the “new economy” and is now the largest sector in the MSCI Emerging Markets Index. We remain overweight in the sector. After the first presidential debate, Mexico reversed the earlier losses leading up to the debate as Donald Trump was rising in the polls, with Hillary Clinton deemed the consensus winner. Hillary Clinton would be more positive for the Mexican market, but Mexico still remains challenged with growth showing signs of slowing.
Japanese Equity Fund
For the 12 months ending 30 September 2016, the Japanese Equity Fund reported net performance of 9.15% compared to 12.13% for the benchmark, MSCI Japan Index.
The portfolio underperformed the MSCI Japan Index during the period. Stock selection in the consumer staples and telecommunication services sectors was most effective, while stock selections in the industrials and financials sectors were less effective.
Our investment process and portfolio style characteristics faced significant headwind in the early half of the period when the market sharply reversed, led by the riskiest and most neglected groups of companies.
An overweight position in Lion Corporation contributed strongly to performance in the period as the stock was up +82.44% in USD terms. An underweight position in Nintendo Co., Ltd had a negative impact on the portfolio in the period as the security was up 58.16% in USD terms. At the end of September, the portfolio’s most overweight positions included Mitsui & Co, Toho Gas Co., ORIX Corporation, and Haseko Corporation.
A generally unhelpful backdrop for corporate earnings continues. Financial sector earnings remain under the most pressure. High debt levels, low growth, weak investment and interest rate policies are all serving to reduce revenue opportunities for banks in particular. Regulation remains a headwind as well. Japanese companies with overseas operations are also suffering earnings downgrades because of the strength in the yen over the last year. We expect earnings forecasts to stabilize for this group in the next two quarters assuming current currency levels continue. Bulk commodity price rallies, in particular in iron ore and coking coal, are driving earnings expectations higher for many materials companies. We see select opportunities to invest in companies that will see higher than expected profitability due to these trends.
The portfolio continues to overweight stocks with improving business fundamentals, rising investor expectations and attractive relative valuations. Our portfolio construction strategies minimize market, sector and industry exposures relative to the index in order to isolate superior stock selection as the primary source of outperformance.
Preferred Securities Fund
For the 12 months ending 30 September 2016, the Preferred Securities Fund reported net performance of 7.44% compared to 9.04% for the benchmark, 50% BofA Merrill Lynch Fixed Rate Preferred Securities Index/ 50% BofA Merrill Lynch US Capital Securities Index.
Over the period, the top three positive contributors to performance were Rabobank 11%, MetLife 9.25% and Willow No.2 (Zurich) 4.25%. The spread tightening of these issues in a declining rate environment helped boost total returns. The top three negative contributors were Barclays, Group BPCE floaters and Royal Bank of Scotland. Barclays capital securities were negatively impacted by the declining British pound, while Group BPCE and Royal Bank of Scotland each lagged the overall recovery of capital securities prices since February.
The price of the Fund was stable from September to December but by January, the global equity markets corrected suddenly on the back of concerns over slow growth and the first U.S. Federal Reserve (“Fed”) rate hike in nearly a decade. The equity shares of European banks were impacted especially hard through February, which pulled down preferred securities prices sharply. The ECB responded with a broader quantitative easing plan, which brought down volatility and lifted bond prices. The preferred securities sector recovered well from the lows and began a linear journey to new highs by September as spreads tightened by 50bps on top of the rally in the U.S. Treasury bond market over the twelve month period. Some of the preferred securities in the Fund also benefited from tender plays.
PRINCIPAL GLOBAL INVESTORS FUNDS
INVESTMENT ADVISER’S REPORT
for the year ended 30 September 2016 (continued)
17
Preferred Securities Fund (continued)
The minutes of the July 2016 meeting of the Federal Open Market Committee stated that the Fed would “closely monitor inflation indicators and global economic and financial developments” and that “near term risks to the economic outlook have diminished.” On the European side, Chairman Mario Draghi of the ECB has taken a brief pause on his usual aggressive rhetoric toward policy stimulus. This appears to be a signal that the ECB is running out of runway and that bond scarcity and negative interest rates could be an impediment to do much more of “whatever it takes”. It is also a signal that the Brexit is turning into far less of a horror movie and more of a policy drama. We believe that the Fed will move the target funds rate up again in December and that cheaper bond prices are coming given the overall market complacency. Risks appear to have diminished to the global economic outlook. We expect interest rates to drift upward and for spreads to tighten in the process sufficient to provide a positive total return over the next 12 months.
U.S. Equity Fund
For the 12 months ending 30 September 2016, the U.S. Equity Fund reported net performance of 6.78% compared to 15.43% for the benchmark, S&P 500 Index.
The portfolio underperformed the S&P 500 Index during the period. Stock selection in the financial sector was the most effective, while stock selections in the energy and consumer discretionary sectors were less effective.
Our investment process and portfolio style characteristics faced significant headwind in the latter half of the period when the market sharply reversed, led by the riskiest and most neglected groups of companies. Our overweight positions in NVIDIA Corporation, Equifax Inc., and Ingredion Incorporated contributed positively to performance. While our overweight position in Foot Locker, Tesoro Corporation, and Archer Daniels Midland Company detracted from performance. At the end of September the fund’s main overweight positions were Cisco Systems, Inc., JPMorgan Chase & Co., and Aflac Incorporated. The Fund’s main underweight positions included General Electric, Wells Fargo & Company, and Procter & Gamble Company.
Key market risks at this time remain central banking policy changes as monetary policy events have resulted in material changes to foreign exchange markets. Global growth and inflation data remains volatile around generally low levels, which has increased sensitivity to small movements in data as economies continue to flirt with deflation and to battle for competitiveness and growth. We have observed a slowdown in U.S. growth in response to the dramatic rise in the USD earlier in 2015. With employment data improving and inflation set to improve in the months ahead as we experienced lower levels of commodity prices in first quarter 2016, volatile market reactions to a tightening cycle appear likely.
The portfolio continues to overweight stocks with improving business fundamentals, rising investor expectations and attractive relative valuations.
High Yield Fund
For the 12 months ending 30 September 2016, the High Yield Fund reported net performance of 10.61% compared to 13.51% for the benchmark, BofA Merrill Lynch Global High Yield Hedged Index.
The Fund had positive contributions from its allocation to FMG Resources (August 2006) PTY, Chaparral Energy Inc., and ArcelorMittal. Negative contributions came from the Fund’s allocation to Navios Maritime Acquisition, Pinnacle Operating Corporation, and ING U.S. Inc.
High yield and most other asset classes struggled at the start of 2016 from ongoing commodity price weakness and angst in Chinese markets. However, from March onward high yield has posted significant gains driven by a turnaround in commodities, stable global markets, and accommodative central bank policies. A dovish Fed and additional easing by the Bank of Japan and ECB fuelled the risk asset rally. It has been a technical driven market; low global yields and central bank bond buying programs outside the U.S. have pushed investors to seek alternatives.
Overall, we have a neutral view on the asset classes and believe investors are being appropriately compensated to be invested. Fundamentals have rebounded and are expected to improve incrementally. We also believe that defaults will come down fairly aggressively. We do not believe new issuance will be significant and relatively light dealer inventories should provide support to the asset classes. With a significant portion of the fixed income universe trading with negative yields, we continue to believe that the asset classes are appropriately priced, even after the significant rally. Industries we favour at this point are cable, home construction, and food & beverage. We remain selective on sterling bonds as the full implications of Brexit are still unknown. We also continue to selectively find value in European high yield and seek opportunities through local currency euro-denominated bonds. Our top European industry recommendations include cable, wireless, and packaging.
PRINCIPAL GLOBAL INVESTORS FUNDS
INVESTMENT ADVISER’S REPORT
for the year ended 30 September 2016 (continued)
18
Global Property Securities Fund
For the 12 months ending 30 September 2016, the Global Property Securities Fund reported net performance of 10.92% compared to 14.85% for the benchmark, FTSE–EPRA-NAREIT Developed NTR Index.
For the period, the Fund benefitted from an overweight to Deutsche Wohnen AG, a German residential property company, as well as a modest underweight to Public Storage, a U.S. self-storage company. The Fund’s overweight to Great Portland Estates and Land Securities Group Plc was a top detractor from the Fund’s United Kingdom allocation. In addition, an overweight to Japanese developer, Mitsui Fudosan was a leading detractor.
Global listed real estate returned 14.85%, measured by the FTSE-EPRA-NAREIT Developed NTR Index for the past 12 months, outperforming global equities (11.3%), measured by the MSCI World Index, but underperforming the JP Morgan Global Bond Index, which rose 16.8%. Weak economic data points, concerns regarding the effectiveness of loose monetary policy, and the unknown impact of Brexit have all fuelled cautious investor sentiment. Investor nervousness has caused bond yields to drop to historic lows and caused equity investors to favour income oriented sectors with resilient income streams. Globally, real estate stocks have been in favour as they offer these attributes.
Improving and/or stabilized conditions around the world have led the Fed to signal a likely rate hike in December. Despite the hike being clearly signalled, our expectation is that the long end of the yield curve will remain low and provide an environment for real estate stocks to outperform. If we are wrong, this may create a significant headwind for real estate stock performance as investors would fear the possible adverse impact higher rates might have on asset values.
In the 3rd quarter, improved macroeconomic sentiment possibly triggered a reversal of the recent trend that favoured low volatility and above average yield. This provided a more normal investment environment where our focus on the potential of a stock on a 1-3 year time horizon works better. While we are uncertain about near term style leadership, we are confident if we are patient and maintain discipline, our investment approach will prove to be successful.
Global Equity (ex-Japan) Fund
For the 12 months ending 30 September 2016, the Global Equity (ex-Japan) Fund reported net performance of 5.78% compared to 11.28% for the benchmark, MSCI Kokusai (World ex-Japan) Index.
Equity market returns were sharply higher for the period helped by Central Bank policies as well as the moderating strength of the USD. This led to the emerging markets outpacing their developed peers in the past year. Stock selection in the Financials and Real Estate sectors were the top contributors during the period, while stock selection in Industrials and Materials lagged relative to overall performance. From a country perspective, stock selection contributed most positively to performance in Spain, Canada and Italy, while the United States, the United Kingdom and Australia lagged relatively.
Attractive valuations and earnings/growth upside has led to opportunities within the Health Care sector leading the portfolio to remain overweight. Within biotechnology, the portfolio continues to hold Genmab and Actelion, but also favours Gilead Sciences and Amgen as they should benefit from their new product cycles.
The Fund maintained its overweight exposure to the health care providers & services industry. Anthem’s position was maintained and will benefit as an acquirer in the ongoing industry consolidation, gaining additional scale in membership/premium revenues while leveraging fixed general and administrative costs over that larger revenue base. Furthermore, Anthem expects to start reaping the benefits of its investments in Medicare in 2016, which should help drive margin expansion in late 2016 and 2017.
Although overweight in Pfizer and GlaxoSmithKline, the portfolio remains underweight in the Pharmaceuticals sector given concerns surrounding government pricing controls and further volatility driven by the U.S. Presidential election.
In the Technology sector, IT Service Company Accenture remains a top holding as adoption of cloud/SaaS computing by corporate entities is driving a mix shift in IT Services spend that directly benefits Accenture given their high value work. Within software, portfolios holding Microsoft will be a prime beneficiary of its cost cutting efforts along with the launch of Windows10 which is seeing healthy adoption rates as well as its transition to cloud which is firmly on track. Apple remains at an underweight position following quarterly results in July as iPhone fundamentals are decelerating. Alphabet is exceedingly well positioned to continue capitalizing on the shift away from traditional advertising mediums (TV, radio, and print) and toward online platforms. New CFO Ruth Portat will be an agent of change that will instill better expense discipline and increase transparency which historically the company has lacked.
The portfolio continues to overweight stocks with improving business fundamentals, rising investor expectations and attractive relative valuations. Bottom-up stock selection remains the primary source of outperformance.
PRINCIPAL GLOBAL INVESTORS FUNDS
INVESTMENT ADVISER’S REPORT
for the year ended 30 September 2016 (continued)
19
Post Global Limited Term High Yield Fund
For the 12 months to 30 September 2016, the Post Global Limited Term High Yield Fund reported net performance of 5.63% compared to 0.66% for the benchmark, the Barclays Capital US Government 1-2 Year Index.
During the twelve month period, we continued to focus on investing in high quality businesses in more stable, defensive industries. This strategy provided strong downside protection in late 2015 and early 2016, when high yield markets weakened materially. Of note, the Fund has never had a default in its history. Our avoidance of commodities related credits allowed us to maintain low levels of credit risk and volatility.
The Fund generated strong downside protection during a very weak high yield market in Q4 2015 and January 2016; the Fund generated a net positive return of approximately 0.76% during this period, while U.S. high yield markets were down by approximately 4%. High yield markets rallied sharply beginning in February 2016, as a result of an extraordinary decline in sovereign debt yields around the world, a rebound in commodity prices from their February lows, and strong technical conditions across the entire corporate credit market. The rally was driven by the most dislocated segments of the high yield market – triple C credits and commodities related credits, where the Fund had minimal exposure. As a result, the Fund generated consistent positive returns during the February to September period, although returns lagged longer duration high yield benchmarks, with relatively limited volatility.
Although short duration credit has tightened meaningfully, we believe our focus on investing in high quality businesses in more stable, defensive industries will continue to result in attractive risk-adjusted returns through the economic/credit cycle. From a downside protection standpoint, putting aside potential short term mark-to-market volatility, we believe extension “risk” would likely (and counterintuitively) benefit the Fund from a fundamental standpoint. The incremental increase in yield as the high yield bond trades to a longer call date would result in a higher yielding credit that remains outstanding for a longer period of time – a dynamic analogous to a “rolling call” bond in many ways. We believe the Fund is well positioned to continue to generate solid risk-adjusted returns with strong downside protection.
Global Time Diversified Absolute Return Fund
For the 12 months ending 30 September 2016, the Global Time Diversified Absolute Return Fund reported net performance of 11.61%. Impressively, the Fund only experienced two down months during this period. Both sides of the portfolio (discretionary and systematic) contributed positively to performance during the period. The discretionary portfolio’s return was led by our USD Structural and Central Bank Nominal Rate Target themes, whilst our Financial Market Volatility Event and North American Relative Value themes detracted from performance. The systematic component of the portfolio enjoyed a strong return. From a currency perspective, performance was driven by positions in the Japanese yen (JPY), United States dollar (USD), New Zealand dollar (NZD) and Sterling (GBP); the biggest detractors were the Australian dollar (AUD) and the Norwegian krone (NOK). Although currency markets did not experience a significant, singular event during the period under review, the global economy has experienced a number of volatility episodes. The U.K.’s decision in June 2016 to leave the European Union is a prime example of such an event, which has obviously fed through to currencies. In line with this, currency market volatility has steadily risen throughout the period. We feel that this is likely to continue into 2017, with political uncertainties surrounding parts of Europe and the U.S. Presidential election being notable drivers. Given our outlook, we believe that market conditions will continue to provide us with significant opportunities to generate strong returns.
Global Small Cap Equity Fund
For the 12 months ending 30 September 2016, the Global Small Cap Equity Fund reported net performance of 10.68% compared to 14.21% for the benchmark, MSCI ACWI Small Cap Index. The portfolio underperformed its index for the twelve month period on the back of negative stock selection. Companies with strong fundamental change profiles and attractive relative valuation tended to outperform for the majority of the year until the market reversal in February propelled the riskiest and most neglected groups of companies.
PRINCIPAL GLOBAL INVESTORS FUNDS
INVESTMENT ADVISER’S REPORT
for the year ended 30 September 2016 (continued)
20
Global Small Cap Equity Fund (continued)
The portfolio's relative underperformance was driven by weak results across most geographies. Emerging markets and Japan were the most notable detractors. Within emerging markets, India was the source of most of the underperformance largely due to a large drawdown in one stock – Welspun. Stock selection was also soft in Canada, Europe and the U.S. Within Europe, strong results in Italy and Spain were offset by underperformance in Germany and the U.K. The Consumer Discretionary, Information Technology and Materials sectors provided the majority of the underperformance during the period while the Industrials sector was the most notable contributor to relative performance. We remain optimistic for equity markets over the long run, based on earnings, margin growth, as well as favourable comparisons to bonds. However, our view is tempered by potential capital flows, liquidity risks, as well as the outlook for central bank policies. Global bond yields continue to hover around historic lows with downward pressure coming from global growth concerns. The tyranny of “lower for longer” interest rates is likely to remain for some time which has led to defensive “bond proxy” type stocks trading near all-time high relative valuations. Virtually all measures of earnings yields and free cash flow yields on equities continue to compare very favourably to history in relation to yields available on high grade bonds and most all other so called “safe” assets. Simply put, long term accumulation and liability funding objectives have minimal opportunities to be met without meaningful equity exposure. Selectivity is the key.
Origin Global Emerging Markets Fund
For the 12 months to 30 September 2016, the Origin Global Emerging Markets Fund reported net performance of 10.97% compared to 16.78% for the benchmark, MSCI Emerging Markets Index.
At a sector level, relative underperformance was driven predominantly by stock selection in Financials, and our lack of exposure to certain Brazilian names within the sector also proved a burden. Taiwanese stocks, predominantly in the Technology sector were also key detractors from relative performance. However, this was more than offset by strong stock selection in Information Technology stocks in China.
Following a series of tumultuous years for emerging markets, the sector concluded the 12 month period to the end of September 2016 in firmly positive territory, with the MSCI Emerging Markets Index delivering strong double-digit returns. On the face of it, the positive numbers might indicate a benign market environment; however they mask some significant underlying volatility and broader market turbulence during the period – a market environment that challenged our stock selection process. After three quarters of what we would deem ”irrational” behaviour, in which the market rewarded the most expensive and the lowest quality names, Q3 2016 appeared to demonstrate a return to more ”rational” market behaviour.
At a sector level, the portfolio’s most sizeable position is in Information Technology, which remains the largest overweight. Conversely, Financials remains the most significant underweight and we have further reduced our exposure over the year. Geographically, China represents the portfolio’s largest holding and overweight, predominantly at the expense of India and Brazil.
We do not make predictions regarding future fund performance, which – in the case of any long-only asset manager (we would argue) – will be largely stochastic. However, if the third quarter of 2016 is indicative of return to more rational and directional market behaviour, with clear internal leadership within markets/sectors, then our portfolios are naturally well positioned to outperform. As always, we will continue to monitor the evidence and will act as and when we see changes in evidence at the stock level.
Origin Global Equity Fund
For the 12 months to 30 September 2016, the Origin Global Equity Fund reported net performance of 2.83% compared to 11.36% for the benchmark, MSCI World Index.
At a sector level, relative underperformance was driven predominantly by holdings in Health Care, Consumer Discretionary and Industrials, which was very marginally offset by stock selection in Telecommunications. Geographically, the majority of relative underperformance was concentrated in North America, although U.K. holdings also marginally detracted. Stock selection in Emerging Markets proved a minor benefit.
PRINCIPAL GLOBAL INVESTORS FUNDS
INVESTMENT ADVISER’S REPORT
for the year ended 30 September 2016 (continued)
21
Origin Global Equity Fund (continued)
Equity markets enjoyed a year of strong performance with the majority of global and regional indices ending the period firmly in positive territory. Following a shaky end to 2015 and tumultuous start to 2016, equity markets settled and generated positive returns over the period. Whilst the positive numbers might indicate a benign market environment, they mask some significant underlying volatility and broader market turbulence during the period – a market environment that challenged our stock selection process. After three quarters of what we would deem ”irrational” behaviour, in which the market rewarded both the most expensive and the lowest quality names, Q3 2016 appeared to demonstrate a return to more ”rational” market behaviour.
At a sector, level the portfolio’s most significant position is in Information Technology, which remains the largest overweight. Conversely, Financials remains the most significant underweight and we have further reduced our exposure over the year. Geographically, the portfolio’s largest position is in North American stocks, where nevertheless we remain marginally underweight. The Fund’s most significant position relative to the benchmark is in Emerging Markets.
We do not make predictions regarding future fund performance, which – in the case of any long-only asset manager (we would argue) – will be largely stochastic. However, if the third quarter of 2016 is indicative of return to more rational and directional market behaviour, with clear internal leadership within markets/sectors, then our portfolios are naturally well positioned to outperform. As always, we will continue to monitor the evidence and will act as and when we see changes in evidence at the stock level.
Origin Global Smaller Companies Fund
For the 12 months to 30 September 2016, the Origin Global Smaller Companies Fund reported net performance of 10.63% compared to 14.21% for the benchmark, MSCI ACWI Small Cap Index.
At a sector level, relative underperformance can be accounted for almost exclusively by Industrials, with names in Consumer Staples and Energy also proving a marginal drag relative to the benchmark, partially offset by holdings in Financials, Materials and Information Technology. Geographically, the portfolio suffered the most in North America, with Emerging Markets and U.K. holdings also marginally detracting. Positive relative performance was driven by stock selection in Europe ex-U.K. and Asia ex-Japan.
After a shaky end to 2015 and tumultuous start to 2016, equity markets settled and following a strong latter half ended the period firmly in positive territory; the MSCI ACWI Small Cap Index delivered double-digit returns. Whilst the positive numbers might appear to indicate a benign market environment, they mask some significant underlying volatility and broader market turbulence during the period – an environment that challenged our stock selection process. After three quarters of what we would deem ”irrational” behaviour, in which the market rewarded both the most expensive and the lowest quality names, Q3 2016 appeared to demonstrate a return to more “rational” market behaviour.
Holdings in North America remain the largest constituent of the portfolio; nevertheless this represents the most significant underweight relative to the benchmark. The portfolio maintains a strong overweight position in Emerging Markets. By sector, Information Technology remains the Fund’s largest position and most significant overweight by a significant margin, predominantly at the expense of names in the Financials and newly introduced Real Estate sectors.
We do not make predictions regarding future fund performance, which – in the case of any long-only asset manager (we would argue) – will be largely stochastic. However if the third quarter of 2016 is indicative of a return to more rational and directional market behaviour, with clear internal leadership within markets/sectors, then our portfolios are naturally well positioned to outperform. As always, we will continue to monitor the evidence and will act as and when we see changes in evidence at the stock level.
Long/Short Global Opportunities Equity Fund
For the 12 months ending 30 September 2016, the Long/Short Global Opportunities Equity Fund reported net performance of -7.30%. With the exception of a few European markets and Japan, market performance for the year was generally disappointing, especially for emerging markets. The disparity of returns across countries, sectors and style classifications was striking. Emerging markets as a group underperformed their developed peers by over 14% for the full year, with Latin America and the EEMEA block faring even worse.
PRINCIPAL GLOBAL INVESTORS FUNDS
INVESTMENT ADVISER’S REPORT
for the year ended 30 September 2016 (continued)
22
Long/Short Global Opportunities Equity Fund (continued)
From a global sector perspective, Technology, Health Care and Consumer stocks all delivered broad based gains, while the Energy and Materials complex suffered deep losses for the year despite a fleeting bounce early in the fourth quarter. In the U.S., the largest tier of companies outpaced smaller cap shares, reflecting a low degree of breadth. Conversely, in international markets, small caps shined, outpacing their large company peers by average margins exceeding 28% for the year. For the 12 months under review, the Fund posted a negative absolute return of -7.3%. Within the portfolio, all sectors were positive except for Materials, Industrials and Real Estate. Within the top contributing sector, Telecommunication Services, Nippon Telegraph and Telephone and NTT DoCoMo out of Japan were the standout performers. Adidas AG was a top performer within the portfolio overall. Fundamental change at Adidas comes in the form of less drag from weak performing segments, solid industry growth for sports apparel and footwear, a move to increase direct sales to the consumer, high profile sporting events in 2016 that allow for good exposure, a move toward automation and management changes and optionality. Other top contributors over the past year were Qualicorp, Kinross Gold and 3i Group. On the other hand, the portfolio was negatively impacted by holdings within the Materials sector, particularly Barrick Gold and BHP Billiton. After significant share appreciation in 2016, share prices for gold companies pulled back with a further headwind coming in the form of the expectation for rate hikes to continue by year end. Other top detractors over the past year were ConocoPhillips, Leidos Holdings, Boeing Company, AMN Healthcare Services and JBS. 2016 has provided challenges for GARP investing. However, the good news is that the customary growth premiums and valuation discounts embedded in our portfolios are among the best we have seen in quite some time, providing extremely compelling opportunities on a forward looking basis once GARP style attributes inevitably return to favour. The Fund continues to emphasize stocks with improving business fundamentals, rising investor expectations and attractive relative valuations. Stock selection remains the primary source of outperformance, and we continue to primarily focus on large and mid-cap companies with selective exposure to smaller companies. The portfolio continues to pursue its “borderless” approach across a truly global opportunity set of both developed and emerging markets. We invest where we see the most compelling growth opportunities with attractive valuations, rather than positioning in relation to a market index.
Claritas Latin American Equity Fund
For the 12 months ending 30 September 2016, the Claritas Latin American Equity Fund reported net performance of 32.75%. LatAm equities (+25.7%) had a strong performance in this period, outperforming both emerging markets (+14.1%) and developed markets (+9.1%). Brazil (+52.8%) and Peru (+37.8%) were the strongest markets, while Mexico (-4.1%) stood alone with a negative return (on the back of Trump’s advance in U.S. election polls). Brazilian markets were propelled by a material improvement in the country’s political situation, with President Dilma Rousseff’s impeachment concluded. The currency was also affected, appreciating 21.0% against the USD in the period. Stock picking was entirely responsible for the alpha of the Fund, with robust results in Brazil, especially with overweight positions in Banco Itaú and Sanepar, and Mexico, mainly due to the overweight allocation in airports. On the other hand, the underweight allocation in Brazil was the main detractor from the Fund’s performance. The outlook for the region (as for most emerging markets) definitely improved, with the stabilization of commodity prices and expectations of lower interest rates for longer. Although the challenges for Brazil are still profound, the worst seems over, since economic activity is stabilizing and confidence levels are recovering strongly. There are also expectations that under President Temer´s tenure some important reforms might be approved, as there is strong Congressional support. Mexico’s performance in the mid-term should be linked to the U.S. election and oil prices, but we reckon that the Peso and the Mexican stock market have mostly priced-in the diminished probability of Trump winning. In Colombia, it will be important to monitor the political consequences of the rejection of the peace agreement with the FARC. Economic activity in Chile continues to be affected by lower copper prices, which failed to follow the recovery of other commodities.

PRINCIPAL GLOBAL INVESTORS FUNDS
INVESTMENT ADVISER’S REPORT
for the year ended 30 September 2016 (continued)
23
Finisterre Emerging Market Debt Fund
For the 12 months ending 30 September 2016, the Finisterre Emerging Market Debt Fund reported net performance of 4.49%.
Over the period, the biggest positive contributors to the Fund’s performance were Brazil, Indonesia, Russia, Poland and Malaysia. Turkey and Mexico were the biggest detractors.
While the Fund took a bearish emerging markets’ foreign exchange position during the first part of the year, which did not perform (namely South Africa, Turkey, Mexico), it maintained long positions in short term rates, especially in Asia (China, Taiwan, Korea, Singapore, Thailand), which profited despite the well expected policy rate hike in December 2015 by the Fed. The unexpected Brexit vote outcome allowed us to enter into long emerging markets’ credit (CEE, Russia, Malaysia, Indonesia, Brazil) before the summer. It performed well before we took a more defensive attitude and will likely maintain this bias to the end of 2016.
The outlook for emerging markets’ asset classes is turning positive again, at least in the short term. We do not expect developed market central banks to withdraw liquidity anytime soon, nor to raise policy rates — with the exception of the Fed, which should hike rates no more than twice by the end of 2017. Global investors should keep struggling to find fixed income assets with a positive yield in non-emerging markets and therefore keep moving into emerging markets. Credit spreads that are close to historical lows in absolute value terms should tighten as there is room on a relative basis. Having been the subject of a lot of worry, China seems to be delivering on its growth plan. We believe that Brazil is more stable than this time last year. However, the affection for emerging markets is strongly correlated with global sentiment, which remains fragile and sensitive to oil prices and European Bond markets (Bund mainly). We have also managed to take advantage of specific market dislocations to implement relative value trades along various curves, such as Israel, Hong Kong and Singapore.
Spectrum Global Capital Securities Fund
For the 12 months ending 30 September 2016, the Spectrum Global Capital Securities Fund reported net performance of 6.42% compared to 6.54% for the benchmark, BofA Merrill Lynch Global Non-Sovereign Index.
Over the period, the top three positive contributors to performance were Danske Bank 5.875%, Société Générale 8% and HSBC Holdings 6.875%. Performance was aided by the timing of the HSBC purchase — just after the Brexit referendum. The top three negative contributors were Lloyds Banking Group 7.625%, Deutsche Bank 6% and Société Générale 7.375%. The Fund closed out its position in Deutsche Bank in January, while the Lloyds Bank holding was negatively impacted by currency translation from the declining British pound.
The contingent convertible capital securities (“CoCo”) sector performed well from September to November, but was impacted by the ECB’s restrictive view on how Pillar-2 capital would be treated for calculating the dividend headroom before limitations are imposed. This helped to accelerate negative sentiment, which was exacerbated by very poor equity performance for European banks based on fears of poor performance from slow economic growth. The ECB picked up the pace and breadth of its bond buying, which helped to lift CoCos off all-time lows in February. By June, CoCos had recaptured two-thirds of their price losses, only to be set back briefly by the Brexit vote, which created a second buying opportunity. The ECB relaxed the rules on dividend headroom limitations during the summer, so by the end of the 12 month period the Fund was trading at new highs.
We believe that the pro-cyclical risks that CoCos seemed to impose on the European banking system, due to the ECB’s
earlier Pillar-2 misstep, have been mediated by the improvements in July. The CoCo market remains over 6% higher than its Brexit lows, despite its sympathetic fade with bank equities in September. Equity price performance matters when considering CoCo investments – so, when European equities rally (someday) like oil prices have this year, expect CoCo prices to perform very well. In the meantime, there will be idiosyncratic risks to individual names in the European banking sector, such as Deutsche Bank, but these are business specific risks that should not weigh as heavily on the broader CoCo market as they have in the past. We expect the credit performance of European banks to be supportive and the income from CoCos to more than offset price risks over the next 12 months.
PRINCIPAL GLOBAL INVESTORS FUNDS
INVESTMENT ADVISER’S REPORT
for the year ended 30 September 2016 (continued)
24
Global Capital Structure Opportunities Fund
For the 12 months ending 30 September 2016, the Global Capital Structure Opportunities Fund reported net performance of 4.40% compared to 0.57% for the benchmark, 3 Month U.S. LIBOR.
The outperformance of the Fund was driven by allocations to lower tier 2 (“LT2”), senior debt, perpetual, preferreds, CoCos, and hybrids.
Central bank policies and commodity prices were two main drivers of the solid performance of capital structure securities. The Fed raised rates in December 2015, but the slow pace of improvement in the U.S. economy has kept the Fed Funds rate on hold since. On a divergent path, other global central banks including the ECB, the Bank of Japan, BoE, and Peoples Bank of China (“PBOC”) continued to pursue more dovish policies. Commodity prices were volatile, but after hitting lows in early 2016, the market has rebounded as supply and demand technicals have become less of a concern.
Demand from investors searching for yield and further central bank accommodation continue to underpin the market for risk assets and will provide further opportunities up and down the debt capital structure. We continue to prefer U.S. money-centre banks over the U.S. operations of foreign registered banks due to their stronger fundamentals and a better U.S. economic backdrop. However, there will be select opportunities in European banks, including LT2 and CoCos, as the market navigates uncertainty around impending negotiations regarding the terms of Brexit and the Italian banking situation. Regulation will continue to be a focal issue in the banking space as further rules will be announced, implemented, and clarified. Most of the existing and anticipated rules are net positives for bondholders, but the situation continues to evolve and could drive sentiment and risk-taking across the capital structure.
Global Credit Alpha Fund
For the 12 months ending 30 September 2016, the Global Credit Alpha Fund reported net performance of 6.03% compared to 0.57% for the benchmark, 3 Month U.S. LIBOR.
The Fund’s allocation to investment grade corporate bonds was the largest contributor to total return during the 12 months under review. The allocations to below investment grade corporate bonds and emerging market debt were also significant contributors to performance, but their contribution was partially offset by the negative impact of macro volatility hedging.
The period began with significant volatility due to lower commodity prices and central bank uncertainty. Central banks appeared on divergent paths with the Fed raising interest rates in December 2015 for the first time in nearly a decade, while other central banks globally such as the ECB and the PBOC continued dovish policies. Volatility continued into early 2016 until central banks globally, including the Fed, began making accommodative statements, and the ECB announced its plans to purchase corporate bonds. After the Brexit vote, the BoE also began purchasing corporate bonds. With central banks calming the markets, demand for corporate bonds became overwhelming, driving spreads significantly tighter during the remainder of the period.
Demand from investors searching for yield and further central bank accommodation continues to underpin the market for risk assets. Strong demand technicals along with stable corporate fundamentals should remain supportive of valuations. However, strong momentum in credit markets this year has driven yields lower, limiting further upside potential, while downside risk will become elevated approaching year end. The outcome of the upcoming U.S. presidential election and the potential December Fed rate hike may trigger volatility.
Real Estate Debt Fund
Since inception on 21 March 2016 to 30 September 2016, the Real Estate Debt Fund reported net performance of 6.50% compared to 4.13% for the benchmark, Barclays Capital CMBS Investment Grade Index.
Since inception on 21 March 2016, the Fund benefitted from positive security selection which contributed over 200 basis points in excess return when compared to the Barclays Capital CMBS Investment Grade Index. Portfolio holdings of 2013 and 2014 vintage A-rated bonds contributed the most to overall portfolio performance.
PRINCIPAL GLOBAL INVESTORS FUNDS
INVESTMENT ADVISER’S REPORT
for the year ended 30 September 2016 (continued)
25
Real Estate Debt Fund (continued)
The Real Estate Debt Fund invests primarily in a diversified portfolio of U.S. commercial mortgage backed securities (“CMBS”) with an objective of providing attractive long term risk-adjusted returns. The Fund was launched in March of 2016 at a time when the CMBS markets were recovering from a period of macro driven volatility. The Sub–Investment Adviser has constructed a diversified portfolio with a wide range of vintage and credit exposures, which to date has benefitted from a higher yield profile as well as positive total return throughout the year as risk markets recovered from a turbulent first quarter.
CMBS represents a fixed income investment in an underlying pool of first mortgages secured by commercial real estate properties located throughout the United States. The health of the commercial real estate market is directly influenced by the health of the economy, and more specifically, the U.S. job market which has added over 170,000 jobs per month since the Fund’s inception. Ongoing economic growth, a growing labour market, and historically low interest rates are currently providing a stable footing for commercial real estate. The CMBS new issuance market is providing a steady flow of new investment options alongside an active secondary market. Ongoing regulatory restraints on the banking sector along with new risk retention requirements have posed headwinds for CMBS; however, market participants seem to be making appropriate adjustments. The yield enhancement currently offered by CMBS appears attractive given stable real estate fundamentals and the opportunity CMBS presents investors to diversify their broader fixed income portfolios.
Principal Global Investors, LLC 31 October 2016
PRINCIPAL GLOBAL INVESTORS FUNDS
INDEPENDENT AUDITORS’ REPORT TO THE UNITHOLDERS OF PRINCIPAL GLOBAL INVESTORS FUNDS
26
Our opinion In our opinion, Principal Global Investors Funds financial statements (the “financial statements”):
· give a true and fair view of the Funds’ assets, liabilities and financial position as at 30 September 2016 and of their results for the year then ended;
· have been properly prepared in accordance with Generally Accepted Accounting Practice in Ireland; and
· have been properly prepared in accordance with the requirements of the European Communities (Undertakings for
Collective Investment in Transferable Securities) Regulations 2011 (as amended). What we have audited The financial statements comprise:
· the Statement of Financial Position as at 30 September 2016; · the Statement of Comprehensive Income for the year then ended;
· the Statement of Movement in Net Assets Attributable to Redeemable Participating Unitholders for the year then ended;
· the Portfolio of Investments for each of the Funds as at 30 September 2016; and
· the Notes to the Annual Report and Financial Statements
The financial reporting framework that has been applied in the preparation of the financial statements is Irish law and accounting standards issued by the Financial Reporting Council and promulgated by the Institute of Chartered Accountants in Ireland (Generally Accepted Accounting Practice in Ireland).
In applying the financial reporting framework, the manager has made a number of subjective judgements, for example in respect of significant accounting estimates. In making such estimates, the manager has made assumptions and considered future events.
Responsibilities for the financial statements and the audit Our responsibilities and those of the manager As explained more fully in the Statement of Manager’s Responsibilities, the Manager is responsible for the preparation of the financial statements giving a true and fair view.
Our responsibility is to audit and express an opinion on the financial statements in accordance with Irish law and International Standards on Auditing (UK and Ireland). Those standards require us to comply with the Auditing Practices Board’s Ethical Standards for Auditors.
This report, including the opinion, has been prepared for and only for the Unitholders of each of the Funds as a body and for no other purpose. We do not, in giving this opinion, accept or assume responsibility for any other purpose or to any other person to whom this report is shown or into whose hands it may come save where expressly agreed by our prior consent in writing.
What an audit of financial statements involves We conducted our audit in accordance with International Standards on Auditing (UK and Ireland). An audit involves obtaining evidence about the amounts and disclosures in the financial statements sufficient to give reasonable assurance that the financial statements are free from material misstatement, whether caused by fraud or error. This includes an assessment of: · whether the accounting policies are appropriate to the Funds circumstances and have been consistently applied and
adequately disclosed;
· the reasonableness of significant accounting estimates made by the manager; and · the overall presentation of the financial statements. We primarily focus our work in these areas by assessing the manager’s judgements against available evidence, forming our own judgements, and evaluating the disclosures in the financial statements.
PRINCIPAL GLOBAL INVESTORS FUNDS
INDEPENDENT AUDITORS’ REPORT TO THE UNITHOLDERS OF PRINCIPAL GLOBAL INVESTORS FUNDS (CONTINUED)
27
We test and examine information, using sampling and other auditing techniques, to the extent we consider necessary to provide a reasonable basis for us to draw conclusions. We obtain audit evidence through testing the effectiveness of controls, substantive procedures or a combination of both.In addition, we read all the financial and non-financial information in the annual report to identify material inconsistencies with the audited financial statements and to identify any information that is apparently materially incorrect based on, or materially inconsistent with, the knowledge acquired by us in the course of performing the audit. If we become aware of any apparent material misstatements or inconsistencies we consider the implications for our report.
PricewaterhouseCoopers Chartered Accountants and Registered Auditors One Spencer Dock North Wall Quay Dublin 1 Ireland Date: 24 January 2017
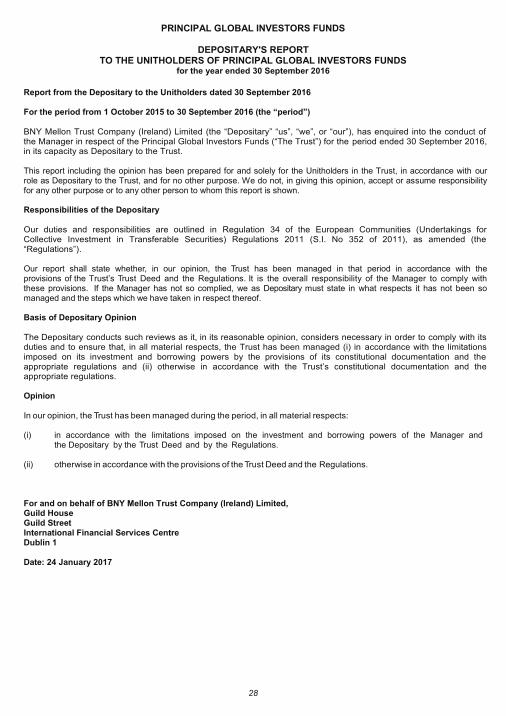
PRINCIPAL GLOBAL INVESTORS FUNDS
DEPOSITARY'S REPORT TO THE UNITHOLDERS OF PRINCIPAL GLOBAL INVESTORS FUNDS
for the year ended 30 September 2016
28
Report from the Depositary to the Unitholders dated 30 September 2016 For the period from 1 October 2015 to 30 September 2016 (the “period”) BNY Mellon Trust Company (Ireland) Limited (the “Depositary” “us”, “we”, or “our”), has enquired into the conduct of the Manager in respect of the Principal Global Investors Funds (“The Trust”) for the period ended 30 September 2016, in its capacity as Depositary to the Trust. This report including the opinion has been prepared for and solely for the Unitholders in the Trust, in accordance with our role as Depositary to the Trust, and for no other purpose. We do not, in giving this opinion, accept or assume responsibility for any other purpose or to any other person to whom this report is shown. Responsibilities of the Depositary Our duties and responsibilities are outlined in Regulation 34 of the European Communities (Undertakings for Collective Investment in Transferable Securities) Regulations 2011 (S.I. No 352 of 2011), as amended (the “Regulations”). Our report shall state whether, in our opinion, the Trust has been managed in that period in accordance with the provisions of the Trust’s Trust Deed and the Regulations. It is the overall responsibility of the Manager to comply with these provisions. If the Manager has not so complied, we as Depositary must state in what respects it has not been so managed and the steps which we have taken in respect thereof. Basis of Depositary Opinion The Depositary conducts such reviews as it, in its reasonable opinion, considers necessary in order to comply with its duties and to ensure that, in all material respects, the Trust has been managed (i) in accordance with the limitations imposed on its investment and borrowing powers by the provisions of its constitutional documentation and the appropriate regulations and (ii) otherwise in accordance with the Trust’s constitutional documentation and the appropriate regulations. Opinion In our opinion, the Trust has been managed during the period, in all material respects: (i) in accordance with the limitations imposed on the investment and borrowing powers of the Manager and
the Depositary by the Trust Deed and by the Regulations.
(ii) otherwise in accordance with the provisions of the Trust Deed and the Regulations.
For and on behalf of BNY Mellon Trust Company (Ireland) Limited, Guild House Guild Street International Financial Services Centre Dublin 1 Date: 24 January 2017
PRINCIPAL GLOBAL INVESTORS FUNDS
STATEMENT OF MANAGER’S & DEPOSITARY’S RESPONSIBILITIES
29
1. Manager
The Manager of the Trust is required by the UCITS Regulations to prepare Financial Statements for each accounting period which gives a true and fair view of the financial position of the Trust at the end of that period, the results of its operations and the movement in net assets for the period then ended. In preparing these Financial Statements the Manager is required to: · select suitable accounting policies and then apply them consistently; · make judgments and estimates that are prudent and reasonable; and · prepare the Financial Statements on the going concern basis unless it is inappropriate to presume that the Trust will
continue in operation. The Manager is responsible for keeping proper books of account which disclose with reasonable accuracy at any time the financial position of the Trust and for ensuring that the Financial Statements are prepared in accordance with accounting standards generally accepted in Ireland and for ensuring that they comply with the provisions of the Trust Deed, the UCITS Regulations and the Hong Kong Securities and Futures Commission's Code on Unit Trusts and Mutual Funds. The Manager is also responsible with respect to its duties under the UCITS Regulations to take reasonable steps for the prevention and detection of fraud and other irregularities.
Principal Global Investors (Ireland) Limited 2. Depositary The Depositary is required by the UCITS Regulations, to: · maintain the assets of a Unit Trust in safekeeping;
· report to the Unitholders for each accounting period on the conduct of the Manager in the management of a Unit Trust. BNY Mellon Trust Company (Ireland) Limited
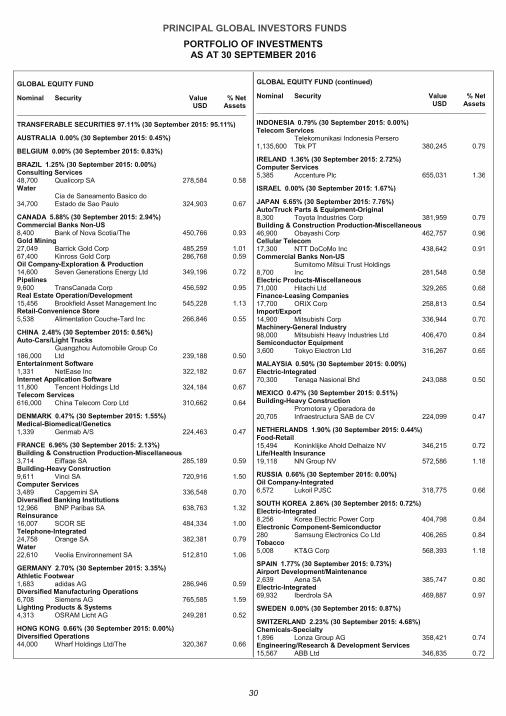
PRINCIPAL GLOBAL INVESTORS FUNDS
PORTFOLIO OF INVESTMENTS AS AT 30 SEPTEMBER 2016
30
GLOBAL EQUITY FUND
Nominal Security Value USD
% Net Assets
TRANSFERABLE SECURITIES 97.11% (30 September 2015: 95.11%)
AUSTRALIA 0.00% (30 September 2015: 0.45%)
BELGIUM 0.00% (30 September 2015: 0.83%)
BRAZIL 1.25% (30 September 2015: 0.00%) Consulting Services 48,700 Qualicorp SA 278,584 0.58 Water
34,700 Cia de Saneamento Basico do Estado de Sao Paulo 324,903 0.67
CANADA 5.88% (30 September 2015: 2.94%) Commercial Banks Non-US 8,400 Bank of Nova Scotia/The 450,766 0.93 Gold Mining 27,049 Barrick Gold Corp 485,259 1.01 67,400 Kinross Gold Corp 286,768 0.59 Oil Company-Exploration & Production 14,600 Seven Generations Energy Ltd 349,196 0.72 Pipelines 9,600 TransCanada Corp 456,592 0.95 Real Estate Operation/Development 15,456 Brookfield Asset Management Inc 545,228 1.13 Retail-Convenience Store 5,538 Alimentation Couche-Tard Inc 266,846 0.55
CHINA 2.48% (30 September 2015: 0.56%) Auto-Cars/Light Trucks
186,000 Guangzhou Automobile Group Co Ltd 239,188 0.50
Entertainment Software 1,331 NetEase Inc 322,182 0.67 Internet Application Software 11,800 Tencent Holdings Ltd 324,184 0.67 Telecom Services 616,000 China Telecom Corp Ltd 310,662 0.64
DENMARK 0.47% (30 September 2015: 1.55%) Medical-Biomedical/Genetics 1,339 Genmab A/S 224,463 0.47
FRANCE 6.96% (30 September 2015: 2.13%) Building & Construction Production-Miscellaneous 3,714 Eiffage SA 285,189 0.59 Building-Heavy Construction 9,611 Vinci SA 720,916 1.50 Computer Services 3,489 Capgemini SA 336,548 0.70 Diversified Banking Institutions 12,966 BNP Paribas SA 638,763 1.32 Reinsurance 16,007 SCOR SE 484,334 1.00 Telephone-Integrated 24,758 Orange SA 382,381 0.79 Water 22,610 Veolia Environnement SA 512,810 1.06
GERMANY 2.70% (30 September 2015: 3.35%) Athletic Footwear 1,683 adidas AG 286,946 0.59 Diversified Manufacturing Operations 6,708 Siemens AG 765,585 1.59 Lighting Products & Systems 4,313 OSRAM Licht AG 249,281 0.52
HONG KONG 0.66% (30 September 2015: 0.00%) Diversified Operations 44,000 Wharf Holdings Ltd/The 320,367 0.66
GLOBAL EQUITY FUND (continued)
Nominal Security Value USD
% Net Assets
INDONESIA 0.79% (30 September 2015: 0.00%) Telecom Services
1,135,600 Telekomunikasi Indonesia Persero Tbk PT 380,245 0.79
IRELAND 1.36% (30 September 2015: 2.72%) Computer Services 5,385 Accenture Plc 655,031 1.36
ISRAEL 0.00% (30 September 2015: 1.67%)
JAPAN 6.65% (30 September 2015: 7.76%) Auto/Truck Parts & Equipment-Original 8,300 Toyota Industries Corp 381,959 0.79 Building & Construction Production-Miscellaneous 46,900 Obayashi Corp 462,757 0.96 Cellular Telecom 17,300 NTT DoCoMo Inc 438,642 0.91 Commercial Banks Non-US
8,700 Sumitomo Mitsui Trust Holdings Inc 281,548 0.58
Electric Products-Miscellaneous 71,000 Hitachi Ltd 329,265 0.68 Finance-Leasing Companies 17,700 ORIX Corp 258,813 0.54 Import/Export 14,900 Mitsubishi Corp 336,944 0.70 Machinery-General Industry 98,000 Mitsubishi Heavy Industries Ltd 406,470 0.84 Semiconductor Equipment 3,600 Tokyo Electron Ltd 316,267 0.65
MALAYSIA 0.50% (30 September 2015: 0.00%) Electric-Integrated 70,300 Tenaga Nasional Bhd 243,088 0.50
MEXICO 0.47% (30 September 2015: 0.51%) Building-Heavy Construction
20,705 Promotora y Operadora de Infraestructura SAB de CV 224,099 0.47
NETHERLANDS 1.90% (30 September 2015: 0.44%) Food-Retail 15,494 Koninklijke Ahold Delhaize NV 346,215 0.72 Life/Health Insurance 19,118 NN Group NV 572,586 1.18
RUSSIA 0.66% (30 September 2015: 0.00%) Oil Company-Integrated 6,572 Lukoil PJSC 318,775 0.66
SOUTH KOREA 2.86% (30 September 2015: 0.72%) Electric-Integrated 8,256 Korea Electric Power Corp 404,798 0.84 Electronic Component-Semiconductor 280 Samsung Electronics Co Ltd 406,265 0.84 Tobacco 5,008 KT&G Corp 568,393 1.18
SPAIN 1.77% (30 September 2015: 0.73%) Airport Development/Maintenance 2,639 Aena SA 385,747 0.80 Electric-Integrated 69,932 Iberdrola SA 469,887 0.97
SWEDEN 0.00% (30 September 2015: 0.87%)
SWITZERLAND 2.23% (30 September 2015: 4.68%) Chemicals-Specialty 1,896 Lonza Group AG 358,421 0.74 Engineering/Research & Development Services 15,567 ABB Ltd 346,835 0.72
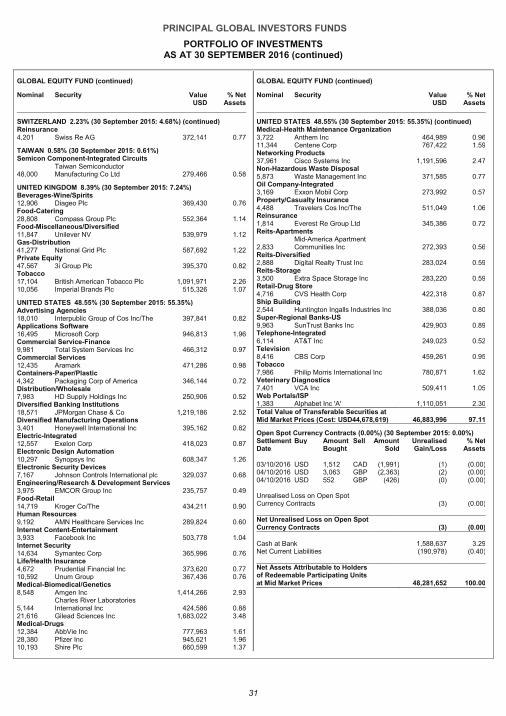
PRINCIPAL GLOBAL INVESTORS FUNDS
PORTFOLIO OF INVESTMENTS AS AT 30 SEPTEMBER 2016 (continued)
31
GLOBAL EQUITY FUND (continued)
Nominal Security Value USD
% Net Assets
SWITZERLAND 2.23% (30 September 2015: 4.68%) (continued) Reinsurance 4,201 Swiss Re AG 372,141 0.77
TAIWAN 0.58% (30 September 2015: 0.61%) Semicon Component-Integrated Circuits
48,000 Taiwan Semiconductor Manufacturing Co Ltd 279,466 0.58
UNITED KINGDOM 8.39% (30 September 2015: 7.24%) Beverages-Wine/Spirits 12,906 Diageo Plc 369,430 0.76 Food-Catering 28,808 Compass Group Plc 552,364 1.14 Food-Miscellaneous/Diversified 11,847 Unilever NV 539,979 1.12 Gas-Distribution 41,277 National Grid Plc 587,692 1.22 Private Equity 47,567 3i Group Plc 395,370 0.82 Tobacco 17,104 British American Tobacco Plc 1,091,971 2.26 10,056 Imperial Brands Plc 515,326 1.07
UNITED STATES 48.55% (30 September 2015: 55.35%) Advertising Agencies 18,010 Interpublic Group of Cos Inc/The 397,841 0.82 Applications Software 16,495 Microsoft Corp 946,813 1.96 Commercial Service-Finance 9,981 Total System Services Inc 466,312 0.97 Commercial Services 12,435 Aramark 471,286 0.98 Containers-Paper/Plastic 4,342 Packaging Corp of America 346,144 0.72 Distribution/Wholesale 7,983 HD Supply Holdings Inc 250,906 0.52 Diversified Banking Institutions 18,571 JPMorgan Chase & Co 1,219,186 2.52 Diversified Manufacturing Operations 3,401 Honeywell International Inc 395,162 0.82 Electric-Integrated 12,557 Exelon Corp 418,023 0.87 Electronic Design Automation 10,297 Synopsys Inc 608,347 1.26 Electronic Security Devices 7,167 Johnson Controls International plc 329,037 0.68 Engineering/Research & Development Services 3,975 EMCOR Group Inc 235,757 0.49 Food-Retail 14,719 Kroger Co/The 434,211 0.90 Human Resources 9,192 AMN Healthcare Services Inc 289,824 0.60 Internet Content-Entertainment 3,933 Facebook Inc 503,778 1.04 Internet Security 14,634 Symantec Corp 365,996 0.76 Life/Health Insurance 4,672 Prudential Financial Inc 373,620 0.77 10,592 Unum Group 367,436 0.76 Medical-Biomedical/Genetics 8,548 Amgen Inc 1,414,266 2.93
5,144 Charles River Laboratories International Inc 424,586 0.88
21,616 Gilead Sciences Inc 1,683,022 3.48 Medical-Drugs 12,384 AbbVie Inc 777,963 1.61 28,380 Pfizer Inc 945,621 1.96 10,193 Shire Plc 660,599 1.37
GLOBAL EQUITY FUND (continued)
Nominal Security Value USD
% Net Assets
UNITED STATES 48.55% (30 September 2015: 55.35%) (continued) Medical-Health Maintenance Organization 3,722 Anthem Inc 464,989 0.96 11,344 Centene Corp 767,422 1.59 Networking Products 37,961 Cisco Systems Inc 1,191,596 2.47 Non-Hazardous Waste Disposal 5,873 Waste Management Inc 371,585 0.77 Oil Company-Integrated 3,169 Exxon Mobil Corp 273,992 0.57 Property/Casualty Insurance 4,488 Travelers Cos Inc/The 511,049 1.06 Reinsurance 1,814 Everest Re Group Ltd 345,386 0.72 Reits-Apartments
2,833 Mid-America Apartment Communities Inc 272,393 0.56
Reits-Diversified 2,888 Digital Realty Trust Inc 283,024 0.59 Reits-Storage 3,500 Extra Space Storage Inc 283,220 0.59 Retail-Drug Store 4,716 CVS Health Corp 422,318 0.87 Ship Building 2,544 Huntington Ingalls Industries Inc 388,036 0.80 Super-Regional Banks-US 9,963 SunTrust Banks Inc 429,903 0.89 Telephone-Integrated 6,114 AT&T Inc 249,023 0.52 Television 8,416 CBS Corp 459,261 0.95 Tobacco 7,986 Philip Morris International Inc 780,871 1.62 Veterinary Diagnostics 7,401 VCA Inc 509,411 1.05 Web Portals/ISP 1,383 Alphabet Inc 'A' 1,110,051 2.30 Total Value of Transferable Securities at Mid Market Prices (Cost: USD44,678,619) 46,883,996 97.11
Open Spot Currency Contracts (0.00%) (30 September 2015: 0.00%) Settlement Buy Amount Sell Amount Unrealised % Net Date Bought Sold Gain/Loss Assets
03/10/2016 USD 1,512 CAD (1,991) (1) (0.00) 04/10/2016 USD 3,063 GBP (2,363) (2) (0.00) 04/10/2016 USD 552 GBP (426) (0) (0.00) Unrealised Loss on Open Spot Currency Contracts (3) (0.00) Net Unrealised Loss on Open Spot Currency Contracts (3) (0 .00)
Cash at Bank 1,588,637 3.29 Net Current Liabilities (190,978) (0.40) Net Assets Attributable to Holders of Redeemable Participating Units at Mid Market Prices 48,281,652 100.00
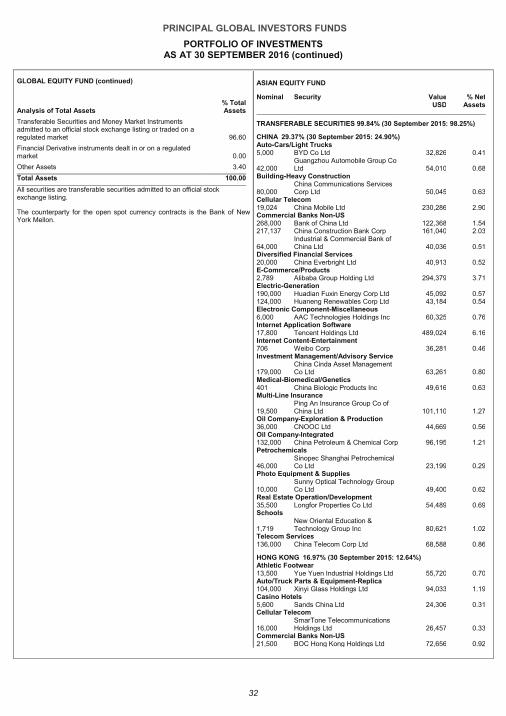
PRINCIPAL GLOBAL INVESTORS FUNDS
PORTFOLIO OF INVESTMENTS AS AT 30 SEPTEMBER 2016 (continued)
32
GLOBAL EQUITY FUND (continued)
Analysis of Total Assets % Total Assets
Transferable Securities and Money Market Instruments admitted to an official stock exchange listing or traded on a regulated market 96.60
Financial Derivative instruments dealt in or on a regulated market 0.00
Other Assets 3.40
Total Assets 100.00
All securities are transferable securities admitted to an official stock exchange listing.
The counterparty for the open spot currency contracts is the Bank of New York Mellon.
ASIAN EQUITY FUND
Nominal Security Value USD
% Net Assets
TRANSFERABLE SECURITIES 99.84% (30 September 2015: 98.25%)
CHINA 29.37% (30 September 2015: 24.90%) Auto-Cars/Light Trucks 5,000 BYD Co Ltd 32,826 0.41
42,000 Guangzhou Automobile Group Co Ltd 54,010 0.68
Building-Heavy Construction
80,000 China Communications Services Corp Ltd 50,045 0.63
Cellular Telecom 19,024 China Mobile Ltd 230,286 2.90 Commercial Banks Non-US 268,000 Bank of China Ltd 122,368 1.54 217,137 China Construction Bank Corp 161,040 2.03
64,000 Industrial & Commercial Bank of China Ltd 40,036 0.51
Diversified Financial Services 20,000 China Everbright Ltd 40,913 0.52 E-Commerce/Products 2,789 Alibaba Group Holding Ltd 294,379 3.71 Electric-Generation 190,000 Huadian Fuxin Energy Corp Ltd 45,092 0.57 124,000 Huaneng Renewables Corp Ltd 43,184 0.54 Electronic Component-Miscellaneous 6,000 AAC Technologies Holdings Inc 60,325 0.76 Internet Application Software 17,800 Tencent Holdings Ltd 489,024 6.16 Internet Content-Entertainment 706 Weibo Corp 36,281 0.46 Investment Management/Advisory Service
179,000 China Cinda Asset Management Co Ltd 63,261 0.80
Medical-Biomedical/Genetics 401 China Biologic Products Inc 49,616 0.63 Multi-Line Insurance
19,500 Ping An Insurance Group Co of China Ltd 101,110 1.27
Oil Company-Exploration & Production 36,000 CNOOC Ltd 44,669 0.56 Oil Company-Integrated 132,000 China Petroleum & Chemical Corp 96,195 1.21 Petrochemicals
46,000 Sinopec Shanghai Petrochemical Co Ltd 23,199 0.29
Photo Equipment & Supplies
10,000 Sunny Optical Technology Group Co Ltd 49,400 0.62
Real Estate Operation/Development 35,500 Longfor Properties Co Ltd 54,489 0.69 Schools
1,719 New Oriental Education & Technology Group Inc 80,621 1.02
Telecom Services 136,000 China Telecom Corp Ltd 68,588 0.86
HONG KONG 16.97% (30 September 2015: 12.64%) Athletic Footwear 13,500 Yue Yuen Industrial Holdings Ltd 55,720 0.70 Auto/Truck Parts & Equipment-Replica 104,000 Xinyi Glass Holdings Ltd 94,033 1.19 Casino Hotels 5,600 Sands China Ltd 24,306 0.31 Cellular Telecom
16,000 SmarTone Telecommunications Holdings Ltd 26,457 0.33
Commercial Banks Non-US 21,500 BOC Hong Kong Holdings Ltd 72,656 0.92
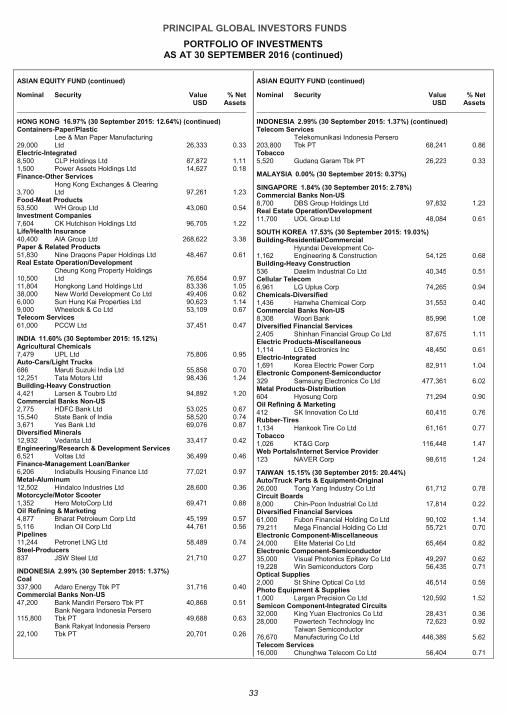
PRINCIPAL GLOBAL INVESTORS FUNDS
PORTFOLIO OF INVESTMENTS AS AT 30 SEPTEMBER 2016 (continued)
33
ASIAN EQUITY FUND (continued)
Nominal Security Value USD
% Net Assets
HONG KONG 16.97% (30 September 2015: 12.64%) (continued) Containers-Paper/Plastic
29,000 Lee & Man Paper Manufacturing Ltd 26,333 0.33
Electric-Integrated 8,500 CLP Holdings Ltd 87,872 1.11 1,500 Power Assets Holdings Ltd 14,627 0.18 Finance-Other Services
3,700 Hong Kong Exchanges & Clearing Ltd 97,261 1.23
Food-Meat Products 53,500 WH Group Ltd 43,060 0.54 Investment Companies 7,604 CK Hutchison Holdings Ltd 96,705 1.22 Life/Health Insurance 40,400 AIA Group Ltd 268,622 3.38 Paper & Related Products 51,830 Nine Dragons Paper Holdings Ltd 48,467 0.61 Real Estate Operation/Development
10,500 Cheung Kong Property Holdings Ltd 76,654 0.97
11,804 Hongkong Land Holdings Ltd 83,336 1.05 38,000 New World Development Co Ltd 49,406 0.62 6,000 Sun Hung Kai Properties Ltd 90,623 1.14 9,000 Wheelock & Co Ltd 53,109 0.67 Telecom Services 61,000 PCCW Ltd 37,451 0.47
INDIA 11.60% (30 September 2015: 15.12%) Agricultural Chemicals 7,479 UPL Ltd 75,806 0.95 Auto-Cars/Light Trucks 686 Maruti Suzuki India Ltd 55,858 0.70 12,251 Tata Motors Ltd 98,436 1.24 Building-Heavy Construction 4,421 Larsen & Toubro Ltd 94,892 1.20 Commercial Banks Non-US 2,775 HDFC Bank Ltd 53,025 0.67 15,540 State Bank of India 58,520 0.74 3,671 Yes Bank Ltd 69,076 0.87 Diversified Minerals 12,932 Vedanta Ltd 33,417 0.42 Engineering/Research & Development Services 6,521 Voltas Ltd 36,499 0.46 Finance-Management Loan/Banker 6,206 Indiabulls Housing Finance Ltd 77,021 0.97 Metal-Aluminum 12,502 Hindalco Industries Ltd 28,600 0.36 Motorcycle/Motor Scooter 1,352 Hero MotoCorp Ltd 69,471 0.88 Oil Refining & Marketing 4,877 Bharat Petroleum Corp Ltd 45,199 0.57 5,116 Indian Oil Corp Ltd 44,761 0.56 Pipelines 11,244 Petronet LNG Ltd 58,489 0.74 Steel-Producers 837 JSW Steel Ltd 21,710 0.27
INDONESIA 2.99% (30 September 2015: 1.37%) Coal 337,900 Adaro Energy Tbk PT 31,716 0.40 Commercial Banks Non-US 47,200 Bank Mandiri Persero Tbk PT 40,868 0.51
115,800 Bank Negara Indonesia Persero Tbk PT 49,688 0.63
22,100 Bank Rakyat Indonesia Persero Tbk PT 20,701 0.26
ASIAN EQUITY FUND (continued)
Nominal Security Value USD
% Net Assets
INDONESIA 2.99% (30 September 2015: 1.37%) (continued) Telecom Services
203,800 Telekomunikasi Indonesia Persero Tbk PT 68,241 0.86
Tobacco 5,520 Gudang Garam Tbk PT 26,223 0.33
MALAYSIA 0.00% (30 September 2015: 0.37%)
SINGAPORE 1.84% (30 September 2015: 2.78%) Commercial Banks Non-US 8,700 DBS Group Holdings Ltd 97,832 1.23 Real Estate Operation/Development 11,700 UOL Group Ltd 48,084 0.61
SOUTH KOREA 17.53% (30 September 2015: 19.03%) Building-Residential/Commercial
1,162 Hyundai Development Co-Engineering & Construction 54,125 0.68
Building-Heavy Construction 536 Daelim Industrial Co Ltd 40,345 0.51 Cellular Telecom 6,961 LG Uplus Corp 74,265 0.94 Chemicals-Diversified 1,436 Hanwha Chemical Corp 31,553 0.40 Commercial Banks Non-US 8,308 Woori Bank 85,996 1.08 Diversified Financial Services 2,405 Shinhan Financial Group Co Ltd 87,675 1.11 Electric Products-Miscellaneous 1,114 LG Electronics Inc 48,450 0.61 Electric-Integrated 1,691 Korea Electric Power Corp 82,911 1.04 Electronic Component-Semiconductor 329 Samsung Electronics Co Ltd 477,361 6.02 Metal Products-Distribution 604 Hyosung Corp 71,294 0.90 Oil Refining & Marketing 412 SK Innovation Co Ltd 60,415 0.76 Rubber-Tires 1,134 Hankook Tire Co Ltd 61,161 0.77 Tobacco 1,026 KT&G Corp 116,448 1.47 Web Portals/Internet Service Provider 123 NAVER Corp 98,615 1.24
TAIWAN 15.15% (30 September 2015: 20.44%) Auto/Truck Parts & Equipment-Original 26,000 Tong Yang Industry Co Ltd 61,712 0.78 Circuit Boards 8,000 Chin-Poon Industrial Co Ltd 17,814 0.22 Diversified Financial Services 61,000 Fubon Financial Holding Co Ltd 90,102 1.14 79,211 Mega Financial Holding Co Ltd 55,721 0.70 Electronic Component-Miscellaneous 24,000 Elite Material Co Ltd 65,464 0.82 Electronic Component-Semiconductor 35,000 Visual Photonics Epitaxy Co Ltd 49,297 0.62 19,228 Win Semiconductors Corp 56,435 0.71 Optical Supplies 2,000 St Shine Optical Co Ltd 46,514 0.59 Photo Equipment & Supplies 1,000 Largan Precision Co Ltd 120,592 1.52 Semicon Component-Integrated Circuits 32,000 King Yuan Electronics Co Ltd 28,431 0.36 28,000 Powertech Technology Inc 72,623 0.92
76,670 Taiwan Semiconductor Manufacturing Co Ltd 446,389 5.62
Telecom Services 16,000 Chunghwa Telecom Co Ltd 56,404 0.71
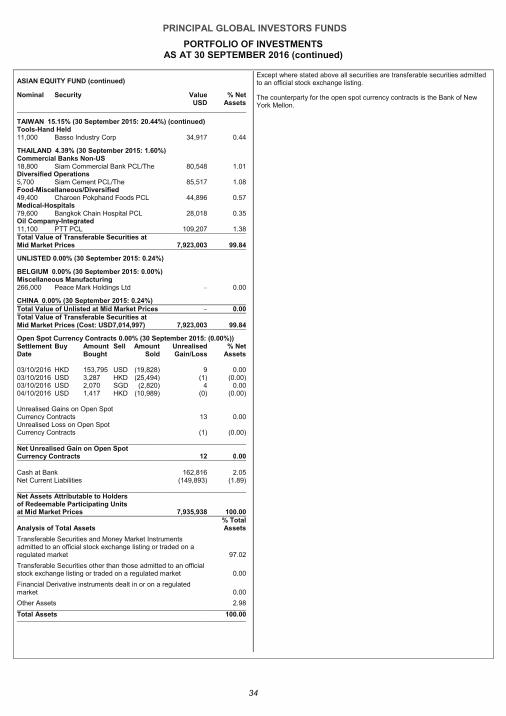
PRINCIPAL GLOBAL INVESTORS FUNDS
PORTFOLIO OF INVESTMENTS AS AT 30 SEPTEMBER 2016 (continued)
34
ASIAN EQUITY FUND (continued)
Nominal Security Value USD
% Net Assets
TAIWAN 15.15% (30 September 2015: 20.44%) (continued) Tools-Hand Held 11,000 Basso Industry Corp 34,917 0.44
THAILAND 4.39% (30 September 2015: 1.60%) Commercial Banks Non-US 18,800 Siam Commercial Bank PCL/The 80,548 1.01 Diversified Operations 5,700 Siam Cement PCL/The 85,517 1.08 Food-Miscellaneous/Diversified 49,400 Charoen Pokphand Foods PCL 44,896 0.57 Medical-Hospitals 79,600 Bangkok Chain Hospital PCL 28,018 0.35 Oil Company-Integrated 11,100 PTT PCL 109,207 1.38 Total Value of Transferable Securities at Mid Market Prices 7,923,003 99.84
UNLISTED 0.00% (30 September 2015: 0.24%)
BELGIUM 0.00% (30 September 2015: 0.00%) Miscellaneous Manufacturing 266,000 Peace Mark Holdings Ltd – 0.00
CHINA 0.00% (30 September 2015: 0.24%) Total Value of Unlisted at Mid Market Prices – 0.00 Total Value of Transferable Securities at Mid Market Prices (Cost: USD7,014,997) 7,923,003 99.84
Open Spot Currency Contracts 0.00% (30 September 2015: (0.00%)) Settlement Buy Amount Sell Amount Unrealised % Net Date Bought Sold Gain/Loss Assets
03/10/2016 HKD 153,795 USD (19,828) 9 0.00 03/10/2016 USD 3,287 HKD (25,494) (1) (0.00) 03/10/2016 USD 2,070 SGD (2,820) 4 0.00 04/10/2016 USD 1,417 HKD (10,989) (0) (0.00) Unrealised Gains on Open Spot Currency Contracts 13 0.00 Unrealised Loss on Open Spot Currency Contracts (1) (0.00) Net Unrealised Gain on Open Spot Currency Contracts 12 0 .00
Cash at Bank 162,816 2.05 Net Current Liabilities (149,893) (1.89) Net Assets Attributable to Holders of Redeemable Participating Units at Mid Market Prices 7,935,938 100.00
Analysis of Total Assets % Total Assets
Transferable Securities and Money Market Instruments admitted to an official stock exchange listing or traded on a regulated market 97.02
Transferable Securities other than those admitted to an official stock exchange listing or traded on a regulated market 0.00
Financial Derivative instruments dealt in or on a regulated market 0.00
Other Assets 2.98
Total Assets 100.00
Except where stated above all securities are transferable securities admitted to an official stock exchange listing.
The counterparty for the open spot currency contracts is the Bank of New York Mellon.
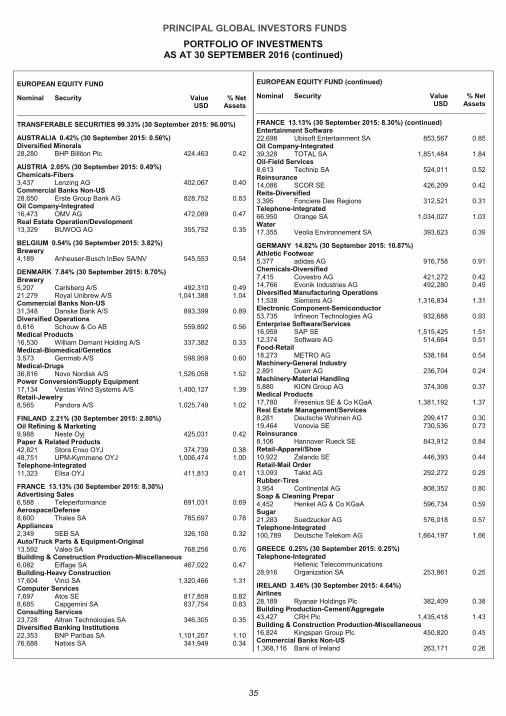
PRINCIPAL GLOBAL INVESTORS FUNDS
PORTFOLIO OF INVESTMENTS AS AT 30 SEPTEMBER 2016 (continued)
35
EUROPEAN EQUITY FUND
Nominal Security Value USD
% Net Assets
TRANSFERABLE SECURITIES 99.33% (30 September 2015: 96.00%)
AUSTRALIA 0.42% (30 September 2015: 0.56%) Diversified Minerals 28,280 BHP Billiton Plc 424,463 0.42
AUSTRIA 2.05% (30 September 2015: 0.49%) Chemicals-Fibers 3,437 Lenzing AG 402,067 0.40 Commercial Banks Non-US 28,650 Erste Group Bank AG 828,752 0.83 Oil Company-Integrated 16,473 OMV AG 472,089 0.47 Real Estate Operation/Development 13,329 BUWOG AG 355,752 0.35
BELGIUM 0.54% (30 September 2015: 3.82%) Brewery 4,189 Anheuser-Busch InBev SA/NV 545,553 0.54
DENMARK 7.84% (30 September 2015: 8.70%) Brewery 5,207 Carlsberg A/S 492,310 0.49 21,279 Royal Unibrew A/S 1,041,388 1.04 Commercial Banks Non-US 31,348 Danske Bank A/S 893,399 0.89 Diversified Operations 8,616 Schouw & Co AB 559,892 0.56 Medical Products 16,530 William Demant Holding A/S 337,382 0.33 Medical-Biomedical/Genetics 3,573 Genmab A/S 598,959 0.60 Medical-Drugs 36,816 Novo Nordisk A/S 1,526,058 1.52 Power Conversion/Supply Equipment 17,134 Vestas Wind Systems A/S 1,400,127 1.39 Retail-Jewelry 8,565 Pandora A/S 1,025,749 1.02
FINLAND 2.21% (30 September 2015: 2.80%) Oil Refining & Marketing 9,988 Neste Oyj 425,031 0.42 Paper & Related Products 42,821 Stora Enso OYJ 374,739 0.38 48,751 UPM-Kymmene OYJ 1,006,474 1.00 Telephone-Integrated 11,323 Elisa OYJ 411,813 0.41
FRANCE 13.13% (30 September 2015: 8.30%) Advertising Sales 6,588 Teleperformance 691,031 0.69 Aerospace/Defense 8,600 Thales SA 785,697 0.78 Appliances 2,349 SEB SA 326,150 0.32 Auto/Truck Parts & Equipment-Original 13,592 Valeo SA 768,256 0.76 Building & Construction Production-Miscellaneous 6,082 Eiffage SA 467,022 0.47 Building-Heavy Construction 17,604 Vinci SA 1,320,466 1.31 Computer Services 7,697 Atos SE 817,859 0.82 8,685 Capgemini SA 837,754 0.83 Consulting Services 23,728 Altran Technologies SA 346,305 0.35 Diversified Banking Institutions 22,353 BNP Paribas SA 1,101,207 1.10 76,688 Natixis SA 341,949 0.34
EUROPEAN EQUITY FUND (continued)
Nominal Security Value USD
% Net Assets
FRANCE 13.13% (30 September 2015: 8.30%) (continued) Entertainment Software 22,698 Ubisoft Entertainment SA 853,567 0.85 Oil Company-Integrated 39,328 TOTAL SA 1,851,484 1.84 Oil-Field Services 8,613 Technip SA 524,011 0.52 Reinsurance 14,086 SCOR SE 426,209 0.42 Reits-Diversified 3,395 Fonciere Des Regions 312,521 0.31 Telephone-Integrated 66,950 Orange SA 1,034,027 1.03 Water 17,355 Veolia Environnement SA 393,623 0.39
GERMANY 14.82% (30 September 2015: 10.87%) Athletic Footwear 5,377 adidas AG 916,758 0.91 Chemicals-Diversified 7,415 Covestro AG 421,272 0.42 14,766 Evonik Industries AG 492,280 0.49 Diversified Manufacturing Operations 11,538 Siemens AG 1,316,834 1.31 Electronic Component-Semiconductor 53,735 Infineon Technologies AG 932,688 0.93 Enterprise Software/Services 16,959 SAP SE 1,515,425 1.51 12,374 Software AG 514,664 0.51 Food-Retail 18,273 METRO AG 538,184 0.54 Machinery-General Industry 2,891 Duerr AG 236,704 0.24 Machinery-Material Handling 5,880 KION Group AG 374,308 0.37 Medical Products 17,780 Fresenius SE & Co KGaA 1,381,192 1.37 Real Estate Management/Services 8,281 Deutsche Wohnen AG 299,417 0.30 19,464 Vonovia SE 730,536 0.73 Reinsurance 8,106 Hannover Rueck SE 843,912 0.84 Retail-Apparel/Shoe 10,922 Zalando SE 446,393 0.44 Retail-Mail Order 13,093 Takkt AG 292,272 0.29 Rubber-Tires 3,954 Continental AG 808,352 0.80 Soap & Cleaning Prepar 4,452 Henkel AG & Co KGaA 596,734 0.59 Sugar 21,283 Suedzucker AG 576,018 0.57 Telephone-Integrated 100,789 Deutsche Telekom AG 1,664,197 1.66
GREECE 0.25% (30 September 2015: 0.25%) Telephone-Integrated
28,916 Hellenic Telecommunications Organization SA 253,861 0.25
IRELAND 3.46% (30 September 2015: 4.64%) Airlines 28,189 Ryanair Holdings Plc 382,409 0.38 Building Production-Cement/Aggregate 43,427 CRH Plc 1,435,418 1.43 Building & Construction Production-Miscellaneous 16,824 Kingspan Group Plc 450,820 0.45 Commercial Banks Non-US 1,368,116 Bank of Ireland 263,171 0.26
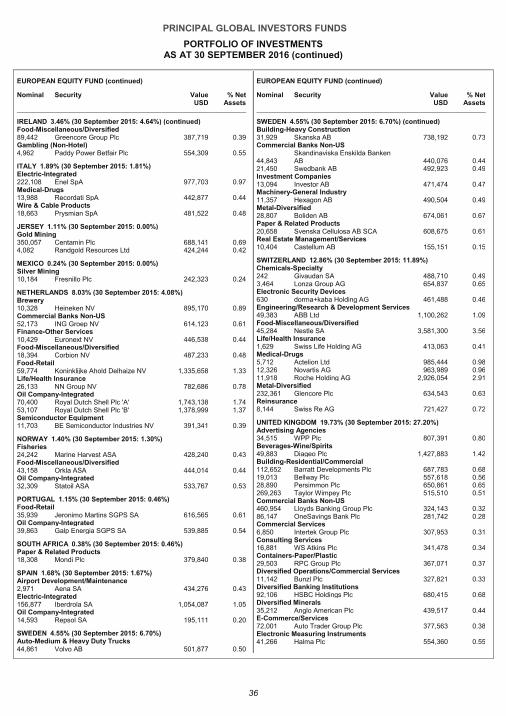
PRINCIPAL GLOBAL INVESTORS FUNDS
PORTFOLIO OF INVESTMENTS AS AT 30 SEPTEMBER 2016 (continued)
36
EUROPEAN EQUITY FUND (continued)
Nominal Security Value USD
% Net Assets
IRELAND 3.46% (30 September 2015: 4.64%) (continued) Food-Miscellaneous/Diversified 89,442 Greencore Group Plc 387,719 0.39 Gambling (Non-Hotel) 4,962 Paddy Power Betfair Plc 554,309 0.55
ITALY 1.89% (30 September 2015: 1.81%) Electric-Integrated 222,108 Enel SpA 977,703 0.97 Medical-Drugs 13,988 Recordati SpA 442,877 0.44 Wire & Cable Products 18,663 Prysmian SpA 481,522 0.48
JERSEY 1.11% (30 September 2015: 0.00%) Gold Mining 350,057 Centamin Plc 688,141 0.69 4,082 Randgold Resources Ltd 424,244 0.42
MEXICO 0.24% (30 September 2015: 0.00%) Silver Mining 10,184 Fresnillo Plc 242,323 0.24
NETHERLANDS 8.03% (30 September 2015: 4.08%) Brewery 10,328 Heineken NV 895,170 0.89 Commercial Banks Non-US 52,173 ING Groep NV 614,123 0.61 Finance-Other Services 10,429 Euronext NV 446,538 0.44 Food-Miscellaneous/Diversified 18,394 Corbion NV 487,233 0.48 Food-Retail 59,774 Koninklijke Ahold Delhaize NV 1,335,658 1.33 Life/Health Insurance 26,133 NN Group NV 782,686 0.78 Oil Company-Integrated 70,400 Royal Dutch Shell Plc 'A' 1,743,138 1.74 53,107 Royal Dutch Shell Plc 'B' 1,378,999 1.37 Semiconductor Equipment 11,703 BE Semiconductor Industries NV 391,341 0.39
NORWAY 1.40% (30 September 2015: 1.30%) Fisheries 24,242 Marine Harvest ASA 428,240 0.43 Food-Miscellaneous/Diversified 43,158 Orkla ASA 444,014 0.44 Oil Company-Integrated 32,309 Statoil ASA 533,767 0.53
PORTUGAL 1.15% (30 September 2015: 0.46%) Food-Retail 35,939 Jeronimo Martins SGPS SA 616,565 0.61 Oil Company-Integrated 39,863 Galp Energia SGPS SA 539,885 0.54
SOUTH AFRICA 0.38% (30 September 2015: 0.46%) Paper & Related Products 18,308 Mondi Plc 379,840 0.38
SPAIN 1.68% (30 September 2015: 1.67%) Airport Development/Maintenance 2,971 Aena SA 434,276 0.43 Electric-Integrated 156,877 Iberdrola SA 1,054,087 1.05 Oil Company-Integrated 14,593 Repsol SA 195,111 0.20
SWEDEN 4.55% (30 September 2015: 6.70%) Auto-Medium & Heavy Duty Trucks 44,861 Volvo AB 501,877 0.50
EUROPEAN EQUITY FUND (continued)
Nominal Security Value USD
% Net Assets
SWEDEN 4.55% (30 September 2015: 6.70%) (continued) Building-Heavy Construction 31,929 Skanska AB 738,192 0.73 Commercial Banks Non-US
44,843 Skandinaviska Enskilda Banken AB 440,076 0.44
21,450 Swedbank AB 492,923 0.49 Investment Companies 13,094 Investor AB 471,474 0.47 Machinery-General Industry 11,357 Hexagon AB 490,504 0.49 Metal-Diversified 28,807 Boliden AB 674,061 0.67 Paper & Related Products 20,658 Svenska Cellulosa AB SCA 608,675 0.61 Real Estate Management/Services 10,404 Castellum AB 155,151 0.15
SWITZERLAND 12.86% (30 September 2015: 11.89%) Chemicals-Specialty 242 Givaudan SA 488,710 0.49 3,464 Lonza Group AG 654,837 0.65 Electronic Security Devices 630 dorma+kaba Holding AG 461,488 0.46 Engineering/Research & Development Services 49,383 ABB Ltd 1,100,262 1.09 Food-Miscellaneous/Diversified 45,284 Nestle SA 3,581,300 3.56 Life/Health Insurance 1,629 Swiss Life Holding AG 413,063 0.41 Medical-Drugs 5,712 Actelion Ltd 985,444 0.98 12,326 Novartis AG 963,989 0.96 11,918 Roche Holding AG 2,926,054 2.91 Metal-Diversified 232,361 Glencore Plc 634,543 0.63 Reinsurance 8,144 Swiss Re AG 721,427 0.72
UNITED KINGDOM 19.73% (30 September 2015: 27.20%) Advertising Agencies 34,515 WPP Plc 807,391 0.80 Beverages-Wine/Spirits 49,883 Diageo Plc 1,427,883 1.42 Building-Residential/Commercial 112,652 Barratt Developments Plc 687,783 0.68 19,013 Bellway Plc 557,618 0.56 28,890 Persimmon Plc 650,861 0.65 269,263 Taylor Wimpey Plc 515,510 0.51 Commercial Banks Non-US 460,954 Lloyds Banking Group Plc 324,143 0.32 86,147 OneSavings Bank Plc 281,742 0.28 Commercial Services 6,850 Intertek Group Plc 307,953 0.31 Consulting Services 16,881 WS Atkins Plc 341,478 0.34 Containers-Paper/Plastic 29,503 RPC Group Plc 367,071 0.37 Diversified Operations/Commercial Services 11,142 Bunzl Plc 327,821 0.33 Diversified Banking Institutions 92,106 HSBC Holdings Plc 680,415 0.68 Diversified Minerals 35,212 Anglo American Plc 439,517 0.44 E-Commerce/Services 72,001 Auto Trader Group Plc 377,563 0.38 Electronic Measuring Instruments 41,266 Halma Plc 554,360 0.55

PRINCIPAL GLOBAL INVESTORS FUNDS
PORTFOLIO OF INVESTMENTS AS AT 30 SEPTEMBER 2016 (continued)
37
EUROPEAN EQUITY FUND (continued)
Nominal Security Value USD
% Net Assets
UNITED KINGDOM 19.73% (30 September 2015: 27.20%) (continued) Finance-Consumer Loans 7,695 Provident Financial Plc 295,551 0.29 Finance-Management Loan/Banker 80,784 Paragon Group of Cos Plc/The 324,105 0.32 Food-Catering 43,585 Compass Group Plc 835,698 0.83 Food-Miscellaneous/Diversified 10,969 Unilever Plc 514,911 0.51 Gas-Distribution 74,930 National Grid Plc 1,066,836 1.06 Home Furnishings 62,563 Howden Joinery Group Plc 342,268 0.34 Medical-Drugs 8,763 AstraZeneca Plc 564,513 0.56 43,977 BTG Plc 360,113 0.36 109,974 Indivior Plc 435,082 0.43 Multi-Line Insurance 77,798 Direct Line Insurance Group Plc 367,004 0.36 Private Equity 145,268 3i Group Plc 1,207,446 1.20 62,564 Intermediate Capital Group Plc 472,563 0.47 Property/Casualty Insurance 60,274 Beazley Plc 300,437 0.30 Rental Auto/Equipment 45,522 Ashtead Group Plc 731,952 0.73 Sugar 45,462 Tate & Lyle Plc 434,171 0.43 Telephone-Integrated 196,422 BT Group Plc 976,649 0.97 Tobacco 30,674 British American Tobacco Plc 1,958,321 1.95
UNITED STATES 1.59% (30 September 2015: 0.00%) Medical-Drugs 24,723 Shire Plc 1,602,274 1.59 Total Value of Transferable Securities at Mid Market Prices (Cost: USD92,821,408) 99,847,516 99.33
Open Spot Currency Contracts 0.00% (30 September 2015: 0.00%) Settlement Buy Amount Sell Amount Unrealised % Net Date Bought Sold Gain/Loss Assets
03/10/2016 USD 162,774 GBP (125,665) (175) (0.00) 03/10/2016 USD 177,154 CHF (171,230) 368 0.00 03/10/2016 USD 474,031 EUR (422,917) 1,051 0.00 04/10/2016 USD 5,306 GBP (4,093) (2) (0.00) 04/10/2016 USD 2,058 GBP (1,588) (1) (0.00) 04/10/2016 USD 933 GBP (720) (0) (0.00) Unrealised Gains on Open Spot Currency Contracts 1,419 0.00 Unrealised Loss on Open Spot Currency Contracts (178) (0.00) Net Unrealised Gain on Open Spot Currency Contracts 1,241 0 .00
Cash at Bank 21,765 0.02 Net Current Assets 653,507 0.65 Net Assets Attributable to Holders of Redeemable Participating Units at Mid Market Prices 100,524,029 100.00
EUROPEAN EQUITY FUND (continued)
Analysis of Total Assets % Total Assets
Transferable Securities and Money Market Instruments admitted to an official stock exchange listing or traded on a regulated market 99.10
Financial Derivative instruments dealt in or on a regulated market 0.00
Other Assets 0.90
Total Assets 100.00
All securities are transferable securities admitted to an official stock exchange listing.
The counterparty for the open spot currency contracts is the Bank of New York Mellon.
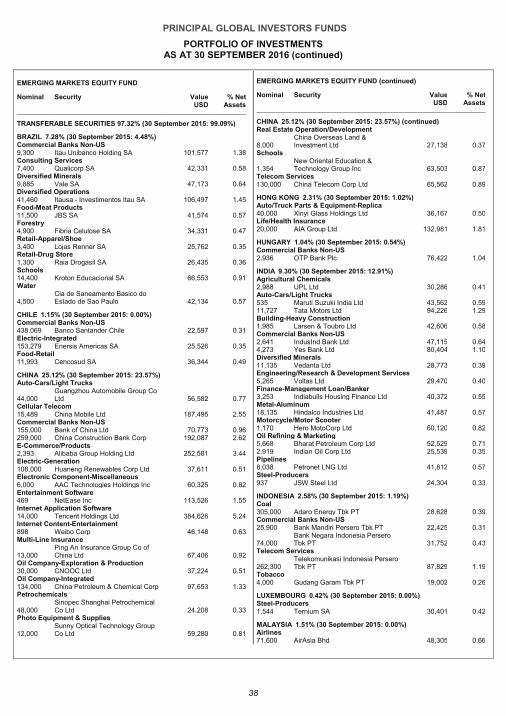
PRINCIPAL GLOBAL INVESTORS FUNDS
PORTFOLIO OF INVESTMENTS AS AT 30 SEPTEMBER 2016 (continued)
38
EMERGING MARKETS EQUITY FUND
Nominal Security Value USD
% Net Assets
TRANSFERABLE SECURITIES 97.32% (30 September 2015: 99.09%)
BRAZIL 7.28% (30 September 2015: 4.48%) Commercial Banks Non-US 9,300 Itau Unibanco Holding SA 101,577 1.38 Consulting Services 7,400 Qualicorp SA 42,331 0.58 Diversified Minerals 9,885 Vale SA 47,173 0.64 Diversified Operations 41,460 Itausa - Investimentos Itau SA 106,497 1.45 Food-Meat Products 11,500 JBS SA 41,574 0.57 Forestry 4,900 Fibria Celulose SA 34,331 0.47 Retail-Apparel/Shoe 3,400 Lojas Renner SA 25,762 0.35 Retail-Drug Store 1,300 Raia Drogasil SA 26,435 0.36 Schools 14,400 Kroton Educacional SA 66,553 0.91 Water
4,500 Cia de Saneamento Basico do Estado de Sao Paulo 42,134 0.57
CHILE 1.15% (30 September 2015: 0.00%) Commercial Banks Non-US 438,069 Banco Santander Chile 22,597 0.31 Electric-Integrated 153,279 Enersis Americas SA 25,526 0.35 Food-Retail 11,993 Cencosud SA 36,344 0.49
CHINA 25.12% (30 September 2015: 23.57%) Auto-Cars/Light Trucks
44,000 Guangzhou Automobile Group Co Ltd 56,582 0.77
Cellular Telecom 15,489 China Mobile Ltd 187,495 2.55 Commercial Banks Non-US 155,000 Bank of China Ltd 70,773 0.96 259,000 China Construction Bank Corp 192,087 2.62 E-Commerce/Products 2,393 Alibaba Group Holding Ltd 252,581 3.44 Electric-Generation 108,000 Huaneng Renewables Corp Ltd 37,611 0.51 Electronic Component-Miscellaneous 6,000 AAC Technologies Holdings Inc 60,325 0.82 Entertainment Software 469 NetEase Inc 113,526 1.55 Internet Application Software 14,000 Tencent Holdings Ltd 384,626 5.24 Internet Content-Entertainment 898 Weibo Corp 46,148 0.63 Multi-Line Insurance
13,000 Ping An Insurance Group Co of China Ltd 67,406 0.92
Oil Company-Exploration & Production 30,000 CNOOC Ltd 37,224 0.51 Oil Company-Integrated 134,000 China Petroleum & Chemical Corp 97,653 1.33 Petrochemicals
48,000 Sinopec Shanghai Petrochemical Co Ltd 24,208 0.33
Photo Equipment & Supplies
12,000 Sunny Optical Technology Group Co Ltd 59,280 0.81
EMERGING MARKETS EQUITY FUND (continued)
Nominal Security Value USD
% Net Assets
CHINA 25.12% (30 September 2015: 23.57%) (continued) Real Estate Operation/Development
8,000 China Overseas Land & Investment Ltd 27,138 0.37
Schools
1,354 New Oriental Education & Technology Group Inc 63,503 0.87
Telecom Services 130,000 China Telecom Corp Ltd 65,562 0.89
HONG KONG 2.31% (30 September 2015: 1.02%) Auto/Truck Parts & Equipment-Replica 40,000 Xinyi Glass Holdings Ltd 36,167 0.50 Life/Health Insurance 20,000 AIA Group Ltd 132,981 1.81
HUNGARY 1.04% (30 September 2015: 0.54%) Commercial Banks Non-US 2,936 OTP Bank Plc 76,422 1.04
INDIA 9.30% (30 September 2015: 12.91%) Agricultural Chemicals 2,988 UPL Ltd 30,286 0.41 Auto-Cars/Light Trucks 535 Maruti Suzuki India Ltd 43,562 0.59 11,727 Tata Motors Ltd 94,226 1.29 Building-Heavy Construction 1,985 Larsen & Toubro Ltd 42,606 0.58 Commercial Banks Non-US 2,641 IndusInd Bank Ltd 47,115 0.64 4,273 Yes Bank Ltd 80,404 1.10 Diversified Minerals 11,135 Vedanta Ltd 28,773 0.39 Engineering/Research & Development Services 5,265 Voltas Ltd 29,470 0.40 Finance-Management Loan/Banker 3,253 Indiabulls Housing Finance Ltd 40,372 0.55 Metal-Aluminum 18,135 Hindalco Industries Ltd 41,487 0.57 Motorcycle/Motor Scooter 1,170 Hero MotoCorp Ltd 60,120 0.82 Oil Refining & Marketing 5,668 Bharat Petroleum Corp Ltd 52,529 0.71 2,919 Indian Oil Corp Ltd 25,539 0.35 Pipelines 8,038 Petronet LNG Ltd 41,812 0.57 Steel-Producers 937 JSW Steel Ltd 24,304 0.33
INDONESIA 2.58% (30 September 2015: 1.19%) Coal 305,000 Adaro Energy Tbk PT 28,628 0.39 Commercial Banks Non-US 25,900 Bank Mandiri Persero Tbk PT 22,425 0.31
74,000 Bank Negara Indonesia Persero Tbk PT 31,752 0.43
Telecom Services
262,300 Telekomunikasi Indonesia Persero Tbk PT 87,829 1.19
Tobacco 4,000 Gudang Garam Tbk PT 19,002 0.26
LUXEMBOURG 0.42% (30 September 2015: 0.00%) Steel-Producers 1,544 Ternium SA 30,401 0.42
MALAYSIA 1.51% (30 September 2015: 0.00%) Airlines 71,600 AirAsia Bhd 48,305 0.66
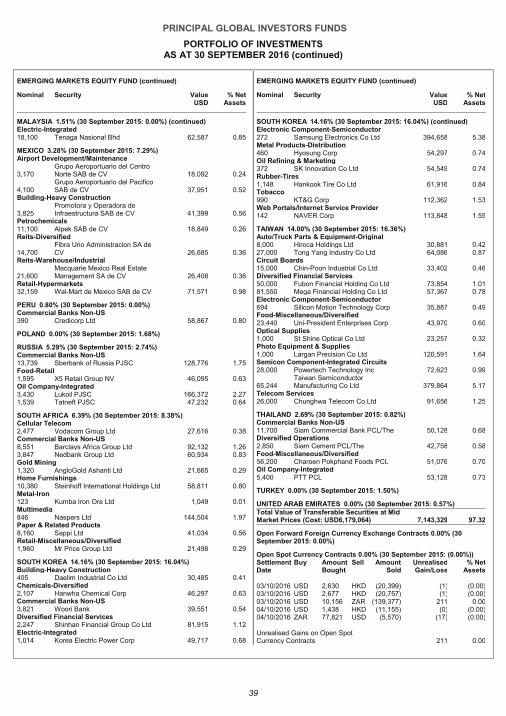
PRINCIPAL GLOBAL INVESTORS FUNDS
PORTFOLIO OF INVESTMENTS AS AT 30 SEPTEMBER 2016 (continued)
39
EMERGING MARKETS EQUITY FUND (continued)
Nominal Security Value USD
% Net Assets
MALAYSIA 1.51% (30 September 2015: 0.00%) (continued) Electric-Integrated 18,100 Tenaga Nasional Bhd 62,587 0.85
MEXICO 3.28% (30 September 2015: 7.29%) Airport Development/Maintenance
3,170 Grupo Aeroportuario del Centro Norte SAB de CV 18,092 0.24
4,100 Grupo Aeroportuario del Pacifico SAB de CV 37,951 0.52
Building-Heavy Construction
3,825 Promotora y Operadora de Infraestructura SAB de CV 41,399 0.56
Petrochemicals 11,100 Alpek SAB de CV 18,849 0.26 Reits-Diversified
14,700 Fibra Uno Administracion SA de CV 26,685 0.36
Reits-Warehouse/Industrial
21,600 Macquarie Mexico Real Estate Management SA de CV 26,408 0.36
Retail-Hypermarkets 32,159 Wal-Mart de Mexico SAB de CV 71,571 0.98
PERU 0.80% (30 September 2015: 0.00%) Commercial Banks Non-US 390 Credicorp Ltd 58,867 0.80
POLAND 0.00% (30 September 2015: 1.68%)
RUSSIA 5.29% (30 September 2015: 2.74%) Commercial Banks Non-US 13,739 Sberbank of Russia PJSC 128,776 1.75 Food-Retail 1,595 X5 Retail Group NV 46,095 0.63 Oil Company-Integrated 3,430 Lukoil PJSC 166,372 2.27 1,539 Tatneft PJSC 47,232 0.64
SOUTH AFRICA 6.39% (30 September 2015: 8.38%) Cellular Telecom 2,477 Vodacom Group Ltd 27,616 0.38 Commercial Banks Non-US 8,551 Barclays Africa Group Ltd 92,132 1.26 3,847 Nedbank Group Ltd 60,934 0.83 Gold Mining 1,320 AngloGold Ashanti Ltd 21,665 0.29 Home Furnishings 10,380 Steinhoff International Holdings Ltd 58,811 0.80 Metal-Iron 123 Kumba Iron Ore Ltd 1,049 0.01 Multimedia 846 Naspers Ltd 144,504 1.97 Paper & Related Products 8,160 Sappi Ltd 41,034 0.56 Retail-Miscellaneous/Diversified 1,960 Mr Price Group Ltd 21,498 0.29
SOUTH KOREA 14.16% (30 September 2015: 16.04%) Building-Heavy Construction 405 Daelim Industrial Co Ltd 30,485 0.41 Chemicals-Diversified 2,107 Hanwha Chemical Corp 46,297 0.63 Commercial Banks Non-US 3,821 Woori Bank 39,551 0.54 Diversified Financial Services 2,247 Shinhan Financial Group Co Ltd 81,915 1.12 Electric-Integrated 1,014 Korea Electric Power Corp 49,717 0.68
EMERGING MARKETS EQUITY FUND (continued)
Nominal Security Value USD
% Net Assets
SOUTH KOREA 14.16% (30 September 2015: 16.04%) (continued) Electronic Component-Semiconductor 272 Samsung Electronics Co Ltd 394,658 5.38 Metal Products-Distribution 460 Hyosung Corp 54,297 0.74 Oil Refining & Marketing 372 SK Innovation Co Ltd 54,549 0.74 Rubber-Tires 1,148 Hankook Tire Co Ltd 61,916 0.84 Tobacco 990 KT&G Corp 112,362 1.53 Web Portals/Internet Service Provider 142 NAVER Corp 113,848 1.55
TAIWAN 14.00% (30 September 2015: 16.36%) Auto/Truck Parts & Equipment-Original 8,000 Hiroca Holdings Ltd 30,881 0.42 27,000 Tong Yang Industry Co Ltd 64,086 0.87 Circuit Boards 15,000 Chin-Poon Industrial Co Ltd 33,402 0.46 Diversified Financial Services 50,000 Fubon Financial Holding Co Ltd 73,854 1.01 81,550 Mega Financial Holding Co Ltd 57,367 0.78 Electronic Component-Semiconductor 694 Silicon Motion Technology Corp 35,887 0.49 Food-Miscellaneous/Diversified 23,440 Uni-President Enterprises Corp 43,970 0.60 Optical Supplies 1,000 St Shine Optical Co Ltd 23,257 0.32 Photo Equipment & Supplies 1,000 Largan Precision Co Ltd 120,591 1.64 Semicon Component-Integrated Circuits 28,000 Powertech Technology Inc 72,623 0.99
65,244 Taiwan Semiconductor Manufacturing Co Ltd 379,864 5.17
Telecom Services 26,000 Chunghwa Telecom Co Ltd 91,656 1.25
THAILAND 2.69% (30 September 2015: 0.82%) Commercial Banks Non-US 11,700 Siam Commercial Bank PCL/The 50,128 0.68 Diversified Operations 2,850 Siam Cement PCL/The 42,758 0.58 Food-Miscellaneous/Diversified 56,200 Charoen Pokphand Foods PCL 51,076 0.70 Oil Company-Integrated 5,400 PTT PCL 53,128 0.73
TURKEY 0.00% (30 September 2015: 1.50%)
UNITED ARAB EMIRATES 0.00% (30 September 2015: 0.57%) Total Value of Transferable Securities at Mid Market Prices (Cost: USD6,179,064) 7,143,329 97.32
Open Forward Foreign Currency Exchange Contracts 0.00% (30 September 2015: 0.00%)
Open Spot Currency Contracts 0.00% (30 September 2015: (0.00%)) Settlement Buy Amount Sell Amount Unrealised % Net Date Bought Sold Gain/Loss Assets
03/10/2016 USD 2,630 HKD (20,399) (1) (0.00) 03/10/2016 USD 2,677 HKD (20,757) (1) (0.00) 03/10/2016 USD 10,156 ZAR (139,377) 211 0.00 04/10/2016 USD 1,438 HKD (11,155) (0) (0.00) 04/10/2016 ZAR 77,821 USD (5,570) (17) (0.00) Unrealised Gains on Open Spot Currency Contracts 211 0.00
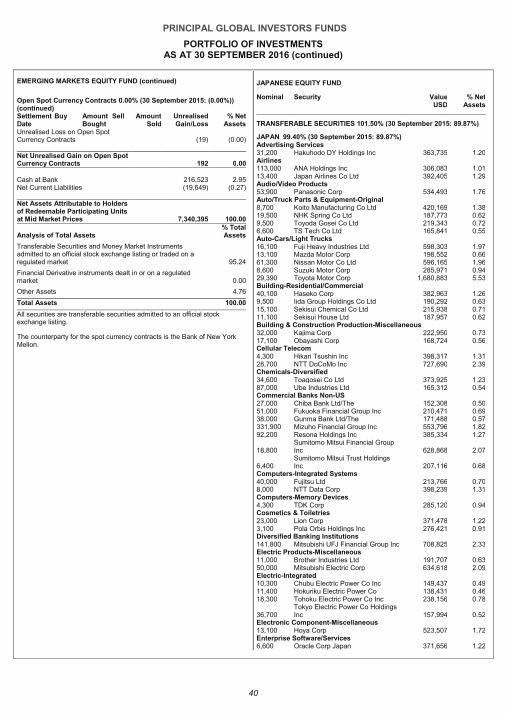
PRINCIPAL GLOBAL INVESTORS FUNDS
PORTFOLIO OF INVESTMENTS AS AT 30 SEPTEMBER 2016 (continued)
40
EMERGING MARKETS EQUITY FUND (continued)
Open Spot Currency Contracts 0.00% (30 September 2015: (0.00%)) (continued) Settlement Buy Amount Sell Amount Unrealised % Net Date Bought Sold Gain/Loss Assets Unrealised Loss on Open Spot Currency Contracts (19) (0.00) Net Unrealised Gain on Open Spot Currency Contracts 192 0 .00
Cash at Bank 216,523 2.95 Net Current Liabilities (19,649) (0.27) Net Assets Attributable to Holders of Redeemable Participating Units at Mid Market Prices 7,340,395 100.00
Analysis of Total Assets % Total Assets
Transferable Securities and Money Market Instruments admitted to an official stock exchange listing or traded on a regulated market 95.24
Financial Derivative instruments dealt in or on a regulated market 0.00
Other Assets 4.76
Total Assets 100.00
All securities are transferable securities admitted to an official stock exchange listing.
The counterparty for the spot currency contracts is the Bank of New York Mellon.
JAPANESE EQUITY FUND
Nominal Security Value USD
% Net Assets
TRANSFERABLE SECURITIES 101.50% (30 September 2015: 89.87%)
JAPAN 99.40% (30 September 2015: 89.87%) Advertising Services 31,200 Hakuhodo DY Holdings Inc 363,735 1.20 Airlines 113,000 ANA Holdings Inc 306,083 1.01 13,400 Japan Airlines Co Ltd 392,405 1.29 Audio/Video Products 53,900 Panasonic Corp 534,493 1.76 Auto/Truck Parts & Equipment-Original 8,700 Koito Manufacturing Co Ltd 420,169 1.38 19,500 NHK Spring Co Ltd 187,773 0.62 9,500 Toyoda Gosei Co Ltd 219,343 0.72 6,600 TS Tech Co Ltd 165,841 0.55 Auto-Cars/Light Trucks 16,100 Fuji Heavy Industries Ltd 598,303 1.97 13,100 Mazda Motor Corp 198,552 0.66 61,300 Nissan Motor Co Ltd 596,165 1.96 8,600 Suzuki Motor Corp 285,971 0.94 29,390 Toyota Motor Corp 1,680,883 5.53 Building-Residential/Commercial 40,100 Haseko Corp 382,963 1.26 9,500 Iida Group Holdings Co Ltd 190,292 0.63 15,100 Sekisui Chemical Co Ltd 215,938 0.71 11,100 Sekisui House Ltd 187,957 0.62 Building & Construction Production-Miscellaneous 32,000 Kajima Corp 222,950 0.73 17,100 Obayashi Corp 168,724 0.56 Cellular Telecom 4,300 Hikari Tsushin Inc 398,317 1.31 28,700 NTT DoCoMo Inc 727,690 2.39 Chemicals-Diversified 34,600 Toagosei Co Ltd 373,925 1.23 87,000 Ube Industries Ltd 165,312 0.54 Commercial Banks Non-US 27,000 Chiba Bank Ltd/The 152,308 0.50 51,000 Fukuoka Financial Group Inc 210,471 0.69 38,000 Gunma Bank Ltd/The 171,488 0.57 331,900 Mizuho Financial Group Inc 553,796 1.82 92,200 Resona Holdings Inc 385,334 1.27
18,800 Sumitomo Mitsui Financial Group Inc 628,868 2.07
6,400 Sumitomo Mitsui Trust Holdings Inc 207,116 0.68
Computers-Integrated Systems 40,000 Fujitsu Ltd 213,766 0.70 8,000 NTT Data Corp 398,239 1.31 Computers-Memory Devices 4,300 TDK Corp 285,120 0.94 Cosmetics & Toiletries 23,000 Lion Corp 371,478 1.22 3,100 Pola Orbis Holdings Inc 276,421 0.91 Diversified Banking Institutions 141,800 Mitsubishi UFJ Financial Group Inc 708,825 2.33 Electric Products-Miscellaneous 11,000 Brother Industries Ltd 191,707 0.63 50,000 Mitsubishi Electric Corp 634,618 2.09 Electric-Integrated 10,300 Chubu Electric Power Co Inc 149,437 0.49 11,400 Hokuriku Electric Power Co 138,431 0.46 18,300 Tohoku Electric Power Co Inc 238,156 0.78
36,700 Tokyo Electric Power Co Holdings Inc 157,994 0.52
Electronic Component-Miscellaneous 13,100 Hoya Corp 523,507 1.72 Enterprise Software/Services 6,600 Oracle Corp Japan 371,656 1.22
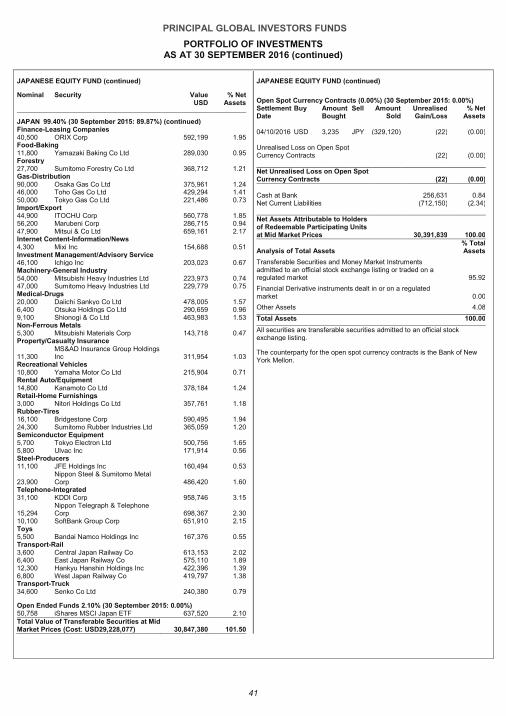
PRINCIPAL GLOBAL INVESTORS FUNDS
PORTFOLIO OF INVESTMENTS AS AT 30 SEPTEMBER 2016 (continued)
41
JAPANESE EQUITY FUND (continued)
Nominal Security Value USD
% Net Assets
JAPAN 99.40% (30 September 2015: 89.87%) (continued) Finance-Leasing Companies 40,500 ORIX Corp 592,199 1.95 Food-Baking 11,800 Yamazaki Baking Co Ltd 289,030 0.95 Forestry 27,700 Sumitomo Forestry Co Ltd 368,712 1.21 Gas-Distribution 90,000 Osaka Gas Co Ltd 375,961 1.24 46,000 Toho Gas Co Ltd 429,294 1.41 50,000 Tokyo Gas Co Ltd 221,486 0.73 Import/Export 44,900 ITOCHU Corp 560,778 1.85 56,200 Marubeni Corp 286,715 0.94 47,900 Mitsui & Co Ltd 659,161 2.17 Internet Content-Information/News 4,300 Mixi Inc 154,688 0.51 Investment Management/Advisory Service 46,100 Ichigo Inc 203,023 0.67 Machinery-General Industry 54,000 Mitsubishi Heavy Industries Ltd 223,973 0.74 47,000 Sumitomo Heavy Industries Ltd 229,779 0.75 Medical-Drugs 20,000 Daiichi Sankyo Co Ltd 478,005 1.57 6,400 Otsuka Holdings Co Ltd 290,659 0.96 9,100 Shionogi & Co Ltd 463,983 1.53 Non-Ferrous Metals 5,300 Mitsubishi Materials Corp 143,718 0.47 Property/Casualty Insurance
11,300 MS&AD Insurance Group Holdings Inc 311,954 1.03
Recreational Vehicles 10,800 Yamaha Motor Co Ltd 215,904 0.71 Rental Auto/Equipment 14,800 Kanamoto Co Ltd 378,184 1.24 Retail-Home Furnishings 3,000 Nitori Holdings Co Ltd 357,761 1.18 Rubber-Tires 16,100 Bridgestone Corp 590,495 1.94 24,300 Sumitomo Rubber Industries Ltd 365,059 1.20 Semiconductor Equipment 5,700 Tokyo Electron Ltd 500,756 1.65 5,800 Ulvac Inc 171,914 0.56 Steel-Producers 11,100 JFE Holdings Inc 160,494 0.53
23,900 Nippon Steel & Sumitomo Metal Corp 486,420 1.60
Telephone-Integrated 31,100 KDDI Corp 958,746 3.15
15,294 Nippon Telegraph & Telephone Corp 698,367 2.30
10,100 SoftBank Group Corp 651,910 2.15 Toys 5,500 Bandai Namco Holdings Inc 167,376 0.55 Transport-Rail 3,600 Central Japan Railway Co 613,153 2.02 6,400 East Japan Railway Co 575,110 1.89 12,300 Hankyu Hanshin Holdings Inc 422,396 1.39 6,800 West Japan Railway Co 419,797 1.38 Transport-Truck 34,600 Senko Co Ltd 240,380 0.79
Open Ended Funds 2.10% (30 September 2015: 0.00%) 50,758 iShares MSCI Japan ETF 637,520 2.10 Total Value of Transferable Securities at Mid Market Prices (Cost: USD29,228,077) 30,847,380 101.50
JAPANESE EQUITY FUND (continued)
Open Spot Currency Contracts (0.00%) (30 September 2015: 0.00%) Settlement Buy Amount Sell Amount Unrealised % Net Date Bought Sold Gain/Loss Assets
04/10/2016 USD 3,235 JPY (329,120) (22) (0.00) Unrealised Loss on Open Spot Currency Contracts (22) (0.00) Net Unrealised Loss on Open Spot Currency Contracts (22) (0 .00)
Cash at Bank 256,631 0.84 Net Current Liabilities (712,150) (2.34) Net Assets Attributable to Holders of Redeemable Participating Units at Mid Market Prices 30,391,839 100.00
Analysis of Total Assets % Total Assets
Transferable Securities and Money Market Instruments admitted to an official stock exchange listing or traded on a regulated market 95.92
Financial Derivative instruments dealt in or on a regulated market 0.00
Other Assets 4.08
Total Assets 100.00
All securities are transferable securities admitted to an official stock exchange listing.
The counterparty for the open spot currency contracts is the Bank of New York Mellon.
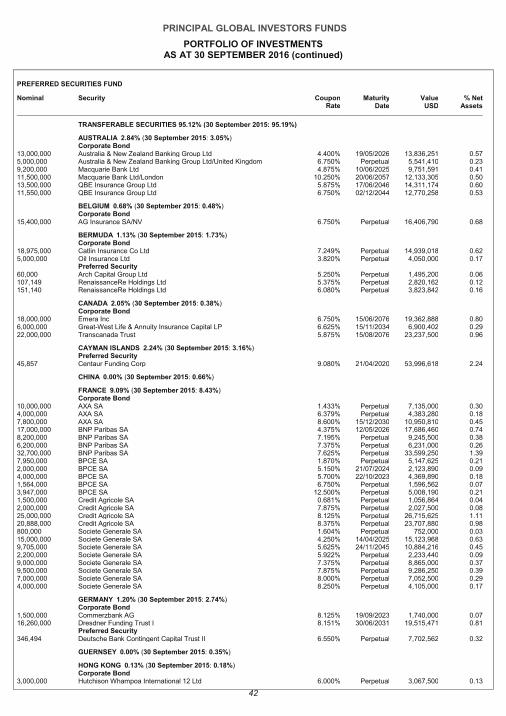
PRINCIPAL GLOBAL INVESTORS FUNDS
PORTFOLIO OF INVESTMENTS AS AT 30 SEPTEMBER 2016 (continued)
42
t
PREFERRED SECURITIES FUND
Nominal Security Coupon Rate
Maturity Date
Value USD
% Net Assets
TRANSFERABLE SECURITIES 95.12% (30 September 2015: 95.19%)
AUSTRALIA 2.84% (30 September 2015: 3.05%) Corporate Bond
13,000,000 Australia & New Zealand Banking Group Ltd 4.400% 19/05/2026 13,836,251 0.57 5,000,000 Australia & New Zealand Banking Group Ltd/United Kingdom 6.750% Perpetual 5,541,410 0.23 9,200,000 Macquarie Bank Ltd 4.875% 10/06/2025 9,751,591 0.41 11,500,000 Macquarie Bank Ltd/London 10.250% 20/06/2057 12,133,305 0.50 13,500,000 QBE Insurance Group Ltd 5.875% 17/06/2046 14,311,174 0.60 11,550,000 QBE Insurance Group Ltd 6.750% 02/12/2044 12,770,258 0.53
BELGIUM 0.68% (30 September 2015: 0.48%) Corporate Bond
15,400,000 AG Insurance SA/NV 6.750% Perpetual 16,406,790 0.68
BERMUDA 1.13% (30 September 2015: 1.73%) Corporate Bond
18,975,000 Catlin Insurance Co Ltd 7.249% Perpetual 14,939,018 0.62 5,000,000 Oil Insurance Ltd 3.820% Perpetual 4,050,000 0.17
Preferred Security 60,000 Arch Capital Group Ltd 5.250% Perpetual 1,495,200 0.06 107,149 RenaissanceRe Holdings Ltd 5.375% Perpetual 2,820,162 0.12 151,140 RenaissanceRe Holdings Ltd 6.080% Perpetual 3,823,842 0.16
CANADA 2.05% (30 September 2015: 0.38%) Corporate Bond
18,000,000 Emera Inc 6.750% 15/06/2076 19,362,888 0.80 6,000,000 Great-West Life & Annuity Insurance Capital LP 6.625% 15/11/2034 6,900,402 0.29 22,000,000 Transcanada Trust 5.875% 15/08/2076 23,237,500 0.96
CAYMAN ISLANDS 2.24% (30 September 2015: 3.16%) Preferred Security
45,857 Centaur Funding Corp 9.080% 21/04/2020 53,996,618 2.24
CHINA 0.00% (30 September 2015: 0.66%)
FRANCE 9.09% (30 September 2015: 8.43%) Corporate Bond
10,000,000 AXA SA 1.433% Perpetual 7,135,000 0.30 4,000,000 AXA SA 6.379% Perpetual 4,383,280 0.18 7,800,000 AXA SA 8.600% 15/12/2030 10,950,810 0.45 17,000,000 BNP Paribas SA 4.375% 12/05/2026 17,686,460 0.74 8,200,000 BNP Paribas SA 7.195% Perpetual 9,245,500 0.38 6,200,000 BNP Paribas SA 7.375% Perpetual 6,231,000 0.26 32,700,000 BNP Paribas SA 7.625% Perpetual 33,599,250 1.39 7,950,000 BPCE SA 1.870% Perpetual 5,147,625 0.21 2,000,000 BPCE SA 5.150% 21/07/2024 2,123,890 0.09 4,000,000 BPCE SA 5.700% 22/10/2023 4,369,890 0.18 1,564,000 BPCE SA 6.750% Perpetual 1,596,562 0.07 3,947,000 BPCE SA 12.500% Perpetual 5,008,190 0.21 1,500,000 Credit Agricole SA 0.681% Perpetual 1,056,864 0.04 2,000,000 Credit Agricole SA 7.875% Perpetual 2,027,500 0.08 25,000,000 Credit Agricole SA 8.125% Perpetual 26,715,625 1.11 20,888,000 Credit Agricole SA 8.375% Perpetual 23,707,880 0.98 800,000 Societe Generale SA 1.604% Perpetual 752,000 0.03 15,000,000 Societe Generale SA 4.250% 14/04/2025 15,123,968 0.63 9,705,000 Societe Generale SA 5.625% 24/11/2045 10,884,216 0.45 2,200,000 Societe Generale SA 5.922% Perpetual 2,233,440 0.09 9,000,000 Societe Generale SA 7.375% Perpetual 8,865,000 0.37 9,500,000 Societe Generale SA 7.875% Perpetual 9,286,250 0.39 7,000,000 Societe Generale SA 8.000% Perpetual 7,052,500 0.29 4,000,000 Societe Generale SA 8.250% Perpetual 4,105,000 0.17
GERMANY 1.20% (30 September 2015: 2.74%) Corporate Bond
1,500,000 Commerzbank AG 8.125% 19/09/2023 1,740,000 0.07 16,260,000 Dresdner Funding Trust I 8.151% 30/06/2031 19,515,471 0.81
Preferred Security 346,494 Deutsche Bank Contingent Capital Trust II 6.550% Perpetual 7,702,562 0.32
GUERNSEY 0.00% (30 September 2015: 0.35%)
HONG KONG 0.13% (30 September 2015: 0.18%) Corporate Bond
3,000,000 Hutchison Whampoa International 12 Ltd 6.000% Perpetual 3,067,500 0.13
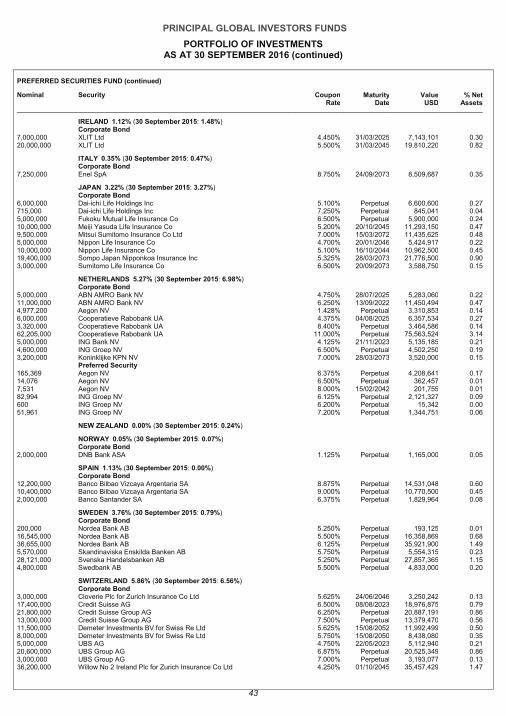
PRINCIPAL GLOBAL INVESTORS FUNDS
PORTFOLIO OF INVESTMENTS AS AT 30 SEPTEMBER 2016 (continued)
43
PREFERRED SECURITIES FUND (continued)
Nominal Security Coupon Rate
Maturity Date
Value USD
% Net Assets
IRELAND 1.12% (30 September 2015: 1.48%) Corporate Bond
7,000,000 XLIT Ltd 4.450% 31/03/2025 7,143,101 0.30 20,000,000 XLIT Ltd 5.500% 31/03/2045 19,810,220 0.82
ITALY 0.35% (30 September 2015: 0.47%) Corporate Bond
7,250,000 Enel SpA 8.750% 24/09/2073 8,509,687 0.35
JAPAN 3.22% (30 September 2015: 3.27%) Corporate Bond
6,000,000 Dai-ichi Life Holdings Inc 5.100% Perpetual 6,600,600 0.27 715,000 Dai-ichi Life Holdings Inc 7.250% Perpetual 845,041 0.04 5,000,000 Fukoku Mutual Life Insurance Co 6.500% Perpetual 5,900,000 0.24 10,000,000 Meiji Yasuda Life Insurance Co 5.200% 20/10/2045 11,293,150 0.47 9,500,000 Mitsui Sumitomo Insurance Co Ltd 7.000% 15/03/2072 11,435,625 0.48 5,000,000 Nippon Life Insurance Co 4.700% 20/01/2046 5,424,917 0.22 10,000,000 Nippon Life Insurance Co 5.100% 16/10/2044 10,962,500 0.45 19,400,000 Sompo Japan Nipponkoa Insurance Inc 5.325% 28/03/2073 21,776,500 0.90 3,000,000 Sumitomo Life Insurance Co 6.500% 20/09/2073 3,588,750 0.15
NETHERLANDS 5.27% (30 September 2015: 6.98%) Corporate Bond
5,000,000 ABN AMRO Bank NV 4.750% 28/07/2025 5,283,060 0.22 11,000,000 ABN AMRO Bank NV 6.250% 13/09/2022 11,450,494 0.47 4,977,200 Aegon NV 1.428% Perpetual 3,310,853 0.14 6,000,000 Cooperatieve Rabobank UA 4.375% 04/08/2025 6,357,534 0.27 3,320,000 Cooperatieve Rabobank UA 8.400% Perpetual 3,464,586 0.14 62,205,000 Cooperatieve Rabobank UA 11.000% Perpetual 75,563,524 3.14 5,000,000 ING Bank NV 4.125% 21/11/2023 5,135,185 0.21 4,600,000 ING Groep NV 6.500% Perpetual 4,502,250 0.19 3,200,000 Koninklijke KPN NV 7.000% 28/03/2073 3,520,000 0.15
Preferred Security 165,369 Aegon NV 6.375% Perpetual 4,208,641 0.17 14,076 Aegon NV 6.500% Perpetual 362,457 0.01 7,531 Aegon NV 8.000% 15/02/2042 201,755 0.01 82,994 ING Groep NV 6.125% Perpetual 2,121,327 0.09 600 ING Groep NV 6.200% Perpetual 15,342 0.00 51,961 ING Groep NV 7.200% Perpetual 1,344,751 0.06
NEW ZEALAND 0.00% (30 September 2015: 0.24%)
NORWAY 0.05% (30 September 2015: 0.07%) Corporate Bond
2,000,000 DNB Bank ASA 1.125% Perpetual 1,165,000 0.05
SPAIN 1.13% (30 September 2015: 0.00%) Corporate Bond
12,200,000 Banco Bilbao Vizcaya Argentaria SA 8.875% Perpetual 14,531,048 0.60 10,400,000 Banco Bilbao Vizcaya Argentaria SA 9.000% Perpetual 10,770,500 0.45 2,000,000 Banco Santander SA 6.375% Perpetual 1,829,964 0.08
SWEDEN 3.76% (30 September 2015: 0.79%) Corporate Bond
200,000 Nordea Bank AB 5.250% Perpetual 193,125 0.01 16,545,000 Nordea Bank AB 5.500% Perpetual 16,358,869 0.68 36,655,000 Nordea Bank AB 6.125% Perpetual 35,921,900 1.49 5,570,000 Skandinaviska Enskilda Banken AB 5.750% Perpetual 5,554,315 0.23 28,121,000 Svenska Handelsbanken AB 5.250% Perpetual 27,857,365 1.15 4,800,000 Swedbank AB 5.500% Perpetual 4,833,000 0.20
SWITZERLAND 5.86% (30 September 2015: 6.56%) Corporate Bond
3,000,000 Cloverie Plc for Zurich Insurance Co Ltd 5.625% 24/06/2046 3,250,242 0.13 17,400,000 Credit Suisse AG 6.500% 08/08/2023 18,976,875 0.79 21,800,000 Credit Suisse Group AG 6.250% Perpetual 20,887,191 0.86 13,000,000 Credit Suisse Group AG 7.500% Perpetual 13,379,470 0.56 11,500,000 Demeter Investments BV for Swiss Re Ltd 5.625% 15/08/2052 11,992,499 0.50 8,000,000 Demeter Investments BV for Swiss Re Ltd 5.750% 15/08/2050 8,438,080 0.35 5,000,000 UBS AG 4.750% 22/05/2023 5,112,940 0.21 20,600,000 UBS Group AG 6.875% Perpetual 20,525,349 0.86 3,000,000 UBS Group AG 7.000% Perpetual 3,193,077 0.13 36,200,000 Willow No 2 Ireland Plc for Zurich Insurance Co Ltd 4.250% 01/10/2045 35,457,429 1.47
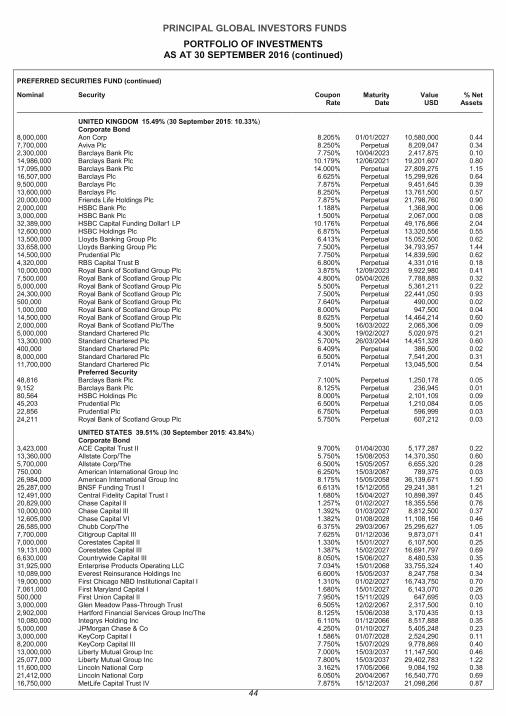
PRINCIPAL GLOBAL INVESTORS FUNDS
PORTFOLIO OF INVESTMENTS AS AT 30 SEPTEMBER 2016 (continued)
44
PREFERRED SECURITIES FUND (continued)
Nominal Security Coupon Rate
Maturity Date
Value USD
% Net Assets
UNITED KINGDOM 15.49% (30 September 2015: 10.33%) Corporate Bond
8,000,000 Aon Corp 8.205% 01/01/2027 10,580,000 0.44 7,700,000 Aviva Plc 8.250% Perpetual 8,209,047 0.34 2,300,000 Barclays Bank Plc 7.750% 10/04/2023 2,417,875 0.10 14,986,000 Barclays Bank Plc 10.179% 12/06/2021 19,201,607 0.80 17,095,000 Barclays Bank Plc 14.000% Perpetual 27,809,275 1.15 16,507,000 Barclays Plc 6.625% Perpetual 15,299,926 0.64 9,500,000 Barclays Plc 7.875% Perpetual 9,451,645 0.39 13,600,000 Barclays Plc 8.250% Perpetual 13,761,500 0.57 20,000,000 Friends Life Holdings Plc 7.875% Perpetual 21,798,760 0.90 2,000,000 HSBC Bank Plc 1.188% Perpetual 1,368,900 0.06 3,000,000 HSBC Bank Plc 1.500% Perpetual 2,067,000 0.08 32,389,000 HSBC Capital Funding Dollar1 LP 10.176% Perpetual 49,176,866 2.04 12,600,000 HSBC Holdings Plc 6.875% Perpetual 13,320,556 0.55 13,500,000 Lloyds Banking Group Plc 6.413% Perpetual 15,052,500 0.62 33,658,000 Lloyds Banking Group Plc 7.500% Perpetual 34,793,957 1.44 14,500,000 Prudential Plc 7.750% Perpetual 14,839,590 0.62 4,320,000 RBS Capital Trust B 6.800% Perpetual 4,331,016 0.18 10,000,000 Royal Bank of Scotland Group Plc 3.875% 12/09/2023 9,922,980 0.41 7,500,000 Royal Bank of Scotland Group Plc 4.800% 05/04/2026 7,788,889 0.32 5,000,000 Royal Bank of Scotland Group Plc 5.500% Perpetual 5,361,211 0.22 24,300,000 Royal Bank of Scotland Group Plc 7.500% Perpetual 22,441,050 0.93 500,000 Royal Bank of Scotland Group Plc 7.640% Perpetual 490,000 0.02 1,000,000 Royal Bank of Scotland Group Plc 8.000% Perpetual 947,500 0.04 14,500,000 Royal Bank of Scotland Group Plc 8.625% Perpetual 14,464,214 0.60 2,000,000 Royal Bank of Scotland Plc/The 9.500% 16/03/2022 2,065,306 0.09 5,000,000 Standard Chartered Plc 4.300% 19/02/2027 5,020,975 0.21 13,300,000 Standard Chartered Plc 5.700% 26/03/2044 14,451,328 0.60 400,000 Standard Chartered Plc 6.409% Perpetual 386,500 0.02 8,000,000 Standard Chartered Plc 6.500% Perpetual 7,541,200 0.31 11,700,000 Standard Chartered Plc 7.014% Perpetual 13,045,500 0.54
Preferred Security 48,816 Barclays Bank Plc 7.100% Perpetual 1,250,178 0.05 9,152 Barclays Bank Plc 8.125% Perpetual 236,945 0.01 80,564 HSBC Holdings Plc 8.000% Perpetual 2,101,109 0.09 45,203 Prudential Plc 6.500% Perpetual 1,210,084 0.05 22,856 Prudential Plc 6.750% Perpetual 596,999 0.03 24,211 Royal Bank of Scotland Group Plc 5.750% Perpetual 607,212 0.03
UNITED STATES 39.51% (30 September 2015: 43.84%) Corporate Bond
3,423,000 ACE Capital Trust II 9.700% 01/04/2030 5,177,287 0.22 13,360,000 Allstate Corp/The 5.750% 15/08/2053 14,370,350 0.60 5,700,000 Allstate Corp/The 6.500% 15/05/2057 6,655,320 0.28 750,000 American International Group Inc 6.250% 15/03/2087 789,375 0.03 26,984,000 American International Group Inc 8.175% 15/05/2058 36,139,671 1.50 25,287,000 BNSF Funding Trust I 6.613% 15/12/2055 29,241,381 1.21 12,491,000 Central Fidelity Capital Trust I 1.680% 15/04/2027 10,898,397 0.45 20,829,000 Chase Capital II 1.257% 01/02/2027 18,355,556 0.76 10,000,000 Chase Capital III 1.392% 01/03/2027 8,812,500 0.37 12,605,000 Chase Capital VI 1.382% 01/08/2028 11,108,156 0.46 26,585,000 Chubb Corp/The 6.375% 29/03/2067 25,295,627 1.05 7,700,000 Citigroup Capital III 7.625% 01/12/2036 9,873,071 0.41 7,000,000 Corestates Capital II 1.330% 15/01/2027 6,107,500 0.25 19,131,000 Corestates Capital III 1.387% 15/02/2027 16,691,797 0.69 6,630,000 Countrywide Capital III 8.050% 15/06/2027 8,480,539 0.35 31,925,000 Enterprise Products Operating LLC 7.034% 15/01/2068 33,755,324 1.40 10,089,000 Everest Reinsurance Holdings Inc 6.600% 15/05/2037 8,247,758 0.34 19,000,000 First Chicago NBD Institutional Capital I 1.310% 01/02/2027 16,743,750 0.70 7,061,000 First Maryland Capital I 1.680% 15/01/2027 6,143,070 0.26 500,000 First Union Capital II 7.950% 15/11/2029 647,695 0.03 3,000,000 Glen Meadow Pass-Through Trust 6.505% 12/02/2067 2,317,500 0.10 2,902,000 Hartford Financial Services Group Inc/The 8.125% 15/06/2038 3,170,435 0.13 10,080,000 Integrys Holding Inc 6.110% 01/12/2066 8,517,888 0.35 5,000,000 JPMorgan Chase & Co 4.250% 01/10/2027 5,405,248 0.23 3,000,000 KeyCorp Capital I 1.586% 01/07/2028 2,524,290 0.11 8,200,000 KeyCorp Capital III 7.750% 15/07/2029 9,778,869 0.40 13,000,000 Liberty Mutual Group Inc 7.000% 15/03/2037 11,147,500 0.46 25,077,000 Liberty Mutual Group Inc 7.800% 15/03/2037 29,402,783 1.22 11,600,000 Lincoln National Corp 3.162% 17/05/2066 9,084,192 0.38 21,412,000 Lincoln National Corp 6.050% 20/04/2067 16,540,770 0.69 16,750,000 MetLife Capital Trust IV 7.875% 15/12/2037 21,098,266 0.87
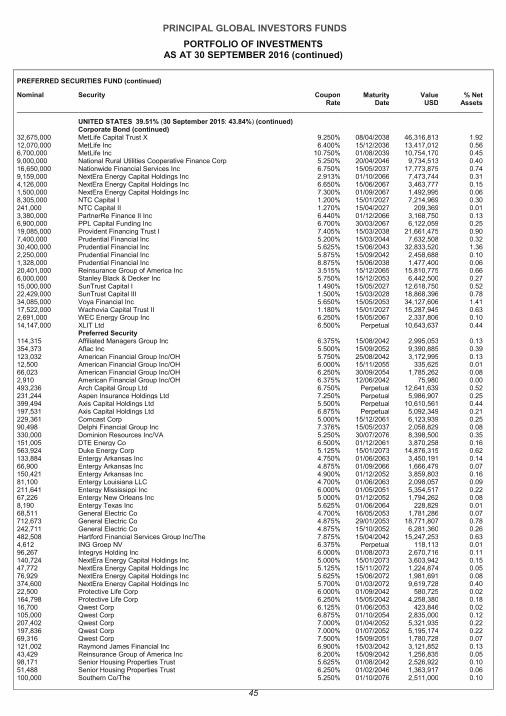
PRINCIPAL GLOBAL INVESTORS FUNDS
PORTFOLIO OF INVESTMENTS AS AT 30 SEPTEMBER 2016 (continued)
45
PREFERRED SECURITIES FUND (continued)
Nominal Security Coupon Rate
Maturity Date
Value USD
% Net Assets
UNITED STATES 39.51% (30 September 2015: 43.84%) (continued) Corporate Bond (continued)
32,675,000 MetLife Capital Trust X 9.250% 08/04/2038 46,316,813 1.92 12,070,000 MetLife Inc 6.400% 15/12/2036 13,417,012 0.56 6,700,000 MetLife Inc 10.750% 01/08/2039 10,754,170 0.45 9,000,000 National Rural Utilities Cooperative Finance Corp 5.250% 20/04/2046 9,734,513 0.40 16,650,000 Nationwide Financial Services Inc 6.750% 15/05/2037 17,773,875 0.74 9,159,000 NextEra Energy Capital Holdings Inc 2.913% 01/10/2066 7,473,744 0.31 4,126,000 NextEra Energy Capital Holdings Inc 6.650% 15/06/2067 3,463,777 0.15 1,500,000 NextEra Energy Capital Holdings Inc 7.300% 01/09/2067 1,492,995 0.06 8,305,000 NTC Capital I 1.200% 15/01/2027 7,214,969 0.30 241,000 NTC Capital II 1.270% 15/04/2027 209,369 0.01 3,380,000 PartnerRe Finance II Inc 6.440% 01/12/2066 3,168,750 0.13 6,900,000 PPL Capital Funding Inc 6.700% 30/03/2067 6,122,059 0.25 19,085,000 Provident Financing Trust I 7.405% 15/03/2038 21,661,475 0.90 7,400,000 Prudential Financial Inc 5.200% 15/03/2044 7,632,508 0.32 30,400,000 Prudential Financial Inc 5.625% 15/06/2043 32,833,520 1.36 2,250,000 Prudential Financial Inc 5.875% 15/09/2042 2,458,688 0.10 1,328,000 Prudential Financial Inc 8.875% 15/06/2038 1,477,400 0.06 20,401,000 Reinsurance Group of America Inc 3.515% 15/12/2065 15,810,775 0.66 6,000,000 Stanley Black & Decker Inc 5.750% 15/12/2053 6,442,500 0.27 15,000,000 SunTrust Capital I 1.490% 15/05/2027 12,618,750 0.52 22,429,000 SunTrust Capital III 1.500% 15/03/2028 18,868,396 0.78 34,085,000 Voya Financial Inc 5.650% 15/05/2053 34,127,606 1.41 17,522,000 Wachovia Capital Trust II 1.180% 15/01/2027 15,287,945 0.63 2,691,000 WEC Energy Group Inc 6.250% 15/05/2067 2,337,806 0.10 14,147,000 XLIT Ltd 6.500% Perpetual 10,643,637 0.44
Preferred Security 114,315 Affiliated Managers Group Inc 6.375% 15/08/2042 2,995,053 0.13 354,373 Aflac Inc 5.500% 15/09/2052 9,390,885 0.39 123,032 American Financial Group Inc/OH 5.750% 25/08/2042 3,172,995 0.13 12,500 American Financial Group Inc/OH 6.000% 15/11/2055 335,625 0.01 66,023 American Financial Group Inc/OH 6.250% 30/09/2054 1,785,262 0.08 2,910 American Financial Group Inc/OH 6.375% 12/06/2042 75,980 0.00 493,236 Arch Capital Group Ltd 6.750% Perpetual 12,641,639 0.52 231,244 Aspen Insurance Holdings Ltd 7.250% Perpetual 5,986,907 0.25 399,494 Axis Capital Holdings Ltd 5.500% Perpetual 10,610,561 0.44 197,531 Axis Capital Holdings Ltd 6.875% Perpetual 5,092,349 0.21 229,361 Comcast Corp 5.000% 15/12/2061 6,123,939 0.25 90,498 Delphi Financial Group Inc 7.376% 15/05/2037 2,058,829 0.08 330,000 Dominion Resources Inc/VA 5.250% 30/07/2076 8,398,500 0.35 151,005 DTE Energy Co 6.500% 01/12/2061 3,870,258 0.16 563,924 Duke Energy Corp 5.125% 15/01/2073 14,876,315 0.62 133,884 Entergy Arkansas Inc 4.750% 01/06/2063 3,450,191 0.14 66,900 Entergy Arkansas Inc 4.875% 01/09/2066 1,666,479 0.07 150,421 Entergy Arkansas Inc 4.900% 01/12/2052 3,859,803 0.16 81,100 Entergy Louisiana LLC 4.700% 01/06/2063 2,098,057 0.09 211,641 Entergy Mississippi Inc 6.000% 01/05/2051 5,354,517 0.22 67,226 Entergy New Orleans Inc 5.000% 01/12/2052 1,794,262 0.08 8,190 Entergy Texas Inc 5.625% 01/06/2064 228,829 0.01 68,511 General Electric Co 4.700% 16/05/2053 1,781,286 0.07 712,673 General Electric Co 4.875% 29/01/2053 18,771,807 0.78 242,711 General Electric Co 4.875% 15/10/2052 6,281,360 0.26 482,508 Hartford Financial Services Group Inc/The 7.875% 15/04/2042 15,247,253 0.63 4,612 ING Groep NV 6.375% Perpetual 118,113 0.01 96,267 Integrys Holding Inc 6.000% 01/08/2073 2,670,716 0.11 140,724 NextEra Energy Capital Holdings Inc 5.000% 15/01/2073 3,603,942 0.15 47,772 NextEra Energy Capital Holdings Inc 5.125% 15/11/2072 1,224,874 0.05 76,929 NextEra Energy Capital Holdings Inc 5.625% 15/06/2072 1,981,691 0.08 374,600 NextEra Energy Capital Holdings Inc 5.700% 01/03/2072 9,619,728 0.40 22,500 Protective Life Corp 6.000% 01/09/2042 580,725 0.02 164,798 Protective Life Corp 6.250% 15/05/2042 4,258,380 0.18 16,700 Qwest Corp 6.125% 01/06/2053 423,846 0.02 105,000 Qwest Corp 6.875% 01/10/2054 2,835,000 0.12 207,402 Qwest Corp 7.000% 01/04/2052 5,321,935 0.22 197,836 Qwest Corp 7.000% 01/07/2052 5,195,174 0.22 69,316 Qwest Corp 7.500% 15/09/2051 1,780,728 0.07 121,002 Raymond James Financial Inc 6.900% 15/03/2042 3,121,852 0.13 43,429 Reinsurance Group of America Inc 6.200% 15/09/2042 1,256,835 0.05 98,171 Senior Housing Properties Trust 5.625% 01/08/2042 2,526,922 0.10 51,488 Senior Housing Properties Trust 6.250% 01/02/2046 1,363,917 0.06 100,000 Southern Co/The 5.250% 01/10/2076 2,511,000 0.10

PRINCIPAL GLOBAL INVESTORS FUNDS
PORTFOLIO OF INVESTMENTS AS AT 30 SEPTEMBER 2016 (continued)
46
PREFERRED SECURITIES FUND (continued)
Nominal Security Coupon Rate
Maturity Date
Value USD
% Net Assets
UNITED STATES 39.51% (30 September 2015: 43.84%) (continued) Preferred Security (continued)
121,044 Southern Co/The 6.250% 15/10/2075 3,339,604 0.14 448,077 Stanley Black & Decker Inc 5.750% 25/07/2052 11,623,117 0.48 2,772 Telephone & Data Systems Inc 5.875% 01/12/2061 69,688 0.01 122,593 Torchmark Corp 5.875% 15/12/2052 3,231,551 0.13 9,733 United States Cellular Corp 7.250% 01/12/2064 262,694 0.01 9,751 United States Cellular Corp 7.250% 01/12/2063 259,620 0.01 201,355 Ventas Realty LP / Ventas Capital Corp 5.450% 15/03/2043 5,575,520 0.23 603,446 Verizon Communications Inc 5.900% 15/02/2054 16,920,626 0.70 421,833 WR Berkley Corp 5.625% 30/04/2053 10,955,003 0.45
UNLISTED 0.00% (30 September 2015: 0.04%)
FRANCE 0.00% (30 September 2015: 0.04%) Total Value of Transferable Securities at Mid Market Prices (Cost: USD2,259,037,926) 2,292,905,589 95.12
Interest Receivable on Transferable Securities 27,715,642 1.15
Total Value of Transferable Securities 2,320,621,231 96.27
Open Forward Foreign Currency Exchange Contracts (0.09%) (30 September 2015: 0.06%) Settlement Date
Buy Amount Bought
Sell Amount Sold
Unrealised Gain/Loss
% Net Assets
17/10/2016 CHF 67,080 USD (69,377) (65) (0 .00)
17/10/2016 CHF 1,436 USD (1,478) 6 0 .00
17/10/2016 CHF 50,085 USD (51,712) 40 0 .00
17/10/2016 CHF 11,711 USD (12,055) 46 0 .00
17/10/2016 CHF 21,600 USD (22,253) 66 0 .00
17/10/2016 CHF 344,528 USD (354,642) 1,350 0 .00
17/10/2016 CHF 568,159 USD (585,317) 1,748 0 .00
17/10/2016 CHF 150,000 USD (153,218) 1,774 0 .00
17/10/2016 CHF 300,000 USD (308,064) 1,919 0 .00
17/10/2016 CHF 2,540,290 USD (2,614,863) 9,954 0 .00
17/10/2016 EUR 260,236,914 USD (293,725,761) (2,504,480) (0 .11)
17/10/2016 EUR 79,201,186 USD (89,393,270) (762,220) (0 .03)
17/10/2016 EUR 23,985,623 USD (27,072,237) (230,834) (0 .01)
17/10/2016 EUR 4,572,302 USD (5,160,693) (44,003) (0 .00)
17/10/2016 EUR 7,193,518 USD (8,089,874) (39,880) (0 .00)
17/10/2016 EUR 2,552,003 USD (2,880,423) (24,573) (0 .00)
17/10/2016 EUR 759,875 USD (857,664) (7,317) (0 .00)
17/10/2016 EUR 1,117,568 USD (1,256,823) (6,196) (0 .00)
17/10/2016 EUR 801,690 USD (901,982) (4,840) (0 .00)
17/10/2016 EUR 683,206 USD (768,518) (3,968) (0 .00)
17/10/2016 EUR 901,702 USD (1,011,867) (2,806) (0 .00)
17/10/2016 EUR 574,937 USD (646,100) (2,709) (0 .00)
17/10/2016 EUR 1,119,302 USD (1,255,242) (2,673) (0 .00)
17/10/2016 EUR 449,677 USD (505,798) (2,581) (0 .00)
17/10/2016 EUR 403,291 USD (453,743) (2,435) (0 .00)
17/10/2016 EUR 231,790 USD (261,619) (2,232) (0 .00)
17/10/2016 EUR 441,827 USD (495,807) (1,375) (0 .00)
17/10/2016 EUR 830,928 USD (930,764) (904) (0 .00)
17/10/2016 EUR 84,936 USD (95,867) (818) (0 .00)
17/10/2016 EUR 307,212 USD (344,523) (734) (0 .00)
17/10/2016 EUR 107,580 USD (121,081) (692) (0 .00)
17/10/2016 EUR 84,661 USD (95,227) (486) (0 .00)
17/10/2016 EUR 78,600 USD (88,435) (477) (0 .00)
17/10/2016 EUR 44,711 USD (50,465) (430) (0 .00)
17/10/2016 EUR 47,681 USD (53,665) (307) (0 .00)
17/10/2016 EUR 40,108 USD (45,125) (242) (0 .00)
17/10/2016 EUR 36,167 USD (40,683) (210) (0 .00)
17/10/2016 EUR 35,114 USD (39,489) (195) (0 .00)
17/10/2016 EUR 26,505 USD (29,831) (170) (0 .00)
17/10/2016 EUR 24,931 USD (28,043) (143) (0 .00)
17/10/2016 EUR 21,713 USD (24,400) (102) (0 .00)
17/10/2016 EUR 21,417 USD (24,018) (51) (0 .00)
17/10/2016 EUR 10,417 USD (11,668) (11) (0 .00)
17/10/2016 EUR 1,276 USD (1,434) (6) (0 .00)
17/10/2016 EUR 3,181 USD (3,556) 4 0 .00
17/10/2016 EUR 45,171 USD (50,491) 58 0 .00
17/10/2016 EUR 129,018 USD (143,991) 388 0 .00
17/10/2016 EUR 160,895 USD (179,568) 484 0 .00
17/10/2016 EUR 460,766 USD (515,038) 588 0 .00
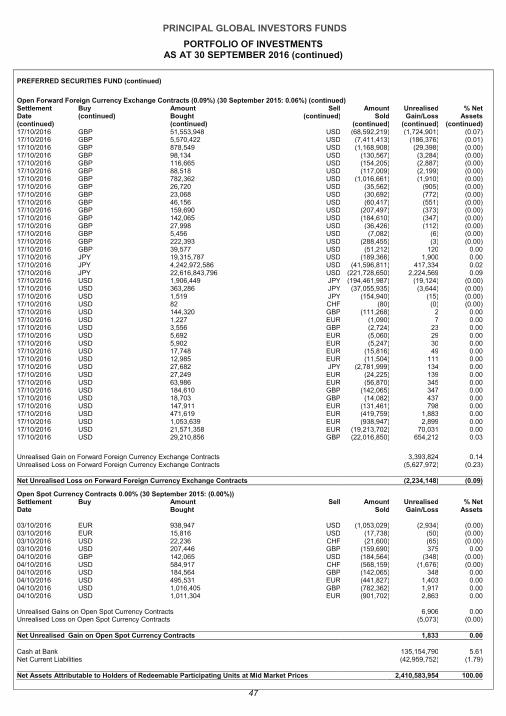
PRINCIPAL GLOBAL INVESTORS FUNDS
PORTFOLIO OF INVESTMENTS AS AT 30 SEPTEMBER 2016 (continued)
47
PREFERRED SECURITIES FUND (continued)
Open Forward Foreign Currency Exchange Contracts (0.09%) (30 September 2015: 0.06%) (continued) Settlement Date (continued)
Buy (continued)
Amount Bought (continued)
Sell (continued)
Amount Sold
(continued)
Unrealised Gain/Loss
(continued)
% Net Assets
(continued) 17/10/2016 GBP 51,553,948 USD (68,592,219) (1,724,901) (0 .07)
17/10/2016 GBP 5,570,422 USD (7,411,413) (186,376) (0 .01)
17/10/2016 GBP 878,549 USD (1,168,908) (29,398) (0 .00)
17/10/2016 GBP 98,134 USD (130,567) (3,284) (0 .00)
17/10/2016 GBP 116,665 USD (154,205) (2,887) (0 .00)
17/10/2016 GBP 88,518 USD (117,009) (2,199) (0 .00)
17/10/2016 GBP 782,362 USD (1,016,661) (1,910) (0 .00)
17/10/2016 GBP 26,720 USD (35,562) (905) (0 .00)
17/10/2016 GBP 23,068 USD (30,692) (772) (0 .00)
17/10/2016 GBP 46,156 USD (60,417) (551) (0 .00)
17/10/2016 GBP 159,690 USD (207,497) (373) (0 .00)
17/10/2016 GBP 142,065 USD (184,610) (347) (0 .00)
17/10/2016 GBP 27,998 USD (36,426) (112) (0 .00)
17/10/2016 GBP 5,456 USD (7,082) (6) (0 .00)
17/10/2016 GBP 222,393 USD (288,455) (3) (0 .00)
17/10/2016 GBP 39,577 USD (51,212) 120 0 .00
17/10/2016 JPY 19,315,787 USD (189,366) 1,900 0 .00
17/10/2016 JPY 4,242,972,586 USD (41,596,811) 417,334 0 .02
17/10/2016 JPY 22,616,843,796 USD (221,728,650) 2,224,569 0 .09
17/10/2016 USD 1,906,449 JPY (194,461,987) (19,124) (0 .00)
17/10/2016 USD 363,286 JPY (37,055,935) (3,644) (0 .00)
17/10/2016 USD 1,519 JPY (154,940) (15) (0 .00)
17/10/2016 USD 82 CHF (80) (0) (0 .00)
17/10/2016 USD 144,320 GBP (111,268) 2 0 .00
17/10/2016 USD 1,227 EUR (1,090) 7 0 .00
17/10/2016 USD 3,556 GBP (2,724) 23 0 .00
17/10/2016 USD 5,692 EUR (5,060) 29 0 .00
17/10/2016 USD 5,902 EUR (5,247) 30 0 .00
17/10/2016 USD 17,748 EUR (15,816) 49 0 .00
17/10/2016 USD 12,985 EUR (11,504) 111 0 .00
17/10/2016 USD 27,682 JPY (2,781,999) 134 0 .00
17/10/2016 USD 27,249 EUR (24,225) 139 0 .00
17/10/2016 USD 63,986 EUR (56,870) 345 0 .00
17/10/2016 USD 184,610 GBP (142,065) 347 0 .00
17/10/2016 USD 18,703 GBP (14,082) 437 0 .00
17/10/2016 USD 147,911 EUR (131,461) 798 0 .00
17/10/2016 USD 471,619 EUR (419,759) 1,883 0 .00
17/10/2016 USD 1,053,639 EUR (938,947) 2,899 0 .00
17/10/2016 USD 21,571,358 EUR (19,213,702) 70,031 0 .00
17/10/2016 USD 29,210,856 GBP (22,016,850) 654,212 0 .03
Unrealised Gain on Forward Foreign Currency Exchange Contracts 3,393,824 0 .14
Unrealised Loss on Forward Foreign Currency Exchange Contracts (5,627,972) (0 .23)
Net Unrealised Loss on Forward Foreign Currency Exchange Contracts (2,234,148) (0 .09)
Open Spot Currency Contracts 0.00% (30 September 2015: (0.00%)) Settlement Buy Amount Sell Amount Unrealised % Net Date Bought Sold Gain/Loss Assets 03/10/2016 EUR 938,947 USD (1,053,029) (2,934) (0.00) 03/10/2016 EUR 15,816 USD (17,738) (50) (0.00) 03/10/2016 USD 22,236 CHF (21,600) (65) (0.00) 03/10/2016 USD 207,446 GBP (159,690) 375 0.00 04/10/2016 GBP 142,065 USD (184,564) (348) (0.00) 04/10/2016 USD 584,917 CHF (568,159) (1,676) (0.00) 04/10/2016 USD 184,564 GBP (142,065) 348 0.00 04/10/2016 USD 495,531 EUR (441,827) 1,403 0.00 04/10/2016 USD 1,016,405 GBP (782,362) 1,917 0.00 04/10/2016 USD 1,011,304 EUR (901,702) 2,863 0.00
Unrealised Gains on Open Spot Currency Contracts 6,906 0.00 Unrealised Loss on Open Spot Currency Contracts (5,073) (0.00)
Net Unrealised Gain on Open Spot Currency Contracts 1,833 0 .00
Cash at Bank 135,154,790 5.61 Net Current Liabilities (42,959,752) (1.79) Net Assets Attributable to Holders of Redeemable Participating Units at Mid Market Prices 2,410,583,954 100.00
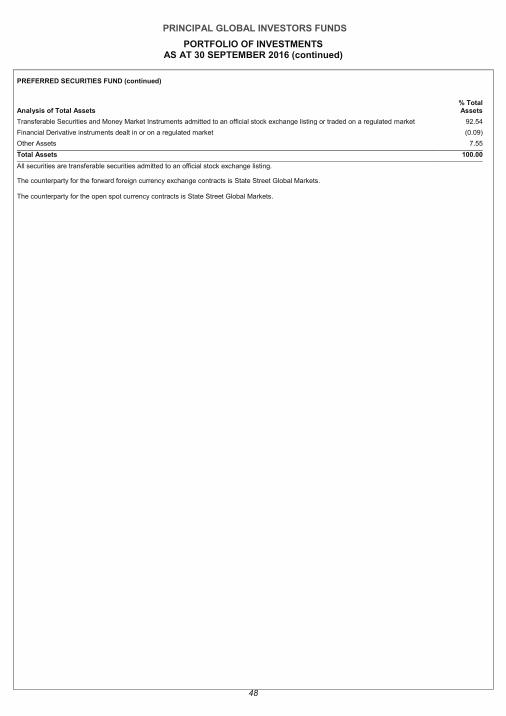
PRINCIPAL GLOBAL INVESTORS FUNDS
PORTFOLIO OF INVESTMENTS AS AT 30 SEPTEMBER 2016 (continued)
48
PREFERRED SECURITIES FUND (continued)
Analysis of Total Assets % Total Assets
Transferable Securities and Money Market Instruments admitted to an official stock exchange listing or traded on a regulated market 92.54
Financial Derivative instruments dealt in or on a regulated market (0.09)
Other Assets 7.55
Total Assets 100.00
All securities are transferable securities admitted to an official stock exchange listing.
The counterparty for the forward foreign currency exchange contracts is State Street Global Markets. The counterparty for the open spot currency contracts is State Street Global Markets.
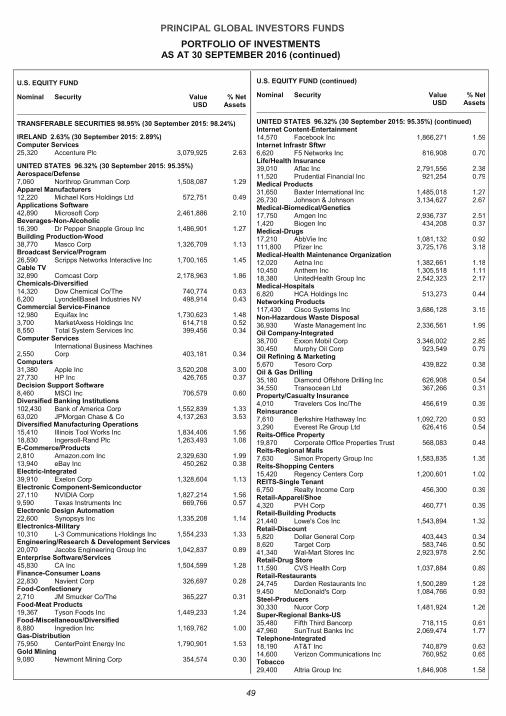
PRINCIPAL GLOBAL INVESTORS FUNDS
PORTFOLIO OF INVESTMENTS AS AT 30 SEPTEMBER 2016 (continued)
49
U.S. EQUITY FUND
Nominal Security Value USD
% Net Assets
TRANSFERABLE SECURITIES 98.95% (30 September 2015: 98.24%)
IRELAND 2.63% (30 September 2015: 2.89%) Computer Services 25,320 Accenture Plc 3,079,925 2.63
UNITED STATES 96.32% (30 September 2015: 95.35%) Aerospace/Defense 7,060 Northrop Grumman Corp 1,508,087 1.29 Apparel Manufacturers 12,220 Michael Kors Holdings Ltd 572,751 0.49 Applications Software 42,890 Microsoft Corp 2,461,886 2.10 Beverages-Non-Alcoholic 16,390 Dr Pepper Snapple Group Inc 1,486,901 1.27 Building Production-Wood 38,770 Masco Corp 1,326,709 1.13 Broadcast Service/Program 26,590 Scripps Networks Interactive Inc 1,700,165 1.45 Cable TV 32,890 Comcast Corp 2,178,963 1.86 Chemicals-Diversified 14,320 Dow Chemical Co/The 740,774 0.63 6,200 LyondellBasell Industries NV 498,914 0.43 Commercial Service-Finance 12,980 Equifax Inc 1,730,623 1.48 3,700 MarketAxess Holdings Inc 614,718 0.52 8,550 Total System Services Inc 399,456 0.34 Computer Services
2,550 International Business Machines Corp 403,181 0.34
Computers 31,380 Apple Inc 3,520,208 3.00 27,730 HP Inc 426,765 0.37 Decision Support Software 8,460 MSCI Inc 706,579 0.60 Diversified Banking Institutions 102,430 Bank of America Corp 1,552,839 1.33 63,020 JPMorgan Chase & Co 4,137,263 3.53 Diversified Manufacturing Operations 15,410 Illinois Tool Works Inc 1,834,406 1.56 18,830 Ingersoll-Rand Plc 1,263,493 1.08 E-Commerce/Products 2,810 Amazon.com Inc 2,329,630 1.99 13,940 eBay Inc 450,262 0.38 Electric-Integrated 39,910 Exelon Corp 1,328,604 1.13 Electronic Component-Semiconductor 27,110 NVIDIA Corp 1,827,214 1.56 9,590 Texas Instruments Inc 669,766 0.57 Electronic Design Automation 22,600 Synopsys Inc 1,335,208 1.14 Electronics-Military 10,310 L-3 Communications Holdings Inc 1,554,233 1.33 Engineering/Research & Development Services 20,070 Jacobs Engineering Group Inc 1,042,837 0.89 Enterprise Software/Services 45,830 CA Inc 1,504,599 1.28 Finance-Consumer Loans 22,830 Navient Corp 326,697 0.28 Food-Confectionery 2,710 JM Smucker Co/The 365,227 0.31 Food-Meat Products 19,367 Tyson Foods Inc 1,449,233 1.24 Food-Miscellaneous/Diversified 8,880 Ingredion Inc 1,169,762 1.00 Gas-Distribution 75,950 CenterPoint Energy Inc 1,790,901 1.53 Gold Mining 9,080 Newmont Mining Corp 354,574 0.30
U.S. EQUITY FUND (continued)
Nominal Security Value USD
% Net Assets
UNITED STATES 96.32% (30 September 2015: 95.35%) (continued) Internet Content-Entertainment 14,570 Facebook Inc 1,866,271 1.59 Internet Infrastr Sftwr 6,620 F5 Networks Inc 816,908 0.70 Life/Health Insurance 39,010 Aflac Inc 2,791,556 2.38 11,520 Prudential Financial Inc 921,254 0.79 Medical Products 31,650 Baxter International Inc 1,485,018 1.27 26,730 Johnson & Johnson 3,134,627 2.67 Medical-Biomedical/Genetics 17,750 Amgen Inc 2,936,737 2.51 1,420 Biogen Inc 434,208 0.37 Medical-Drugs 17,210 AbbVie Inc 1,081,132 0.92 111,800 Pfizer Inc 3,725,176 3.18 Medical-Health Maintenance Organization 12,020 Aetna Inc 1,382,661 1.18 10,450 Anthem Inc 1,305,518 1.11 18,380 UnitedHealth Group Inc 2,542,323 2.17 Medical-Hospitals 6,820 HCA Holdings Inc 513,273 0.44 Networking Products 117,430 Cisco Systems Inc 3,686,128 3.15 Non-Hazardous Waste Disposal 36,930 Waste Management Inc 2,336,561 1.99 Oil Company-Integrated 38,700 Exxon Mobil Corp 3,346,002 2.85 30,450 Murphy Oil Corp 923,549 0.79 Oil Refining & Marketing 5,670 Tesoro Corp 439,822 0.38 Oil & Gas Drilling 35,180 Diamond Offshore Drilling Inc 626,908 0.54 34,550 Transocean Ltd 367,266 0.31 Property/Casualty Insurance 4,010 Travelers Cos Inc/The 456,619 0.39 Reinsurance 7,610 Berkshire Hathaway Inc 1,092,720 0.93 3,290 Everest Re Group Ltd 626,416 0.54 Reits-Office Property 19,870 Corporate Office Properties Trust 568,083 0.48 Reits-Regional Malls 7,630 Simon Property Group Inc 1,583,835 1.35 Reits-Shopping Centers 15,420 Regency Centers Corp 1,200,601 1.02 REITS-Single Tenant 6,750 Realty Income Corp 456,300 0.39 Retail-Apparel/Shoe 4,320 PVH Corp 460,771 0.39 Retail-Building Products 21,440 Lowe's Cos Inc 1,543,894 1.32 Retail-Discount 5,820 Dollar General Corp 403,443 0.34 8,620 Target Corp 583,746 0.50 41,340 Wal-Mart Stores Inc 2,923,978 2.50 Retail-Drug Store 11,590 CVS Health Corp 1,037,884 0.89 Retail-Restaurants 24,745 Darden Restaurants Inc 1,500,289 1.28 9,450 McDonald's Corp 1,084,766 0.93 Steel-Producers 30,330 Nucor Corp 1,481,924 1.26 Super-Regional Banks-US 35,480 Fifth Third Bancorp 718,115 0.61 47,960 SunTrust Banks Inc 2,069,474 1.77 Telephone-Integrated 18,190 AT&T Inc 740,879 0.63 14,600 Verizon Communications Inc 760,952 0.65 Tobacco 29,400 Altria Group Inc 1,846,908 1.58
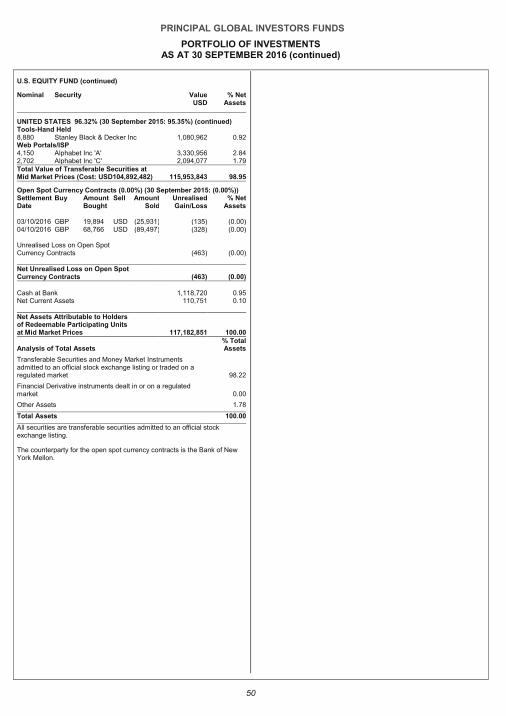
PRINCIPAL GLOBAL INVESTORS FUNDS
PORTFOLIO OF INVESTMENTS AS AT 30 SEPTEMBER 2016 (continued)
50
U.S. EQUITY FUND (continued)
Nominal Security Value USD
% Net Assets
UNITED STATES 96.32% (30 September 2015: 95.35%) (continued) Tools-Hand Held 8,880 Stanley Black & Decker Inc 1,080,962 0.92 Web Portals/ISP 4,150 Alphabet Inc 'A' 3,330,956 2.84 2,702 Alphabet Inc 'C' 2,094,077 1.79 Total Value of Transferable Securities at Mid Market Prices (Cost: USD104,892,482) 115,953,843 98.95
Open Spot Currency Contracts (0.00%) (30 September 2015: (0.00%)) Settlement Buy Amount Sell Amount Unrealised % Net Date Bought Sold Gain/Loss Assets
03/10/2016 GBP 19,894 USD (25,931) (135) (0.00) 04/10/2016 GBP 68,766 USD (89,497) (328) (0.00) Unrealised Loss on Open Spot Currency Contracts (463) (0.00) Net Unrealised Loss on Open Spot Currency Contracts (463) (0 .00)
Cash at Bank 1,118,720 0.95 Net Current Assets 110,751 0.10 Net Assets Attributable to Holders of Redeemable Participating Units at Mid Market Prices 117,182,851 100.00
Analysis of Total Assets % Total Assets
Transferable Securities and Money Market Instruments admitted to an official stock exchange listing or traded on a regulated market 98.22
Financial Derivative instruments dealt in or on a regulated market 0.00
Other Assets 1.78
Total Assets 100.00
All securities are transferable securities admitted to an official stock exchange listing.
The counterparty for the open spot currency contracts is the Bank of New York Mellon.
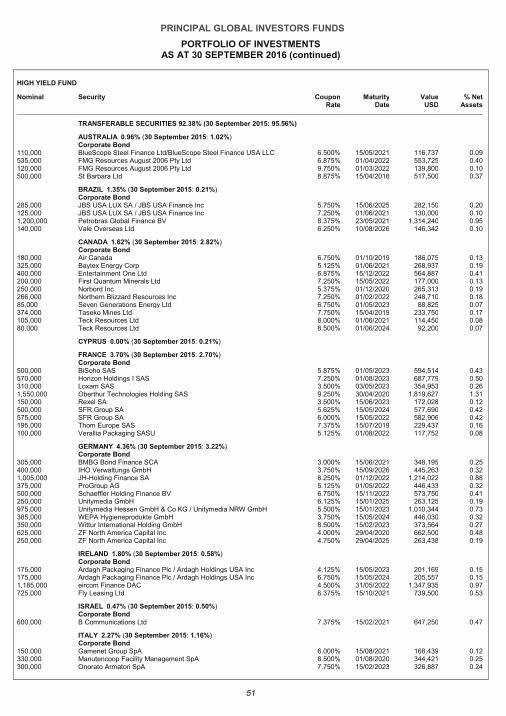
PRINCIPAL GLOBAL INVESTORS FUNDS
PORTFOLIO OF INVESTMENTS AS AT 30 SEPTEMBER 2016 (continued)
51
HIGH YIELD FUND
Nominal Security Coupon Rate
Maturity Date
Value USD
% Net Assets
TRANSFERABLE SECURITIES 92.38% (30 September 2015: 95.56%)
AUSTRALIA 0.96% (30 September 2015: 1.02%) Corporate Bond
110,000 BlueScope Steel Finance Ltd/BlueScope Steel Finance USA LLC 6.500% 15/05/2021 116,737 0.09 535,000 FMG Resources August 2006 Pty Ltd 6.875% 01/04/2022 553,725 0.40 120,000 FMG Resources August 2006 Pty Ltd 9.750% 01/03/2022 139,800 0.10 500,000 St Barbara Ltd 8.875% 15/04/2018 517,500 0.37
BRAZIL 1.35% (30 September 2015: 0.21%) Corporate Bond
285,000 JBS USA LUX SA / JBS USA Finance Inc 5.750% 15/06/2025 282,150 0.20 125,000 JBS USA LUX SA / JBS USA Finance Inc 7.250% 01/06/2021 130,000 0.10 1,200,000 Petrobras Global Finance BV 8.375% 23/05/2021 1,314,240 0.95 140,000 Vale Overseas Ltd 6.250% 10/08/2026 146,342 0.10
CANADA 1.62% (30 September 2015: 2.82%) Corporate Bond
180,000 Air Canada 6.750% 01/10/2019 186,075 0.13 325,000 Baytex Energy Corp 5.125% 01/06/2021 268,937 0.19 400,000 Entertainment One Ltd 6.875% 15/12/2022 564,887 0.41 200,000 First Quantum Minerals Ltd 7.250% 15/05/2022 177,000 0.13 250,000 Norbord Inc 5.375% 01/12/2020 265,313 0.19 266,000 Northern Blizzard Resources Inc 7.250% 01/02/2022 248,710 0.18 85,000 Seven Generations Energy Ltd 6.750% 01/05/2023 88,825 0.07 374,000 Taseko Mines Ltd 7.750% 15/04/2019 233,750 0.17 105,000 Teck Resources Ltd 8.000% 01/06/2021 114,450 0.08 80,000 Teck Resources Ltd 8.500% 01/06/2024 92,200 0.07
CYPRUS 0.00% (30 September 2015: 0.21%)
FRANCE 3.70% (30 September 2015: 2.70%) Corporate Bond
500,000 BiSoho SAS 5.875% 01/05/2023 594,514 0.43 570,000 Horizon Holdings I SAS 7.250% 01/08/2023 687,779 0.50 310,000 Loxam SAS 3.500% 03/05/2023 354,953 0.26 1,550,000 Oberthur Technologies Holding SAS 9.250% 30/04/2020 1,819,627 1.31 150,000 Rexel SA 3.500% 15/06/2023 172,028 0.12 500,000 SFR Group SA 5.625% 15/05/2024 577,690 0.42 575,000 SFR Group SA 6.000% 15/05/2022 582,906 0.42 195,000 Thom Europe SAS 7.375% 15/07/2019 229,437 0.16 100,000 Verallia Packaging SASU 5.125% 01/08/2022 117,752 0.08
GERMANY 4.36% (30 September 2015: 3.22%) Corporate Bond
305,000 BMBG Bond Finance SCA 3.000% 15/06/2021 348,195 0.25 400,000 IHO Verwaltungs GmbH 3.750% 15/09/2026 445,263 0.32 1,005,000 JH-Holding Finance SA 8.250% 01/12/2022 1,214,022 0.88 375,000 ProGroup AG 5.125% 01/05/2022 446,433 0.32 500,000 Schaeffler Holding Finance BV 6.750% 15/11/2022 573,750 0.41 250,000 Unitymedia GmbH 6.125% 15/01/2025 263,125 0.19 975,000 Unitymedia Hessen GmbH & Co KG / Unitymedia NRW GmbH 5.500% 15/01/2023 1,010,344 0.73 385,000 WEPA Hygieneprodukte GmbH 3.750% 15/05/2024 446,030 0.32 350,000 Wittur International Holding GmbH 8.500% 15/02/2023 373,564 0.27 625,000 ZF North America Capital Inc 4.000% 29/04/2020 662,500 0.48 250,000 ZF North America Capital Inc 4.750% 29/04/2025 263,438 0.19
IRELAND 1.80% (30 September 2015: 0.58%) Corporate Bond
175,000 Ardagh Packaging Finance Plc / Ardagh Holdings USA Inc 4.125% 15/05/2023 201,169 0.15 175,000 Ardagh Packaging Finance Plc / Ardagh Holdings USA Inc 6.750% 15/05/2024 205,557 0.15 1,185,000 eircom Finance DAC 4.500% 31/05/2022 1,347,935 0.97 725,000 Fly Leasing Ltd 6.375% 15/10/2021 739,500 0.53
ISRAEL 0.47% (30 September 2015: 0.50%) Corporate Bond
600,000 B Communications Ltd 7.375% 15/02/2021 647,250 0.47
ITALY 2.27% (30 September 2015: 1.16%) Corporate Bond
150,000 Gamenet Group SpA 6.000% 15/08/2021 168,439 0.12 330,000 Manutencoop Facility Management SpA 8.500% 01/08/2020 344,421 0.25 300,000 Onorato Armatori SpA 7.750% 15/02/2023 326,887 0.24
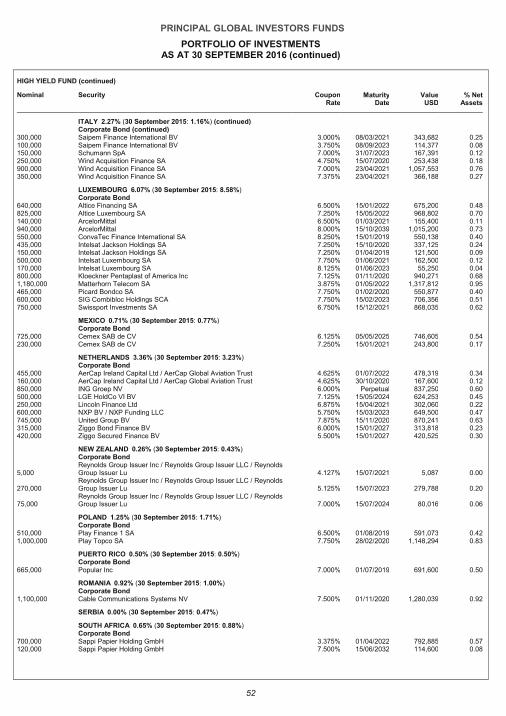
PRINCIPAL GLOBAL INVESTORS FUNDS
PORTFOLIO OF INVESTMENTS AS AT 30 SEPTEMBER 2016 (continued)
52
HIGH YIELD FUND (continued)
Nominal Security Coupon Rate
Maturity Date
Value USD
% Net Assets
ITALY 2.27% (30 September 2015: 1.16%) (continued) Corporate Bond (continued)
300,000 Saipem Finance International BV 3.000% 08/03/2021 343,682 0.25 100,000 Saipem Finance International BV 3.750% 08/09/2023 114,377 0.08 150,000 Schumann SpA 7.000% 31/07/2023 167,391 0.12 250,000 Wind Acquisition Finance SA 4.750% 15/07/2020 253,438 0.18 900,000 Wind Acquisition Finance SA 7.000% 23/04/2021 1,057,553 0.76 350,000 Wind Acquisition Finance SA 7.375% 23/04/2021 366,188 0.27
LUXEMBOURG 6.07% (30 September 2015: 8.58%) Corporate Bond
640,000 Altice Financing SA 6.500% 15/01/2022 675,200 0.48 825,000 Altice Luxembourg SA 7.250% 15/05/2022 968,802 0.70 140,000 ArcelorMittal 6.500% 01/03/2021 155,400 0.11 940,000 ArcelorMittal 8.000% 15/10/2039 1,015,200 0.73 550,000 ConvaTec Finance International SA 8.250% 15/01/2019 550,138 0.40 435,000 Intelsat Jackson Holdings SA 7.250% 15/10/2020 337,125 0.24 150,000 Intelsat Jackson Holdings SA 7.250% 01/04/2019 121,500 0.09 500,000 Intelsat Luxembourg SA 7.750% 01/06/2021 162,500 0.12 170,000 Intelsat Luxembourg SA 8.125% 01/06/2023 55,250 0.04 800,000 Kloeckner Pentaplast of America Inc 7.125% 01/11/2020 940,271 0.68 1,180,000 Matterhorn Telecom SA 3.875% 01/05/2022 1,317,812 0.95 465,000 Picard Bondco SA 7.750% 01/02/2020 550,877 0.40 600,000 SIG Combibloc Holdings SCA 7.750% 15/02/2023 706,356 0.51 750,000 Swissport Investments SA 6.750% 15/12/2021 868,035 0.62
MEXICO 0.71% (30 September 2015: 0.77%) Corporate Bond
725,000 Cemex SAB de CV 6.125% 05/05/2025 746,605 0.54 230,000 Cemex SAB de CV 7.250% 15/01/2021 243,800 0.17
NETHERLANDS 3.36% (30 September 2015: 3.23%) Corporate Bond
455,000 AerCap Ireland Capital Ltd / AerCap Global Aviation Trust 4.625% 01/07/2022 478,319 0.34 160,000 AerCap Ireland Capital Ltd / AerCap Global Aviation Trust 4.625% 30/10/2020 167,600 0.12 850,000 ING Groep NV 6.000% Perpetual 837,250 0.60 500,000 LGE HoldCo VI BV 7.125% 15/05/2024 624,253 0.45 250,000 Lincoln Finance Ltd 6.875% 15/04/2021 302,060 0.22 600,000 NXP BV / NXP Funding LLC 5.750% 15/03/2023 649,500 0.47 745,000 United Group BV 7.875% 15/11/2020 870,241 0.63 315,000 Ziggo Bond Finance BV 6.000% 15/01/2027 313,818 0.23 420,000 Ziggo Secured Finance BV 5.500% 15/01/2027 420,525 0.30
NEW ZEALAND 0.26% (30 September 2015: 0.43%) Corporate Bond
5,000 Reynolds Group Issuer Inc / Reynolds Group Issuer LLC / Reynolds Group Issuer Lu 4.127% 15/07/2021 5,087 0.00
270,000 Reynolds Group Issuer Inc / Reynolds Group Issuer LLC / Reynolds Group Issuer Lu 5.125% 15/07/2023 279,788 0.20
75,000 Reynolds Group Issuer Inc / Reynolds Group Issuer LLC / Reynolds Group Issuer Lu 7.000% 15/07/2024 80,016 0.06
POLAND 1.25% (30 September 2015: 1.71%) Corporate Bond
510,000 Play Finance 1 SA 6.500% 01/08/2019 591,073 0.42 1,000,000 Play Topco SA 7.750% 28/02/2020 1,148,294 0.83
PUERTO RICO 0.50% (30 September 2015: 0.50%) Corporate Bond
665,000 Popular Inc 7.000% 01/07/2019 691,600 0.50
ROMANIA 0.92% (30 September 2015: 1.00%) Corporate Bond
1,100,000 Cable Communications Systems NV 7.500% 01/11/2020 1,280,039 0.92
SERBIA 0.00% (30 September 2015: 0.47%)
SOUTH AFRICA 0.65% (30 September 2015: 0.88%) Corporate Bond
700,000 Sappi Papier Holding GmbH 3.375% 01/04/2022 792,885 0.57 120,000 Sappi Papier Holding GmbH 7.500% 15/06/2032 114,600 0.08
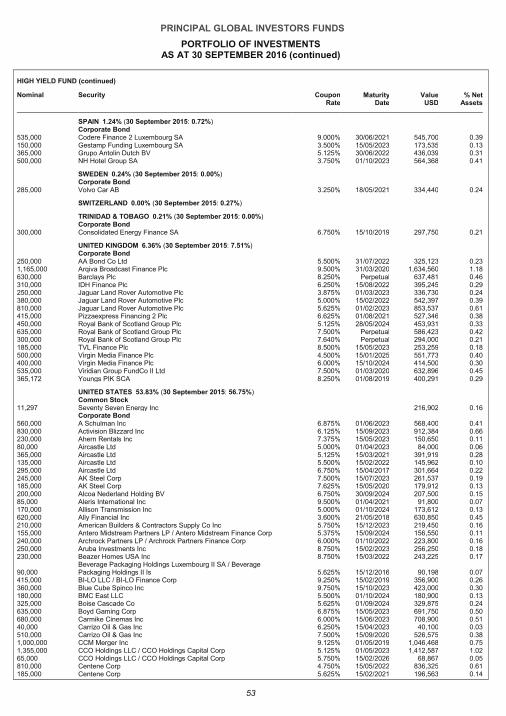
PRINCIPAL GLOBAL INVESTORS FUNDS
PORTFOLIO OF INVESTMENTS AS AT 30 SEPTEMBER 2016 (continued)
53
HIGH YIELD FUND (continued)
Nominal Security Coupon Rate
Maturity Date
Value USD
% Net Assets
SPAIN 1.24% (30 September 2015: 0.72%) Corporate Bond
535,000 Codere Finance 2 Luxembourg SA 9.000% 30/06/2021 545,700 0.39 150,000 Gestamp Funding Luxembourg SA 3.500% 15/05/2023 173,535 0.13 365,000 Grupo Antolin Dutch BV 5.125% 30/06/2022 436,039 0.31 500,000 NH Hotel Group SA 3.750% 01/10/2023 564,368 0.41
SWEDEN 0.24% (30 September 2015: 0.00%) Corporate Bond
285,000 Volvo Car AB 3.250% 18/05/2021 334,440 0.24
SWITZERLAND 0.00% (30 September 2015: 0.27%)
TRINIDAD & TOBAGO 0.21% (30 September 2015: 0.00%) Corporate Bond
300,000 Consolidated Energy Finance SA 6.750% 15/10/2019 297,750 0.21
UNITED KINGDOM 6.36% (30 September 2015: 7.51%) Corporate Bond
250,000 AA Bond Co Ltd 5.500% 31/07/2022 325,123 0.23 1,165,000 Arqiva Broadcast Finance Plc 9.500% 31/03/2020 1,634,560 1.18 630,000 Barclays Plc 8.250% Perpetual 637,481 0.46 310,000 IDH Finance Plc 6.250% 15/08/2022 395,245 0.29 250,000 Jaguar Land Rover Automotive Plc 3.875% 01/03/2023 336,730 0.24 380,000 Jaguar Land Rover Automotive Plc 5.000% 15/02/2022 542,397 0.39 810,000 Jaguar Land Rover Automotive Plc 5.625% 01/02/2023 853,537 0.61 415,000 Pizzaexpress Financing 2 Plc 6.625% 01/08/2021 527,346 0.38 450,000 Royal Bank of Scotland Group Plc 5.125% 28/05/2024 453,931 0.33 635,000 Royal Bank of Scotland Group Plc 7.500% Perpetual 586,423 0.42 300,000 Royal Bank of Scotland Group Plc 7.640% Perpetual 294,000 0.21 185,000 TVL Finance Plc 8.500% 15/05/2023 253,259 0.18 500,000 Virgin Media Finance Plc 4.500% 15/01/2025 551,773 0.40 400,000 Virgin Media Finance Plc 6.000% 15/10/2024 414,500 0.30 535,000 Viridian Group FundCo II Ltd 7.500% 01/03/2020 632,896 0.45 365,172 Youngs PIK SCA 8.250% 01/08/2019 400,291 0.29
UNITED STATES 53.83% (30 September 2015: 56.75%) Common Stock
11,297 Seventy Seven Energy Inc 216,902 0.16 Corporate Bond
560,000 A Schulman Inc 6.875% 01/06/2023 568,400 0.41 830,000 Activision Blizzard Inc 6.125% 15/09/2023 912,384 0.66 230,000 Ahern Rentals Inc 7.375% 15/05/2023 150,650 0.11 80,000 Aircastle Ltd 5.000% 01/04/2023 84,000 0.06 365,000 Aircastle Ltd 5.125% 15/03/2021 391,919 0.28 135,000 Aircastle Ltd 5.500% 15/02/2022 145,962 0.10 295,000 Aircastle Ltd 6.750% 15/04/2017 301,664 0.22 245,000 AK Steel Corp 7.500% 15/07/2023 261,537 0.19 185,000 AK Steel Corp 7.625% 15/05/2020 179,912 0.13 200,000 Alcoa Nederland Holding BV 6.750% 30/09/2024 207,500 0.15 85,000 Aleris International Inc 9.500% 01/04/2021 91,800 0.07 170,000 Allison Transmission Inc 5.000% 01/10/2024 173,612 0.13 620,000 Ally Financial Inc 3.600% 21/05/2018 630,850 0.45 210,000 American Builders & Contractors Supply Co Inc 5.750% 15/12/2023 219,450 0.16 155,000 Antero Midstream Partners LP / Antero Midstream Finance Corp 5.375% 15/09/2024 156,550 0.11 240,000 Archrock Partners LP / Archrock Partners Finance Corp 6.000% 01/10/2022 223,800 0.16 250,000 Aruba Investments Inc 8.750% 15/02/2023 256,250 0.18 230,000 Beazer Homes USA Inc 8.750% 15/03/2022 243,225 0.17
90,000 Beverage Packaging Holdings Luxembourg II SA / Beverage Packaging Holdings II Is 5.625% 15/12/2016 90,198 0.07
415,000 BI-LO LLC / BI-LO Finance Corp 9.250% 15/02/2019 356,900 0.26 360,000 Blue Cube Spinco Inc 9.750% 15/10/2023 423,000 0.30 180,000 BMC East LLC 5.500% 01/10/2024 180,900 0.13 325,000 Boise Cascade Co 5.625% 01/09/2024 329,875 0.24 635,000 Boyd Gaming Corp 6.875% 15/05/2023 691,750 0.50 680,000 Carmike Cinemas Inc 6.000% 15/06/2023 708,900 0.51 40,000 Carrizo Oil & Gas Inc 6.250% 15/04/2023 40,100 0.03 510,000 Carrizo Oil & Gas Inc 7.500% 15/09/2020 526,575 0.38 1,000,000 CCM Merger Inc 9.125% 01/05/2019 1,046,468 0.75 1,355,000 CCO Holdings LLC / CCO Holdings Capital Corp 5.125% 01/05/2023 1,412,587 1.02 65,000 CCO Holdings LLC / CCO Holdings Capital Corp 5.750% 15/02/2026 68,867 0.05 810,000 Centene Corp 4.750% 15/05/2022 836,325 0.61 185,000 Centene Corp 5.625% 15/02/2021 196,563 0.14
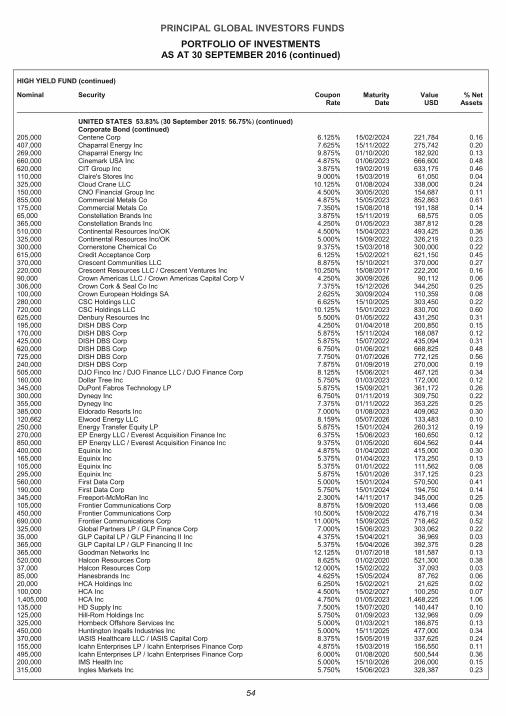
PRINCIPAL GLOBAL INVESTORS FUNDS
PORTFOLIO OF INVESTMENTS AS AT 30 SEPTEMBER 2016 (continued)
54
HIGH YIELD FUND (continued)
Nominal Security Coupon Rate
Maturity Date
Value USD
% Net Assets
UNITED STATES 53.83% (30 September 2015: 56.75%) (continued) Corporate Bond (continued)
205,000 Centene Corp 6.125% 15/02/2024 221,784 0.16 407,000 Chaparral Energy Inc 7.625% 15/11/2022 275,742 0.20 269,000 Chaparral Energy Inc 9.875% 01/10/2020 182,920 0.13 660,000 Cinemark USA Inc 4.875% 01/06/2023 666,600 0.48 620,000 CIT Group Inc 3.875% 19/02/2019 633,175 0.46 110,000 Claire's Stores Inc 9.000% 15/03/2019 61,050 0.04 325,000 Cloud Crane LLC 10.125% 01/08/2024 338,000 0.24 150,000 CNO Financial Group Inc 4.500% 30/05/2020 154,687 0.11 855,000 Commercial Metals Co 4.875% 15/05/2023 852,863 0.61 175,000 Commercial Metals Co 7.350% 15/08/2018 191,188 0.14 65,000 Constellation Brands Inc 3.875% 15/11/2019 68,575 0.05 365,000 Constellation Brands Inc 4.250% 01/05/2023 387,812 0.28 510,000 Continental Resources Inc/OK 4.500% 15/04/2023 493,425 0.36 325,000 Continental Resources Inc/OK 5.000% 15/09/2022 326,219 0.23 300,000 Cornerstone Chemical Co 9.375% 15/03/2018 300,000 0.22 615,000 Credit Acceptance Corp 6.125% 15/02/2021 621,150 0.45 370,000 Crescent Communities LLC 8.875% 15/10/2021 370,000 0.27 220,000 Crescent Resources LLC / Crescent Ventures Inc 10.250% 15/08/2017 222,200 0.16 90,000 Crown Americas LLC / Crown Americas Capital Corp V 4.250% 30/09/2026 90,112 0.06 306,000 Crown Cork & Seal Co Inc 7.375% 15/12/2026 344,250 0.25 100,000 Crown European Holdings SA 2.625% 30/09/2024 110,359 0.08 280,000 CSC Holdings LLC 6.625% 15/10/2025 303,450 0.22 720,000 CSC Holdings LLC 10.125% 15/01/2023 830,700 0.60 625,000 Denbury Resources Inc 5.500% 01/05/2022 431,250 0.31 195,000 DISH DBS Corp 4.250% 01/04/2018 200,850 0.15 170,000 DISH DBS Corp 5.875% 15/11/2024 168,087 0.12 425,000 DISH DBS Corp 5.875% 15/07/2022 435,094 0.31 620,000 DISH DBS Corp 6.750% 01/06/2021 668,825 0.48 725,000 DISH DBS Corp 7.750% 01/07/2026 772,125 0.56 240,000 DISH DBS Corp 7.875% 01/09/2019 270,000 0.19 505,000 DJO Finco Inc / DJO Finance LLC / DJO Finance Corp 8.125% 15/06/2021 467,125 0.34 160,000 Dollar Tree Inc 5.750% 01/03/2023 172,000 0.12 345,000 DuPont Fabros Technology LP 5.875% 15/09/2021 361,172 0.26 300,000 Dynegy Inc 6.750% 01/11/2019 309,750 0.22 355,000 Dynegy Inc 7.375% 01/11/2022 353,225 0.25 385,000 Eldorado Resorts Inc 7.000% 01/08/2023 409,062 0.30 120,662 Elwood Energy LLC 8.159% 05/07/2026 133,483 0.10 250,000 Energy Transfer Equity LP 5.875% 15/01/2024 260,312 0.19 270,000 EP Energy LLC / Everest Acquisition Finance Inc 6.375% 15/06/2023 160,650 0.12 850,000 EP Energy LLC / Everest Acquisition Finance Inc 9.375% 01/05/2020 604,562 0.44 400,000 Equinix Inc 4.875% 01/04/2020 415,000 0.30 165,000 Equinix Inc 5.375% 01/04/2023 173,250 0.13 105,000 Equinix Inc 5.375% 01/01/2022 111,562 0.08 295,000 Equinix Inc 5.875% 15/01/2026 317,125 0.23 560,000 First Data Corp 5.000% 15/01/2024 570,500 0.41 190,000 First Data Corp 5.750% 15/01/2024 194,750 0.14 345,000 Freeport-McMoRan Inc 2.300% 14/11/2017 345,000 0.25 105,000 Frontier Communications Corp 8.875% 15/09/2020 113,466 0.08 450,000 Frontier Communications Corp 10.500% 15/09/2022 476,719 0.34 690,000 Frontier Communications Corp 11.000% 15/09/2025 718,462 0.52 325,000 Global Partners LP / GLP Finance Corp 7.000% 15/06/2023 303,062 0.22 35,000 GLP Capital LP / GLP Financing II Inc 4.375% 15/04/2021 36,969 0.03 365,000 GLP Capital LP / GLP Financing II Inc 5.375% 15/04/2026 392,375 0.28 365,000 Goodman Networks Inc 12.125% 01/07/2018 181,587 0.13 520,000 Halcon Resources Corp 8.625% 01/02/2020 521,300 0.38 37,000 Halcon Resources Corp 12.000% 15/02/2022 37,093 0.03 85,000 Hanesbrands Inc 4.625% 15/05/2024 87,762 0.06 20,000 HCA Holdings Inc 6.250% 15/02/2021 21,625 0.02 100,000 HCA Inc 4.500% 15/02/2027 100,250 0.07 1,405,000 HCA Inc 4.750% 01/05/2023 1,468,225 1.06 135,000 HD Supply Inc 7.500% 15/07/2020 140,447 0.10 125,000 Hill-Rom Holdings Inc 5.750% 01/09/2023 132,969 0.09 325,000 Hornbeck Offshore Services Inc 5.000% 01/03/2021 186,875 0.13 450,000 Huntington Ingalls Industries Inc 5.000% 15/11/2025 477,000 0.34 370,000 IASIS Healthcare LLC / IASIS Capital Corp 8.375% 15/05/2019 337,625 0.24 155,000 Icahn Enterprises LP / Icahn Enterprises Finance Corp 4.875% 15/03/2019 156,550 0.11 495,000 Icahn Enterprises LP / Icahn Enterprises Finance Corp 6.000% 01/08/2020 500,544 0.36 200,000 IMS Health Inc 5.000% 15/10/2026 206,000 0.15 315,000 Ingles Markets Inc 5.750% 15/06/2023 328,387 0.23
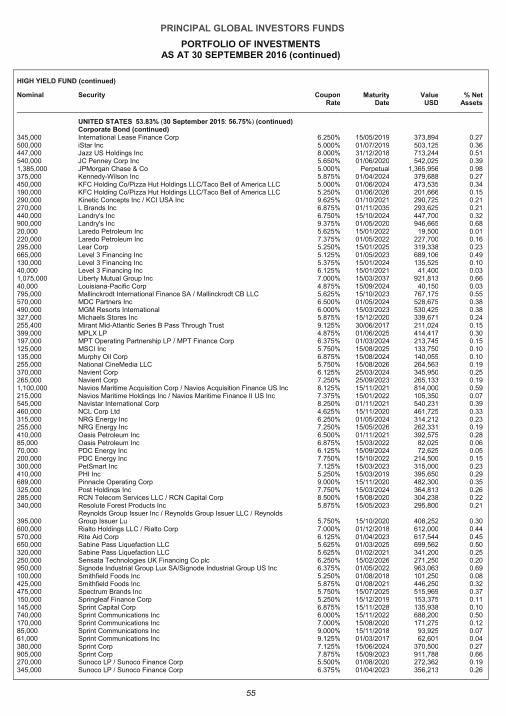
PRINCIPAL GLOBAL INVESTORS FUNDS
PORTFOLIO OF INVESTMENTS AS AT 30 SEPTEMBER 2016 (continued)
55
HIGH YIELD FUND (continued)
Nominal Security Coupon Rate
Maturity Date
Value USD
% Net Assets
UNITED STATES 53.83% (30 September 2015: 56.75%) (continued) Corporate Bond (continued)
345,000 International Lease Finance Corp 6.250% 15/05/2019 373,894 0.27 500,000 iStar Inc 5.000% 01/07/2019 503,125 0.36 447,000 Jazz US Holdings Inc 8.000% 31/12/2018 713,244 0.51 540,000 JC Penney Corp Inc 5.650% 01/06/2020 542,025 0.39 1,385,000 JPMorgan Chase & Co 5.000% Perpetual 1,365,956 0.98 375,000 Kennedy-Wilson Inc 5.875% 01/04/2024 379,688 0.27 450,000 KFC Holding Co/Pizza Hut Holdings LLC/Taco Bell of America LLC 5.000% 01/06/2024 473,535 0.34 190,000 KFC Holding Co/Pizza Hut Holdings LLC/Taco Bell of America LLC 5.250% 01/06/2026 201,666 0.15 290,000 Kinetic Concepts Inc / KCI USA Inc 9.625% 01/10/2021 290,725 0.21 270,000 L Brands Inc 6.875% 01/11/2035 293,625 0.21 440,000 Landry's Inc 6.750% 15/10/2024 447,700 0.32 900,000 Landry's Inc 9.375% 01/05/2020 946,665 0.68 20,000 Laredo Petroleum Inc 5.625% 15/01/2022 19,500 0.01 220,000 Laredo Petroleum Inc 7.375% 01/05/2022 227,700 0.16 295,000 Lear Corp 5.250% 15/01/2025 319,338 0.23 665,000 Level 3 Financing Inc 5.125% 01/05/2023 689,106 0.49 130,000 Level 3 Financing Inc 5.375% 15/01/2024 135,525 0.10 40,000 Level 3 Financing Inc 6.125% 15/01/2021 41,400 0.03 1,075,000 Liberty Mutual Group Inc 7.000% 15/03/2037 921,813 0.66 40,000 Louisiana-Pacific Corp 4.875% 15/09/2024 40,150 0.03 795,000 Mallinckrodt International Finance SA / Mallinckrodt CB LLC 5.625% 15/10/2023 767,175 0.55 570,000 MDC Partners Inc 6.500% 01/05/2024 528,675 0.38 490,000 MGM Resorts International 6.000% 15/03/2023 530,425 0.38 327,000 Michaels Stores Inc 5.875% 15/12/2020 339,671 0.24 255,400 Mirant Mid-Atlantic Series B Pass Through Trust 9.125% 30/06/2017 211,024 0.15 399,000 MPLX LP 4.875% 01/06/2025 414,417 0.30 197,000 MPT Operating Partnership LP / MPT Finance Corp 6.375% 01/03/2024 213,745 0.15 125,000 MSCI Inc 5.750% 15/08/2025 133,750 0.10 135,000 Murphy Oil Corp 6.875% 15/08/2024 140,055 0.10 255,000 National CineMedia LLC 5.750% 15/08/2026 264,563 0.19 370,000 Navient Corp 6.125% 25/03/2024 345,950 0.25 265,000 Navient Corp 7.250% 25/09/2023 265,133 0.19 1,100,000 Navios Maritime Acquisition Corp / Navios Acquisition Finance US Inc 8.125% 15/11/2021 814,000 0.59 215,000 Navios Maritime Holdings Inc / Navios Maritime Finance II US Inc 7.375% 15/01/2022 105,350 0.07 545,000 Navistar International Corp 8.250% 01/11/2021 540,231 0.39 460,000 NCL Corp Ltd 4.625% 15/11/2020 461,725 0.33 315,000 NRG Energy Inc 6.250% 01/05/2024 314,212 0.23 255,000 NRG Energy Inc 7.250% 15/05/2026 262,331 0.19 410,000 Oasis Petroleum Inc 6.500% 01/11/2021 392,575 0.28 85,000 Oasis Petroleum Inc 6.875% 15/03/2022 82,025 0.06 70,000 PDC Energy Inc 6.125% 15/09/2024 72,625 0.05 200,000 PDC Energy Inc 7.750% 15/10/2022 214,500 0.15 300,000 PetSmart Inc 7.125% 15/03/2023 315,000 0.23 410,000 PHI Inc 5.250% 15/03/2019 395,650 0.29 689,000 Pinnacle Operating Corp 9.000% 15/11/2020 482,300 0.35 325,000 Post Holdings Inc 7.750% 15/03/2024 364,813 0.26 285,000 RCN Telecom Services LLC / RCN Capital Corp 8.500% 15/08/2020 304,238 0.22 340,000 Resolute Forest Products Inc 5.875% 15/05/2023 295,800 0.21
395,000 Reynolds Group Issuer Inc / Reynolds Group Issuer LLC / Reynolds Group Issuer Lu 5.750% 15/10/2020 408,252 0.30
600,000 Rialto Holdings LLC / Rialto Corp 7.000% 01/12/2018 612,000 0.44 570,000 Rite Aid Corp 6.125% 01/04/2023 617,544 0.45 650,000 Sabine Pass Liquefaction LLC 5.625% 01/03/2025 699,562 0.50 320,000 Sabine Pass Liquefaction LLC 5.625% 01/02/2021 341,200 0.25 250,000 Sensata Technologies UK Financing Co plc 6.250% 15/02/2026 271,250 0.20 950,000 Signode Industrial Group Lux SA/Signode Industrial Group US Inc 6.375% 01/05/2022 963,063 0.69 100,000 Smithfield Foods Inc 5.250% 01/08/2018 101,250 0.08 425,000 Smithfield Foods Inc 5.875% 01/08/2021 446,250 0.32 475,000 Spectrum Brands Inc 5.750% 15/07/2025 515,969 0.37 150,000 Springleaf Finance Corp 5.250% 15/12/2019 153,375 0.11 145,000 Sprint Capital Corp 6.875% 15/11/2028 135,938 0.10 740,000 Sprint Communications Inc 6.000% 15/11/2022 688,200 0.50 170,000 Sprint Communications Inc 7.000% 15/08/2020 171,275 0.12 85,000 Sprint Communications Inc 9.000% 15/11/2018 93,925 0.07 61,000 Sprint Communications Inc 9.125% 01/03/2017 62,601 0.04 380,000 Sprint Corp 7.125% 15/06/2024 370,500 0.27 905,000 Sprint Corp 7.875% 15/09/2023 911,788 0.66 270,000 Sunoco LP / Sunoco Finance Corp 5.500% 01/08/2020 272,362 0.19 345,000 Sunoco LP / Sunoco Finance Corp 6.375% 01/04/2023 356,213 0.26

PRINCIPAL GLOBAL INVESTORS FUNDS
PORTFOLIO OF INVESTMENTS AS AT 30 SEPTEMBER 2016 (continued)
56
HIGH YIELD FUND (continued)
Nominal Security Coupon Rate
Maturity Date
Value USD
% Net Assets
UNITED STATES 53.83% (30 September 2015: 56.75%) (continued) Corporate Bond (continued)
510,000 Tesoro Logistics LP / Tesoro Logistics Finance Corp 6.125% 15/10/2021 533,587 0.38 85,000 Tesoro Logistics LP / Tesoro Logistics Finance Corp 6.250% 15/10/2022 91,163 0.07 65,000 Tesoro Logistics LP / Tesoro Logistics Finance Corp 6.375% 01/05/2024 69,713 0.05 380,000 T-Mobile USA Inc 6.000% 01/03/2023 406,125 0.29 20,000 T-Mobile USA Inc 6.125% 15/01/2022 21,225 0.01 380,000 T-Mobile USA Inc 6.250% 01/04/2021 399,475 0.29 595,000 T-Mobile USA Inc 6.500% 15/01/2026 657,475 0.47 35,000 T-Mobile USA Inc 6.500% 15/01/2024 37,756 0.03 470,000 T-Mobile USA Inc 6.633% 28/04/2021 496,438 0.36 660,000 TMS International Corp 7.625% 15/10/2021 561,000 0.40 315,000 Tops Holding LLC / Tops Markets II Corp 8.000% 15/06/2022 285,075 0.21 365,000 TreeHouse Foods Inc 6.000% 15/02/2024 395,113 0.29 575,000 Universal Hospital Services Inc 7.625% 15/08/2020 550,562 0.40 17,964 US Airways 2001-1G Pass Through Trust 7.076% 20/03/2021 19,424 0.01 580,000 Valeant Pharmaceuticals International Inc 5.375% 15/03/2020 540,850 0.39 115,000 Valeant Pharmaceuticals International Inc 5.625% 01/12/2021 102,494 0.07 425,000 Valeant Pharmaceuticals International Inc 5.875% 15/05/2023 366,562 0.27 278,912 Vander Intermediate Holding II Corp 9.750% 01/02/2019 146,429 0.11 55,000 Versum Materials Inc 5.500% 30/09/2024 56,444 0.04 1,845,000 Voya Financial Inc 5.650% 15/05/2053 1,847,306 1.33 845,000 WCI Communities Inc 6.875% 15/08/2021 900,981 0.65 310,000 Weatherford International Ltd 8.250% 15/06/2023 306,125 0.22 350,000 WellCare Health Plans Inc 5.750% 15/11/2020 362,031 0.26 480,000 Wells Fargo & Co 5.900% Perpetual 499,320 0.36 315,000 Westlake Chemical Corp 4.625% 15/02/2021 329,569 0.24 250,000 WideOpenWest Finance LLC / WideOpenWest Capital Corp 10.250% 15/07/2019 263,438 0.19 236,000 WideOpenWest Finance LLC / WideOpenWest Capital Corp 13.375% 15/10/2019 252,520 0.18 426,262 Wise Metals Intermediate Holdings LLC/Wise Holdings Finance Corp 9.750% 15/06/2019 411,343 0.30 59,000 WMG Acquisition Corp 6.000% 15/01/2021 61,213 0.04 140,000 WMG Acquisition Corp 6.750% 15/04/2022 148,925 0.11 465,000 Woodside Homes Co LLC / Woodside Homes Finance Inc 6.750% 15/12/2021 452,213 0.33 455,000 WPX Energy Inc 7.500% 01/08/2020 482,300 0.35 350,000 Zayo Group LLC / Zayo Capital Inc 6.000% 01/04/2023 367,938 0.27
URUGUAY 0.25% (30 September 2015: 0.32%) Corporate Bond
455,000 Navios South American Logistics Inc / Navios Logistics Finance US Inc 7.250% 01/05/2022 348,075 0.25
Total Value of Transferable Securities at Mid Market Prices 128,223,670 92.38
UNLISTED 1.93% (30 September 2015: 0.78%)
LUXEMBOURG 0.78% (30 September 2015: 0.00%) Corporate Bond
810,000 ARD Finance SA 6.625% 15/09/2023 880,557 0.63 200,000 Coveris Holdings SA 7.875% 01/11/2019 205,500 0.15
NETHERLANDS 0.54% (30 September 2015: 0.00%) Term Loans
655,215 Adria Topco Bv 9.000% 19/06/2019 745,057 0.54
UNITED KINGDOM 0.10% (30 September 2015: 0.13%) Term Loans
278,571 Seadrill Operating LP 4.000% 14/02/2021 139,494 0.10
UNITED STATES 0.51% (30 September 2015: 0.65%) Corporate Bond
345,000 Esccbche 0.000% 15/11/2019 – 0.00 305,000 Hertz Holdings Netherlands BV 4.125% 15/10/2021 349,991 0.25
Term Loans 208,326 iStar Financial Inc 7.000% 19/03/2017 210,801 0.15 142,100 Seventy Seven Energy Inc 3.750% 17/06/2021 123,805 0.09 22,137 Zayo Group 4.000% 02/07/2019 22,265 0.02 Total Value of Unlisted at Mid Market Prices 2,677,470 1.93 Total Value of Transferable Securities at Mid Market Prices (Cost: USD131,518,621) 130,901,140 94.31
Interest Receivable on Transferable Securities 2,196,736 1.58
Total Value of Transferable Securities 133,097,876 95.89
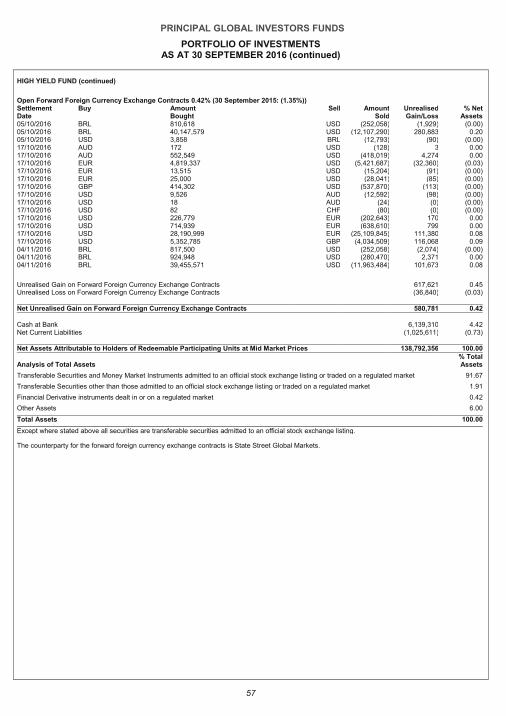
PRINCIPAL GLOBAL INVESTORS FUNDS
PORTFOLIO OF INVESTMENTS AS AT 30 SEPTEMBER 2016 (continued)
57
HIGH YIELD FUND (continued)
Open Forward Foreign Currency Exchange Contracts 0.42% (30 September 2015: (1.35%)) Settlement Date
Buy Amount Bought
Sell Amount Sold
Unrealised Gain/Loss
% Net Assets
05/10/2016 BRL 810,618 USD (252,058) (1,929) (0 .00)
05/10/2016 BRL 40,147,579 USD (12,107,290) 280,883 0 .20
05/10/2016 USD 3,858 BRL (12,793) (90) (0 .00)
17/10/2016 AUD 172 USD (128) 3 0 .00
17/10/2016 AUD 552,549 USD (418,019) 4,274 0 .00
17/10/2016 EUR 4,819,337 USD (5,421,687) (32,360) (0 .03)
17/10/2016 EUR 13,515 USD (15,204) (91) (0 .00)
17/10/2016 EUR 25,000 USD (28,041) (85) (0 .00)
17/10/2016 GBP 414,302 USD (537,870) (113) (0 .00)
17/10/2016 USD 9,526 AUD (12,592) (98) (0 .00)
17/10/2016 USD 18 AUD (24) (0) (0 .00)
17/10/2016 USD 82 CHF (80) (0) (0 .00)
17/10/2016 USD 226,779 EUR (202,643) 170 0 .00
17/10/2016 USD 714,939 EUR (638,610) 799 0 .00
17/10/2016 USD 28,190,999 EUR (25,109,845) 111,380 0 .08
17/10/2016 USD 5,352,785 GBP (4,034,509) 116,068 0 .09
04/11/2016 BRL 817,500 USD (252,058) (2,074) (0 .00)
04/11/2016 BRL 924,948 USD (280,470) 2,371 0 .00
04/11/2016 BRL 39,455,571 USD (11,963,484) 101,673 0 .08
Unrealised Gain on Forward Foreign Currency Exchange Contracts 617,621 0 .45
Unrealised Loss on Forward Foreign Currency Exchange Contracts (36,840) (0 .03)
Net Unrealised Gain on Forward Foreign Currency Exchange Contracts 580,781 0 .42
Cash at Bank 6,139,310 4.42 Net Current Liabilities (1,025,611) (0.73) Net Assets Attributable to Holders of Redeemable Participating Units at Mid Market Prices 138,792,356 100.00
Analysis of Total Assets % Total Assets
Transferable Securities and Money Market Instruments admitted to an official stock exchange listing or traded on a regulated market 91.67
Transferable Securities other than those admitted to an official stock exchange listing or traded on a regulated market 1.91
Financial Derivative instruments dealt in or on a regulated market 0.42
Other Assets 6.00
Total Assets 100.00
Except where stated above all securities are transferable securities admitted to an official stock exchange listing.
The counterparty for the forward foreign currency exchange contracts is State Street Global Markets.
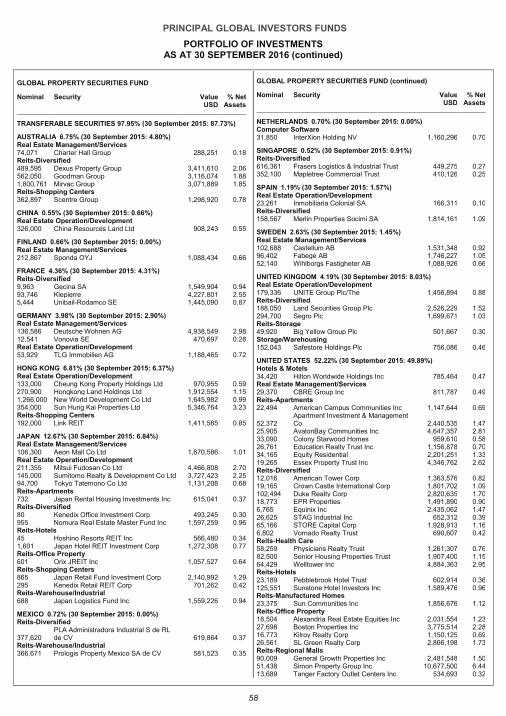
PRINCIPAL GLOBAL INVESTORS FUNDS
PORTFOLIO OF INVESTMENTS AS AT 30 SEPTEMBER 2016 (continued)
58
GLOBAL PROPERTY SECURITIES FUND
Nominal Security Value USD
% Net Assets
TRANSFERABLE SECURITIES 97.95% (30 September 2015: 87.73%)
AUSTRALIA 6.75% (30 September 2015: 4.80%) Real Estate Management/Services 74,071 Charter Hall Group 288,251 0.18 Reits-Diversified 489,595 Dexus Property Group 3,411,610 2.06 562,050 Goodman Group 3,116,074 1.88 1,800,761 Mirvac Group 3,071,889 1.85 Reits-Shopping Centers 362,897 Scentre Group 1,298,920 0.78
CHINA 0.55% (30 September 2015: 0.66%) Real Estate Operation/Development 326,000 China Resources Land Ltd 908,243 0.55
FINLAND 0.66% (30 September 2015: 0.00%) Real Estate Management/Services 212,867 Sponda OYJ 1,088,434 0.66
FRANCE 4.36% (30 September 2015: 4.31%) Reits-Diversified 9,963 Gecina SA 1,549,904 0.94 93,746 Klepierre 4,227,801 2.55 5,444 Unibail-Rodamco SE 1,445,090 0.87
GERMANY 3.98% (30 September 2015: 2.90%) Real Estate Management/Services 136,586 Deutsche Wohnen AG 4,938,549 2.98 12,541 Vonovia SE 470,697 0.28 Real Estate Operation/Development 53,929 TLG Immobilien AG 1,188,465 0.72
HONG KONG 6.81% (30 September 2015: 6.37%) Real Estate Operation/Development 133,000 Cheung Kong Property Holdings Ltd 970,955 0.59 270,900 Hongkong Land Holdings Ltd 1,912,554 1.15 1,266,000 New World Development Co Ltd 1,645,982 0.99 354,000 Sun Hung Kai Properties Ltd 5,346,764 3.23 Reits-Shopping Centers 192,000 Link REIT 1,411,585 0.85
JAPAN 12.67% (30 September 2015: 6.84%) Real Estate Management/Services 106,300 Aeon Mall Co Ltd 1,670,586 1.01 Real Estate Operation/Development 211,355 Mitsui Fudosan Co Ltd 4,466,808 2.70 145,000 Sumitomo Realty & Development Co Ltd 3,727,423 2.25 94,700 Tokyo Tatemono Co Ltd 1,131,208 0.68 Reits-Apartments 732 Japan Rental Housing Investments Inc 615,041 0.37 Reits-Diversified 80 Kenedix Office Investment Corp 493,245 0.30 955 Nomura Real Estate Master Fund Inc 1,597,259 0.96 Reits-Hotels 45 Hoshino Resorts REIT Inc 566,480 0.34 1,601 Japan Hotel REIT Investment Corp 1,272,308 0.77 Reits-Office Property 601 Orix JREIT Inc 1,057,527 0.64 Reits-Shopping Centers 865 Japan Retail Fund Investment Corp 2,140,992 1.29 295 Kenedix Retail REIT Corp 701,262 0.42 Reits-Warehouse/Industrial 688 Japan Logistics Fund Inc 1,559,226 0.94
MEXICO 0.72% (30 September 2015: 0.00%) Reits-Diversified
377,620 PLA Administradora Industrial S de RL de CV 619,864 0.37
Reits-Warehouse/Industrial 366,671 Prologis Property Mexico SA de CV 581,523 0.35
GLOBAL PROPERTY SECURITIES FUND (continued)
Nominal Security Value USD
% Net Assets
NETHERLANDS 0.70% (30 September 2015: 0.00%) Computer Software 31,850 InterXion Holding NV 1,160,296 0.70
SINGAPORE 0.52% (30 September 2015: 0.91%) Reits-Diversified 616,361 Frasers Logistics & Industrial Trust 449,275 0.27 352,100 Mapletree Commercial Trust 410,126 0.25
SPAIN 1.19% (30 September 2015: 1.57%) Real Estate Operation/Development 23,261 Inmobiliaria Colonial SA 166,311 0.10 Reits-Diversified 158,567 Merlin Properties Socimi SA 1,814,161 1.09
SWEDEN 2.63% (30 September 2015: 1.45%) Real Estate Management/Services 102,688 Castellum AB 1,531,348 0.92 96,402 Fabege AB 1,746,227 1.05 52,140 Wihlborgs Fastigheter AB 1,088,926 0.66
UNITED KINGDOM 4.19% (30 September 2015: 8.03%) Real Estate Operation/Development 179,336 UNITE Group Plc/The 1,456,894 0.88 Reits-Diversified 188,050 Land Securities Group Plc 2,526,229 1.52 294,700 Segro Plc 1,699,671 1.03 Reits-Storage 49,920 Big Yellow Group Plc 501,667 0.30 Storage/Warehousing 152,043 Safestore Holdings Plc 756,086 0.46
UNITED STATES 52.22% (30 September 2015: 49.89%) Hotels & Motels 34,420 Hilton Worldwide Holdings Inc 785,464 0.47 Real Estate Management/Services 29,370 CBRE Group Inc 811,787 0.49 Reits-Apartments 22,494 American Campus Communities Inc 1,147,644 0.69
52,372 Apartment Investment & Management Co 2,440,535 1.47
25,905 AvalonBay Communities Inc 4,647,357 2.81 33,090 Colony Starwood Homes 959,610 0.58 26,761 Education Realty Trust Inc 1,156,878 0.70 34,165 Equity Residential 2,201,251 1.33 19,265 Essex Property Trust Inc 4,346,762 2.62 Reits-Diversified 12,016 American Tower Corp 1,363,576 0.82 19,165 Crown Castle International Corp 1,801,702 1.09 102,494 Duke Realty Corp 2,820,635 1.70 18,773 EPR Properties 1,491,890 0.90 6,765 Equinix Inc 2,435,062 1.47 26,625 STAG Industrial Inc 652,312 0.39 65,166 STORE Capital Corp 1,928,913 1.16 6,802 Vornado Realty Trust 690,607 0.42 Reits-Health Care 58,259 Physicians Realty Trust 1,261,307 0.76 82,500 Senior Housing Properties Trust 1,907,400 1.15 64,429 Welltower Inc 4,884,363 2.95 Reits-Hotels 23,189 Pebblebrook Hotel Trust 602,914 0.36 125,551 Sunstone Hotel Investors Inc 1,589,476 0.96 Reits-Manufactured Homes 23,375 Sun Communities Inc 1,856,676 1.12 Reits-Office Property 18,504 Alexandria Real Estate Equities Inc 2,031,554 1.23 27,698 Boston Properties Inc 3,775,514 2.28 16,773 Kilroy Realty Corp 1,150,125 0.69 26,561 SL Green Realty Corp 2,866,198 1.73 Reits-Regional Malls 90,009 General Growth Properties Inc 2,481,548 1.50 51,438 Simon Property Group Inc 10,677,500 6.44 13,689 Tanger Factory Outlet Centers Inc 534,693 0.32
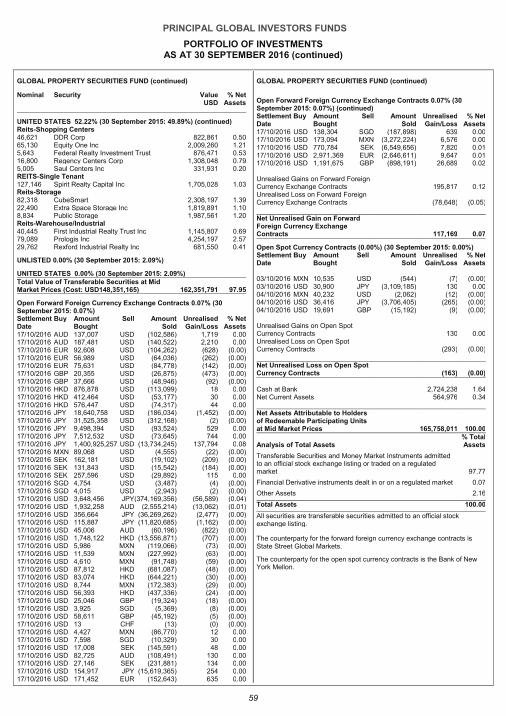
PRINCIPAL GLOBAL INVESTORS FUNDS
PORTFOLIO OF INVESTMENTS AS AT 30 SEPTEMBER 2016 (continued)
59
GLOBAL PROPERTY SECURITIES FUND (continued)
Nominal Security Value USD
% Net Assets
UNITED STATES 52.22% (30 September 2015: 49.89%) (continued) Reits-Shopping Centers 46,621 DDR Corp 822,861 0.50 65,130 Equity One Inc 2,009,260 1.21 5,643 Federal Realty Investment Trust 876,471 0.53 16,800 Regency Centers Corp 1,308,048 0.79 5,005 Saul Centers Inc 331,931 0.20 REITS-Single Tenant 127,146 Spirit Realty Capital Inc 1,705,028 1.03 Reits-Storage 82,318 CubeSmart 2,308,197 1.39 22,490 Extra Space Storage Inc 1,819,891 1.10 8,834 Public Storage 1,987,561 1.20 Reits-Warehouse/Industrial 40,445 First Industrial Realty Trust Inc 1,145,807 0.69 79,089 Prologis Inc 4,254,197 2.57 29,762 Rexford Industrial Realty Inc 681,550 0.41
UNLISTED 0.00% (30 September 2015: 2.09%)
UNITED STATES 0.00% (30 September 2015: 2.09%) Total Value of Transferable Securities at Mid Market Prices (Cost: USD148,351,165) 162,351,791 97.95
Open Forward Foreign Currency Exchange Contracts 0.07% (30 September 2015: 0.07%) Settlement Buy Amount Sell Amount Unrealised % Net Date Bought Sold Gain/Loss Assets 17/10/2016 AUD 137,007 USD (102,586) 1,719 0 .00
17/10/2016 AUD 187,481 USD (140,522) 2,210 0 .00
17/10/2016 EUR 92,608 USD (104,262) (628) (0 .00)
17/10/2016 EUR 56,989 USD (64,036) (262) (0 .00)
17/10/2016 EUR 75,631 USD (84,778) (142) (0 .00)
17/10/2016 GBP 20,355 USD (26,875) (473) (0 .00)
17/10/2016 GBP 37,666 USD (48,946) (92) (0 .00)
17/10/2016 HKD 876,878 USD (113,099) 18 0 .00
17/10/2016 HKD 412,464 USD (53,177) 30 0 .00
17/10/2016 HKD 576,447 USD (74,317) 44 0 .00
17/10/2016 JPY 18,640,758 USD (186,034) (1,452) (0 .00)
17/10/2016 JPY 31,525,358 USD (312,168) (2) (0 .00)
17/10/2016 JPY 9,498,394 USD (93,524) 529 0 .00
17/10/2016 JPY 7,512,532 USD (73,645) 744 0 .00
17/10/2016 JPY 1,400,925,257 USD (13,734,245) 137,794 0 .08
17/10/2016 MXN 89,068 USD (4,555) (22) (0 .00)
17/10/2016 SEK 162,181 USD (19,102) (209) (0 .00)
17/10/2016 SEK 131,843 USD (15,542) (184) (0 .00)
17/10/2016 SEK 257,596 USD (29,892) 115 0 .00
17/10/2016 SGD 4,754 USD (3,487) (4) (0 .00)
17/10/2016 SGD 4,015 USD (2,943) (2) (0 .00)
17/10/2016 USD 3,648,456 JPY (374,169,356) (56,589) (0 .04)
17/10/2016 USD 1,932,258 AUD (2,555,214) (13,062) (0 .01)
17/10/2016 USD 356,664 JPY (36,269,262) (2,477) (0 .00)
17/10/2016 USD 115,887 JPY (11,820,685) (1,162) (0 .00)
17/10/2016 USD 45,006 AUD (60,196) (822) (0 .00)
17/10/2016 USD 1,748,122 HKD (13,556,871) (707) (0 .00)
17/10/2016 USD 5,986 MXN (119,066) (73) (0 .00)
17/10/2016 USD 11,539 MXN (227,992) (63) (0 .00)
17/10/2016 USD 4,610 MXN (91,748) (59) (0 .00)
17/10/2016 USD 87,812 HKD (681,087) (48) (0 .00)
17/10/2016 USD 83,074 HKD (644,221) (30) (0 .00)
17/10/2016 USD 8,744 MXN (172,383) (29) (0 .00)
17/10/2016 USD 56,393 HKD (437,336) (24) (0 .00)
17/10/2016 USD 25,046 GBP (19,324) (18) (0 .00)
17/10/2016 USD 3,925 SGD (5,369) (8) (0 .00)
17/10/2016 USD 58,611 GBP (45,192) (5) (0 .00)
17/10/2016 USD 13 CHF (13) (0) (0 .00)
17/10/2016 USD 4,427 MXN (86,770) 12 0 .00
17/10/2016 USD 7,598 SGD (10,329) 30 0 .00
17/10/2016 USD 17,008 SEK (145,591) 48 0 .00
17/10/2016 USD 82,725 AUD (108,491) 130 0 .00
17/10/2016 USD 27,146 SEK (231,881) 134 0 .00
17/10/2016 USD 154,917 JPY (15,619,365) 254 0 .00
17/10/2016 USD 171,452 EUR (152,643) 635 0 .00
GLOBAL PROPERTY SECURITIES FUND (continued)
Open Forward Foreign Currency Exchange Contracts 0.07% (30 September 2015: 0.07%) (continued) Settlement Buy Amount Sell Amount Unrealised % Net Date Bought Sold Gain/Loss Assets 17/10/2016 USD 138,304 SGD (187,898) 639 0 .00
17/10/2016 USD 173,094 MXN (3,272,224) 6,576 0 .00
17/10/2016 USD 770,784 SEK (6,549,656) 7,820 0 .01
17/10/2016 USD 2,971,369 EUR (2,646,611) 9,647 0 .01
17/10/2016 USD 1,191,675 GBP (898,191) 26,689 0 .02
Unrealised Gains on Forward Foreign Currency Exchange Contracts 195,817 0.12 Unrealised Loss on Forward Foreign Currency Exchange Contracts (78,648) (0.05)
Net Unrealised Gain on Forward Foreign Currency Exchange Contracts 117,169 0.07
Open Spot Currency Contracts (0.00%) (30 September 2015: 0.00%) Settlement Buy Amount Sell Amount Unrealised % Net Date Bought Sold Gain/Loss Assets
03/10/2016 MXN 10,535 USD (544) (7) (0.00) 03/10/2016 USD 30,900 JPY (3,109,185) 130 0.00 04/10/2016 MXN 40,232 USD (2,062) (12) (0.00) 04/10/2016 USD 36,416 JPY (3,706,405) (265) (0.00) 04/10/2016 USD 19,691 GBP (15,192) (9) (0.00) Unrealised Gains on Open Spot Currency Contracts 130 0.00 Unrealised Loss on Open Spot Currency Contracts (293) (0.00) Net Unrealised Loss on Open Spot Currency Contracts (163) (0 .00)
Cash at Bank 2,724,238 1.64 Net Current Assets 564,976 0.34 Net Assets Attributable to Holders of Redeemable Participating Units at Mid Market Prices 165,758,011 100.00
Analysis of Total Assets % Total Assets
Transferable Securities and Money Market Instruments admitted to an official stock exchange listing or traded on a regulated market 97.77
Financial Derivative instruments dealt in or on a regulated market 0.07
Other Assets 2.16
Total Assets 100.00
All securities are transferable securities admitted to an official stock exchange listing.
The counterparty for the forward foreign currency exchange contracts is State Street Global Markets.
The counterparty for the open spot currency contracts is the Bank of New York Mellon.
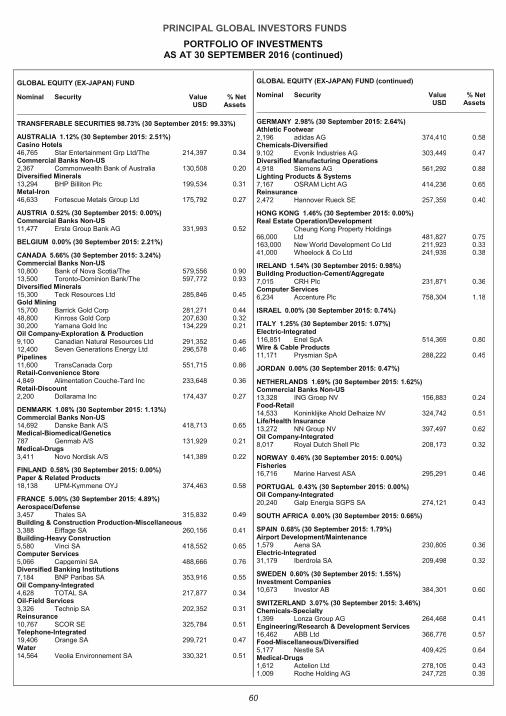
PRINCIPAL GLOBAL INVESTORS FUNDS
PORTFOLIO OF INVESTMENTS AS AT 30 SEPTEMBER 2016 (continued)
60
GLOBAL EQUITY (EX-JAPAN) FUND
Nominal Security Value USD
% Net Assets
TRANSFERABLE SECURITIES 98.73% (30 September 2015: 99.33%)
AUSTRALIA 1.12% (30 September 2015: 2.51%) Casino Hotels 46,765 Star Entertainment Grp Ltd/The 214,397 0.34 Commercial Banks Non-US 2,367 Commonwealth Bank of Australia 130,508 0.20 Diversified Minerals 13,294 BHP Billiton Plc 199,534 0.31 Metal-Iron 46,633 Fortescue Metals Group Ltd 175,792 0.27
AUSTRIA 0.52% (30 September 2015: 0.00%) Commercial Banks Non-US 11,477 Erste Group Bank AG 331,993 0.52
BELGIUM 0.00% (30 September 2015: 2.21%)
CANADA 5.66% (30 September 2015: 3.24%) Commercial Banks Non-US 10,800 Bank of Nova Scotia/The 579,556 0.90 13,500 Toronto-Dominion Bank/The 597,772 0.93 Diversified Minerals 15,300 Teck Resources Ltd 285,846 0.45 Gold Mining 15,700 Barrick Gold Corp 281,271 0.44 48,800 Kinross Gold Corp 207,630 0.32 30,200 Yamana Gold Inc 134,229 0.21 Oil Company-Exploration & Production 9,100 Canadian Natural Resources Ltd 291,352 0.46 12,400 Seven Generations Energy Ltd 296,578 0.46 Pipelines 11,600 TransCanada Corp 551,715 0.86 Retail-Convenience Store 4,849 Alimentation Couche-Tard Inc 233,648 0.36 Retail-Discount 2,200 Dollarama Inc 174,437 0.27
DENMARK 1.08% (30 September 2015: 1.13%) Commercial Banks Non-US 14,692 Danske Bank A/S 418,713 0.65 Medical-Biomedical/Genetics 787 Genmab A/S 131,929 0.21 Medical-Drugs 3,411 Novo Nordisk A/S 141,389 0.22
FINLAND 0.58% (30 September 2015: 0.00%) Paper & Related Products 18,138 UPM-Kymmene OYJ 374,463 0.58
FRANCE 5.00% (30 September 2015: 4.89%) Aerospace/Defense 3,457 Thales SA 315,832 0.49 Building & Construction Production-Miscellaneous 3,388 Eiffage SA 260,156 0.41 Building-Heavy Construction 5,580 Vinci SA 418,552 0.65 Computer Services 5,066 Capgemini SA 488,666 0.76 Diversified Banking Institutions 7,184 BNP Paribas SA 353,916 0.55 Oil Company-Integrated 4,628 TOTAL SA 217,877 0.34 Oil-Field Services 3,326 Technip SA 202,352 0.31 Reinsurance 10,767 SCOR SE 325,784 0.51 Telephone-Integrated 19,406 Orange SA 299,721 0.47 Water 14,564 Veolia Environnement SA 330,321 0.51
GLOBAL EQUITY (EX-JAPAN) FUND (continued)
Nominal Security Value USD
% Net Assets
GERMANY 2.98% (30 September 2015: 2.64%) Athletic Footwear 2,196 adidas AG 374,410 0.58 Chemicals-Diversified 9,102 Evonik Industries AG 303,449 0.47 Diversified Manufacturing Operations 4,918 Siemens AG 561,292 0.88 Lighting Products & Systems 7,167 OSRAM Licht AG 414,236 0.65 Reinsurance 2,472 Hannover Rueck SE 257,359 0.40
HONG KONG 1.46% (30 September 2015: 0.00%) Real Estate Operation/Development
66,000 Cheung Kong Property Holdings Ltd 481,827 0.75
163,000 New World Development Co Ltd 211,923 0.33 41,000 Wheelock & Co Ltd 241,939 0.38
IRELAND 1.54% (30 September 2015: 0.98%) Building Production-Cement/Aggregate 7,015 CRH Plc 231,871 0.36 Computer Services 6,234 Accenture Plc 758,304 1.18
ISRAEL 0.00% (30 September 2015: 0.74%)
ITALY 1.25% (30 September 2015: 1.07%) Electric-Integrated 116,851 Enel SpA 514,369 0.80 Wire & Cable Products 11,171 Prysmian SpA 288,222 0.45
JORDAN 0.00% (30 September 2015: 0.47%)
NETHERLANDS 1.69% (30 September 2015: 1.62%) Commercial Banks Non-US 13,328 ING Groep NV 156,883 0.24 Food-Retail 14,533 Koninklijke Ahold Delhaize NV 324,742 0.51 Life/Health Insurance 13,272 NN Group NV 397,497 0.62 Oil Company-Integrated 8,017 Royal Dutch Shell Plc 208,173 0.32
NORWAY 0.46% (30 September 2015: 0.00%) Fisheries 16,716 Marine Harvest ASA 295,291 0.46
PORTUGAL 0.43% (30 September 2015: 0.00%) Oil Company-Integrated 20,240 Galp Energia SGPS SA 274,121 0.43
SOUTH AFRICA 0.00% (30 September 2015: 0.66%)
SPAIN 0.68% (30 September 2015: 1.79%) Airport Development/Maintenance 1,579 Aena SA 230,805 0.36 Electric-Integrated 31,179 Iberdrola SA 209,498 0.32
SWEDEN 0.60% (30 September 2015: 1.55%) Investment Companies 10,673 Investor AB 384,301 0.60
SWITZERLAND 3.07% (30 September 2015: 3.46%) Chemicals-Specialty 1,399 Lonza Group AG 264,468 0.41 Engineering/Research & Development Services 16,462 ABB Ltd 366,776 0.57 Food-Miscellaneous/Diversified 5,177 Nestle SA 409,425 0.64 Medical-Drugs 1,612 Actelion Ltd 278,105 0.43 1,009 Roche Holding AG 247,725 0.39
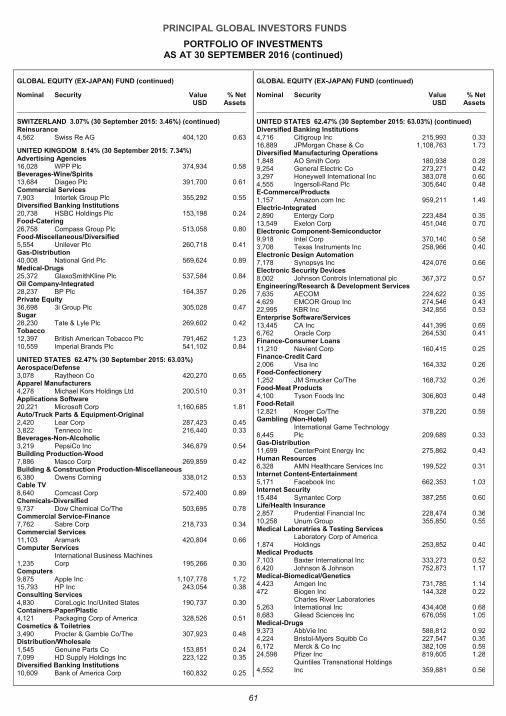
PRINCIPAL GLOBAL INVESTORS FUNDS
PORTFOLIO OF INVESTMENTS AS AT 30 SEPTEMBER 2016 (continued)
61
GLOBAL EQUITY (EX-JAPAN) FUND (continued)
Nominal Security Value USD
% Net Assets
SWITZERLAND 3.07% (30 September 2015: 3.46%) (continued) Reinsurance 4,562 Swiss Re AG 404,120 0.63
UNITED KINGDOM 8.14% (30 September 2015: 7.34%) Advertising Agencies 16,028 WPP Plc 374,934 0.58 Beverages-Wine/Spirits 13,684 Diageo Plc 391,700 0.61 Commercial Services 7,903 Intertek Group Plc 355,292 0.55 Diversified Banking Institutions 20,738 HSBC Holdings Plc 153,198 0.24 Food-Catering 26,758 Compass Group Plc 513,058 0.80 Food-Miscellaneous/Diversified 5,554 Unilever Plc 260,718 0.41 Gas-Distribution 40,008 National Grid Plc 569,624 0.89 Medical-Drugs 25,372 GlaxoSmithKline Plc 537,584 0.84 Oil Company-Integrated 28,237 BP Plc 164,357 0.26 Private Equity 36,698 3i Group Plc 305,028 0.47 Sugar 28,230 Tate & Lyle Plc 269,602 0.42 Tobacco 12,397 British American Tobacco Plc 791,462 1.23 10,559 Imperial Brands Plc 541,102 0.84
UNITED STATES 62.47% (30 September 2015: 63.03%) Aerospace/Defense 3,078 Raytheon Co 420,270 0.65 Apparel Manufacturers 4,278 Michael Kors Holdings Ltd 200,510 0.31 Applications Software 20,221 Microsoft Corp 1,160,685 1.81 Auto/Truck Parts & Equipment-Original 2,420 Lear Corp 287,423 0.45 3,822 Tenneco Inc 216,440 0.33 Beverages-Non-Alcoholic 3,219 PepsiCo Inc 346,879 0.54 Building Production-Wood 7,886 Masco Corp 269,859 0.42 Building & Construction Production-Miscellaneous 6,380 Owens Corning 338,012 0.53 Cable TV 8,640 Comcast Corp 572,400 0.89 Chemicals-Diversified 9,737 Dow Chemical Co/The 503,695 0.78 Commercial Service-Finance 7,762 Sabre Corp 218,733 0.34 Commercial Services 11,103 Aramark 420,804 0.66 Computer Services
1,235 International Business Machines Corp 195,266 0.30
Computers 9,875 Apple Inc 1,107,778 1.72 15,793 HP Inc 243,054 0.38 Consulting Services 4,830 CoreLogic Inc/United States 190,737 0.30 Containers-Paper/Plastic 4,121 Packaging Corp of America 328,526 0.51 Cosmetics & Toiletries 3,490 Procter & Gamble Co/The 307,923 0.48 Distribution/Wholesale 1,545 Genuine Parts Co 153,851 0.24 7,099 HD Supply Holdings Inc 223,122 0.35 Diversified Banking Institutions 10,609 Bank of America Corp 160,832 0.25
GLOBAL EQUITY (EX-JAPAN) FUND (continued)
Nominal Security Value USD
% Net Assets
UNITED STATES 62.47% (30 September 2015: 63.03%) (continued) Diversified Banking Institutions 4,716 Citigroup Inc 215,993 0.33 16,889 JPMorgan Chase & Co 1,108,763 1.73 Diversified Manufacturing Operations 1,848 AO Smith Corp 180,938 0.28 9,254 General Electric Co 273,271 0.42 3,297 Honeywell International Inc 383,078 0.60 4,555 Ingersoll-Rand Plc 305,640 0.48 E-Commerce/Products 1,157 Amazon.com Inc 959,211 1.49 Electric-Integrated 2,890 Entergy Corp 223,484 0.35 13,549 Exelon Corp 451,046 0.70 Electronic Component-Semiconductor 9,918 Intel Corp 370,140 0.58 3,708 Texas Instruments Inc 258,966 0.40 Electronic Design Automation 7,178 Synopsys Inc 424,076 0.66 Electronic Security Devices 8,002 Johnson Controls International plc 367,372 0.57 Engineering/Research & Development Services 7,635 AECOM 224,622 0.35 4,629 EMCOR Group Inc 274,546 0.43 22,995 KBR Inc 342,855 0.53 Enterprise Software/Services 13,445 CA Inc 441,399 0.69 6,762 Oracle Corp 264,530 0.41 Finance-Consumer Loans 11,210 Navient Corp 160,415 0.25 Finance-Credit Card 2,006 Visa Inc 164,332 0.26 Food-Confectionery 1,252 JM Smucker Co/The 168,732 0.26 Food-Meat Products 4,100 Tyson Foods Inc 306,803 0.48 Food-Retail 12,821 Kroger Co/The 378,220 0.59 Gambling (Non-Hotel)
8,445 International Game Technology Plc 209,689 0.33
Gas-Distribution 11,699 CenterPoint Energy Inc 275,862 0.43 Human Resources 6,328 AMN Healthcare Services Inc 199,522 0.31 Internet Content-Entertainment 5,171 Facebook Inc 662,353 1.03 Internet Security 15,484 Symantec Corp 387,255 0.60 Life/Health Insurance 2,857 Prudential Financial Inc 228,474 0.36 10,258 Unum Group 355,850 0.55 Medical Laboratries & Testing Services
1,874 Laboratory Corp of America Holdings 253,852 0.40
Medical Products 7,103 Baxter International Inc 333,273 0.52 6,420 Johnson & Johnson 752,873 1.17 Medical-Biomedical/Genetics 4,423 Amgen Inc 731,785 1.14 472 Biogen Inc 144,328 0.22
5,263 Charles River Laboratories International Inc 434,408 0.68
8,683 Gilead Sciences Inc 676,059 1.05 Medical-Drugs 9,373 AbbVie Inc 588,812 0.92 4,224 Bristol-Myers Squibb Co 227,547 0.35 6,172 Merck & Co Inc 382,109 0.59 24,598 Pfizer Inc 819,605 1.28
4,552 Quintiles Transnational Holdings Inc 359,881 0.56
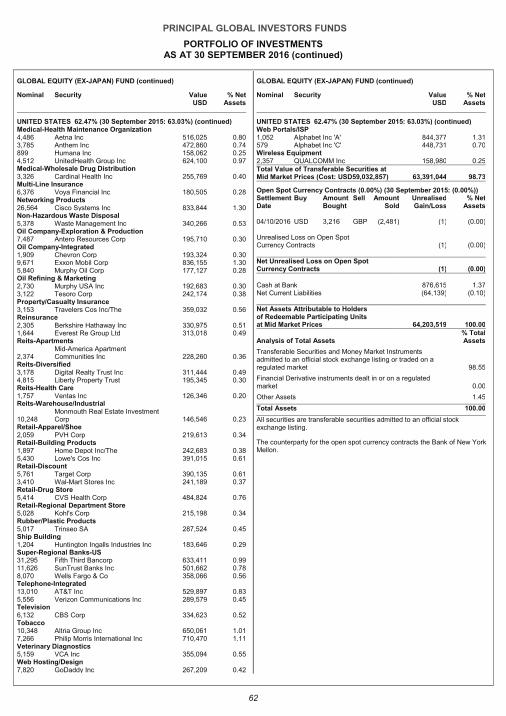
PRINCIPAL GLOBAL INVESTORS FUNDS
PORTFOLIO OF INVESTMENTS AS AT 30 SEPTEMBER 2016 (continued)
62
GLOBAL EQUITY (EX-JAPAN) FUND (continued)
Nominal Security Value USD
% Net Assets
UNITED STATES 62.47% (30 September 2015: 63.03%) (continued) Medical-Health Maintenance Organization 4,486 Aetna Inc 516,025 0.80 3,785 Anthem Inc 472,860 0.74 899 Humana Inc 158,062 0.25 4,512 UnitedHealth Group Inc 624,100 0.97 Medical-Wholesale Drug Distribution 3,326 Cardinal Health Inc 255,769 0.40 Multi-Line Insurance 6,376 Voya Financial Inc 180,505 0.28 Networking Products 26,564 Cisco Systems Inc 833,844 1.30 Non-Hazardous Waste Disposal 5,378 Waste Management Inc 340,266 0.53 Oil Company-Exploration & Production 7,487 Antero Resources Corp 195,710 0.30 Oil Company-Integrated 1,909 Chevron Corp 193,324 0.30 9,671 Exxon Mobil Corp 836,155 1.30 5,840 Murphy Oil Corp 177,127 0.28 Oil Refining & Marketing 2,730 Murphy USA Inc 192,683 0.30 3,122 Tesoro Corp 242,174 0.38 Property/Casualty Insurance 3,153 Travelers Cos Inc/The 359,032 0.56 Reinsurance 2,305 Berkshire Hathaway Inc 330,975 0.51 1,644 Everest Re Group Ltd 313,018 0.49 Reits-Apartments
2,374 Mid-America Apartment Communities Inc 228,260 0.36
Reits-Diversified 3,178 Digital Realty Trust Inc 311,444 0.49 4,815 Liberty Property Trust 195,345 0.30 Reits-Health Care 1,757 Ventas Inc 126,346 0.20 Reits-Warehouse/Industrial
10,248 Monmouth Real Estate Investment Corp 146,546 0.23
Retail-Apparel/Shoe 2,059 PVH Corp 219,613 0.34 Retail-Building Products 1,897 Home Depot Inc/The 242,683 0.38 5,430 Lowe's Cos Inc 391,015 0.61 Retail-Discount 5,761 Target Corp 390,135 0.61 3,410 Wal-Mart Stores Inc 241,189 0.37 Retail-Drug Store 5,414 CVS Health Corp 484,824 0.76 Retail-Regional Department Store 5,028 Kohl's Corp 215,198 0.34 Rubber/Plastic Products 5,017 Trinseo SA 287,524 0.45 Ship Building 1,204 Huntington Ingalls Industries Inc 183,646 0.29 Super-Regional Banks-US 31,295 Fifth Third Bancorp 633,411 0.99 11,626 SunTrust Banks Inc 501,662 0.78 8,070 Wells Fargo & Co 358,066 0.56 Telephone-Integrated 13,010 AT&T Inc 529,897 0.83 5,556 Verizon Communications Inc 289,579 0.45 Television 6,132 CBS Corp 334,623 0.52 Tobacco 10,348 Altria Group Inc 650,061 1.01 7,266 Philip Morris International Inc 710,470 1.11 Veterinary Diagnostics 5,159 VCA Inc 355,094 0.55 Web Hosting/Design 7,820 GoDaddy Inc 267,209 0.42
GLOBAL EQUITY (EX-JAPAN) FUND (continued)
Nominal Security Value USD
% Net Assets
UNITED STATES 62.47% (30 September 2015: 63.03%) (continued) Web Portals/ISP 1,052 Alphabet Inc 'A' 844,377 1.31 579 Alphabet Inc 'C' 448,731 0.70 Wireless Equipment 2,357 QUALCOMM Inc 158,980 0.25 Total Value of Transferable Securities at Mid Market Prices (Cost: USD59,032,857) 63,391,044 98.73
Open Spot Currency Contracts (0.00%) (30 September 2015: (0.00%)) Settlement Buy Amount Sell Amount Unrealised % Net Date Bought Sold Gain/Loss Assets
04/10/2016 USD 3,216 GBP (2,481) (1) (0.00) Unrealised Loss on Open Spot Currency Contracts (1) (0.00) Net Unrealised Loss on Open Spot Currency Contracts (1) (0 .00)
Cash at Bank 876,615 1.37 Net Current Liabilities (64,139) (0.10) Net Assets Attributable to Holders of Redeemable Participating Units at Mid Market Prices 64,203,519 100.00
Analysis of Total Assets % Total Assets
Transferable Securities and Money Market Instruments admitted to an official stock exchange listing or traded on a regulated market 98.55
Financial Derivative instruments dealt in or on a regulated market 0.00
Other Assets 1.45
Total Assets 100.00
All securities are transferable securities admitted to an official stock exchange listing.
The counterparty for the open spot currency contracts the Bank of New York Mellon.
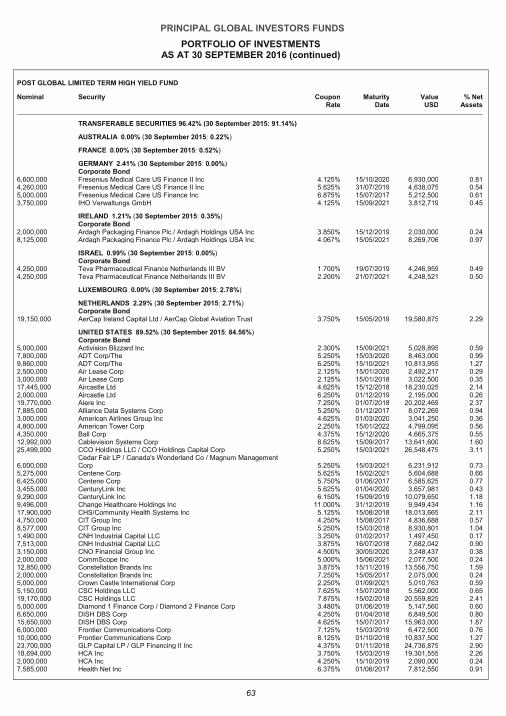
PRINCIPAL GLOBAL INVESTORS FUNDS
PORTFOLIO OF INVESTMENTS AS AT 30 SEPTEMBER 2016 (continued)
63
POST GLOBAL LIMITED TERM HIGH YIELD FUND
Nominal Security Coupon Rate
Maturity Date
Value USD
% Net Assets
TRANSFERABLE SECURITIES 96.42% (30 September 2015: 91.14%)
AUSTRALIA 0.00% (30 September 2015: 0.22%)
FRANCE 0.00% (30 September 2015: 0.52%)
GERMANY 2.41% (30 September 2015: 0.00%) Corporate Bond
6,600,000 Fresenius Medical Care US Finance II Inc 4.125% 15/10/2020 6,930,000 0.81 4,260,000 Fresenius Medical Care US Finance II Inc 5.625% 31/07/2019 4,638,075 0.54 5,000,000 Fresenius Medical Care US Finance Inc 6.875% 15/07/2017 5,212,500 0.61 3,750,000 IHO Verwaltungs GmbH 4.125% 15/09/2021 3,812,719 0.45
IRELAND 1.21% (30 September 2015: 0.35%) Corporate Bond
2,000,000 Ardagh Packaging Finance Plc / Ardagh Holdings USA Inc 3.850% 15/12/2019 2,030,000 0.24 8,125,000 Ardagh Packaging Finance Plc / Ardagh Holdings USA Inc 4.067% 15/05/2021 8,269,706 0.97
ISRAEL 0.99% (30 September 2015: 0.00%) Corporate Bond
4,250,000 Teva Pharmaceutical Finance Netherlands III BV 1.700% 19/07/2019 4,246,959 0.49 4,250,000 Teva Pharmaceutical Finance Netherlands III BV 2.200% 21/07/2021 4,248,521 0.50
LUXEMBOURG 0.00% (30 September 2015: 2.78%)
NETHERLANDS 2.29% (30 September 2015: 2.71%) Corporate Bond
19,150,000 AerCap Ireland Capital Ltd / AerCap Global Aviation Trust 3.750% 15/05/2019 19,580,875 2.29
UNITED STATES 89.52% (30 September 2015: 84.56%) Corporate Bond
5,000,000 Activision Blizzard Inc 2.300% 15/09/2021 5,028,895 0.59 7,800,000 ADT Corp/The 5.250% 15/03/2020 8,463,000 0.99 9,860,000 ADT Corp/The 6.250% 15/10/2021 10,813,955 1.27 2,500,000 Air Lease Corp 2.125% 15/01/2020 2,492,217 0.29 3,000,000 Air Lease Corp 2.125% 15/01/2018 3,022,500 0.35 17,445,000 Aircastle Ltd 4.625% 15/12/2018 18,230,025 2.14 2,000,000 Aircastle Ltd 6.250% 01/12/2019 2,195,000 0.26 19,770,000 Alere Inc 7.250% 01/07/2018 20,202,469 2.37 7,885,000 Alliance Data Systems Corp 5.250% 01/12/2017 8,072,269 0.94 3,000,000 American Airlines Group Inc 4.625% 01/03/2020 3,041,250 0.36 4,800,000 American Tower Corp 2.250% 15/01/2022 4,799,095 0.56 4,350,000 Ball Corp 4.375% 15/12/2020 4,665,375 0.55 12,992,000 Cablevision Systems Corp 8.625% 15/09/2017 13,641,600 1.60 25,499,000 CCO Holdings LLC / CCO Holdings Capital Corp 5.250% 15/03/2021 26,548,475 3.11
6,000,000 Cedar Fair LP / Canada's Wonderland Co / Magnum Management Corp 5.250% 15/03/2021 6,231,912 0.73
5,275,000 Centene Corp 5.625% 15/02/2021 5,604,688 0.66 6,425,000 Centene Corp 5.750% 01/06/2017 6,585,625 0.77 3,455,000 CenturyLink Inc 5.625% 01/04/2020 3,657,981 0.43 9,290,000 CenturyLink Inc 6.150% 15/09/2019 10,079,650 1.18 9,496,000 Change Healthcare Holdings Inc 11.000% 31/12/2019 9,949,434 1.16 17,900,000 CHS/Community Health Systems Inc 5.125% 15/08/2018 18,013,665 2.11 4,750,000 CIT Group Inc 4.250% 15/08/2017 4,836,688 0.57 8,577,000 CIT Group Inc 5.250% 15/03/2018 8,930,801 1.04 1,490,000 CNH Industrial Capital LLC 3.250% 01/02/2017 1,497,450 0.17 7,513,000 CNH Industrial Capital LLC 3.875% 16/07/2018 7,682,042 0.90 3,150,000 CNO Financial Group Inc 4.500% 30/05/2020 3,248,437 0.38 2,000,000 CommScope Inc 5.000% 15/06/2021 2,077,500 0.24 12,850,000 Constellation Brands Inc 3.875% 15/11/2019 13,556,750 1.59 2,000,000 Constellation Brands Inc 7.250% 15/05/2017 2,075,000 0.24 5,000,000 Crown Castle International Corp 2.250% 01/09/2021 5,010,763 0.59 5,150,000 CSC Holdings LLC 7.625% 15/07/2018 5,562,000 0.65 19,170,000 CSC Holdings LLC 7.875% 15/02/2018 20,559,825 2.41 5,000,000 Diamond 1 Finance Corp / Diamond 2 Finance Corp 3.480% 01/06/2019 5,147,560 0.60 6,650,000 DISH DBS Corp 4.250% 01/04/2018 6,849,500 0.80 15,650,000 DISH DBS Corp 4.625% 15/07/2017 15,963,000 1.87 6,000,000 Frontier Communications Corp 7.125% 15/03/2019 6,472,500 0.76 10,000,000 Frontier Communications Corp 8.125% 01/10/2018 10,837,500 1.27 23,700,000 GLP Capital LP / GLP Financing II Inc 4.375% 01/11/2018 24,736,875 2.90 18,694,000 HCA Inc 3.750% 15/03/2019 19,301,555 2.26 2,000,000 HCA Inc 4.250% 15/10/2019 2,090,000 0.24 7,585,000 Health Net Inc 6.375% 01/06/2017 7,812,550 0.91
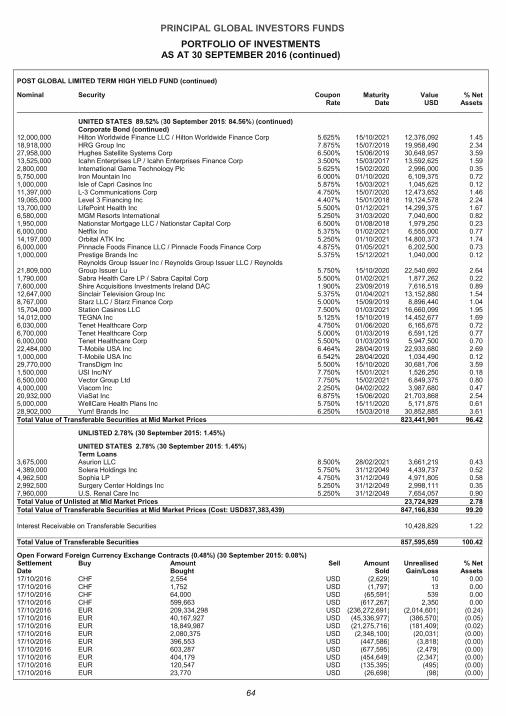
PRINCIPAL GLOBAL INVESTORS FUNDS
PORTFOLIO OF INVESTMENTS AS AT 30 SEPTEMBER 2016 (continued)
64
POST GLOBAL LIMITED TERM HIGH YIELD FUND (continued)
Nominal Security Coupon Rate
Maturity Date
Value USD
% Net Assets
UNITED STATES 89.52% (30 September 2015: 84.56%) (continued) Corporate Bond (continued)
12,000,000 Hilton Worldwide Finance LLC / Hilton Worldwide Finance Corp 5.625% 15/10/2021 12,376,092 1.45 18,918,000 HRG Group Inc 7.875% 15/07/2019 19,958,490 2.34 27,958,000 Hughes Satellite Systems Corp 6.500% 15/06/2019 30,648,957 3.59 13,525,000 Icahn Enterprises LP / Icahn Enterprises Finance Corp 3.500% 15/03/2017 13,592,625 1.59 2,800,000 International Game Technology Plc 5.625% 15/02/2020 2,996,000 0.35 5,750,000 Iron Mountain Inc 6.000% 01/10/2020 6,109,375 0.72 1,000,000 Isle of Capri Casinos Inc 5.875% 15/03/2021 1,045,625 0.12 11,397,000 L-3 Communications Corp 4.750% 15/07/2020 12,473,652 1.46 19,065,000 Level 3 Financing Inc 4.407% 15/01/2018 19,124,578 2.24 13,700,000 LifePoint Health Inc 5.500% 01/12/2021 14,299,375 1.67 6,580,000 MGM Resorts International 5.250% 31/03/2020 7,040,600 0.82 1,950,000 Nationstar Mortgage LLC / Nationstar Capital Corp 6.500% 01/08/2018 1,979,250 0.23 6,000,000 Netflix Inc 5.375% 01/02/2021 6,555,000 0.77 14,197,000 Orbital ATK Inc 5.250% 01/10/2021 14,800,373 1.74 6,000,000 Pinnacle Foods Finance LLC / Pinnacle Foods Finance Corp 4.875% 01/05/2021 6,202,500 0.73 1,000,000 Prestige Brands Inc 5.375% 15/12/2021 1,040,000 0.12
21,809,000 Reynolds Group Issuer Inc / Reynolds Group Issuer LLC / Reynolds Group Issuer Lu 5.750% 15/10/2020 22,540,692 2.64
1,790,000 Sabra Health Care LP / Sabra Capital Corp 5.500% 01/02/2021 1,877,262 0.22 7,600,000 Shire Acquisitions Investments Ireland DAC 1.900% 23/09/2019 7,616,519 0.89 12,647,000 Sinclair Television Group Inc 5.375% 01/04/2021 13,152,880 1.54 8,767,000 Starz LLC / Starz Finance Corp 5.000% 15/09/2019 8,896,440 1.04 15,704,000 Station Casinos LLC 7.500% 01/03/2021 16,660,099 1.95 14,012,000 TEGNA Inc 5.125% 15/10/2019 14,452,677 1.69 6,030,000 Tenet Healthcare Corp 4.750% 01/06/2020 6,165,675 0.72 6,700,000 Tenet Healthcare Corp 5.000% 01/03/2019 6,591,125 0.77 6,000,000 Tenet Healthcare Corp 5.500% 01/03/2019 5,947,500 0.70 22,484,000 T-Mobile USA Inc 6.464% 28/04/2019 22,933,680 2.69 1,000,000 T-Mobile USA Inc 6.542% 28/04/2020 1,034,490 0.12 29,770,000 TransDigm Inc 5.500% 15/10/2020 30,681,706 3.59 1,500,000 USI Inc/NY 7.750% 15/01/2021 1,526,250 0.18 6,500,000 Vector Group Ltd 7.750% 15/02/2021 6,849,375 0.80 4,000,000 Viacom Inc 2.250% 04/02/2022 3,987,680 0.47 20,932,000 ViaSat Inc 6.875% 15/06/2020 21,703,868 2.54 5,000,000 WellCare Health Plans Inc 5.750% 15/11/2020 5,171,875 0.61 28,902,000 Yum! Brands Inc 6.250% 15/03/2018 30,852,885 3.61 Total Value of Transferable Securities at Mid Market Prices 823,441,901 96.42
UNLISTED 2.78% (30 September 2015: 1.45%)
UNITED STATES 2.78% (30 September 2015: 1.45%) Term Loans
3,675,000 Asurion LLC 8.500% 28/02/2021 3,661,219 0.43 4,389,000 Solera Holdings Inc 5.750% 31/12/2049 4,439,737 0.52 4,962,500 Sophia LP 4.750% 31/12/2049 4,971,805 0.58 2,992,500 Surgery Center Holdings Inc 5.250% 31/12/2049 2,998,111 0.35 7,960,000 U.S. Renal Care Inc 5.250% 31/12/2049 7,654,057 0.90 Total Value of Unlisted at Mid Market Prices 23,724,929 2.78 Total Value of Transferable Securities at Mid Market Prices (Cost: USD837,383,439) 847,166,830 99.20
Interest Receivable on Transferable Securities 10,428,829 1.22
Total Value of Transferable Securities 857,595,659 100.42
Open Forward Foreign Currency Exchange Contracts (0.48%) (30 September 2015: 0.08%) Settlement Date
Buy Amount Bought
Sell Amount Sold
Unrealised Gain/Loss
% Net Assets
17/10/2016 CHF 2,554 USD (2,629) 10 0 .00
17/10/2016 CHF 1,752 USD (1,797) 13 0 .00
17/10/2016 CHF 64,000 USD (65,591) 539 0 .00
17/10/2016 CHF 599,663 USD (617,267) 2,350 0 .00
17/10/2016 EUR 209,334,298 USD (236,272,691) (2,014,601) (0 .24)
17/10/2016 EUR 40,167,927 USD (45,336,977) (386,570) (0 .05)
17/10/2016 EUR 18,849,987 USD (21,275,716) (181,409) (0 .02)
17/10/2016 EUR 2,080,375 USD (2,348,100) (20,031) (0 .00)
17/10/2016 EUR 396,553 USD (447,586) (3,818) (0 .00)
17/10/2016 EUR 603,287 USD (677,595) (2,479) (0 .00)
17/10/2016 EUR 404,179 USD (454,649) (2,347) (0 .00)
17/10/2016 EUR 120,547 USD (135,395) (495) (0 .00)
17/10/2016 EUR 23,770 USD (26,698) (98) (0 .00)
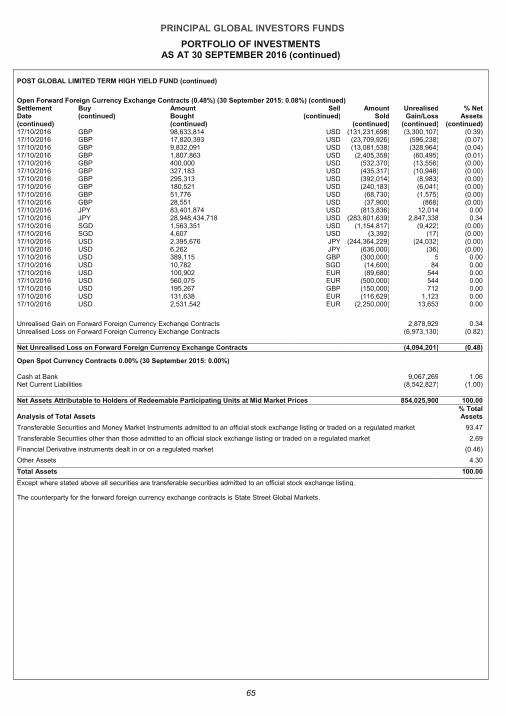
PRINCIPAL GLOBAL INVESTORS FUNDS
PORTFOLIO OF INVESTMENTS AS AT 30 SEPTEMBER 2016 (continued)
65
POST GLOBAL LIMITED TERM HIGH YIELD FUND (continued)
Open Forward Foreign Currency Exchange Contracts (0.48%) (30 September 2015: 0.08%) (continued) Settlement Date (continued)
Buy (continued)
Amount Bought (continued)
Sell (continued)
Amount Sold
(continued)
Unrealised Gain/Loss
(continued)
% Net Assets
(continued) 17/10/2016 GBP 98,633,814 USD (131,231,698) (3,300,107) (0 .39)
17/10/2016 GBP 17,820,393 USD (23,709,926) (596,238) (0 .07)
17/10/2016 GBP 9,832,091 USD (13,081,538) (328,964) (0 .04)
17/10/2016 GBP 1,807,863 USD (2,405,358) (60,495) (0 .01)
17/10/2016 GBP 400,000 USD (532,370) (13,556) (0 .00)
17/10/2016 GBP 327,183 USD (435,317) (10,948) (0 .00)
17/10/2016 GBP 295,313 USD (392,014) (8,983) (0 .00)
17/10/2016 GBP 180,521 USD (240,183) (6,041) (0 .00)
17/10/2016 GBP 51,776 USD (68,730) (1,575) (0 .00)
17/10/2016 GBP 28,551 USD (37,900) (868) (0 .00)
17/10/2016 JPY 83,401,874 USD (813,836) 12,014 0 .00
17/10/2016 JPY 28,948,434,718 USD (283,801,639) 2,847,338 0 .34
17/10/2016 SGD 1,563,351 USD (1,154,817) (9,422) (0 .00)
17/10/2016 SGD 4,607 USD (3,392) (17) (0 .00)
17/10/2016 USD 2,395,676 JPY (244,364,229) (24,032) (0 .00)
17/10/2016 USD 6,262 JPY (636,000) (36) (0 .00)
17/10/2016 USD 389,115 GBP (300,000) 5 0 .00
17/10/2016 USD 10,782 SGD (14,600) 84 0 .00
17/10/2016 USD 100,902 EUR (89,680) 544 0 .00
17/10/2016 USD 560,075 EUR (500,000) 544 0 .00
17/10/2016 USD 195,267 GBP (150,000) 712 0 .00
17/10/2016 USD 131,638 EUR (116,629) 1,123 0 .00
17/10/2016 USD 2,531,542 EUR (2,250,000) 13,653 0 .00
Unrealised Gain on Forward Foreign Currency Exchange Contracts 2,878,929 0 .34
Unrealised Loss on Forward Foreign Currency Exchange Contracts (6,973,130) (0 .82)
Net Unrealised Loss on Forward Foreign Currency Exchange Contracts (4,094,201) (0 .48)
Open Spot Currency Contracts 0.00% (30 September 2015: 0.00%)
Cash at Bank 9,067,269 1.06 Net Current Liabilities (8,542,827) (1.00) Net Assets Attributable to Holders of Redeemable Participating Units at Mid Market Prices 854,025,900 100.00
Analysis of Total Assets % Total Assets
Transferable Securities and Money Market Instruments admitted to an official stock exchange listing or traded on a regulated market 93.47
Transferable Securities other than those admitted to an official stock exchange listing or traded on a regulated market 2.69
Financial Derivative instruments dealt in or on a regulated market (0.46)
Other Assets 4.30
Total Assets 100.00
Except where stated above all securities are transferable securities admitted to an official stock exchange listing.
The counterparty for the forward foreign currency exchange contracts is State Street Global Markets.
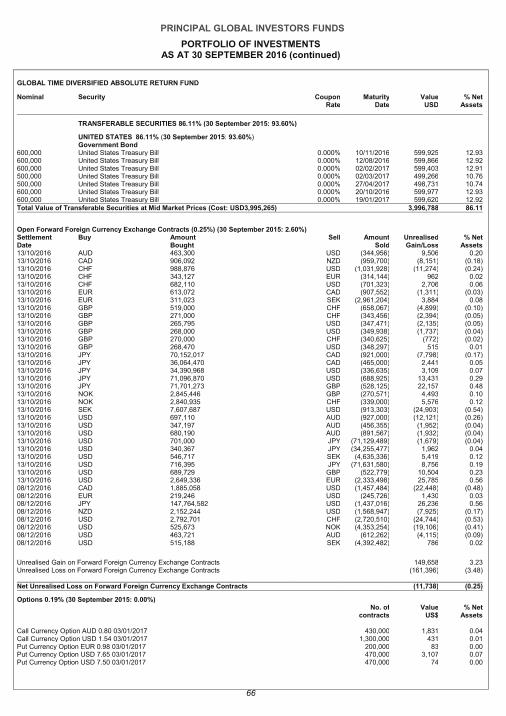
PRINCIPAL GLOBAL INVESTORS FUNDS
PORTFOLIO OF INVESTMENTS AS AT 30 SEPTEMBER 2016 (continued)
66
GLOBAL TIME DIVERSIFIED ABSOLUTE RETURN FUND
Nominal Security Coupon Rate
Maturity Date
Value USD
% Net Assets
TRANSFERABLE SECURITIES 86.11% (30 September 2015: 93.60%)
UNITED STATES 86.11% (30 September 2015: 93.60%) Government Bond
600,000 United States Treasury Bill 0.000% 10/11/2016 599,925 12.93 600,000 United States Treasury Bill 0.000% 12/08/2016 599,866 12.92 600,000 United States Treasury Bill 0.000% 02/02/2017 599,403 12.91 500,000 United States Treasury Bill 0.000% 02/03/2017 499,266 10.76 500,000 United States Treasury Bill 0.000% 27/04/2017 498,731 10.74 600,000 United States Treasury Bill 0.000% 20/10/2016 599,977 12.93 600,000 United States Treasury Bill 0.000% 19/01/2017 599,620 12.92 Total Value of Transferable Securities at Mid Market Prices (Cost: USD3,995,265) 3,996,788 86.11
Open Forward Foreign Currency Exchange Contracts (0.25%) (30 September 2015: 2.60%) Settlement Date
Buy Amount Bought
Sell Amount Sold
Unrealised Gain/Loss
% Net Assets
13/10/2016 AUD 463,300 USD (344,956) 9,506 0 .20
13/10/2016 CAD 906,092 NZD (959,700) (8,151) (0 .18)
13/10/2016 CHF 988,876 USD (1,031,928) (11,274) (0 .24)
13/10/2016 CHF 343,127 EUR (314,144) 962 0 .02
13/10/2016 CHF 682,110 USD (701,323) 2,706 0 .06
13/10/2016 EUR 613,072 CAD (907,552) (1,311) (0 .03)
13/10/2016 EUR 311,023 SEK (2,961,204) 3,884 0 .08
13/10/2016 GBP 519,000 CHF (658,067) (4,899) (0 .10)
13/10/2016 GBP 271,000 CHF (343,456) (2,394) (0 .05)
13/10/2016 GBP 265,795 USD (347,471) (2,135) (0 .05)
13/10/2016 GBP 268,000 USD (349,938) (1,737) (0 .04)
13/10/2016 GBP 270,000 CHF (340,625) (772) (0 .02)
13/10/2016 GBP 268,470 USD (348,297) 515 0 .01
13/10/2016 JPY 70,152,017 CAD (921,000) (7,798) (0 .17)
13/10/2016 JPY 36,064,470 CAD (465,000) 2,441 0 .05
13/10/2016 JPY 34,390,968 USD (336,635) 3,109 0 .07
13/10/2016 JPY 71,096,870 USD (688,925) 13,431 0 .29
13/10/2016 JPY 71,701,273 GBP (528,125) 22,157 0 .48
13/10/2016 NOK 2,845,446 GBP (270,571) 4,493 0 .10
13/10/2016 NOK 2,840,935 CHF (339,000) 5,576 0 .12
13/10/2016 SEK 7,607,687 USD (913,303) (24,903) (0 .54)
13/10/2016 USD 697,110 AUD (927,000) (12,121) (0 .26)
13/10/2016 USD 347,197 AUD (456,355) (1,952) (0 .04)
13/10/2016 USD 680,190 AUD (891,567) (1,932) (0 .04)
13/10/2016 USD 701,000 JPY (71,129,489) (1,679) (0 .04)
13/10/2016 USD 340,367 JPY (34,255,477) 1,962 0 .04
13/10/2016 USD 546,717 SEK (4,635,336) 5,419 0 .12
13/10/2016 USD 716,395 JPY (71,631,580) 8,756 0 .19
13/10/2016 USD 689,729 GBP (522,779) 10,504 0 .23
13/10/2016 USD 2,649,336 EUR (2,333,498) 25,785 0 .56
08/12/2016 CAD 1,885,058 USD (1,457,484) (22,448) (0 .48)
08/12/2016 EUR 219,246 USD (245,726) 1,430 0 .03
08/12/2016 JPY 147,764,582 USD (1,437,016) 26,236 0 .56
08/12/2016 NZD 2,152,244 USD (1,568,947) (7,925) (0 .17)
08/12/2016 USD 2,792,701 CHF (2,720,510) (24,744) (0 .53)
08/12/2016 USD 525,673 NOK (4,353,254) (19,106) (0 .41)
08/12/2016 USD 463,721 AUD (612,262) (4,115) (0 .09)
08/12/2016 USD 515,188 SEK (4,392,482) 786 0 .02
Unrealised Gain on Forward Foreign Currency Exchange Contracts 149,658 3 .23
Unrealised Loss on Forward Foreign Currency Exchange Contracts (161,396) (3 .48)
Net Unrealised Loss on Forward Foreign Currency Exchange Contracts (11,738) (0 .25)
Options 0.19% (30 September 2015: 0.00%)
No. of
contracts Value
US$ % Net
Assets
Call Currency Option AUD 0.80 03/01/2017 430,000 1,831 0.04 Call Currency Option USD 1.54 03/01/2017 1,300,000 431 0.01 Put Currency Option EUR 0.98 03/01/2017 200,000 83 0.00 Put Currency Option USD 7.65 03/01/2017 470,000 3,107 0.07 Put Currency Option USD 7.50 03/01/2017 470,000 74 0.00
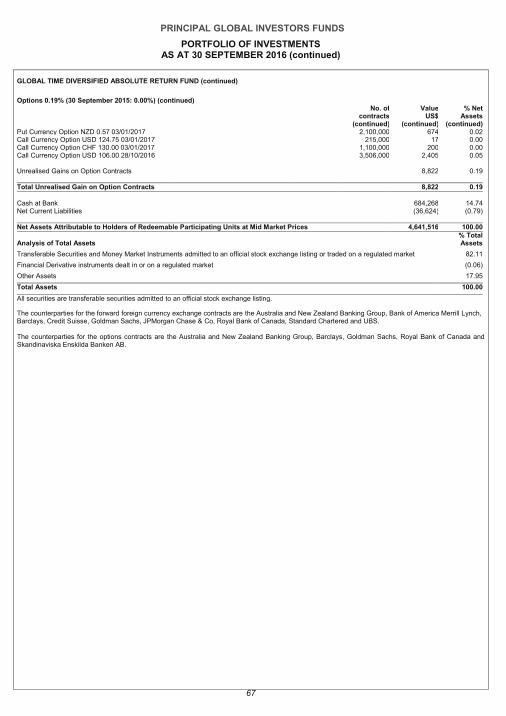
PRINCIPAL GLOBAL INVESTORS FUNDS
PORTFOLIO OF INVESTMENTS AS AT 30 SEPTEMBER 2016 (continued)
67
GLOBAL TIME DIVERSIFIED ABSOLUTE RETURN FUND (continued)
Options 0.19% (30 September 2015: 0.00%) (continued)
No. of contracts
(continued)
Value US$
(continued)
% Net Assets
(continued) Put Currency Option NZD 0.57 03/01/2017 2,100,000 674 0.02 Call Currency Option USD 124.75 03/01/2017 215,000 17 0.00 Call Currency Option CHF 130.00 03/01/2017 1,100,000 200 0.00 Call Currency Option USD 106.00 28/10/2016 3,506,000 2,405 0.05
Unrealised Gains on Option Contracts 8,822 0.19 Total Unrealised Gain on Option Contracts 8,822 0.19
Cash at Bank 684,268 14.74 Net Current Liabilities (36,624) (0.79) Net Assets Attributable to Holders of Redeemable Participating Units at Mid Market Prices 4,641,516 100.00
Analysis of Total Assets % Total Assets
Transferable Securities and Money Market Instruments admitted to an official stock exchange listing or traded on a regulated market 82.11
Financial Derivative instruments dealt in or on a regulated market (0.06)
Other Assets 17.95
Total Assets 100.00
All securities are transferable securities admitted to an official stock exchange listing.
The counterparties for the forward foreign currency exchange contracts are the Australia and New Zealand Banking Group, Bank of America Merrill Lynch, Barclays, Credit Suisse, Goldman Sachs, JPMorgan Chase & Co, Royal Bank of Canada, Standard Chartered and UBS. The counterparties for the options contracts are the Australia and New Zealand Banking Group, Barclays, Goldman Sachs, Royal Bank of Canada and Skandinaviska Enskilda Banken AB.
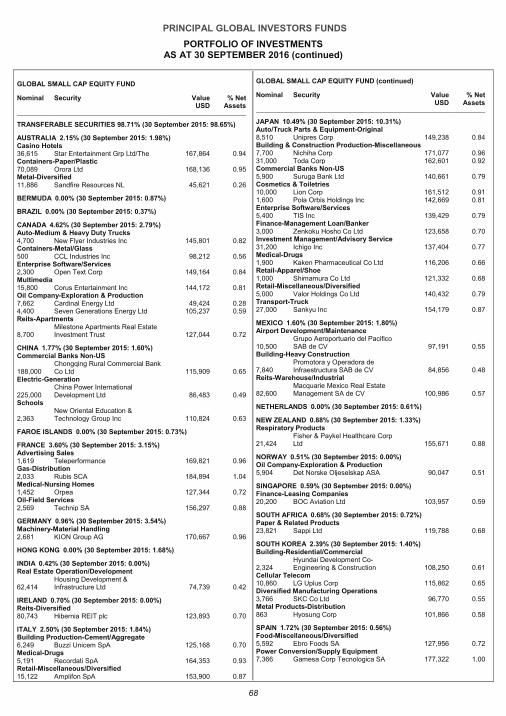
PRINCIPAL GLOBAL INVESTORS FUNDS
PORTFOLIO OF INVESTMENTS AS AT 30 SEPTEMBER 2016 (continued)
68
GLOBAL SMALL CAP EQUITY FUND
Nominal Security Value USD
% Net Assets
TRANSFERABLE SECURITIES 98.71% (30 September 2015: 98.65%)
AUSTRALIA 2.15% (30 September 2015: 1.98%) Casino Hotels 36,615 Star Entertainment Grp Ltd/The 167,864 0.94 Containers-Paper/Plastic 70,089 Orora Ltd 168,136 0.95 Metal-Diversified 11,886 Sandfire Resources NL 45,621 0.26
BERMUDA 0.00% (30 September 2015: 0.87%)
BRAZIL 0.00% (30 September 2015: 0.37%)
CANADA 4.62% (30 September 2015: 2.79%) Auto-Medium & Heavy Duty Trucks 4,700 New Flyer Industries Inc 145,801 0.82 Containers-Metal/Glass 500 CCL Industries Inc 98,212 0.56 Enterprise Software/Services 2,300 Open Text Corp 149,164 0.84 Multimedia 15,800 Corus Entertainment Inc 144,172 0.81 Oil Company-Exploration & Production 7,662 Cardinal Energy Ltd 49,424 0.28 4,400 Seven Generations Energy Ltd 105,237 0.59 Reits-Apartments
8,700 Milestone Apartments Real Estate Investment Trust 127,044 0.72
CHINA 1.77% (30 September 2015: 1.60%) Commercial Banks Non-US
188,000 Chongqing Rural Commercial Bank Co Ltd 115,909 0.65
Electric-Generation
225,000 China Power International Development Ltd 86,483 0.49
Schools
2,363 New Oriental Education & Technology Group Inc 110,824 0.63
FAROE ISLANDS 0.00% (30 September 2015: 0.73%)
FRANCE 3.60% (30 September 2015: 3.15%) Advertising Sales 1,619 Teleperformance 169,821 0.96 Gas-Distribution 2,033 Rubis SCA 184,894 1.04 Medical-Nursing Homes 1,452 Orpea 127,344 0.72 Oil-Field Services 2,569 Technip SA 156,297 0.88
GERMANY 0.96% (30 September 2015: 3.54%) Machinery-Material Handling 2,681 KION Group AG 170,667 0.96
HONG KONG 0.00% (30 September 2015: 1.68%)
INDIA 0.42% (30 September 2015: 0.00%) Real Estate Operation/Development
62,414 Housing Development & Infrastructure Ltd 74,739 0.42
IRELAND 0.70% (30 September 2015: 0.00%) Reits-Diversified 80,743 Hibernia REIT plc 123,893 0.70
ITALY 2.50% (30 September 2015: 1.84%) Building Production-Cement/Aggregate 6,249 Buzzi Unicem SpA 125,168 0.70 Medical-Drugs 5,191 Recordati SpA 164,353 0.93 Retail-Miscellaneous/Diversified 15,122 Amplifon SpA 153,900 0.87
GLOBAL SMALL CAP EQUITY FUND (continued)
Nominal Security Value USD
% Net Assets
JAPAN 10.49% (30 September 2015: 10.31%) Auto/Truck Parts & Equipment-Original 8,510 Unipres Corp 149,238 0.84 Building & Construction Production-Miscellaneous 7,700 Nichiha Corp 171,077 0.96 31,000 Toda Corp 162,601 0.92 Commercial Banks Non-US 5,900 Suruga Bank Ltd 140,661 0.79 Cosmetics & Toiletries 10,000 Lion Corp 161,512 0.91 1,600 Pola Orbis Holdings Inc 142,669 0.81 Enterprise Software/Services 5,400 TIS Inc 139,429 0.79 Finance-Management Loan/Banker 3,000 Zenkoku Hosho Co Ltd 123,658 0.70 Investment Management/Advisory Service 31,200 Ichigo Inc 137,404 0.77 Medical-Drugs 1,900 Kaken Pharmaceutical Co Ltd 116,206 0.66 Retail-Apparel/Shoe 1,000 Shimamura Co Ltd 121,332 0.68 Retail-Miscellaneous/Diversified 5,000 Valor Holdings Co Ltd 140,432 0.79 Transport-Truck 27,000 Sankyu Inc 154,179 0.87
MEXICO 1.60% (30 September 2015: 1.80%) Airport Development/Maintenance
10,500 Grupo Aeroportuario del Pacifico SAB de CV 97,191 0.55
Building-Heavy Construction
7,840 Promotora y Operadora de Infraestructura SAB de CV 84,856 0.48
Reits-Warehouse/Industrial
82,600 Macquarie Mexico Real Estate Management SA de CV 100,986 0.57
NETHERLANDS 0.00% (30 September 2015: 0.61%)
NEW ZEALAND 0.88% (30 September 2015: 1.33%) Respiratory Products
21,424 Fisher & Paykel Healthcare Corp Ltd 155,671 0.88
NORWAY 0.51% (30 September 2015: 0.00%) Oil Company-Exploration & Production 5,904 Det Norske Oljeselskap ASA 90,047 0.51
SINGAPORE 0.59% (30 September 2015: 0.00%) Finance-Leasing Companies 20,200 BOC Aviation Ltd 103,957 0.59
SOUTH AFRICA 0.68% (30 September 2015: 0.72%) Paper & Related Products 23,821 Sappi Ltd 119,788 0.68
SOUTH KOREA 2.39% (30 September 2015: 1.40%) Building-Residential/Commercial
2,324 Hyundai Development Co-Engineering & Construction 108,250 0.61
Cellular Telecom 10,860 LG Uplus Corp 115,862 0.65 Diversified Manufacturing Operations 3,766 SKC Co Ltd 96,770 0.55 Metal Products-Distribution 863 Hyosung Corp 101,866 0.58
SPAIN 1.72% (30 September 2015: 0.56%) Food-Miscellaneous/Diversified 5,592 Ebro Foods SA 127,956 0.72 Power Conversion/Supply Equipment 7,366 Gamesa Corp Tecnologica SA 177,322 1.00
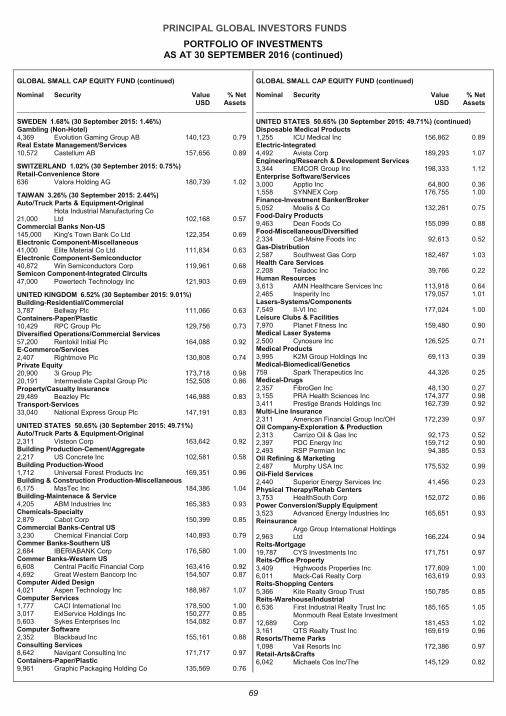
PRINCIPAL GLOBAL INVESTORS FUNDS
PORTFOLIO OF INVESTMENTS AS AT 30 SEPTEMBER 2016 (continued)
69
GLOBAL SMALL CAP EQUITY FUND (continued)
Nominal Security Value USD
% Net Assets
SWEDEN 1.68% (30 September 2015: 1.46%) Gambling (Non-Hotel) 4,369 Evolution Gaming Group AB 140,123 0.79 Real Estate Management/Services 10,572 Castellum AB 157,656 0.89
SWITZERLAND 1.02% (30 September 2015: 0.75%) Retail-Convenience Store 636 Valora Holding AG 180,739 1.02
TAIWAN 3.26% (30 September 2015: 2.44%) Auto/Truck Parts & Equipment-Original
21,000 Hota Industrial Manufacturing Co Ltd 102,168 0.57
Commercial Banks Non-US 145,000 King's Town Bank Co Ltd 122,354 0.69 Electronic Component-Miscellaneous 41,000 Elite Material Co Ltd 111,834 0.63 Electronic Component-Semiconductor 40,872 Win Semiconductors Corp 119,961 0.68 Semicon Component-Integrated Circuits 47,000 Powertech Technology Inc 121,903 0.69
UNITED KINGDOM 6.52% (30 September 2015: 9.01%) Building-Residential/Commercial 3,787 Bellway Plc 111,066 0.63 Containers-Paper/Plastic 10,429 RPC Group Plc 129,756 0.73 Diversified Operations/Commercial Services 57,200 Rentokil Initial Plc 164,088 0.92 E-Commerce/Services 2,407 Rightmove Plc 130,808 0.74 Private Equity 20,900 3i Group Plc 173,718 0.98 20,191 Intermediate Capital Group Plc 152,508 0.86 Property/Casualty Insurance 29,489 Beazley Plc 146,988 0.83 Transport-Services 33,040 National Express Group Plc 147,191 0.83
UNITED STATES 50.65% (30 September 2015: 49.71%) Auto/Truck Parts & Equipment-Original 2,311 Visteon Corp 163,642 0.92 Building Production-Cement/Aggregate 2,217 US Concrete Inc 102,581 0.58 Building Production-Wood 1,712 Universal Forest Products Inc 169,351 0.96 Building & Construction Production-Miscellaneous 6,175 MasTec Inc 184,386 1.04 Building-Maintenace & Service 4,205 ABM Industries Inc 165,383 0.93 Chemicals-Specialty 2,879 Cabot Corp 150,399 0.85 Commercial Banks-Central US 3,230 Chemical Financial Corp 140,893 0.79 Commer Banks-Southern US 2,684 IBERIABANK Corp 176,580 1.00 Commer Banks-Western US 6,608 Central Pacific Financial Corp 163,416 0.92 4,692 Great Western Bancorp Inc 154,507 0.87 Computer Aided Design 4,021 Aspen Technology Inc 188,987 1.07 Computer Services 1,777 CACI International Inc 178,500 1.00 3,017 ExlService Holdings Inc 150,277 0.85 5,603 Sykes Enterprises Inc 154,082 0.87 Computer Software 2,352 Blackbaud Inc 155,161 0.88 Consulting Services 8,642 Navigant Consulting Inc 171,717 0.97 Containers-Paper/Plastic 9,961 Graphic Packaging Holding Co 135,569 0.76
GLOBAL SMALL CAP EQUITY FUND (continued)
Nominal Security Value USD
% Net Assets
UNITED STATES 50.65% (30 September 2015: 49.71%) (continued) Disposable Medical Products 1,255 ICU Medical Inc 156,862 0.89 Electric-Integrated 4,492 Avista Corp 189,293 1.07 Engineering/Research & Development Services 3,344 EMCOR Group Inc 198,333 1.12 Enterprise Software/Services 3,000 Apptio Inc 64,800 0.36 1,558 SYNNEX Corp 176,755 1.00 Finance-Investment Banker/Broker 5,052 Moelis & Co 132,261 0.75 Food-Dairy Products 9,463 Dean Foods Co 155,099 0.88 Food-Miscellaneous/Diversified 2,334 Cal-Maine Foods Inc 92,613 0.52 Gas-Distribution 2,587 Southwest Gas Corp 182,487 1.03 Health Care Services 2,208 Teladoc Inc 39,766 0.22 Human Resources 3,613 AMN Healthcare Services Inc 113,918 0.64 2,465 Insperity Inc 179,057 1.01 Lasers-Systems/Components 7,549 II-VI Inc 177,024 1.00 Leisure Clubs & Facilities 7,970 Planet Fitness Inc 159,480 0.90 Medical Laser Systems 2,500 Cynosure Inc 126,525 0.71 Medical Products 3,995 K2M Group Holdings Inc 69,113 0.39 Medical-Biomedical/Genetics 759 Spark Therapeutics Inc 44,326 0.25 Medical-Drugs 2,357 FibroGen Inc 48,130 0.27 3,155 PRA Health Sciences Inc 174,377 0.98 3,411 Prestige Brands Holdings Inc 162,739 0.92 Multi-Line Insurance 2,311 American Financial Group Inc/OH 172,239 0.97 Oil Company-Exploration & Production 2,313 Carrizo Oil & Gas Inc 92,173 0.52 2,397 PDC Energy Inc 159,712 0.90 2,493 RSP Permian Inc 94,385 0.53 Oil Refining & Marketing 2,487 Murphy USA Inc 175,532 0.99 Oil-Field Services 2,440 Superior Energy Services Inc 41,456 0.23 Physical Therapy/Rehab Centers 3,753 HealthSouth Corp 152,072 0.86 Power Conversion/Supply Equipment 3,523 Advanced Energy Industries Inc 165,651 0.93 Reinsurance
2,963 Argo Group International Holdings Ltd 166,224 0.94
Reits-Mortgage 19,787 CYS Investments Inc 171,751 0.97 Reits-Office Property 3,409 Highwoods Properties Inc 177,609 1.00 6,011 Mack-Cali Realty Corp 163,619 0.93 Reits-Shopping Centers 5,366 Kite Realty Group Trust 150,785 0.85 Reits-Warehouse/Industrial 6,536 First Industrial Realty Trust Inc 185,165 1.05
12,689 Monmouth Real Estate Investment Corp 181,453 1.02
3,161 QTS Realty Trust Inc 169,619 0.96 Resorts/Theme Parks 1,098 Vail Resorts Inc 172,386 0.97 Retail-Arts&Crafts 6,042 Michaels Cos Inc/The 145,129 0.82
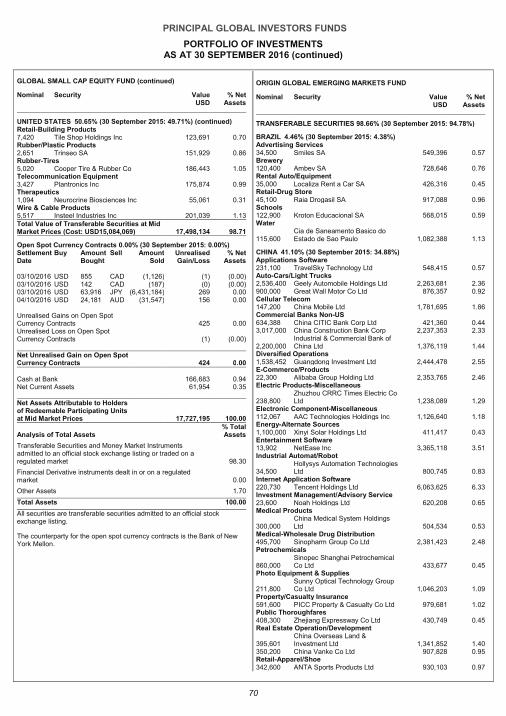
PRINCIPAL GLOBAL INVESTORS FUNDS
PORTFOLIO OF INVESTMENTS AS AT 30 SEPTEMBER 2016 (continued)
70
GLOBAL SMALL CAP EQUITY FUND (continued)
Nominal Security Value USD
% Net Assets
UNITED STATES 50.65% (30 September 2015: 49.71%) (continued) Retail-Building Products 7,420 Tile Shop Holdings Inc 123,691 0.70 Rubber/Plastic Products 2,651 Trinseo SA 151,929 0.86 Rubber-Tires 5,020 Cooper Tire & Rubber Co 186,443 1.05 Telecommunication Equipment 3,427 Plantronics Inc 175,874 0.99 Therapeutics 1,094 Neurocrine Biosciences Inc 55,061 0.31 Wire & Cable Products 5,517 Insteel Industries Inc 201,039 1.13 Total Value of Transferable Securities at Mid Market Prices (Cost: USD15,084,069) 17,498,134 98.71
Open Spot Currency Contracts 0.00% (30 September 2015: 0.00%) Settlement Buy Amount Sell Amount Unrealised % Net Date Bought Sold Gain/Loss Assets
03/10/2016 USD 855 CAD (1,126) (1) (0.00) 03/10/2016 USD 142 CAD (187) (0) (0.00) 03/10/2016 USD 63,916 JPY (6,431,184) 269 0.00 04/10/2016 USD 24,181 AUD (31,547) 156 0.00 Unrealised Gains on Open Spot Currency Contracts 425 0.00 Unrealised Loss on Open Spot Currency Contracts (1) (0.00) Net Unrealised Gain on Open Spot Currency Contracts 424 0 .00
Cash at Bank 166,683 0.94 Net Current Assets 61,954 0.35 Net Assets Attributable to Holders of Redeemable Participating Units at Mid Market Prices 17,727,195 100.00
Analysis of Total Assets % Total Assets
Transferable Securities and Money Market Instruments admitted to an official stock exchange listing or traded on a regulated market 98.30
Financial Derivative instruments dealt in or on a regulated market 0.00
Other Assets 1.70
Total Assets 100.00
All securities are transferable securities admitted to an official stock exchange listing.
The counterparty for the open spot currency contracts is the Bank of New York Mellon.
ORIGIN GLOBAL EMERGING MARKETS FUND
Nominal Security Value USD
% Net Assets
TRANSFERABLE SECURITIES 98.66% (30 September 2015: 94.78%)
BRAZIL 4.46% (30 September 2015: 4.38%) Advertising Services 34,500 Smiles SA 549,396 0.57 Brewery 120,400 Ambev SA 728,646 0.76 Rental Auto/Equipment 35,000 Localiza Rent a Car SA 426,316 0.45 Retail-Drug Store 45,100 Raia Drogasil SA 917,088 0.96 Schools 122,900 Kroton Educacional SA 568,015 0.59 Water
115,600 Cia de Saneamento Basico do Estado de Sao Paulo 1,082,388 1.13
CHINA 41.10% (30 September 2015: 34.88%) Applications Software 231,100 TravelSky Technology Ltd 548,415 0.57 Auto-Cars/Light Trucks 2,536,400 Geely Automobile Holdings Ltd 2,263,681 2.36 900,000 Great Wall Motor Co Ltd 876,357 0.92 Cellular Telecom 147,200 China Mobile Ltd 1,781,695 1.86 Commercial Banks Non-US 634,388 China CITIC Bank Corp Ltd 421,360 0.44 3,017,000 China Construction Bank Corp 2,237,353 2.33
2,200,000 Industrial & Commercial Bank of China Ltd 1,376,119 1.44
Diversified Operations 1,538,452 Guangdong Investment Ltd 2,444,478 2.55 E-Commerce/Products 22,300 Alibaba Group Holding Ltd 2,353,765 2.46 Electric Products-Miscellaneous
238,800 Zhuzhou CRRC Times Electric Co Ltd 1,238,089 1.29
Electronic Component-Miscellaneous 112,067 AAC Technologies Holdings Inc 1,126,640 1.18 Energy-Alternate Sources 1,100,000 Xinyi Solar Holdings Ltd 411,417 0.43 Entertainment Software 13,902 NetEase Inc 3,365,118 3.51 Industrial Automat/Robot
34,500 Hollysys Automation Technologies Ltd 800,745 0.83
Internet Application Software 220,730 Tencent Holdings Ltd 6,063,625 6.33 Investment Management/Advisory Service 23,600 Noah Holdings Ltd 620,208 0.65 Medical Products
300,000 China Medical System Holdings Ltd 504,534 0.53
Medical-Wholesale Drug Distribution 495,700 Sinopharm Group Co Ltd 2,381,423 2.48 Petrochemicals
860,000 Sinopec Shanghai Petrochemical Co Ltd 433,677 0.45
Photo Equipment & Supplies
211,800 Sunny Optical Technology Group Co Ltd 1,046,203 1.09
Property/Casualty Insurance 591,600 PICC Property & Casualty Co Ltd 979,681 1.02 Public Thoroughfares 408,300 Zhejiang Expressway Co Ltd 430,749 0.45 Real Estate Operation/Development
395,601 China Overseas Land & Investment Ltd 1,341,852 1.40
350,200 China Vanke Co Ltd 907,828 0.95 Retail-Apparel/Shoe 342,600 ANTA Sports Products Ltd 930,103 0.97
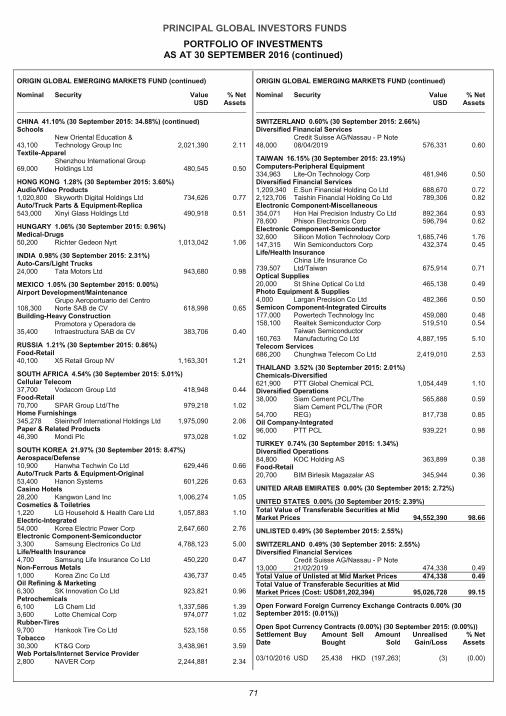
PRINCIPAL GLOBAL INVESTORS FUNDS
PORTFOLIO OF INVESTMENTS AS AT 30 SEPTEMBER 2016 (continued)
71
ORIGIN GLOBAL EMERGING MARKETS FUND (continued)
Nominal Security Value USD
% Net Assets
CHINA 41.10% (30 September 2015: 34.88%) (continued) Schools
43,100 New Oriental Education & Technology Group Inc 2,021,390 2.11
Textile-Apparel
69,000 Shenzhou International Group Holdings Ltd 480,545 0.50
HONG KONG 1.28% (30 September 2015: 3.60%) Audio/Video Products 1,020,800 Skyworth Digital Holdings Ltd 734,626 0.77 Auto/Truck Parts & Equipment-Replica 543,000 Xinyi Glass Holdings Ltd 490,918 0.51
HUNGARY 1.06% (30 September 2015: 0.96%) Medical-Drugs 50,200 Richter Gedeon Nyrt 1,013,042 1.06
INDIA 0.98% (30 September 2015: 2.31%) Auto-Cars/Light Trucks 24,000 Tata Motors Ltd 943,680 0.98
MEXICO 1.05% (30 September 2015: 0.00%) Airport Development/Maintenance
108,300 Grupo Aeroportuario del Centro Norte SAB de CV 618,998 0.65
Building-Heavy Construction
35,400 Promotora y Operadora de Infraestructura SAB de CV 383,706 0.40
RUSSIA 1.21% (30 September 2015: 0.86%) Food-Retail 40,100 X5 Retail Group NV 1,163,301 1.21
SOUTH AFRICA 4.54% (30 September 2015: 5.01%) Cellular Telecom 37,700 Vodacom Group Ltd 418,948 0.44 Food-Retail 70,700 SPAR Group Ltd/The 979,218 1.02 Home Furnishings 345,278 Steinhoff International Holdings Ltd 1,975,090 2.06 Paper & Related Products 46,390 Mondi Plc 973,028 1.02
SOUTH KOREA 21.97% (30 September 2015: 8.47%) Aerospace/Defense 10,900 Hanwha Techwin Co Ltd 629,446 0.66 Auto/Truck Parts & Equipment-Original 53,400 Hanon Systems 601,226 0.63 Casino Hotels 28,200 Kangwon Land Inc 1,006,274 1.05 Cosmetics & Toiletries 1,220 LG Household & Health Care Ltd 1,057,883 1.10 Electric-Integrated 54,000 Korea Electric Power Corp 2,647,660 2.76 Electronic Component-Semiconductor 3,300 Samsung Electronics Co Ltd 4,788,123 5.00 Life/Health Insurance 4,700 Samsung Life Insurance Co Ltd 450,220 0.47 Non-Ferrous Metals 1,000 Korea Zinc Co Ltd 436,737 0.45 Oil Refining & Marketing 6,300 SK Innovation Co Ltd 923,821 0.96 Petrochemicals 6,100 LG Chem Ltd 1,337,586 1.39 3,600 Lotte Chemical Corp 974,077 1.02 Rubber-Tires 9,700 Hankook Tire Co Ltd 523,158 0.55 Tobacco 30,300 KT&G Corp 3,438,961 3.59 Web Portals/Internet Service Provider 2,800 NAVER Corp 2,244,881 2.34
ORIGIN GLOBAL EMERGING MARKETS FUND (continued)
Nominal Security Value USD
% Net Assets
SWITZERLAND 0.60% (30 September 2015: 2.66%) Diversified Financial Services
48,000 Credit Suisse AG/Nassau - P Note 08/04/2019 576,331 0.60
TAIWAN 16.15% (30 September 2015: 23.19%) Computers-Peripheral Equipment 334,963 Lite-On Technology Corp 481,946 0.50 Diversified Financial Services 1,209,340 E.Sun Financial Holding Co Ltd 688,670 0.72 2,123,706 Taishin Financial Holding Co Ltd 789,306 0.82 Electronic Component-Miscellaneous 354,071 Hon Hai Precision Industry Co Ltd 892,364 0.93 78,600 Phison Electronics Corp 596,794 0.62 Electronic Component-Semiconductor 32,600 Silicon Motion Technology Corp 1,685,746 1.76 147,315 Win Semiconductors Corp 432,374 0.45 Life/Health Insurance
739,507 China Life Insurance Co Ltd/Taiwan 675,914 0.71
Optical Supplies 20,000 St Shine Optical Co Ltd 465,138 0.49 Photo Equipment & Supplies 4,000 Largan Precision Co Ltd 482,366 0.50 Semicon Component-Integrated Circuits 177,000 Powertech Technology Inc 459,080 0.48 158,100 Realtek Semiconductor Corp 519,510 0.54
160,763 Taiwan Semiconductor Manufacturing Co Ltd 4,887,195 5.10
Telecom Services 686,200 Chunghwa Telecom Co Ltd 2,419,010 2.53
THAILAND 3.52% (30 September 2015: 2.01%) Chemicals-Diversified 621,900 PTT Global Chemical PCL 1,054,449 1.10 Diversified Operations 38,000 Siam Cement PCL/The 565,888 0.59
54,700 Siam Cement PCL/The (FOR REG) 817,738 0.85
Oil Company-Integrated 96,000 PTT PCL 939,221 0.98
TURKEY 0.74% (30 September 2015: 1.34%) Diversified Operations 84,800 KOC Holding AS 363,899 0.38 Food-Retail 20,700 BIM Birlesik Magazalar AS 345,944 0.36
UNITED ARAB EMIRATES 0.00% (30 September 2015: 2.72%)
UNITED STATES 0.00% (30 September 2015: 2.39%) Total Value of Transferable Securities at Mid Market Prices 94,552,390 98.66
UNLISTED 0.49% (30 September 2015: 2.55%)
SWITZERLAND 0.49% (30 September 2015: 2.55%) Diversified Financial Services
13,000 Credit Suisse AG/Nassau - P Note 21/02/2019 474,338 0.49
Total Value of Unlisted at Mid Market Prices 474,338 0.49 Total Value of Transferable Securities at Mid Market Prices (Cost: USD81,202,394) 95,026,728 99.15
Open Forward Foreign Currency Exchange Contracts 0.00% (30 September 2015: (0.01%))
Open Spot Currency Contracts (0.00%) (30 September 2015: (0.00%)) Settlement Buy Amount Sell Amount Unrealised % Net Date Bought Sold Gain/Loss Assets
03/10/2016 USD 25,438 HKD (197,263) (3) (0.00)
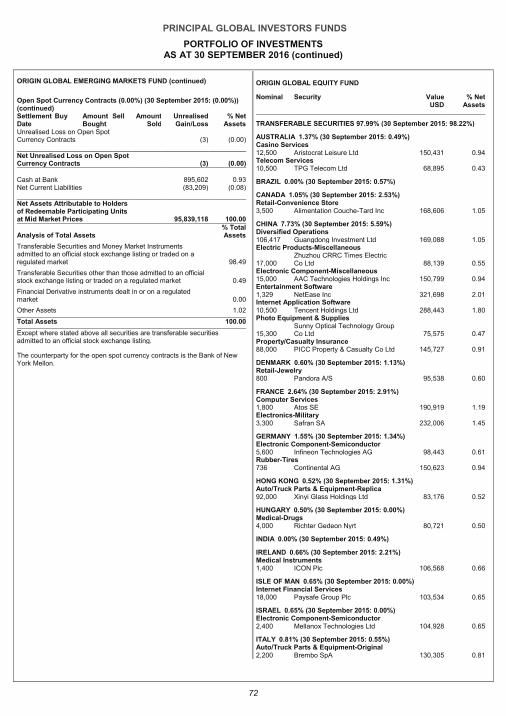
PRINCIPAL GLOBAL INVESTORS FUNDS
PORTFOLIO OF INVESTMENTS AS AT 30 SEPTEMBER 2016 (continued)
72
ORIGIN GLOBAL EMERGING MARKETS FUND (continued)
Open Spot Currency Contracts (0.00%) (30 September 2015: (0.00%)) (continued) Settlement Buy Amount Sell Amount Unrealised % Net Date Bought Sold Gain/Loss Assets Unrealised Loss on Open Spot Currency Contracts (3) (0.00) Net Unrealised Loss on Open Spot Currency Contracts (3) (0 .00)
Cash at Bank 895,602 0.93 Net Current Liabilities (83,209) (0.08) Net Assets Attributable to Holders of Redeemable Participating Units at Mid Market Prices 95,839,118 100.00
Analysis of Total Assets % Total Assets
Transferable Securities and Money Market Instruments admitted to an official stock exchange listing or traded on a regulated market 98.49
Transferable Securities other than those admitted to an official stock exchange listing or traded on a regulated market 0.49
Financial Derivative instruments dealt in or on a regulated market 0.00
Other Assets 1.02
Total Assets 100.00
Except where stated above all securities are transferable securities admitted to an official stock exchange listing.
The counterparty for the open spot currency contracts is the Bank of New York Mellon.
ORIGIN GLOBAL EQUITY FUND
Nominal Security Value USD
% Net Assets
TRANSFERABLE SECURITIES 97.99% (30 September 2015: 98.22%)
AUSTRALIA 1.37% (30 September 2015: 0.49%) Casino Services 12,500 Aristocrat Leisure Ltd 150,431 0.94 Telecom Services 10,500 TPG Telecom Ltd 68,895 0.43
BRAZIL 0.00% (30 September 2015: 0.57%)
CANADA 1.05% (30 September 2015: 2.53%) Retail-Convenience Store 3,500 Alimentation Couche-Tard Inc 168,606 1.05
CHINA 7.73% (30 September 2015: 5.59%) Diversified Operations 106,417 Guangdong Investment Ltd 169,088 1.05 Electric Products-Miscellaneous
17,000 Zhuzhou CRRC Times Electric Co Ltd 88,139 0.55
Electronic Component-Miscellaneous 15,000 AAC Technologies Holdings Inc 150,799 0.94 Entertainment Software 1,329 NetEase Inc 321,698 2.01 Internet Application Software 10,500 Tencent Holdings Ltd 288,443 1.80 Photo Equipment & Supplies
15,300 Sunny Optical Technology Group Co Ltd 75,575 0.47
Property/Casualty Insurance 88,000 PICC Property & Casualty Co Ltd 145,727 0.91
DENMARK 0.60% (30 September 2015: 1.13%) Retail-Jewelry 800 Pandora A/S 95,538 0.60
FRANCE 2.64% (30 September 2015: 2.91%) Computer Services 1,800 Atos SE 190,919 1.19 Electronics-Military 3,300 Safran SA 232,006 1.45
GERMANY 1.55% (30 September 2015: 1.34%) Electronic Component-Semiconductor 5,600 Infineon Technologies AG 98,443 0.61 Rubber-Tires 736 Continental AG 150,623 0.94
HONG KONG 0.52% (30 September 2015: 1.31%) Auto/Truck Parts & Equipment-Replica 92,000 Xinyi Glass Holdings Ltd 83,176 0.52
HUNGARY 0.50% (30 September 2015: 0.00%) Medical-Drugs 4,000 Richter Gedeon Nyrt 80,721 0.50
INDIA 0.00% (30 September 2015: 0.49%)
IRELAND 0.66% (30 September 2015: 2.21%) Medical Instruments 1,400 ICON Plc 106,568 0.66
ISLE OF MAN 0.65% (30 September 2015: 0.00%) Internet Financial Services 18,000 Paysafe Group Plc 103,534 0.65
ISRAEL 0.65% (30 September 2015: 0.00%) Electronic Component-Semiconductor 2,400 Mellanox Technologies Ltd 104,928 0.65
ITALY 0.81% (30 September 2015: 0.55%) Auto/Truck Parts & Equipment-Original 2,200 Brembo SpA 130,305 0.81
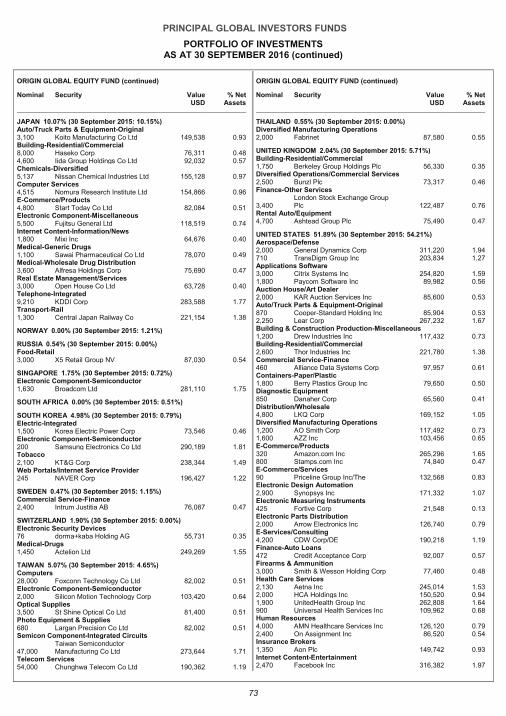
PRINCIPAL GLOBAL INVESTORS FUNDS
PORTFOLIO OF INVESTMENTS AS AT 30 SEPTEMBER 2016 (continued)
73
ORIGIN GLOBAL EQUITY FUND (continued)
Nominal Security Value USD
% Net Assets
JAPAN 10.07% (30 September 2015: 10.15%) Auto/Truck Parts & Equipment-Original 3,100 Koito Manufacturing Co Ltd 149,538 0.93 Building-Residential/Commercial 8,000 Haseko Corp 76,311 0.48 4,600 Iida Group Holdings Co Ltd 92,032 0.57 Chemicals-Diversified 5,137 Nissan Chemical Industries Ltd 155,128 0.97 Computer Services 4,515 Nomura Research Institute Ltd 154,866 0.96 E-Commerce/Products 4,800 Start Today Co Ltd 82,084 0.51 Electronic Component-Miscellaneous 5,500 Fujitsu General Ltd 118,519 0.74 Internet Content-Information/News 1,800 Mixi Inc 64,676 0.40 Medical-Generic Drugs 1,100 Sawai Pharmaceutical Co Ltd 78,070 0.49 Medical-Wholesale Drug Distribution 3,600 Alfresa Holdings Corp 75,690 0.47 Real Estate Management/Services 3,000 Open House Co Ltd 63,728 0.40 Telephone-Integrated 9,210 KDDI Corp 283,588 1.77 Transport-Rail 1,300 Central Japan Railway Co 221,154 1.38
NORWAY 0.00% (30 September 2015: 1.21%)
RUSSIA 0.54% (30 September 2015: 0.00%) Food-Retail 3,000 X5 Retail Group NV 87,030 0.54
SINGAPORE 1.75% (30 September 2015: 0.72%) Electronic Component-Semiconductor 1,630 Broadcom Ltd 281,110 1.75
SOUTH AFRICA 0.00% (30 September 2015: 0.51%)
SOUTH KOREA 4.98% (30 September 2015: 0.79%) Electric-Integrated 1,500 Korea Electric Power Corp 73,546 0.46 Electronic Component-Semiconductor 200 Samsung Electronics Co Ltd 290,189 1.81 Tobacco 2,100 KT&G Corp 238,344 1.49 Web Portals/Internet Service Provider 245 NAVER Corp 196,427 1.22
SWEDEN 0.47% (30 September 2015: 1.15%) Commercial Service-Finance 2,400 Intrum Justitia AB 76,087 0.47
SWITZERLAND 1.90% (30 September 2015: 0.00%) Electronic Security Devices 76 dorma+kaba Holding AG 55,731 0.35 Medical-Drugs 1,450 Actelion Ltd 249,269 1.55
TAIWAN 5.07% (30 September 2015: 4.65%) Computers 28,000 Foxconn Technology Co Ltd 82,002 0.51 Electronic Component-Semiconductor 2,000 Silicon Motion Technology Corp 103,420 0.64 Optical Supplies 3,500 St Shine Optical Co Ltd 81,400 0.51 Photo Equipment & Supplies 680 Largan Precision Co Ltd 82,002 0.51 Semicon Component-Integrated Circuits
47,000 Taiwan Semiconductor Manufacturing Co Ltd 273,644 1.71
Telecom Services 54,000 Chunghwa Telecom Co Ltd 190,362 1.19
ORIGIN GLOBAL EQUITY FUND (continued)
Nominal Security Value USD
% Net Assets
THAILAND 0.55% (30 September 2015: 0.00%) Diversified Manufacturing Operations 2,000 Fabrinet 87,580 0.55
UNITED KINGDOM 2.04% (30 September 2015: 5.71%) Building-Residential/Commercial 1,750 Berkeley Group Holdings Plc 56,330 0.35 Diversified Operations/Commercial Services 2,500 Bunzl Plc 73,317 0.46 Finance-Other Services
3,400 London Stock Exchange Group Plc 122,487 0.76
Rental Auto/Equipment 4,700 Ashtead Group Plc 75,490 0.47
UNITED STATES 51.89% (30 September 2015: 54.21%) Aerospace/Defense 2,000 General Dynamics Corp 311,220 1.94 710 TransDigm Group Inc 203,834 1.27 Applications Software 3,000 Citrix Systems Inc 254,820 1.59 1,800 Paycom Software Inc 89,982 0.56 Auction House/Art Dealer 2,000 KAR Auction Services Inc 85,600 0.53 Auto/Truck Parts & Equipment-Original 870 Cooper-Standard Holding Inc 85,904 0.53 2,250 Lear Corp 267,232 1.67 Building & Construction Production-Miscellaneous 1,200 Drew Industries Inc 117,432 0.73 Building-Residential/Commercial 2,600 Thor Industries Inc 221,780 1.38 Commercial Service-Finance 460 Alliance Data Systems Corp 97,957 0.61 Containers-Paper/Plastic 1,800 Berry Plastics Group Inc 79,650 0.50 Diagnostic Equipment 850 Danaher Corp 65,560 0.41 Distribution/Wholesale 4,800 LKQ Corp 169,152 1.05 Diversified Manufacturing Operations 1,200 AO Smith Corp 117,492 0.73 1,600 AZZ Inc 103,456 0.65 E-Commerce/Products 320 Amazon.com Inc 265,296 1.65 800 Stamps.com Inc 74,840 0.47 E-Commerce/Services 90 Priceline Group Inc/The 132,568 0.83 Electronic Design Automation 2,900 Synopsys Inc 171,332 1.07 Electronic Measuring Instruments 425 Fortive Corp 21,548 0.13 Electronic Parts Distribution 2,000 Arrow Electronics Inc 126,740 0.79 E-Services/Consulting 4,200 CDW Corp/DE 190,218 1.19 Finance-Auto Loans 472 Credit Acceptance Corp 92,007 0.57 Firearms & Ammunition 3,000 Smith & Wesson Holding Corp 77,460 0.48 Health Care Services 2,130 Aetna Inc 245,014 1.53 2,000 HCA Holdings Inc 150,520 0.94 1,900 UnitedHealth Group Inc 262,808 1.64 900 Universal Health Services Inc 109,962 0.68 Human Resources 4,000 AMN Healthcare Services Inc 126,120 0.79 2,400 On Assignment Inc 86,520 0.54 Insurance Brokers 1,350 Aon Plc 149,742 0.93 Internet Content-Entertainment 2,470 Facebook Inc 316,382 1.97
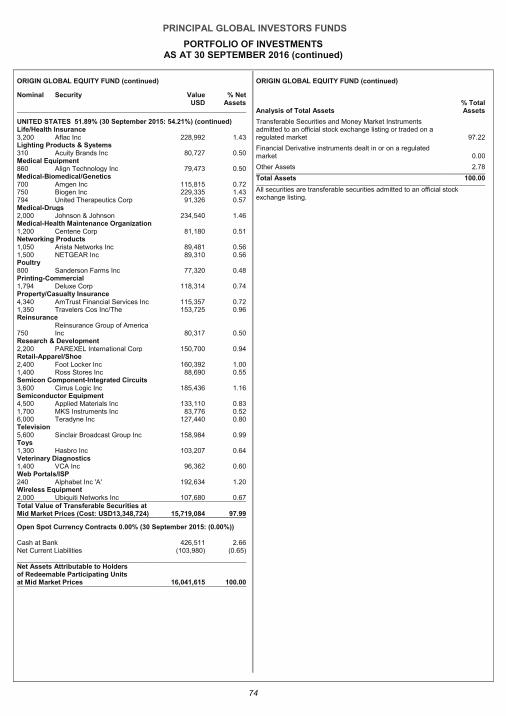
PRINCIPAL GLOBAL INVESTORS FUNDS
PORTFOLIO OF INVESTMENTS AS AT 30 SEPTEMBER 2016 (continued)
74
ORIGIN GLOBAL EQUITY FUND (continued)
Nominal Security Value USD
% Net Assets
UNITED STATES 51.89% (30 September 2015: 54.21%) (continued) Life/Health Insurance 3,200 Aflac Inc 228,992 1.43 Lighting Products & Systems 310 Acuity Brands Inc 80,727 0.50 Medical Equipment 860 Align Technology Inc 79,473 0.50 Medical-Biomedical/Genetics 700 Amgen Inc 115,815 0.72 750 Biogen Inc 229,335 1.43 794 United Therapeutics Corp 91,326 0.57 Medical-Drugs 2,000 Johnson & Johnson 234,540 1.46 Medical-Health Maintenance Organization 1,200 Centene Corp 81,180 0.51 Networking Products 1,050 Arista Networks Inc 89,481 0.56 1,500 NETGEAR Inc 89,310 0.56 Poultry 800 Sanderson Farms Inc 77,320 0.48 Printing-Commercial 1,794 Deluxe Corp 118,314 0.74 Property/Casualty Insurance 4,340 AmTrust Financial Services Inc 115,357 0.72 1,350 Travelers Cos Inc/The 153,725 0.96 Reinsurance
750 Reinsurance Group of America Inc 80,317 0.50
Research & Development 2,200 PAREXEL International Corp 150,700 0.94 Retail-Apparel/Shoe 2,400 Foot Locker Inc 160,392 1.00 1,400 Ross Stores Inc 88,690 0.55 Semicon Component-Integrated Circuits 3,600 Cirrus Logic Inc 185,436 1.16 Semiconductor Equipment 4,500 Applied Materials Inc 133,110 0.83 1,700 MKS Instruments Inc 83,776 0.52 6,000 Teradyne Inc 127,440 0.80 Television 5,600 Sinclair Broadcast Group Inc 158,984 0.99 Toys 1,300 Hasbro Inc 103,207 0.64 Veterinary Diagnostics 1,400 VCA Inc 96,362 0.60 Web Portals/ISP 240 Alphabet Inc 'A' 192,634 1.20 Wireless Equipment 2,000 Ubiquiti Networks Inc 107,680 0.67 Total Value of Transferable Securities at Mid Market Prices (Cost: USD13,348,724) 15,719,084 97.99
Open Spot Currency Contracts 0.00% (30 September 2015: (0.00%)) Cash at Bank 426,511 2.66 Net Current Liabilities (103,980) (0.65) Net Assets Attributable to Holders of Redeemable Participating Units at Mid Market Prices 16,041,615 100.00
ORIGIN GLOBAL EQUITY FUND (continued)
Analysis of Total Assets % Total Assets
Transferable Securities and Money Market Instruments admitted to an official stock exchange listing or traded on a regulated market 97.22
Financial Derivative instruments dealt in or on a regulated market 0.00
Other Assets 2.78
Total Assets 100.00
All securities are transferable securities admitted to an official stock exchange listing.
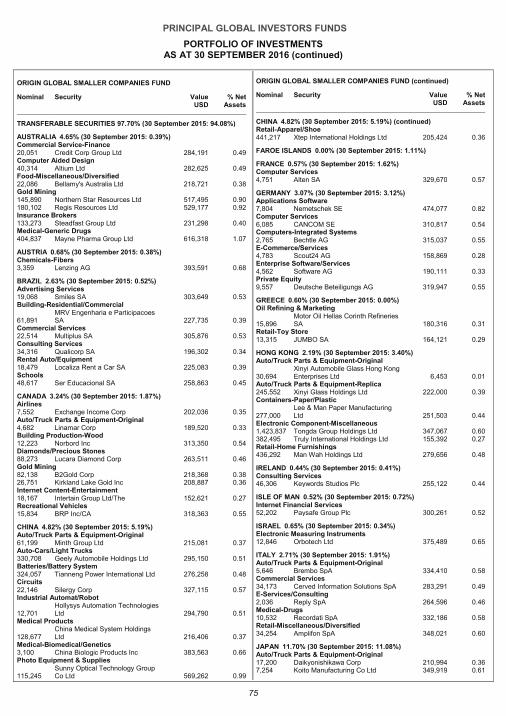
PRINCIPAL GLOBAL INVESTORS FUNDS
PORTFOLIO OF INVESTMENTS AS AT 30 SEPTEMBER 2016 (continued)
75
ORIGIN GLOBAL SMALLER COMPANIES FUND
Nominal Security Value USD
% Net Assets
TRANSFERABLE SECURITIES 97.70% (30 September 2015: 94.08%)
AUSTRALIA 4.65% (30 September 2015: 0.39%) Commercial Service-Finance 20,051 Credit Corp Group Ltd 284,191 0.49 Computer Aided Design 40,314 Altium Ltd 282,625 0.49 Food-Miscellaneous/Diversified 22,086 Bellamy's Australia Ltd 218,721 0.38 Gold Mining 145,890 Northern Star Resources Ltd 517,495 0.90 180,102 Regis Resources Ltd 529,177 0.92 Insurance Brokers 133,273 Steadfast Group Ltd 231,298 0.40 Medical-Generic Drugs 404,837 Mayne Pharma Group Ltd 616,318 1.07
AUSTRIA 0.68% (30 September 2015: 0.38%) Chemicals-Fibers 3,359 Lenzing AG 393,591 0.68
BRAZIL 2.63% (30 September 2015: 0.52%) Advertising Services 19,068 Smiles SA 303,649 0.53 Building-Residential/Commercial
61,891 MRV Engenharia e Participacoes SA 227,735 0.39
Commercial Services 22,514 Multiplus SA 305,876 0.53 Consulting Services 34,316 Qualicorp SA 196,302 0.34 Rental Auto/Equipment 18,479 Localiza Rent a Car SA 225,083 0.39 Schools 48,617 Ser Educacional SA 258,863 0.45
CANADA 3.24% (30 September 2015: 1.87%) Airlines 7,552 Exchange Income Corp 202,036 0.35 Auto/Truck Parts & Equipment-Original 4,682 Linamar Corp 189,520 0.33 Building Production-Wood 12,223 Norbord Inc 313,350 0.54 Diamonds/Precious Stones 88,273 Lucara Diamond Corp 263,511 0.46 Gold Mining 82,138 B2Gold Corp 218,368 0.38 26,751 Kirkland Lake Gold Inc 208,887 0.36 Internet Content-Entertainment 18,167 Intertain Group Ltd/The 152,621 0.27 Recreational Vehicles 15,834 BRP Inc/CA 318,363 0.55
CHINA 4.82% (30 September 2015: 5.19%) Auto/Truck Parts & Equipment-Original 61,199 Minth Group Ltd 215,081 0.37 Auto-Cars/Light Trucks 330,708 Geely Automobile Holdings Ltd 295,150 0.51 Batteries/Battery System 324,057 Tianneng Power International Ltd 276,258 0.48 Circuits 22,146 Silergy Corp 327,115 0.57 Industrial Automat/Robot
12,701 Hollysys Automation Technologies Ltd 294,790 0.51
Medical Products
128,677 China Medical System Holdings Ltd 216,406 0.37
Medical-Biomedical/Genetics 3,100 China Biologic Products Inc 383,563 0.66 Photo Equipment & Supplies
115,245 Sunny Optical Technology Group Co Ltd 569,262 0.99
ORIGIN GLOBAL SMALLER COMPANIES FUND (continued)
Nominal Security Value USD
% Net Assets
CHINA 4.82% (30 September 2015: 5.19%) (continued) Retail-Apparel/Shoe 441,217 Xtep International Holdings Ltd 205,424 0.36
FAROE ISLANDS 0.00% (30 September 2015: 1.11%)
FRANCE 0.57% (30 September 2015: 1.62%) Computer Services 4,751 Alten SA 329,670 0.57
GERMANY 3.07% (30 September 2015: 3.12%) Applications Software 7,804 Nemetschek SE 474,077 0.82 Computer Services 6,085 CANCOM SE 310,817 0.54 Computers-Integrated Systems 2,765 Bechtle AG 315,037 0.55 E-Commerce/Services 4,783 Scout24 AG 158,869 0.28 Enterprise Software/Services 4,562 Software AG 190,111 0.33 Private Equity 9,557 Deutsche Beteiligungs AG 319,947 0.55
GREECE 0.60% (30 September 2015: 0.00%) Oil Refining & Marketing
15,896 Motor Oil Hellas Corinth Refineries SA 180,316 0.31
Retail-Toy Store 13,315 JUMBO SA 164,121 0.29
HONG KONG 2.19% (30 September 2015: 3.40%) Auto/Truck Parts & Equipment-Original
30,694 Xinyi Automobile Glass Hong Kong Enterprises Ltd 6,453 0.01
Auto/Truck Parts & Equipment-Replica 245,552 Xinyi Glass Holdings Ltd 222,000 0.39 Containers-Paper/Plastic
277,000 Lee & Man Paper Manufacturing Ltd 251,503 0.44
Electronic Component-Miscellaneous 1,423,837 Tongda Group Holdings Ltd 347,067 0.60 382,495 Truly International Holdings Ltd 155,392 0.27 Retail-Home Furnishings 436,292 Man Wah Holdings Ltd 279,656 0.48
IRELAND 0.44% (30 September 2015: 0.41%) Consulting Services 46,306 Keywords Studios Plc 255,122 0.44
ISLE OF MAN 0.52% (30 September 2015: 0.72%) Internet Financial Services 52,202 Paysafe Group Plc 300,261 0.52
ISRAEL 0.65% (30 September 2015: 0.34%) Electronic Measuring Instruments 12,846 Orbotech Ltd 375,489 0.65
ITALY 2.71% (30 September 2015: 1.91%) Auto/Truck Parts & Equipment-Original 5,646 Brembo SpA 334,410 0.58 Commercial Services 34,173 Cerved Information Solutions SpA 283,291 0.49 E-Services/Consulting 2,036 Reply SpA 264,596 0.46 Medical-Drugs 10,532 Recordati SpA 332,186 0.58 Retail-Miscellaneous/Diversified 34,254 Amplifon SpA 348,021 0.60
JAPAN 11.70% (30 September 2015: 11.08%) Auto/Truck Parts & Equipment-Original 17,200 Daikyonishikawa Corp 210,994 0.36 7,254 Koito Manufacturing Co Ltd 349,919 0.61

PRINCIPAL GLOBAL INVESTORS FUNDS
PORTFOLIO OF INVESTMENTS AS AT 30 SEPTEMBER 2016 (continued)
76
ORIGIN GLOBAL SMALLER COMPANIES FUND (continued)
Nominal Security Value USD
% Net Assets
JAPAN 11.70% (30 September 2015: 11.08%) (continued) Building & Construction Production-Miscellaneous 5,900 Totetsu Kogyo Co Ltd 168,546 0.29 Building-Heavy Construction 16,800 Raito Kogyo Co Ltd 201,105 0.35 Computers-Integrated Systems 11,135 DTS Corp 246,552 0.43 E-Commerce/Services 7,609 Dip Corp 234,667 0.41 13,400 Gurunavi Inc 366,508 0.63 Electronic Component-Miscellaneous 19,649 Fujitsu General Ltd 423,415 0.74 Electronic Measuring Instruments 11,550 Tokyo Seimitsu Co Ltd 306,089 0.53 Electronic Parts Distribution 10,506 Siix Corp 422,151 0.73 E-Marketing/Information 8,000 CyberAgent Inc 236,604 0.41 Entertainment Software 16,755 Koei Tecmo Holdings Co Ltd 329,585 0.57 Health Care Services 8,600 BML Inc 225,531 0.39 Human Resources 17,500 JAC Recruitment Co Ltd 209,484 0.37 Internet Application Software 8,695 COLOPL Inc 134,510 0.24 Internet Content-Entertainment 17,753 Nexon Co Ltd 276,390 0.48 Internet Content-Information/News 4,528 Mixi Inc 162,697 0.28 Medical Laboratries & Testing Services 2,660 Ain Holdings Inc 180,375 0.31 Medical-Generic Drugs 2,534 Sawai Pharmaceutical Co Ltd 179,846 0.31 Medical-Wholesale Drug Distribution 8,658 Alfresa Holdings Corp 182,035 0.32 Real Estate Management/Services 6,883 Open House Co Ltd 146,212 0.25 3,140 Relo Group Inc 520,514 0.90 18,200 Sun Frontier Fudousan Co Ltd 182,603 0.32 Real Estate Operation/Development 28,293 Leopalace21 Corp 185,702 0.32 Toys 11,770 Bandai Namco Holdings Inc 357,760 0.62 Transport-Truck 4,906 Trancom Co Ltd 307,458 0.53
JERSEY 0.38% (30 September 2015: 0.00%) Gold Mining 112,951 Centamin Plc 221,100 0.38
LUXEMBOURG 0.37% (30 September 2015: 0.36%) Machinery-General Industry 3,803 Stabilus SA 211,068 0.37
MALAYSIA 0.96% (30 September 2015: 0.38%) E-Commerce/Services 599,388 My EG Services Bhd 330,457 0.58 Retail-Apparel/Shoe 319,700 Padini Holdings Bhd 220,323 0.38
NETHERLANDS 0.54% (30 September 2015: 0.79%) Chemicals-Specialty 7,240 IMCD Group NV 312,219 0.54
NORWAY 0.73% (30 September 2015: 0.45%) Fisheries 3,797 Leroy Seafood Group ASA 189,036 0.33 7,739 Salmar ASA 233,000 0.40
ORIGIN GLOBAL SMALLER COMPANIES FUND (continued)
Nominal Security Value USD
% Net Assets
POLAND 0.00% (30 September 2015: 0.45%)
SOUTH AFRICA 0.65% (30 September 2015: 0.00%) Finance-Other Services 16,075 JSE Ltd 185,158 0.32 Transport-Services 62,032 Super Group Ltd/South Africa 191,144 0.33
SOUTH KOREA 5.89% (30 September 2015: 5.48%) Advanced Materials/Prd 1,695 SK Materials Co Ltd 242,550 0.42 Chemicals-Diversified 837 Korea Petrochemical Ind Co Ltd 162,255 0.28 Chemicals-Specialty 7,901 Soulbrain Co Ltd 436,892 0.76 Electronic Component-Semiconductor 6,052 Silicon Works Co Ltd 164,028 0.28 Electronic Connectors 3,326 Korea Electric Terminal Co Ltd 234,347 0.41 Internet Content-Entertainment 1,631 Com2uSCorp 148,091 0.26 Medical-Drugs 5,830 Boryung Pharmaceutical Co Ltd 363,134 0.63 6,699 Samjin Pharmaceutical Co Ltd 196,162 0.34 Metal Processors & Fabricators
32,969 Dongkuk Structures & Construction Co Ltd 222,717 0.39
Optical Supplies 4,551 Interojo Co Ltd 164,668 0.28 Publishing-Periodicals 13,535 Woongjin Thinkbig Co Ltd 136,413 0.24 Reinsurance 23,160 Korean Reinsurance Co 244,985 0.42 Semicon Component-Integrated Circuits 8,899 Viatron Technologies Inc 225,838 0.39 Semiconductor Equipment 29,308 KC Tech Co Ltd 456,378 0.79
SWEDEN 0.00% (30 September 2015: 0.62%)
SWITZERLAND 1.54% (30 September 2015: 2.37%) Electronic Security Devices 258 dorma+kaba Holding AG 189,194 0.33 Machinery-General Industry 750 Komax Holding AG 182,968 0.32 Wireless Equipment 2,462 u-blox Holding AG 516,985 0.89
TAIWAN 10.18% (30 September 2015: 6.99%) Auto/Truck Parts & Equipment-Original 61,055 Hiroca Holdings Ltd 235,685 0.41 Auto/Truck Parts & Equipment-Replica 54,783 Macauto Industrial Co Ltd 361,777 0.63 Beverages-Non-Alcoholic 41,050 Grape King Bio Ltd 340,495 0.59 Circuit Boards 88,994 Chin-Poon Industrial Co Ltd 198,171 0.34 Computers 47,251 Flytech Technology Co Ltd 163,556 0.28 Computers-Integrated Systems 52,650 Posiflex Technology Inc 321,656 0.56 131,981 Primax Electronics Ltd 193,474 0.33 Computers-Peripheral Equipment 14,621 Ennoconn Corp 243,952 0.42 132,589 Lite-On Technology Corp 190,769 0.33 Disposable Medical Products 49,615 Pacific Hospital Supply Co Ltd 158,126 0.27 Electronic Component-Miscellaneous 136,809 Elite Material Co Ltd 373,169 0.65 20,529 Phison Electronics Corp 155,872 0.27 Electronic Component-Semiconductor 99,448 Visual Photonics Epitaxy Co Ltd 140,072 0.24 114,632 Win Semiconductors Corp 336,448 0.59
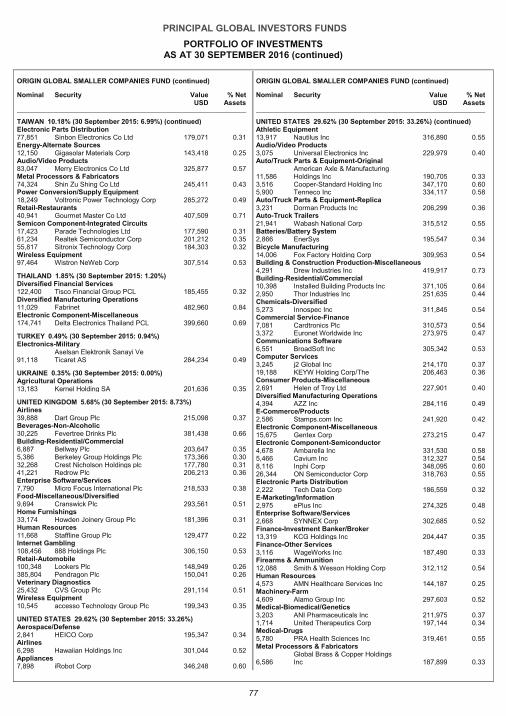
PRINCIPAL GLOBAL INVESTORS FUNDS
PORTFOLIO OF INVESTMENTS AS AT 30 SEPTEMBER 2016 (continued)
77
ORIGIN GLOBAL SMALLER COMPANIES FUND (continued)
Nominal Security Value USD
% Net Assets
TAIWAN 10.18% (30 September 2015: 6.99%) (continued) Electronic Parts Distribution 77,851 Sinbon Electronics Co Ltd 179,071 0.31 Energy-Alternate Sources 12,150 Gigasolar Materials Corp 143,418 0.25 Audio/Video Products 83,047 Merry Electronics Co Ltd 325,877 0.57 Metal Processors & Fabricators 74,324 Shin Zu Shing Co Ltd 245,411 0.43 Power Conversion/Supply Equipment 18,249 Voltronic Power Technology Corp 285,272 0.49 Retail-Restaurants 40,941 Gourmet Master Co Ltd 407,509 0.71 Semicon Component-Integrated Circuits 17,423 Parade Technologies Ltd 177,590 0.31 61,234 Realtek Semiconductor Corp 201,212 0.35 55,817 Sitronix Technology Corp 184,303 0.32 Wireless Equipment 97,464 Wistron NeWeb Corp 307,514 0.53
THAILAND 1.85% (30 September 2015: 1.20%) Diversified Financial Services 122,400 Tisco Financial Group PCL 185,455 0.32 Diversified Manufacturing Operations 11,029 Fabrinet 482,960 0.84 Electronic Component-Miscellaneous 174,741 Delta Electronics Thailand PCL 399,660 0.69
TURKEY 0.49% (30 September 2015: 0.94%) Electronics-Military
91,118 Aselsan Elektronik Sanayi Ve Ticaret AS 284,234 0.49
UKRAINE 0.35% (30 September 2015: 0.00%) Agricultural Operations 13,183 Kernel Holding SA 201,636 0.35
UNITED KINGDOM 5.68% (30 September 2015: 8.73%) Airlines 39,888 Dart Group Plc 215,098 0.37 Beverages-Non-Alcoholic 30,225 Fevertree Drinks Plc 381,438 0.66 Building-Residential/Commercial 6,887 Bellway Plc 203,647 0.35 5,386 Berkeley Group Holdings Plc 173,366 0.30 32,268 Crest Nicholson Holdings plc 177,780 0.31 41,221 Redrow Plc 206,213 0.36 Enterprise Software/Services 7,790 Micro Focus International Plc 218,533 0.38 Food-Miscellaneous/Diversified 9,694 Cranswick Plc 293,561 0.51 Home Furnishings 33,174 Howden Joinery Group Plc 181,396 0.31 Human Resources 11,668 Staffline Group Plc 129,477 0.22 Internet Gambling 108,456 888 Holdings Plc 306,150 0.53 Retail-Automobile 100,348 Lookers Plc 148,949 0.26 385,804 Pendragon Plc 150,041 0.26 Veterinary Diagnostics 25,432 CVS Group Plc 291,114 0.51 Wireless Equipment 10,545 accesso Technology Group Plc 199,343 0.35
UNITED STATES 29.62% (30 September 2015: 33.26%) Aerospace/Defense 2,841 HEICO Corp 195,347 0.34 Airlines 6,298 Hawaiian Holdings Inc 301,044 0.52 Appliances 7,898 iRobot Corp 346,248 0.60
ORIGIN GLOBAL SMALLER COMPANIES FUND (continued)
Nominal Security Value USD
% Net Assets
UNITED STATES 29.62% (30 September 2015: 33.26%) (continued) Athletic Equipment 13,917 Nautilus Inc 316,890 0.55 Audio/Video Products 3,075 Universal Electronics Inc 229,979 0.40 Auto/Truck Parts & Equipment-Original
11,586 American Axle & Manufacturing Holdings Inc 190,705 0.33
3,516 Cooper-Standard Holding Inc 347,170 0.60 5,900 Tenneco Inc 334,117 0.58 Auto/Truck Parts & Equipment-Replica 3,231 Dorman Products Inc 206,299 0.36 Auto-Truck Trailers 21,941 Wabash National Corp 315,512 0.55 Batteries/Battery System 2,866 EnerSys 195,547 0.34 Bicycle Manufacturing 14,006 Fox Factory Holding Corp 309,953 0.54 Building & Construction Production-Miscellaneous 4,291 Drew Industries Inc 419,917 0.73 Building-Residential/Commercial 10,398 Installed Building Products Inc 371,105 0.64 2,950 Thor Industries Inc 251,635 0.44 Chemicals-Diversified 5,273 Innospec Inc 311,845 0.54 Commercial Service-Finance 7,081 Cardtronics Plc 310,573 0.54 3,372 Euronet Worldwide Inc 273,975 0.47 Communications Software 6,551 BroadSoft Inc 305,342 0.53 Computer Services 3,245 j2 Global Inc 214,170 0.37 19,188 KEYW Holding Corp/The 206,463 0.36 Consumer Products-Miscellaneous 2,691 Helen of Troy Ltd 227,901 0.40 Diversified Manufacturing Operations 4,394 AZZ Inc 284,116 0.49 E-Commerce/Products 2,586 Stamps.com Inc 241,920 0.42 Electronic Component-Miscellaneous 15,675 Gentex Corp 273,215 0.47 Electronic Component-Semiconductor 4,678 Ambarella Inc 331,530 0.58 5,466 Cavium Inc 312,327 0.54 8,116 Inphi Corp 348,095 0.60 26,344 ON Semiconductor Corp 318,763 0.55 Electronic Parts Distribution 2,222 Tech Data Corp 186,559 0.32 E-Marketing/Information 2,975 ePlus Inc 274,325 0.48 Enterprise Software/Services 2,668 SYNNEX Corp 302,685 0.52 Finance-Investment Banker/Broker 13,319 KCG Holdings Inc 204,447 0.35 Finance-Other Services 3,116 WageWorks Inc 187,490 0.33 Firearms & Ammunition 12,088 Smith & Wesson Holding Corp 312,112 0.54 Human Resources 4,573 AMN Healthcare Services Inc 144,187 0.25 Machinery-Farm 4,609 Alamo Group Inc 297,603 0.52 Medical-Biomedical/Genetics 3,203 ANI Pharmaceuticals Inc 211,975 0.37 1,714 United Therapeutics Corp 197,144 0.34 Medical-Drugs 5,780 PRA Health Sciences Inc 319,461 0.55 Metal Processors & Fabricators
6,586 Global Brass & Copper Holdings Inc 187,899 0.33
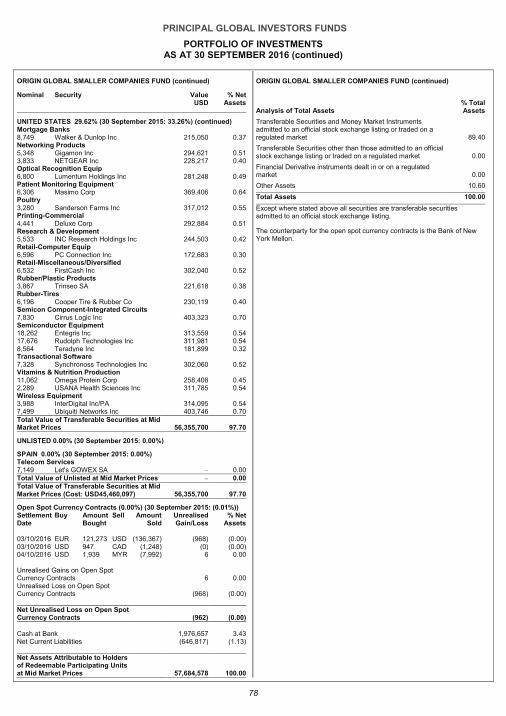
PRINCIPAL GLOBAL INVESTORS FUNDS
PORTFOLIO OF INVESTMENTS AS AT 30 SEPTEMBER 2016 (continued)
78
ORIGIN GLOBAL SMALLER COMPANIES FUND (continued)
Nominal Security Value USD
% Net Assets
UNITED STATES 29.62% (30 September 2015: 33.26%) (continued) Mortgage Banks 8,749 Walker & Dunlop Inc 215,050 0.37 Networking Products 5,348 Gigamon Inc 294,621 0.51 3,833 NETGEAR Inc 228,217 0.40 Optical Recognition Equip 6,800 Lumentum Holdings Inc 281,248 0.49 Patient Monitoring Equipment 6,306 Masimo Corp 369,406 0.64 Poultry 3,280 Sanderson Farms Inc 317,012 0.55 Printing-Commercial 4,441 Deluxe Corp 292,884 0.51 Research & Development 5,533 INC Research Holdings Inc 244,503 0.42 Retail-Computer Equip 6,596 PC Connection Inc 172,683 0.30 Retail-Miscellaneous/Diversified 6,532 FirstCash Inc 302,040 0.52 Rubber/Plastic Products 3,867 Trinseo SA 221,618 0.38 Rubber-Tires 6,196 Cooper Tire & Rubber Co 230,119 0.40 Semicon Component-Integrated Circuits 7,830 Cirrus Logic Inc 403,323 0.70 Semiconductor Equipment 18,262 Entegris Inc 313,559 0.54 17,676 Rudolph Technologies Inc 311,981 0.54 8,564 Teradyne Inc 181,899 0.32 Transactional Software 7,328 Synchronoss Technologies Inc 302,060 0.52 Vitamins & Nutrition Production 11,062 Omega Protein Corp 258,408 0.45 2,289 USANA Health Sciences Inc 311,785 0.54 Wireless Equipment 3,988 InterDigital Inc/PA 314,095 0.54 7,499 Ubiquiti Networks Inc 403,746 0.70 Total Value of Transferable Securities at Mid Market Prices 56,355,700 97.70
UNLISTED 0.00% (30 September 2015: 0.00%)
SPAIN 0.00% (30 September 2015: 0.00%) Telecom Services 7,149 Let's GOWEX SA – 0.00 Total Value of Unlisted at Mid Market Prices – 0.00 Total Value of Transferable Securities at Mid Market Prices (Cost: USD45,460,097) 56,355,700 97.70
Open Spot Currency Contracts (0.00%) (30 September 2015: (0.01%)) Settlement Buy Amount Sell Amount Unrealised % Net Date Bought Sold Gain/Loss Assets
03/10/2016 EUR 121,273 USD (136,367) (968) (0.00) 03/10/2016 USD 947 CAD (1,248) (0) (0.00) 04/10/2016 USD 1,939 MYR (7,992) 6 0.00 Unrealised Gains on Open Spot Currency Contracts 6 0.00 Unrealised Loss on Open Spot Currency Contracts (968) (0.00) Net Unrealised Loss on Open Spot Currency Contracts (962) (0 .00)
Cash at Bank 1,976,657 3.43 Net Current Liabilities (646,817) (1.13) Net Assets Attributable to Holders of Redeemable Participating Units at Mid Market Prices 57,684,578 100.00
ORIGIN GLOBAL SMALLER COMPANIES FUND (continued)
Analysis of Total Assets % Total Assets
Transferable Securities and Money Market Instruments admitted to an official stock exchange listing or traded on a regulated market 89.40
Transferable Securities other than those admitted to an official stock exchange listing or traded on a regulated market 0.00
Financial Derivative instruments dealt in or on a regulated market 0.00
Other Assets 10.60
Total Assets 100.00
Except where stated above all securities are transferable securities admitted to an official stock exchange listing.
The counterparty for the open spot currency contracts is the Bank of New York Mellon.
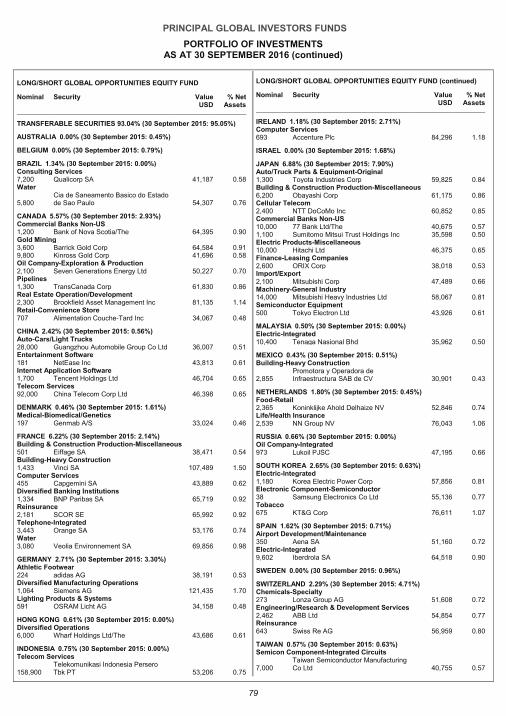
PRINCIPAL GLOBAL INVESTORS FUNDS
PORTFOLIO OF INVESTMENTS AS AT 30 SEPTEMBER 2016 (continued)
79
LONG/SHORT GLOBAL OPPORTUNITIES EQUITY FUND
Nominal Security Value USD
% Net Assets
TRANSFERABLE SECURITIES 93.04% (30 September 2015: 95.05%)
AUSTRALIA 0.00% (30 September 2015: 0.45%)
BELGIUM 0.00% (30 September 2015: 0.79%)
BRAZIL 1.34% (30 September 2015: 0.00%) Consulting Services 7,200 Qualicorp SA 41,187 0.58 Water
5,800 Cia de Saneamento Basico do Estado de Sao Paulo 54,307 0.76
CANADA 5.57% (30 September 2015: 2.93%) Commercial Banks Non-US 1,200 Bank of Nova Scotia/The 64,395 0.90 Gold Mining 3,600 Barrick Gold Corp 64,584 0.91 9,800 Kinross Gold Corp 41,696 0.58 Oil Company-Exploration & Production 2,100 Seven Generations Energy Ltd 50,227 0.70 Pipelines 1,300 TransCanada Corp 61,830 0.86 Real Estate Operation/Development 2,300 Brookfield Asset Management Inc 81,135 1.14 Retail-Convenience Store 707 Alimentation Couche-Tard Inc 34,067 0.48
CHINA 2.42% (30 September 2015: 0.56%) Auto-Cars/Light Trucks 28,000 Guangzhou Automobile Group Co Ltd 36,007 0.51 Entertainment Software 181 NetEase Inc 43,813 0.61 Internet Application Software 1,700 Tencent Holdings Ltd 46,704 0.65 Telecom Services 92,000 China Telecom Corp Ltd 46,398 0.65
DENMARK 0.46% (30 September 2015: 1.61%) Medical-Biomedical/Genetics 197 Genmab A/S 33,024 0.46
FRANCE 6.22% (30 September 2015: 2.14%) Building & Construction Production-Miscellaneous 501 Eiffage SA 38,471 0.54 Building-Heavy Construction 1,433 Vinci SA 107,489 1.50 Computer Services 455 Capgemini SA 43,889 0.62 Diversified Banking Institutions 1,334 BNP Paribas SA 65,719 0.92 Reinsurance 2,181 SCOR SE 65,992 0.92 Telephone-Integrated 3,443 Orange SA 53,176 0.74 Water 3,080 Veolia Environnement SA 69,856 0.98
GERMANY 2.71% (30 September 2015: 3.30%) Athletic Footwear 224 adidas AG 38,191 0.53 Diversified Manufacturing Operations 1,064 Siemens AG 121,435 1.70 Lighting Products & Systems 591 OSRAM Licht AG 34,158 0.48
HONG KONG 0.61% (30 September 2015: 0.00%) Diversified Operations 6,000 Wharf Holdings Ltd/The 43,686 0.61
INDONESIA 0.75% (30 September 2015: 0.00%) Telecom Services
158,900 Telekomunikasi Indonesia Persero Tbk PT 53,206 0.75
LONG/SHORT GLOBAL OPPORTUNITIES EQUITY FUND (continued)
Nominal Security Value USD
% Net Assets
IRELAND 1.18% (30 September 2015: 2.71%) Computer Services 693 Accenture Plc 84,296 1.18
ISRAEL 0.00% (30 September 2015: 1.68%)
JAPAN 6.88% (30 September 2015: 7.90%) Auto/Truck Parts & Equipment-Original 1,300 Toyota Industries Corp 59,825 0.84 Building & Construction Production-Miscellaneous 6,200 Obayashi Corp 61,175 0.86 Cellular Telecom 2,400 NTT DoCoMo Inc 60,852 0.85 Commercial Banks Non-US 10,000 77 Bank Ltd/The 40,675 0.57 1,100 Sumitomo Mitsui Trust Holdings Inc 35,598 0.50 Electric Products-Miscellaneous 10,000 Hitachi Ltd 46,375 0.65 Finance-Leasing Companies 2,600 ORIX Corp 38,018 0.53 Import/Export 2,100 Mitsubishi Corp 47,489 0.66 Machinery-General Industry 14,000 Mitsubishi Heavy Industries Ltd 58,067 0.81 Semiconductor Equipment 500 Tokyo Electron Ltd 43,926 0.61
MALAYSIA 0.50% (30 September 2015: 0.00%) Electric-Integrated 10,400 Tenaga Nasional Bhd 35,962 0.50
MEXICO 0.43% (30 September 2015: 0.51%) Building-Heavy Construction
2,855 Promotora y Operadora de Infraestructura SAB de CV 30,901 0.43
NETHERLANDS 1.80% (30 September 2015: 0.45%) Food-Retail 2,365 Koninklijke Ahold Delhaize NV 52,846 0.74 Life/Health Insurance 2,539 NN Group NV 76,043 1.06
RUSSIA 0.66% (30 September 2015: 0.00%) Oil Company-Integrated 973 Lukoil PJSC 47,195 0.66
SOUTH KOREA 2.65% (30 September 2015: 0.63%) Electric-Integrated 1,180 Korea Electric Power Corp 57,856 0.81 Electronic Component-Semiconductor 38 Samsung Electronics Co Ltd 55,136 0.77 Tobacco 675 KT&G Corp 76,611 1.07
SPAIN 1.62% (30 September 2015: 0.71%) Airport Development/Maintenance 350 Aena SA 51,160 0.72 Electric-Integrated 9,602 Iberdrola SA 64,518 0.90
SWEDEN 0.00% (30 September 2015: 0.96%)
SWITZERLAND 2.29% (30 September 2015: 4.71%) Chemicals-Specialty 273 Lonza Group AG 51,608 0.72 Engineering/Research & Development Services 2,462 ABB Ltd 54,854 0.77 Reinsurance 643 Swiss Re AG 56,959 0.80
TAIWAN 0.57% (30 September 2015: 0.63%) Semicon Component-Integrated Circuits
7,000 Taiwan Semiconductor Manufacturing Co Ltd 40,755 0.57
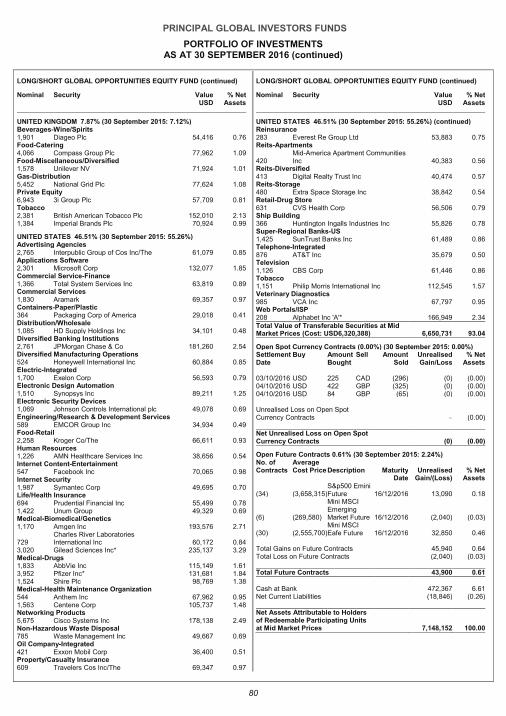
PRINCIPAL GLOBAL INVESTORS FUNDS
PORTFOLIO OF INVESTMENTS AS AT 30 SEPTEMBER 2016 (continued)
80
LONG/SHORT GLOBAL OPPORTUNITIES EQUITY FUND (continued)
Nominal Security Value USD
% Net Assets
UNITED KINGDOM 7.87% (30 September 2015: 7.12%) Beverages-Wine/Spirits 1,901 Diageo Plc 54,416 0.76 Food-Catering 4,066 Compass Group Plc 77,962 1.09 Food-Miscellaneous/Diversified 1,578 Unilever NV 71,924 1.01 Gas-Distribution 5,452 National Grid Plc 77,624 1.08 Private Equity 6,943 3i Group Plc 57,709 0.81 Tobacco 2,381 British American Tobacco Plc 152,010 2.13 1,384 Imperial Brands Plc 70,924 0.99
UNITED STATES 46.51% (30 September 2015: 55.26%) Advertising Agencies 2,765 Interpublic Group of Cos Inc/The 61,079 0.85 Applications Software 2,301 Microsoft Corp 132,077 1.85 Commercial Service-Finance 1,366 Total System Services Inc 63,819 0.89 Commercial Services 1,830 Aramark 69,357 0.97 Containers-Paper/Plastic 364 Packaging Corp of America 29,018 0.41 Distribution/Wholesale 1,085 HD Supply Holdings Inc 34,101 0.48 Diversified Banking Institutions 2,761 JPMorgan Chase & Co 181,260 2.54 Diversified Manufacturing Operations 524 Honeywell International Inc 60,884 0.85 Electric-Integrated 1,700 Exelon Corp 56,593 0.79 Electronic Design Automation 1,510 Synopsys Inc 89,211 1.25 Electronic Security Devices 1,069 Johnson Controls International plc 49,078 0.69 Engineering/Research & Development Services 589 EMCOR Group Inc 34,934 0.49 Food-Retail 2,258 Kroger Co/The 66,611 0.93 Human Resources 1,226 AMN Healthcare Services Inc 38,656 0.54 Internet Content-Entertainment 547 Facebook Inc 70,065 0.98 Internet Security 1,987 Symantec Corp 49,695 0.70 Life/Health Insurance 694 Prudential Financial Inc 55,499 0.78 1,422 Unum Group 49,329 0.69 Medical-Biomedical/Genetics 1,170 Amgen Inc 193,576 2.71
729 Charles River Laboratories International Inc 60,172 0.84
3,020 Gilead Sciences Inc* 235,137 3.29 Medical-Drugs 1,833 AbbVie Inc 115,149 1.61 3,952 Pfizer Inc* 131,681 1.84 1,524 Shire Plc 98,769 1.38 Medical-Health Maintenance Organization 544 Anthem Inc 67,962 0.95 1,563 Centene Corp 105,737 1.48 Networking Products 5,675 Cisco Systems Inc 178,138 2.49 Non-Hazardous Waste Disposal 785 Waste Management Inc 49,667 0.69 Oil Company-Integrated 421 Exxon Mobil Corp 36,400 0.51 Property/Casualty Insurance 609 Travelers Cos Inc/The 69,347 0.97
LONG/SHORT GLOBAL OPPORTUNITIES EQUITY FUND (continued)
Nominal Security Value USD
% Net Assets
UNITED STATES 46.51% (30 September 2015: 55.26%) (continued) Reinsurance 283 Everest Re Group Ltd 53,883 0.75 Reits-Apartments
420 Mid-America Apartment Communities Inc 40,383 0.56
Reits-Diversified 413 Digital Realty Trust Inc 40,474 0.57 Reits-Storage 480 Extra Space Storage Inc 38,842 0.54 Retail-Drug Store 631 CVS Health Corp 56,506 0.79 Ship Building 366 Huntington Ingalls Industries Inc 55,826 0.78 Super-Regional Banks-US 1,425 SunTrust Banks Inc 61,489 0.86 Telephone-Integrated 876 AT&T Inc 35,679 0.50 Television 1,126 CBS Corp 61,446 0.86 Tobacco 1,151 Philip Morris International Inc 112,545 1.57 Veterinary Diagnostics 985 VCA Inc 67,797 0.95 Web Portals/ISP 208 Alphabet Inc 'A'* 166,949 2.34 Total Value of Transferable Securities at Mid Market Prices (Cost: USD6,320,388) 6,650,731 93.04
Open Spot Currency Contracts (0.00%) (30 September 2015: 0.00%) Settlement Buy Amount Sell Amount Unrealised % Net Date Bought Sold Gain/Loss Assets
03/10/2016 USD 225 CAD (296) (0) (0.00) 04/10/2016 USD 422 GBP (325) (0) (0.00) 04/10/2016 USD 84 GBP (65) (0) (0.00) Unrealised Loss on Open Spot Currency Contracts – (0.00) Net Unrealised Loss on Open Spot Currency Contracts (0) (0 .00)
Open Future Contracts 0.61% (30 September 2015: 2.24%) No. of Contracts
Average Cost Price Description Maturity Unrealised % Net
Date Gain/(Loss) Assets
(34) (3,658,315) S&p500 Emini Future 16/12/2016 13,090 0.18
(6) (269,580)
Mini MSCI Emerging Market Future 16/12/2016 (2,040) (0.03)
(30) (2,555,700) Mini MSCI Eafe Future 16/12/2016 32,850 0.46
Total Gains on Future Contracts 45,940 0.64 Total Loss on Future Contracts (2,040) (0.03)
Total Future Contracts 43,900 0.61 Cash at Bank 472,367 6.61 Net Current Liabilities (18,846) (0.26) Net Assets Attributable to Holders of Redeemable Participating Units at Mid Market Prices 7,148,152 100.00
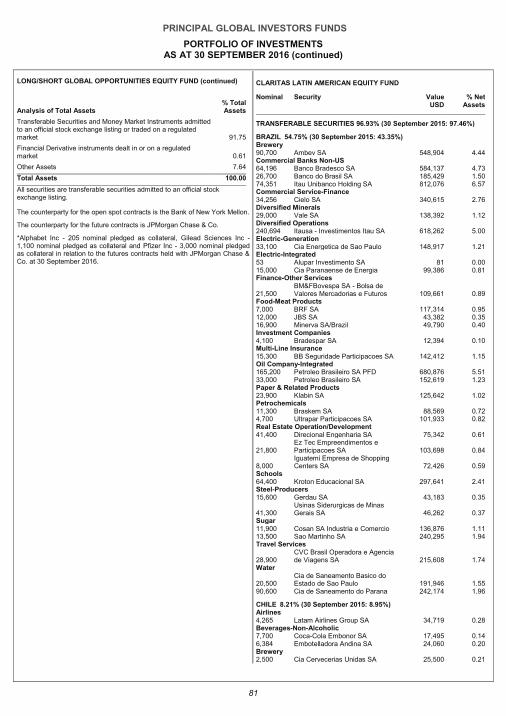
PRINCIPAL GLOBAL INVESTORS FUNDS
PORTFOLIO OF INVESTMENTS AS AT 30 SEPTEMBER 2016 (continued)
81
LONG/SHORT GLOBAL OPPORTUNITIES EQUITY FUND (continued)
Analysis of Total Assets % Total Assets
Transferable Securities and Money Market Instruments admitted to an official stock exchange listing or traded on a regulated market 91.75
Financial Derivative instruments dealt in or on a regulated market 0.61
Other Assets 7.64
Total Assets 100.00
All securities are transferable securities admitted to an official stock exchange listing.
The counterparty for the open spot contracts is the Bank of New York Mellon.
The counterparty for the future contracts is JPMorgan Chase & Co.
*Alphabet Inc - 205 nominal pledged as collateral, Gilead Sciences Inc - 1,100 nominal pledged as collateral and Pfizer Inc - 3,000 nominal pledged as collateral in relation to the futures contracts held with JPMorgan Chase & Co. at 30 September 2016.
CLARITAS LATIN AMERICAN EQUITY FUND
Nominal Security Value USD
% Net Assets
TRANSFERABLE SECURITIES 96.93% (30 September 2015: 97.46%)
BRAZIL 54.75% (30 September 2015: 43.35%) Brewery 90,700 Ambev SA 548,904 4.44 Commercial Banks Non-US 64,196 Banco Bradesco SA 584,137 4.73 26,700 Banco do Brasil SA 185,429 1.50 74,351 Itau Unibanco Holding SA 812,076 6.57 Commercial Service-Finance 34,256 Cielo SA 340,615 2.76 Diversified Minerals 29,000 Vale SA 138,392 1.12 Diversified Operations 240,694 Itausa - Investimentos Itau SA 618,262 5.00 Electric-Generation 33,100 Cia Energetica de Sao Paulo 148,917 1.21 Electric-Integrated 53 Alupar Investimento SA 81 0.00 15,000 Cia Paranaense de Energia 99,386 0.81 Finance-Other Services
21,500 BM&FBovespa SA - Bolsa de Valores Mercadorias e Futuros 109,661 0.89
Food-Meat Products 7,000 BRF SA 117,314 0.95 12,000 JBS SA 43,382 0.35 16,900 Minerva SA/Brazil 49,790 0.40 Investment Companies 4,100 Bradespar SA 12,394 0.10 Multi-Line Insurance 15,300 BB Seguridade Participacoes SA 142,412 1.15 Oil Company-Integrated 165,200 Petroleo Brasileiro SA PFD 680,876 5.51 33,000 Petroleo Brasileiro SA 152,619 1.23 Paper & Related Products 23,900 Klabin SA 125,642 1.02 Petrochemicals 11,300 Braskem SA 88,569 0.72 4,700 Ultrapar Participacoes SA 101,933 0.82 Real Estate Operation/Development 41,400 Direcional Engenharia SA 75,342 0.61
21,800 Ez Tec Empreendimentos e Participacoes SA 103,698 0.84
8,000 Iguatemi Empresa de Shopping Centers SA 72,426 0.59
Schools 64,400 Kroton Educacional SA 297,641 2.41 Steel-Producers 15,600 Gerdau SA 43,183 0.35
41,300 Usinas Siderurgicas de Minas Gerais SA 46,262 0.37
Sugar 11,900 Cosan SA Industria e Comercio 136,876 1.11 13,500 Sao Martinho SA 240,295 1.94 Travel Services
28,900 CVC Brasil Operadora e Agencia de Viagens SA 215,608 1.74
Water
20,500 Cia de Saneamento Basico do Estado de Sao Paulo 191,946 1.55
90,600 Cia de Saneamento do Parana 242,174 1.96
CHILE 8.21% (30 September 2015: 8.95%) Airlines 4,265 Latam Airlines Group SA 34,719 0.28 Beverages-Non-Alcoholic 7,700 Coca-Cola Embonor SA 17,495 0.14 6,384 Embotelladora Andina SA 24,060 0.20 Brewery 2,500 Cia Cervecerias Unidas SA 25,500 0.21
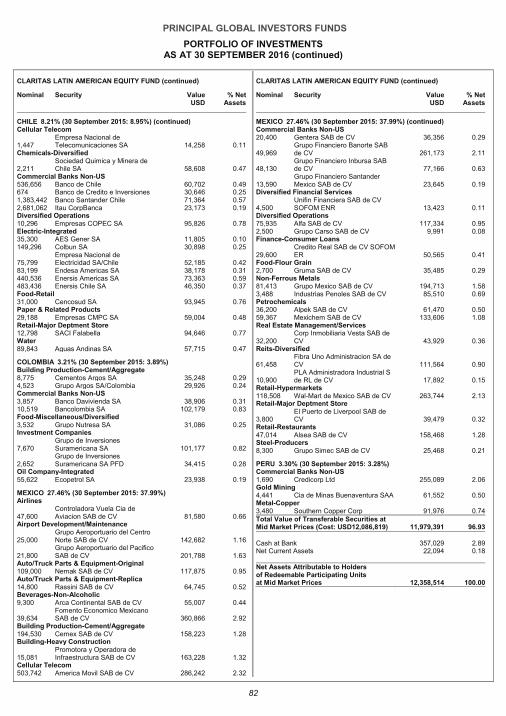
PRINCIPAL GLOBAL INVESTORS FUNDS
PORTFOLIO OF INVESTMENTS AS AT 30 SEPTEMBER 2016 (continued)
82
CLARITAS LATIN AMERICAN EQUITY FUND (continued)
Nominal Security Value USD
% Net Assets
CHILE 8.21% (30 September 2015: 8.95%) (continued) Cellular Telecom
1,447 Empresa Nacional de Telecomunicaciones SA 14,258 0.11
Chemicals-Diversified
2,211 Sociedad Quimica y Minera de Chile SA 58,608 0.47
Commercial Banks Non-US 536,656 Banco de Chile 60,702 0.49 674 Banco de Credito e Inversiones 30,646 0.25 1,383,442 Banco Santander Chile 71,364 0.57 2,681,062 Itau CorpBanca 23,173 0.19 Diversified Operations 10,296 Empresas COPEC SA 95,826 0.78 Electric-Integrated 35,300 AES Gener SA 11,805 0.10 149,296 Colbun SA 30,898 0.25
75,799 Empresa Nacional de Electricidad SA/Chile 52,185 0.42
83,199 Endesa Americas SA 38,178 0.31 440,536 Enersis Americas SA 73,363 0.59 483,436 Enersis Chile SA 46,350 0.37 Food-Retail 31,000 Cencosud SA 93,945 0.76 Paper & Related Products 29,188 Empresas CMPC SA 59,004 0.48 Retail-Major Deptment Store 12,798 SACI Falabella 94,646 0.77 Water 89,843 Aguas Andinas SA 57,715 0.47
COLOMBIA 3.21% (30 September 2015: 3.89%) Building Production-Cement/Aggregate 8,775 Cementos Argos SA 35,248 0.29 4,523 Grupo Argos SA/Colombia 29,926 0.24 Commercial Banks Non-US 3,857 Banco Davivienda SA 38,906 0.31 10,519 Bancolombia SA 102,179 0.83 Food-Miscellaneous/Diversified 3,532 Grupo Nutresa SA 31,086 0.25 Investment Companies
7,670 Grupo de Inversiones Suramericana SA 101,177 0.82
2,652 Grupo de Inversiones Suramericana SA PFD 34,415 0.28
Oil Company-Integrated 55,622 Ecopetrol SA 23,938 0.19
MEXICO 27.46% (30 September 2015: 37.99%) Airlines
47,600 Controladora Vuela Cia de Aviacion SAB de CV 81,580 0.66
Airport Development/Maintenance
25,000 Grupo Aeroportuario del Centro Norte SAB de CV 142,682 1.16
21,800 Grupo Aeroportuario del Pacifico SAB de CV 201,788 1.63
Auto/Truck Parts & Equipment-Original 109,000 Nemak SAB de CV 117,875 0.95 Auto/Truck Parts & Equipment-Replica 14,800 Rassini SAB de CV 64,745 0.52 Beverages-Non-Alcoholic 9,300 Arca Continental SAB de CV 55,007 0.44
39,634 Fomento Economico Mexicano SAB de CV 360,866 2.92
Building Production-Cement/Aggregate 194,530 Cemex SAB de CV 158,223 1.28 Building-Heavy Construction
15,081 Promotora y Operadora de Infraestructura SAB de CV 163,228 1.32
Cellular Telecom 503,742 America Movil SAB de CV 286,242 2.32
CLARITAS LATIN AMERICAN EQUITY FUND (continued)
Nominal Security Value USD
% Net Assets
MEXICO 27.46% (30 September 2015: 37.99%) (continued) Commercial Banks Non-US 20,400 Gentera SAB de CV 36,356 0.29
49,969 Grupo Financiero Banorte SAB de CV 261,173 2.11
48,130 Grupo Financiero Inbursa SAB de CV 77,166 0.63
13,590 Grupo Financiero Santander Mexico SAB de CV 23,645 0.19
Diversified Financial Services
4,500 Unifin Financiera SAB de CV SOFOM ENR 13,423 0.11
Diversified Operations 75,935 Alfa SAB de CV 117,334 0.95 2,500 Grupo Carso SAB de CV 9,991 0.08 Finance-Consumer Loans
29,600 Credito Real SAB de CV SOFOM ER 50,565 0.41
Food-Flour Grain 2,700 Gruma SAB de CV 35,485 0.29 Non-Ferrous Metals 81,413 Grupo Mexico SAB de CV 194,713 1.58 3,488 Industrias Penoles SAB de CV 85,510 0.69 Petrochemicals 36,200 Alpek SAB de CV 61,470 0.50 59,367 Mexichem SAB de CV 133,606 1.08 Real Estate Management/Services
32,200 Corp Inmobiliaria Vesta SAB de CV 43,929 0.36
Reits-Diversified
61,458 Fibra Uno Administracion SA de CV 111,564 0.90
10,900 PLA Administradora Industrial S de RL de CV 17,892 0.15
Retail-Hypermarkets 118,508 Wal-Mart de Mexico SAB de CV 263,744 2.13 Retail-Major Deptment Store
3,800 El Puerto de Liverpool SAB de CV 39,479 0.32
Retail-Restaurants 47,014 Alsea SAB de CV 158,468 1.28 Steel-Producers 8,300 Grupo Simec SAB de CV 25,468 0.21
PERU 3.30% (30 September 2015: 3.28%) Commercial Banks Non-US 1,690 Credicorp Ltd 255,089 2.06 Gold Mining 4,441 Cia de Minas Buenaventura SAA 61,552 0.50 Metal-Copper 3,480 Southern Copper Corp 91,976 0.74 Total Value of Transferable Securities at Mid Market Prices (Cost: USD12,086,819) 11,979,391 96.93 Cash at Bank 357,029 2.89 Net Current Assets 22,094 0.18 Net Assets Attributable to Holders of Redeemable Participating Units at Mid Market Prices 12,358,514 100.00
PRINCIPAL GLOBAL INVESTORS FUNDS
PORTFOLIO OF INVESTMENTS AS AT 30 SEPTEMBER 2016 (continued)
83
CLARITAS LATIN AMERICAN EQUITY FUND (continued)
Analysis of Total Assets % Total Assets
Transferable Securities and Money Market Instruments admitted to an official stock exchange listing or traded on a regulated market 95.43
Financial Derivative instruments dealt in or on a regulated market 0.00
Other Assets 4.57
Total Assets 100.00
All securities are transferable securities admitted to an official stock exchange listing.
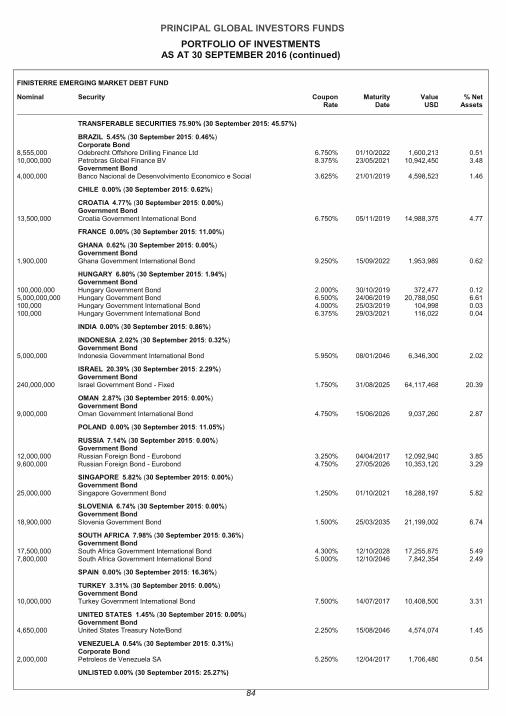
PRINCIPAL GLOBAL INVESTORS FUNDS
PORTFOLIO OF INVESTMENTS AS AT 30 SEPTEMBER 2016 (continued)
84
FINISTERRE EMERGING MARKET DEBT FUND
Nominal Security Coupon Rate
Maturity Date
Value USD
% Net Assets
TRANSFERABLE SECURITIES 75.90% (30 September 2015: 45.57%)
BRAZIL 5.45% (30 September 2015: 0.46%) Corporate Bond
8,555,000 Odebrecht Offshore Drilling Finance Ltd 6.750% 01/10/2022 1,600,213 0.51 10,000,000 Petrobras Global Finance BV 8.375% 23/05/2021 10,942,450 3.48
Government Bond 4,000,000 Banco Nacional de Desenvolvimento Economico e Social 3.625% 21/01/2019 4,598,523 1.46
CHILE 0.00% (30 September 2015: 0.62%)
CROATIA 4.77% (30 September 2015: 0.00%) Government Bond
13,500,000 Croatia Government International Bond 6.750% 05/11/2019 14,988,375 4.77
FRANCE 0.00% (30 September 2015: 11.00%)
GHANA 0.62% (30 September 2015: 0.00%) Government Bond
1,900,000 Ghana Government International Bond 9.250% 15/09/2022 1,953,989 0.62
HUNGARY 6.80% (30 September 2015: 1.94%) Government Bond
100,000,000 Hungary Government Bond 2.000% 30/10/2019 372,477 0.12 5,000,000,000 Hungary Government Bond 6.500% 24/06/2019 20,788,050 6.61 100,000 Hungary Government International Bond 4.000% 25/03/2019 104,998 0.03 100,000 Hungary Government International Bond 6.375% 29/03/2021 116,022 0.04
INDIA 0.00% (30 September 2015: 0.86%)
INDONESIA 2.02% (30 September 2015: 0.32%) Government Bond
5,000,000 Indonesia Government International Bond 5.950% 08/01/2046 6,346,300 2.02
ISRAEL 20.39% (30 September 2015: 2.29%) Government Bond
240,000,000 Israel Government Bond - Fixed 1.750% 31/08/2025 64,117,468 20.39
OMAN 2.87% (30 September 2015: 0.00%) Government Bond
9,000,000 Oman Government International Bond 4.750% 15/06/2026 9,037,260 2.87
POLAND 0.00% (30 September 2015: 11.05%)
RUSSIA 7.14% (30 September 2015: 0.00%) Government Bond
12,000,000 Russian Foreign Bond - Eurobond 3.250% 04/04/2017 12,092,940 3.85 9,600,000 Russian Foreign Bond - Eurobond 4.750% 27/05/2026 10,353,120 3.29
SINGAPORE 5.82% (30 September 2015: 0.00%) Government Bond
25,000,000 Singapore Government Bond 1.250% 01/10/2021 18,288,197 5.82
SLOVENIA 6.74% (30 September 2015: 0.00%) Government Bond
18,900,000 Slovenia Government Bond 1.500% 25/03/2035 21,199,002 6.74
SOUTH AFRICA 7.98% (30 September 2015: 0.36%) Government Bond
17,500,000 South Africa Government International Bond 4.300% 12/10/2028 17,255,875 5.49 7,800,000 South Africa Government International Bond 5.000% 12/10/2046 7,842,354 2.49
SPAIN 0.00% (30 September 2015: 16.36%)
TURKEY 3.31% (30 September 2015: 0.00%) Government Bond
10,000,000 Turkey Government International Bond 7.500% 14/07/2017 10,408,500 3.31
UNITED STATES 1.45% (30 September 2015: 0.00%) Government Bond
4,650,000 United States Treasury Note/Bond 2.250% 15/08/2046 4,574,074 1.45
VENEZUELA 0.54% (30 September 2015: 0.31%) Corporate Bond
2,000,000 Petroleos de Venezuela SA 5.250% 12/04/2017 1,706,480 0.54
UNLISTED 0.00% (30 September 2015: 25.27%)
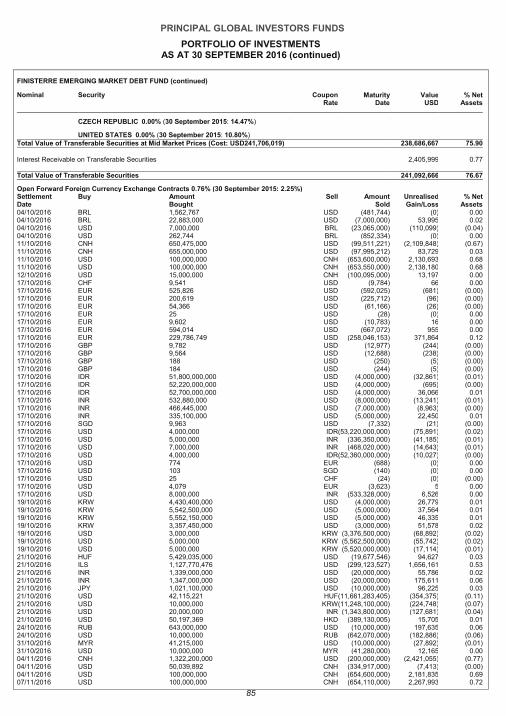
PRINCIPAL GLOBAL INVESTORS FUNDS
PORTFOLIO OF INVESTMENTS AS AT 30 SEPTEMBER 2016 (continued)
85
FINISTERRE EMERGING MARKET DEBT FUND (continued)
Nominal Security Coupon Rate
Maturity Date
Value USD
% Net Assets
CZECH REPUBLIC 0.00% (30 September 2015: 14.47%)
UNITED STATES 0.00% (30 September 2015: 10.80%) Total Value of Transferable Securities at Mid Market Prices (Cost: USD241,706,019) 238,686,667 75.90
Interest Receivable on Transferable Securities 2,405,999 0.77
Total Value of Transferable Securities 241,092,666 76.67
Open Forward Foreign Currency Exchange Contracts 0.76% (30 September 2015: 2.25%) Settlement Date
Buy Amount Bought
Sell Amount Sold
Unrealised Gain/Loss
% Net Assets
04/10/2016 BRL 1,562,767 USD (481,744) (0) 0 .00
04/10/2016 BRL 22,883,000 USD (7,000,000) 53,995 0 .02
04/10/2016 USD 7,000,000 BRL (23,065,000) (110,099) (0 .04)
04/10/2016 USD 262,744 BRL (852,334) (0) 0 .00
11/10/2016 CNH 650,475,000 USD (99,511,221) (2,109,848) (0 .67)
11/10/2016 CNH 655,000,000 USD (97,995,212) 83,729 0 .03
11/10/2016 USD 100,000,000 CNH (653,600,000) 2,130,693 0 .68
11/10/2016 USD 100,000,000 CNH (653,550,000) 2,138,180 0 .68
12/10/2016 USD 15,000,000 CNH (100,095,000) 13,197 0 .00
17/10/2016 CHF 9,541 USD (9,784) 66 0 .00
17/10/2016 EUR 525,826 USD (592,025) (681) (0 .00)
17/10/2016 EUR 200,619 USD (225,712) (96) (0 .00)
17/10/2016 EUR 54,366 USD (61,166) (26) (0 .00)
17/10/2016 EUR 25 USD (28) (0) 0 .00
17/10/2016 EUR 9,602 USD (10,783) 16 0 .00
17/10/2016 EUR 594,014 USD (667,072) 955 0 .00
17/10/2016 EUR 229,786,749 USD (258,046,153) 371,864 0 .12
17/10/2016 GBP 9,782 USD (12,977) (244) (0 .00)
17/10/2016 GBP 9,564 USD (12,688) (238) (0 .00)
17/10/2016 GBP 188 USD (250) (5) (0 .00)
17/10/2016 GBP 184 USD (244) (5) (0 .00)
17/10/2016 IDR 51,800,000,000 USD (4,000,000) (32,861) (0 .01)
17/10/2016 IDR 52,220,000,000 USD (4,000,000) (695) (0 .00)
17/10/2016 IDR 52,700,000,000 USD (4,000,000) 36,066 0 .01
17/10/2016 INR 532,880,000 USD (8,000,000) (13,241) (0 .01)
17/10/2016 INR 466,445,000 USD (7,000,000) (8,963) (0 .00)
17/10/2016 INR 335,100,000 USD (5,000,000) 22,450 0 .01
17/10/2016 SGD 9,963 USD (7,332) (21) (0 .00)
17/10/2016 USD 4,000,000 IDR (53,220,000,000) (75,891) (0 .02)
17/10/2016 USD 5,000,000 INR (336,350,000) (41,185) (0 .01)
17/10/2016 USD 7,000,000 INR (468,020,000) (14,643) (0 .01)
17/10/2016 USD 4,000,000 IDR (52,360,000,000) (10,027) (0 .00)
17/10/2016 USD 774 EUR (688) (0) 0 .00
17/10/2016 USD 103 SGD (140) (0) 0 .00
17/10/2016 USD 25 CHF (24) (0) (0 .00)
17/10/2016 USD 4,079 EUR (3,623) 5 0 .00
17/10/2016 USD 8,000,000 INR (533,328,000) 6,526 0 .00
19/10/2016 KRW 4,430,400,000 USD (4,000,000) 26,779 0 .01
19/10/2016 KRW 5,542,500,000 USD (5,000,000) 37,564 0 .01
19/10/2016 KRW 5,552,150,000 USD (5,000,000) 46,335 0 .01
19/10/2016 KRW 3,357,450,000 USD (3,000,000) 51,578 0 .02
19/10/2016 USD 3,000,000 KRW (3,376,500,000) (68,892) (0 .02)
19/10/2016 USD 5,000,000 KRW (5,562,500,000) (55,742) (0 .02)
19/10/2016 USD 5,000,000 KRW (5,520,000,000) (17,114) (0 .01)
21/10/2016 HUF 5,429,035,000 USD (19,677,546) 94,627 0 .03
21/10/2016 ILS 1,127,770,476 USD (299,123,527) 1,656,161 0 .53
21/10/2016 INR 1,339,000,000 USD (20,000,000) 55,786 0 .02
21/10/2016 INR 1,347,000,000 USD (20,000,000) 175,611 0 .06
21/10/2016 JPY 1,021,100,000 USD (10,000,000) 96,225 0 .03
21/10/2016 USD 42,115,221 HUF (11,661,283,405) (354,375) (0 .11)
21/10/2016 USD 10,000,000 KRW (11,248,100,000) (224,748) (0 .07)
21/10/2016 USD 20,000,000 INR (1,343,800,000) (127,681) (0 .04)
21/10/2016 USD 50,197,369 HKD (389,130,005) 15,705 0 .01
24/10/2016 RUB 643,000,000 USD (10,000,000) 197,635 0 .06
24/10/2016 USD 10,000,000 RUB (642,070,000) (182,886) (0 .06)
31/10/2016 MYR 41,215,000 USD (10,000,000) (27,892) (0 .01)
31/10/2016 USD 10,000,000 MYR (41,280,000) 12,165 0 .00
04/11/2016 CNH 1,322,200,000 USD (200,000,000) (2,421,055) (0 .77)
04/11/2016 USD 50,039,892 CNH (334,917,000) (7,413) (0 .00)
04/11/2016 USD 100,000,000 CNH (654,600,000) 2,181,835 0 .69
07/11/2016 USD 100,000,000 CNH (654,110,000) 2,267,993 0 .72
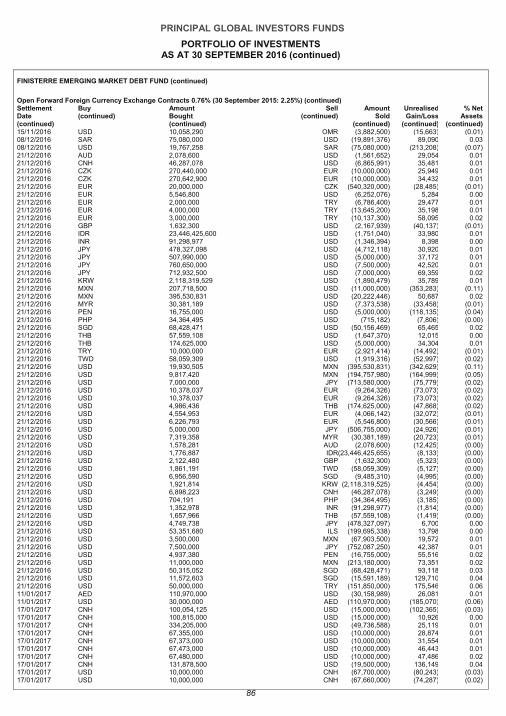
PRINCIPAL GLOBAL INVESTORS FUNDS
PORTFOLIO OF INVESTMENTS AS AT 30 SEPTEMBER 2016 (continued)
86
FINISTERRE EMERGING MARKET DEBT FUND (continued)
Open Forward Foreign Currency Exchange Contracts 0.76% (30 September 2015: 2.25%) (continued) Settlement Date (continued)
Buy (continued)
Amount Bought (continued)
Sell (continued)
Amount Sold
(continued)
Unrealised Gain/Loss
(continued)
% Net Assets
(continued) 15/11/2016 USD 10,058,290 OMR (3,882,500) (15,663) (0 .01)
08/12/2016 SAR 75,080,000 USD (19,891,376) 89,090 0 .03
08/12/2016 USD 19,767,258 SAR (75,080,000) (213,208) (0 .07)
21/12/2016 AUD 2,078,600 USD (1,561,652) 29,054 0 .01
21/12/2016 CNH 46,287,078 USD (6,865,991) 35,481 0 .01
21/12/2016 CZK 270,440,000 EUR (10,000,000) 25,949 0 .01
21/12/2016 CZK 270,642,900 EUR (10,000,000) 34,432 0 .01
21/12/2016 EUR 20,000,000 CZK (540,320,000) (28,485) (0 .01)
21/12/2016 EUR 5,546,800 USD (6,252,076) 5,284 0 .00
21/12/2016 EUR 2,000,000 TRY (6,786,400) 29,477 0 .01
21/12/2016 EUR 4,000,000 TRY (13,645,200) 35,198 0 .01
21/12/2016 EUR 3,000,000 TRY (10,137,300) 58,095 0 .02
21/12/2016 GBP 1,632,300 USD (2,167,939) (40,137) (0 .01)
21/12/2016 IDR 23,446,425,600 USD (1,751,040) 33,980 0 .01
21/12/2016 INR 91,298,977 USD (1,346,394) 8,398 0 .00
21/12/2016 JPY 478,327,098 USD (4,712,118) 30,920 0 .01
21/12/2016 JPY 507,990,000 USD (5,000,000) 37,172 0 .01
21/12/2016 JPY 760,650,000 USD (7,500,000) 42,520 0 .01
21/12/2016 JPY 712,932,500 USD (7,000,000) 69,359 0 .02
21/12/2016 KRW 2,118,319,529 USD (1,890,479) 35,789 0 .01
21/12/2016 MXN 207,718,500 USD (11,000,000) (353,283) (0 .11)
21/12/2016 MXN 395,530,831 USD (20,222,446) 50,687 0 .02
21/12/2016 MYR 30,381,189 USD (7,373,538) (33,458) (0 .01)
21/12/2016 PEN 16,755,000 USD (5,000,000) (118,135) (0 .04)
21/12/2016 PHP 34,364,495 USD (715,182) (7,806) (0 .00)
21/12/2016 SGD 68,428,471 USD (50,156,469) 65,465 0 .02
21/12/2016 THB 57,559,108 USD (1,647,370) 12,015 0 .00
21/12/2016 THB 174,625,000 USD (5,000,000) 34,304 0 .01
21/12/2016 TRY 10,000,000 EUR (2,921,414) (14,492) (0 .01)
21/12/2016 TWD 58,059,309 USD (1,919,316) (52,997) (0 .02)
21/12/2016 USD 19,930,505 MXN (395,530,831) (342,629) (0 .11)
21/12/2016 USD 9,817,420 MXN (194,757,980) (164,999) (0 .05)
21/12/2016 USD 7,000,000 JPY (713,580,000) (75,779) (0 .02)
21/12/2016 USD 10,378,037 EUR (9,264,326) (73,073) (0 .02)
21/12/2016 USD 10,378,037 EUR (9,264,326) (73,073) (0 .02)
21/12/2016 USD 4,986,436 THB (174,625,000) (47,868) (0 .02)
21/12/2016 USD 4,554,953 EUR (4,066,142) (32,072) (0 .01)
21/12/2016 USD 6,226,793 EUR (5,546,800) (30,566) (0 .01)
21/12/2016 USD 5,000,000 JPY (506,755,000) (24,926) (0 .01)
21/12/2016 USD 7,319,358 MYR (30,381,189) (20,723) (0 .01)
21/12/2016 USD 1,578,281 AUD (2,078,600) (12,425) (0 .00)
21/12/2016 USD 1,776,887 IDR (23,446,425,655) (8,133) (0 .00)
21/12/2016 USD 2,122,480 GBP (1,632,300) (5,323) (0 .00)
21/12/2016 USD 1,861,191 TWD (58,059,309) (5,127) (0 .00)
21/12/2016 USD 6,956,590 SGD (9,485,310) (4,995) (0 .00)
21/12/2016 USD 1,921,814 KRW (2,118,319,525) (4,454) (0 .00)
21/12/2016 USD 6,898,223 CNH (46,287,078) (3,249) (0 .00)
21/12/2016 USD 704,191 PHP (34,364,495) (3,185) (0 .00)
21/12/2016 USD 1,352,978 INR (91,298,977) (1,814) (0 .00)
21/12/2016 USD 1,657,966 THB (57,559,108) (1,419) (0 .00)
21/12/2016 USD 4,749,738 JPY (478,327,097) 6,700 0 .00
21/12/2016 USD 53,351,680 ILS (199,695,338) 13,798 0 .00
21/12/2016 USD 3,500,000 MXN (67,903,500) 19,572 0 .01
21/12/2016 USD 7,500,000 JPY (752,087,250) 42,387 0 .01
21/12/2016 USD 4,937,380 PEN (16,755,000) 55,516 0 .02
21/12/2016 USD 11,000,000 MXN (213,180,000) 73,351 0 .02
21/12/2016 USD 50,315,052 SGD (68,428,471) 93,118 0 .03
21/12/2016 USD 11,572,603 SGD (15,591,189) 129,710 0 .04
21/12/2016 USD 50,000,000 TRY (151,850,000) 175,546 0 .06
11/01/2017 AED 110,970,000 USD (30,158,989) 26,081 0 .01
11/01/2017 USD 30,000,000 AED (110,970,000) (185,070) (0 .06)
17/01/2017 CNH 100,054,125 USD (15,000,000) (102,365) (0 .03)
17/01/2017 CNH 100,815,000 USD (15,000,000) 10,926 0 .00
17/01/2017 CNH 334,205,000 USD (49,736,588) 25,119 0 .01
17/01/2017 CNH 67,355,000 USD (10,000,000) 28,874 0 .01
17/01/2017 CNH 67,373,000 USD (10,000,000) 31,554 0 .01
17/01/2017 CNH 67,473,000 USD (10,000,000) 46,443 0 .01
17/01/2017 CNH 67,480,000 USD (10,000,000) 47,486 0 .02
17/01/2017 CNH 131,878,500 USD (19,500,000) 136,149 0 .04
17/01/2017 USD 10,000,000 CNH (67,700,000) (80,243) (0 .03)
17/01/2017 USD 10,000,000 CNH (67,660,000) (74,287) (0 .02)
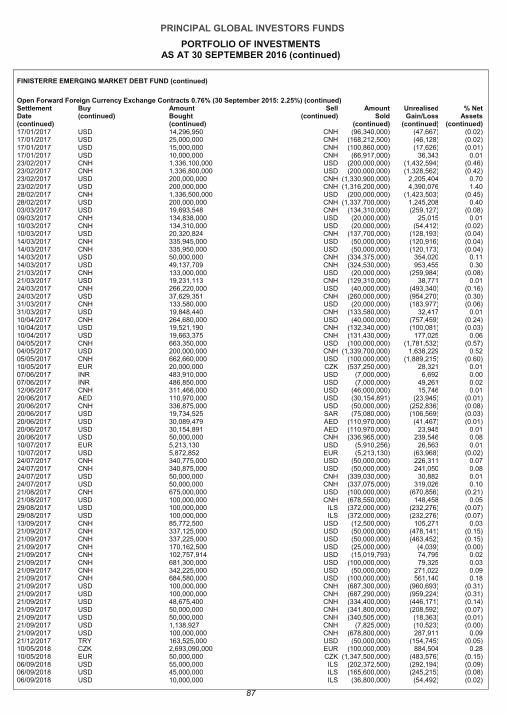
PRINCIPAL GLOBAL INVESTORS FUNDS
PORTFOLIO OF INVESTMENTS AS AT 30 SEPTEMBER 2016 (continued)
87
FINISTERRE EMERGING MARKET DEBT FUND (continued)
Open Forward Foreign Currency Exchange Contracts 0.76% (30 September 2015: 2.25%) (continued) Settlement Date (continued)
Buy (continued)
Amount Bought (continued)
Sell (continued)
Amount Sold
(continued)
Unrealised Gain/Loss
(continued)
% Net Assets
(continued) 17/01/2017 USD 14,296,950 CNH (96,340,000) (47,667) (0 .02)
17/01/2017 USD 25,000,000 CNH (168,212,500) (46,128) (0 .02)
17/01/2017 USD 15,000,000 CNH (100,860,000) (17,626) (0 .01)
17/01/2017 USD 10,000,000 CNH (66,917,000) 36,343 0 .01
23/02/2017 CNH 1,336,100,000 USD (200,000,000) (1,432,594) (0 .46)
23/02/2017 CNH 1,336,800,000 USD (200,000,000) (1,328,562) (0 .42)
23/02/2017 USD 200,000,000 CNH (1,330,900,000) 2,205,404 0 .70
23/02/2017 USD 200,000,000 CNH (1,316,200,000) 4,390,076 1 .40
28/02/2017 CNH 1,336,500,000 USD (200,000,000) (1,423,503) (0 .45)
28/02/2017 USD 200,000,000 CNH (1,337,700,000) 1,245,208 0 .40
03/03/2017 USD 19,693,548 CNH (134,310,000) (259,127) (0 .08)
09/03/2017 CNH 134,838,000 USD (20,000,000) 25,015 0 .01
10/03/2017 CNH 134,310,000 USD (20,000,000) (54,412) (0 .02)
10/03/2017 USD 20,320,824 CNH (137,700,000) (128,193) (0 .04)
14/03/2017 CNH 335,945,000 USD (50,000,000) (120,916) (0 .04)
14/03/2017 CNH 335,950,000 USD (50,000,000) (120,173) (0 .04)
14/03/2017 USD 50,000,000 CNH (334,375,000) 354,020 0 .11
14/03/2017 USD 49,137,709 CNH (324,530,000) 953,455 0 .30
21/03/2017 CNH 133,000,000 USD (20,000,000) (259,984) (0 .08)
21/03/2017 USD 19,231,113 CNH (129,310,000) 38,771 0 .01
24/03/2017 CNH 266,220,000 USD (40,000,000) (493,340) (0 .16)
24/03/2017 USD 37,629,351 CNH (260,000,000) (954,270) (0 .30)
31/03/2017 CNH 133,580,000 USD (20,000,000) (183,977) (0 .06)
31/03/2017 USD 19,848,440 CNH (133,580,000) 32,417 0 .01
10/04/2017 CNH 264,680,000 USD (40,000,000) (757,459) (0 .24)
10/04/2017 USD 19,521,190 CNH (132,340,000) (100,081) (0 .03)
10/04/2017 USD 19,663,375 CNH (131,430,000) 177,025 0 .06
04/05/2017 CNH 663,350,000 USD (100,000,000) (1,781,532) (0 .57)
04/05/2017 USD 200,000,000 CNH (1,339,700,000) 1,638,229 0 .52
05/05/2017 CNH 662,660,000 USD (100,000,000) (1,889,215) (0 .60)
10/05/2017 EUR 20,000,000 CZK (537,250,000) 28,321 0 .01
07/06/2017 INR 483,910,000 USD (7,000,000) 6,692 0 .00
07/06/2017 INR 486,850,000 USD (7,000,000) 49,261 0 .02
12/06/2017 CNH 311,466,000 USD (46,000,000) 15,746 0 .01
20/06/2017 AED 110,970,000 USD (30,154,891) (23,945) (0 .01)
20/06/2017 CNH 336,875,000 USD (50,000,000) (252,836) (0 .08)
20/06/2017 USD 19,734,525 SAR (75,080,000) (106,569) (0 .03)
20/06/2017 USD 30,089,479 AED (110,970,000) (41,467) (0 .01)
20/06/2017 USD 30,154,891 AED (110,970,000) 23,945 0 .01
20/06/2017 USD 50,000,000 CNH (336,965,000) 239,546 0 .08
10/07/2017 EUR 5,213,130 USD (5,910,256) 26,563 0 .01
10/07/2017 USD 5,872,852 EUR (5,213,130) (63,968) (0 .02)
24/07/2017 CNH 340,775,000 USD (50,000,000) 226,311 0 .07
24/07/2017 CNH 340,875,000 USD (50,000,000) 241,050 0 .08
24/07/2017 USD 50,000,000 CNH (339,030,000) 30,882 0 .01
24/07/2017 USD 50,000,000 CNH (337,075,000) 319,026 0 .10
21/08/2017 CNH 675,000,000 USD (100,000,000) (670,856) (0 .21)
21/08/2017 USD 100,000,000 CNH (678,550,000) 148,458 0 .05
29/08/2017 USD 100,000,000 ILS (372,000,000) (232,276) (0 .07)
29/08/2017 USD 100,000,000 ILS (372,000,000) (232,276) (0 .07)
13/09/2017 CNH 85,772,500 USD (12,500,000) 105,271 0 .03
21/09/2017 CNH 337,125,000 USD (50,000,000) (478,141) (0 .15)
21/09/2017 CNH 337,225,000 USD (50,000,000) (463,452) (0 .15)
21/09/2017 CNH 170,162,500 USD (25,000,000) (4,039) (0 .00)
21/09/2017 CNH 102,757,914 USD (15,019,793) 74,795 0 .02
21/09/2017 CNH 681,300,000 USD (100,000,000) 79,325 0 .03
21/09/2017 CNH 342,225,000 USD (50,000,000) 271,022 0 .09
21/09/2017 CNH 684,580,000 USD (100,000,000) 561,140 0 .18
21/09/2017 USD 100,000,000 CNH (687,300,000) (960,693) (0 .31)
21/09/2017 USD 100,000,000 CNH (687,290,000) (959,224) (0 .31)
21/09/2017 USD 48,675,400 CNH (334,400,000) (446,171) (0 .14)
21/09/2017 USD 50,000,000 CNH (341,800,000) (208,592) (0 .07)
21/09/2017 USD 50,000,000 CNH (340,505,000) (18,363) (0 .01)
21/09/2017 USD 1,138,927 CNH (7,825,000) (10,523) (0 .00)
21/09/2017 USD 100,000,000 CNH (678,800,000) 287,911 0 .09
21/12/2017 TRY 163,525,000 USD (50,000,000) (154,745) (0 .05)
10/05/2018 CZK 2,693,090,000 EUR (100,000,000) 884,504 0 .28
10/05/2018 EUR 50,000,000 CZK (1,347,500,000) (483,576) (0 .15)
06/09/2018 USD 55,000,000 ILS (202,372,500) (292,194) (0 .09)
06/09/2018 USD 45,000,000 ILS (165,600,000) (245,215) (0 .08)
06/09/2018 USD 10,000,000 ILS (36,800,000) (54,492) (0 .02)
PRINCIPAL GLOBAL INVESTORS FUNDS
PORTFOLIO OF INVESTMENTS AS AT 30 SEPTEMBER 2016 (continued)
88
FINISTERRE EMERGING MARKET DEBT FUND (continued)
Open Forward Foreign Currency Exchange Contracts 0.76% (30 September 2015: 2.25%) (continued) Settlement Date (continued)
Buy (continued)
Amount Bought (continued)
Sell (continued)
Amount Sold
(continued)
Unrealised Gain/Loss
(continued)
% Net Assets
(continued) 21/09/2018 CNH 349,700,000 USD (50,000,000) 135,662 0 .04
Unrealised Gain on Forward Foreign Currency Exchange Contracts 28,350,134 9 .02
Unrealised Loss on Forward Foreign Currency Exchange Contracts (25,964,400) (8 .26)
Net Unrealised Gain on Forward Foreign Currency Exchange Contracts 2,385,734 0 .76
Open Spot Currency Contracts 0.05% (30 September 2015: (0.26%)) Settlement Buy Amount Sell Amount Unrealised % Net Date Bought Sold Gain/Loss Assets 03/10/2016 SGD 9,485,310 USD (6,954,295) 5,004 0.00 03/10/2016 USD 20,402,419 MXN (395,908,941) (70,937) (0.02) 03/10/2016 USD 6,250,000 MXN (116,787,500) 210,651 0.07 04/10/2016 EUR 688 USD (773) (0) (0.00) 04/10/2016 USD 205,000 KRW (225,776,644) (0) 0.00 04/10/2016 USD 15,000 KRW (16,520,242) (0) 0.00 04/10/2016 USD 61,132 EUR (54,366) 31 0.00 04/10/2016 USD 225,586 EUR (200,619) 113 0.00
Unrealised Gains on Open Spot Currency Contracts 215,799 0.07 Unrealised Loss on Open Spot Currency Contracts (70,937) (0.02)
Net Unrealised Gain on Open Spot Currency Contracts 144,862 0 .05
Open Future Contracts 0.04% (30 September 2015: (0.02%)) No. of Contracts Cost Description Maturity Unrealised % Net Price Date Gain/(Loss) Assets (629) (260,914,351) Fed Fund 30 day 31/01/2017 212,309 0.07 500 207,412,425 Fed Fund 30 day 30/11/2016 72,922 0.02 (200) (26,187,250) Long Gilt Future 28/12/2016 178,610 0.06 (35) (6,698,700) Euro Buxl 30 year Bond 08/12/2016 (32,593) (0.01) (90) (14,847,500) US Long Bond (CBT) 20/12/2016 (314,687) (0.10)
Unrealised Gains on Future Contracts 463,841 0.15 Unrealised Loss on Future Contracts (347,280) (0.11)
Total Unrealised Gain on Future Contracts 116,561 0.04
Options (0.15%) (30 September 2015: 0.96%)
No. of contracts Value
US$ % Net
Assets
Put Currency Option EUR 297.89 14/11/2016 30,000,000 6,899 0.00 Call Currency Option EUR 335.07 14/11/2016 30,000,000 4,354 0.00 Call Currency Option EUR 339.59 08/11/2016 15,000,000 835 0.00 Put Currency Option EUR 300.06 08/11/2016 15,000,000 4,888 0.00 Put Currency Option EUR 297.89 14/11/2016 (30,000,000) (6,899) (0.00) Put Currency Option EUR 300.06 08/11/2016 (15,000,000) (4,888) (0.00) Call Currency Option EUR 335.07 14/11/2016 (30,000,000) (4,354) (0.00) Call Currency Option EUR 339.59 08/11/2016 (15,000,000) (835) (0.00) Call Currency Option USD 19.49 11/11/2016 25,000,000 551,025 0.18 Put Currency Option EUR 0.82 12/10/2016 20,000,000 121 0.00 Put Currency Option EUR 0.79 12/10/2016 (20,000,000) (4) (0.00) Put Currency Option USD 6.70 13/01/2017 (50,000,000) (512,065) (0.16) Put Currency Option USD 6.40 13/01/2017 50,000,000 27,663 0.01 Put Currency Option USD 102.00 19/10/2016 20,000,000 215,114 0.07 Put Currency Option USD 102.00 19/10/2016 30,000,000 322,670 0.10 Call Currency Option USD 20.50 12/12/2016 30,000,000 523,367 0.17 Put Currency Option USD 17.50 22/02/2017 (30,000,000) (157,716) (0.05) Put Currency Option EUR 0.82 12/10/2016 (20,000,000) (121) (0.00) Put Currency Option EUR 0.79 12/10/2016 20,000,000 4 0.00 Put Currency Option USD 17.50 22/02/2017 (25,000,000) (131,430) (0.04) Put Currency Option USD 17.83 31/10/2016 30,000,000 12,186 0.00 Call Currency Option EUR 0.89 11/11/2016 30,000,000 110,597 0.04 Put Currency Option USD 102.00 19/10/2016 (30,000,000) (322,670) (0.10) Put Currency Option USD 99.00 19/10/2016 53,000,000 72,103 0.02 Put Currency Option USD 102.00 19/10/2016 (20,000,000) (215,114) (0.07) Put Currency Option USD 99.00 19/10/2016 35,000,000 47,615 0.02 Call Currency Option EUR 1.56 13/12/2016 7,500,000 53,535 0.02 Put Currency Option USD 96.00 23/11/2016 20,000,000 28,169 0.01
PRINCIPAL GLOBAL INVESTORS FUNDS
PORTFOLIO OF INVESTMENTS AS AT 30 SEPTEMBER 2016 (continued)
89
FINISTERRE EMERGING MARKET DEBT FUND (continued)
Options (0.15%) (30 September 2015: 0.96%) (continued)
No. of contracts
(continued)
Value US$
(continued)
% Net Assets
(continued) Put Currency Option USD 96.00 23/11/2016 20,000,000 28,169 0.01 Call Currency Option EUR 0.89 11/11/2016 (30,000,000) (110,597) (0.04) Put Currency Option EUR 4.30 03/10/2016 25,000,000 39,472 0.01 Call Currency Option USD 1,117.86 02/03/2017 (17,500,000) (426,262) (0.14) Put Currency Option USD 1,117.86 02/03/2017 (17,500,000) (663,910) (0.21) Call Currency Option USD 18.70 05/10/2016 (20,000,000) (686,485) (0.22) Call Currency Option USD 7.07 08/06/2017 100,000,000 866,512 0.28 Put Currency Option USD 6.56 08/06/2017 (100,000,000) (717,613) (0.23) Put Currency Option USD 13,000.00 09/03/2017 25,000,000 369,095 0.12 Put Currency Option USD 13,000.00 09/03/2017 25,000,000 369,095 0.12 Put Currency Option USD 12,350.00 09/03/2017 (50,000,000) (160,871) (0.05) Put Currency Option USD 12,350.00 09/03/2017 (50,000,000) (160,871) (0.05) Put Currency Option USD 7.25 11/09/2017 25,000,000 234,557 0.07 Call Currency Option USD 6.60 11/09/2017 (25,000,000) (277,958) (0.09) Call Currency Option EUR 3.65 15/09/2017 10,000,000 575,949 0.18 Put Currency Option EUR 3.65 15/09/2017 10,000,000 499,153 0.16 Call Currency Option USD 20.50 12/12/2016 (30,000,000) (523,367) (0.17) Put Currency Option USD 17.50 22/02/2017 30,000,000 157,716 0.05 Put Currency Option USD 18.70 05/10/2016 20,000,000 5,823 0.00 Call Currency Option USD 19.49 11/11/2016 (25,000,000) (551,025) (0.18) Put Currency Option EUR 4.30 03/10/2016 (25,000,000) (39,472) (0.01) Put Currency Option USD 17.50 22/02/2017 25,000,000 131,430 0.04 Put Currency Option USD 100.30 17/10/2016 25,000,000 140,399 0.04 Put Currency Option USD 100.30 17/10/2016 (25,000,000) (140,399) (0.04) Call Currency Option EUR 3.65 21/12/2016 (20,000,000) (123,299) (0.04) Put Currency Option USD 66.66 13/10/2016 15,000,000 52,455 0.02 Put Currency Option USD 3.70 29/03/2017 20,000,000 108,763 0.03 Call Currency Option USD 7.85 28/09/2017 100,000,000 219,799 0.07 Put Currency Option USD 7.75 28/09/2017 (40,000,000) (263,590) (0.08) Put Currency Option USD 131.00 10/03/2016 500 7,813 0.00 Put Commodity Option USD 98.00 19/12/2016 4,000 25,000 0.01 Put Commodity Option USD 98.25 19/12/2016 (11,000) (68,750) (0.02) Put Commodity Option USD 98.50 19/12/2016 7,000 43,750 0.01 Put Forward Premium Option USD 72.50 05/06/2017 15,000,000 (17,275) (0.01) Put Forward Premium Option USD 67.00 05/06/2017 (15,000,000) (24,819) (0.01)
Unrealised Gains on Option Contracts 5,856,095 1.86 Unrealised Loss on Option Contracts (6,312,659) (2.01) Total Unrealised Loss on Option Contracts (456,564) (0.15)
Credit Default Swaps (2.43%) (30 September 2015: (0.17%))
Description Maturity Date Notional Amount
Fair Value USD
% Net Assets
1 to 5 Years Citigroup 20/06/2021 (25,000,000) (1,528,541) (0.49) Citigroup 20/06/2021 (25,000,000) (1,528,540) (0.49) Citigroup 20/06/2021 50,000,000 3,057,080 0.97
Over 5 years Barclays 20/12/2021 (20,000,000) (1,135,972) (0.36) Barclays 20/12/2021 (20,000,000) (1,137,269) (0.36) Goldman Sachs 20/12/2021 (10,000,000) (567,986) (0.18) BNP Paribas 20/12/2021 10,000,000 764,531 0.24 BNP Paribas 20/12/2021 (20,000,000) (491,784) (0.16) Citigroup 20/12/2021 25,000,000 1,609,246 0.51 Citigroup 20/12/2021 25,000,000 17,476 0.01 Citigroup 20/12/2021 (50,000,000) (3,218,491) (1.02) Citigroup 20/12/2021 (50,000,000) (3,218,491) (1.02) HSBC 20/12/2021 5,000,000 (80,676) (0.03) HSBC 20/12/2021 10,000,000 (167,436) (0.05)
Unrealised Gain on Credit Default Swaps 5,448,333 1.73 Unrealised Loss on Credit Default Swaps (13,075,186) (4.16)
Total Unrealised Loss on Credit Default Swaps (7,626,853) (2.43)
PRINCIPAL GLOBAL INVESTORS FUNDS
PORTFOLIO OF INVESTMENTS AS AT 30 SEPTEMBER 2016 (continued)
90
FINISTERRE EMERGING MARKET DEBT FUND (continued)
Interest Rate Swaps 0.53% (30 September 2015: (0.11%))
Description Maturity Date Notional Amount
Fair Value USD
% Net Assets
Up to 1 year Goldman Sachs 18/02/2017 175,000,000,000 184,248 0.06 Nomura 01/04/2017 3,330,000,000 28,331 0.01 Nomura 01/04/2017 3,330,000,000 21,358 0.01 Deutsche Bank 27/04/2017 – – – JPMorgan Chase & Co 18/05/2017 5,250,000,000 (30,301) (0.01) JPMorgan Chase & Co 20/05/2017 230,000,000,000 255,361 0.08 Citigroup 15/06/2017 4,200,000,000 (10,624) 0.00 HSBC 27/06/2017 5,250,000,000 16,713 0.00 Citigroup 20/07/2017 6,800,000,000 34,101 0.01 JPMorgan Chase & Co 20/07/2017 8,150,000,000 (63,030) (0.02) Citigroup 19/09/2017 278,000,000 872,735 0.28
1 to 5 Years Nomura 04/10/2017 6,500,000,000 (87,647) (0.03) Citigroup 28/10/2017 69,500,000 (1,143,093) (0.36) Citigroup 28/10/2017 69,500,000 1,143,093 0.36 Goldman Sachs 21/12/2017 224,000,000,000 83,267 0.03 Morgan Stanley 21/12/2017 6,230,000,000 (31,128) (0.01) Citigroup 19/02/2018 110,000,000 (260,810) (0.08) Citigroup 19/02/2018 110,000,000 144,504 0.05 Deutsche Bank 21/12/2018 – – – Citigroup 03/03/2019 108,000,000 244,569 0.08 Goldman Sachs 04/07/2019 7,600,000,000 (155,886) (0.05) Goldman Sachs 10/08/2019 4,700,000,000 (18,380) (0.01) Citigroup 13/09/2019 209,000,000 (57,019) (0.02) Citigroup 14/09/2019 274,000,000 (218,555) (0.07) HSBC 03/10/2020 100,000,000 (11,324) 0.00 Citigroup 03/10/2020 135,000,000 69,813 0.02 Citigroup 10/12/2020 125,000,000 5,834 0.00 Citigroup 10/12/2020 125,000,000 (5,834) 0.00 Citigroup 07/07/2021 28,000,000 (44,288) (0.01) Citigroup 15/09/2021 82,000,000 (86,575) (0.03) HSBC 19/09/2021 92,000,000 (435,344) (0.14) Merrill Lynch 19/09/2021 92,000,000 115,968 0.04 Morgan Stanley 21/09/2021 3,220,000,000 (252,678) (0.08) BNP Paribas 21/09/2021 75,000,000 108,930 0.03 Citigroup 21/09/2021 82,000,000 88,557 0.03 Goldman Sachs 21/09/2021 3,220,000,000 62,834 0.02
Over 5 years Nomura 30/09/2021 22,200,000,000 24,086 0.01 Goldman Sachs 21/12/2021 289,000,000 44,274 0.01 Goldman Sachs 21/12/2021 1,570,000,000 34,074 0.01 Goldman Sachs 21/12/2021 1,570,000,000 34,074 0.01 HSBC 02/01/2025 15,554,463 497,688 0.16 HSBC 02/01/2025 16,604,363 (120,060) (0.04) Deutsche Bank 02/01/2025 – – – Deutsche Bank 02/01/2025 – – – JPMorgan Chase & Co 02/01/2025 17,315,414 167,106 0.05 Deutsche Bank 02/01/2025 16,305,693 (77,749) (0.03) JPMorgan Chase & Co 02/01/2025 16,756,568 61,888 0.02 Citigroup 10/05/2026 473,000,000 (217,539) (0.07) Citigroup 07/06/2026 48,000,000 861,297 0.27 Goldman Sachs 21/09/2026 22,500,000,000 (19,043) (0.01) Citigroup 21/09/2026 50,000,000 (13,371) 0.00 Goldman Sachs 21/09/2036 11,600,000,000 (4,372) 0.00 Nomura 30/09/2036 22,200,000,000 (88,563) (0.03) Citigroup 21/09/2046 4,100,000 (73,724) (0.02)
Unrealised Gain on Interest Rate Swaps 5,204,703 1.65
Unrealised Loss on Interest Rate Swaps (3,526,937) (1.12)
Total Unrealised Gain on Interest Rate Swaps 1,677,766 0.53
PRINCIPAL GLOBAL INVESTORS FUNDS
PORTFOLIO OF INVESTMENTS AS AT 30 SEPTEMBER 2016 (continued)
91
FINISTERRE EMERGING MARKET DEBT FUND (continued)
Cross Currency Swaps (0.05%) (30 September 2015: 0.00%)
Description Maturity Notional Amount
Fair Value US$
% Net Assets
1 to 5 Years Morgan Stanley 21/12/2017 (29,850,000) (33,271) (0.01) Morgan Stanley 28/09/2021 (8,714,420,000) (304,628) (0.10) Morgan Stanley 28/09/2021 (2,611,180,000) (91,278) (0.03)
Over 5 years HSBC 25/01/2026 (154,660,000) 287,223 0.09
Total Gain on Cross Currency Swaps 287,223 0.09 Total Loss on Cross Currency Swaps (429,177) (0.14)
Total Unrealised Loss on Cross Currency Swaps (141,954) (0.05)
Forward Rate Agreements (0.09%) (30 September 2015: 0.00%)
Description Maturity Notional Amount
Fair Value US$
% Net Assets
Up to 1 year Barclays 02/06/2017 6,200,000,000 (278,642) (0.09)
Total Loss on Forward Rate Agreements (278,642) (0.09)
Total Unrealised Loss on Forward Rate Agreements (278,642) (0.09)
Cash at Bank 13,804,394 4.39 Bank Overdraft (522,908) (0.17) Net Current Assets 64,269,973 20.45 Net Assets Attributable to Holders of Redeemable Participating Units at Mid Market Prices 314,465,035 100.00
Analysis of Total Assets % Total Assets
Transferable Securities and Money Market Instruments admitted to an official stock exchange listing or traded on a regulated market 54.66
Financial Derivative instruments dealt in or on a regulated market (0.86)
Other Assets 46.20
Total Assets 100.00
All securities are transferable securities admitted to an official stock exchange listing.
The counterparties for the forward foreign currency exchange contracts are the Bank of New York Mellon, Citigroup, Deutsche Bank, HSBC, Societe Generale, Standard Bank and State Street Global Markets. The counterparty for the open spot currency contracts are Citigroup, Deutsche Bank, JPMorgan Chase & Co, Standard Bank and State Street Global Markets. The counterparty for the future contracts is Citigroup. The counterparty for the option contracts is Citigroup. The counterparties for the credit default swaps are Barclays, BNP Paribas, Citigroup, Goldman Sachs and HSBC. The counterparties for the cross currency swaps are HSBC and Morgan Stanley. The counterparties for the interest rate swaps are Bank of America Merrill Lynch, BNP Paribas, Citigroup, Deutsche Bank, Goldman Sachs, HSBC, JPMorgan Chase & Co, Morgan Stanley, Nomura and Societe Generale. The counterparty for the Forward Rate Agreements is Barclays.
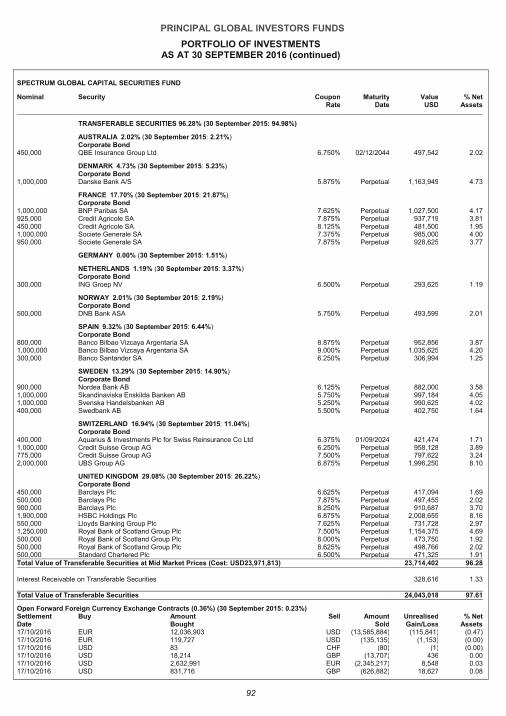
PRINCIPAL GLOBAL INVESTORS FUNDS
PORTFOLIO OF INVESTMENTS AS AT 30 SEPTEMBER 2016 (continued)
92
SPECTRUM GLOBAL CAPITAL SECURITIES FUND
Nominal Security Coupon Rate
Maturity Date
Value USD
% Net Assets
TRANSFERABLE SECURITIES 96.28% (30 September 2015: 94.98%)
AUSTRALIA 2.02% (30 September 2015: 2.21%) Corporate Bond
450,000 QBE Insurance Group Ltd 6.750% 02/12/2044 497,542 2.02
DENMARK 4.73% (30 September 2015: 5.23%) Corporate Bond
1,000,000 Danske Bank A/S 5.875% Perpetual 1,163,949 4.73
FRANCE 17.70% (30 September 2015: 21.87%) Corporate Bond
1,000,000 BNP Paribas SA 7.625% Perpetual 1,027,500 4.17 925,000 Credit Agricole SA 7.875% Perpetual 937,719 3.81 450,000 Credit Agricole SA 8.125% Perpetual 481,500 1.95 1,000,000 Societe Generale SA 7.375% Perpetual 985,000 4.00 950,000 Societe Generale SA 7.875% Perpetual 928,625 3.77
GERMANY 0.00% (30 September 2015: 1.51%)
NETHERLANDS 1.19% (30 September 2015: 3.37%) Corporate Bond
300,000 ING Groep NV 6.500% Perpetual 293,625 1.19
NORWAY 2.01% (30 September 2015: 2.19%) Corporate Bond
500,000 DNB Bank ASA 5.750% Perpetual 493,599 2.01
SPAIN 9.32% (30 September 2015: 6.44%) Corporate Bond
800,000 Banco Bilbao Vizcaya Argentaria SA 8.875% Perpetual 952,856 3.87 1,000,000 Banco Bilbao Vizcaya Argentaria SA 9.000% Perpetual 1,035,625 4.20 300,000 Banco Santander SA 6.250% Perpetual 306,994 1.25
SWEDEN 13.29% (30 September 2015: 14.90%) Corporate Bond
900,000 Nordea Bank AB 6.125% Perpetual 882,000 3.58 1,000,000 Skandinaviska Enskilda Banken AB 5.750% Perpetual 997,184 4.05 1,000,000 Svenska Handelsbanken AB 5.250% Perpetual 990,625 4.02 400,000 Swedbank AB 5.500% Perpetual 402,750 1.64
SWITZERLAND 16.94% (30 September 2015: 11.04%) Corporate Bond
400,000 Aquarius & Investments Plc for Swiss Reinsurance Co Ltd 6.375% 01/09/2024 421,474 1.71 1,000,000 Credit Suisse Group AG 6.250% Perpetual 958,128 3.89 775,000 Credit Suisse Group AG 7.500% Perpetual 797,622 3.24 2,000,000 UBS Group AG 6.875% Perpetual 1,996,250 8.10
UNITED KINGDOM 29.08% (30 September 2015: 26.22%) Corporate Bond
450,000 Barclays Plc 6.625% Perpetual 417,094 1.69 500,000 Barclays Plc 7.875% Perpetual 497,455 2.02 900,000 Barclays Plc 8.250% Perpetual 910,687 3.70 1,900,000 HSBC Holdings Plc 6.875% Perpetual 2,008,655 8.16 550,000 Lloyds Banking Group Plc 7.625% Perpetual 731,728 2.97 1,250,000 Royal Bank of Scotland Group Plc 7.500% Perpetual 1,154,375 4.69 500,000 Royal Bank of Scotland Group Plc 8.000% Perpetual 473,750 1.92 500,000 Royal Bank of Scotland Group Plc 8.625% Perpetual 498,766 2.02 500,000 Standard Chartered Plc 6.500% Perpetual 471,325 1.91 Total Value of Transferable Securities at Mid Market Prices (Cost: USD23,971,813) 23,714,402 96.28
Interest Receivable on Transferable Securities 328,616 1.33
Total Value of Transferable Securities 24,043,018 97.61
Open Forward Foreign Currency Exchange Contracts (0.36%) (30 September 2015: 0.23%) Settlement Date
Buy Amount Bought
Sell Amount Sold
Unrealised Gain/Loss
% Net Assets
17/10/2016 EUR 12,036,903 USD (13,585,884) (115,841) (0 .47)
17/10/2016 EUR 119,727 USD (135,135) (1,153) (0 .00)
17/10/2016 USD 83 CHF (80) (1) (0 .00)
17/10/2016 USD 18,214 GBP (13,707) 436 0 .00
17/10/2016 USD 2,632,991 EUR (2,345,217) 8,548 0 .03
17/10/2016 USD 831,716 GBP (626,882) 18,627 0 .08
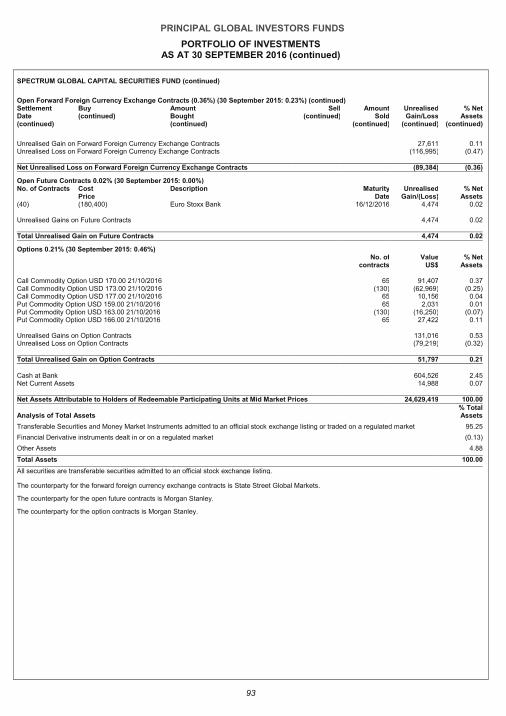
PRINCIPAL GLOBAL INVESTORS FUNDS
PORTFOLIO OF INVESTMENTS AS AT 30 SEPTEMBER 2016 (continued)
93
SPECTRUM GLOBAL CAPITAL SECURITIES FUND (continued)
Open Forward Foreign Currency Exchange Contracts (0.36%) (30 September 2015: 0.23%) (continued) Settlement Date (continued)
Buy (continued)
Amount Bought (continued)
Sell (continued)
Amount Sold
(continued)
Unrealised Gain/Loss
(continued)
% Net Assets
(continued)
Unrealised Gain on Forward Foreign Currency Exchange Contracts 27,611 0 .11
Unrealised Loss on Forward Foreign Currency Exchange Contracts (116,995) (0 .47)
Net Unrealised Loss on Forward Foreign Currency Exchange Contracts (89,384) (0 .36)
Open Future Contracts 0.02% (30 September 2015: 0.00%) No. of Contracts Cost Description Maturity Unrealised % Net Price Date Gain/(Loss) Assets (40) (180,400) Euro Stoxx Bank 16/12/2016 4,474 0.02
Unrealised Gains on Future Contracts 4,474 0.02
Total Unrealised Gain on Future Contracts 4,474 0.02
Options 0.21% (30 September 2015: 0.46%)
No. of
contracts Value
US$ % Net
Assets
Call Commodity Option USD 170.00 21/10/2016 65 91,407 0.37 Call Commodity Option USD 173.00 21/10/2016 (130) (62,969) (0.25) Call Commodity Option USD 177.00 21/10/2016 65 10,156 0.04 Put Commodity Option USD 159.00 21/10/2016 65 2,031 0.01 Put Commodity Option USD 163.00 21/10/2016 (130) (16,250) (0.07) Put Commodity Option USD 166.00 21/10/2016 65 27,422 0.11
Unrealised Gains on Option Contracts 131,016 0.53 Unrealised Loss on Option Contracts (79,219) (0.32) Total Unrealised Gain on Option Contracts 51,797 0.21
Cash at Bank 604,526 2.45 Net Current Assets 14,988 0.07 Net Assets Attributable to Holders of Redeemable Participating Units at Mid Market Prices 24,629,419 100.00
Analysis of Total Assets % Total Assets
Transferable Securities and Money Market Instruments admitted to an official stock exchange listing or traded on a regulated market 95.25
Financial Derivative instruments dealt in or on a regulated market (0.13)
Other Assets 4.88
Total Assets 100.00
All securities are transferable securities admitted to an official stock exchange listing.
The counterparty for the forward foreign currency exchange contracts is State Street Global Markets.
The counterparty for the open future contracts is Morgan Stanley.
The counterparty for the option contracts is Morgan Stanley.
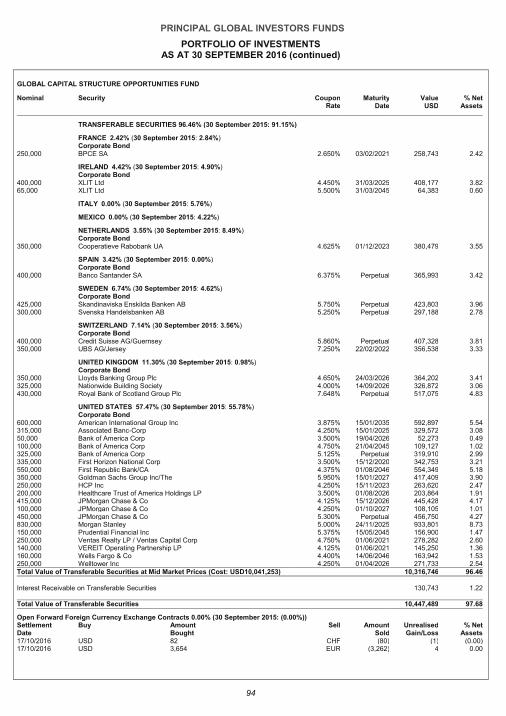
PRINCIPAL GLOBAL INVESTORS FUNDS
PORTFOLIO OF INVESTMENTS AS AT 30 SEPTEMBER 2016 (continued)
94
GLOBAL CAPITAL STRUCTURE OPPORTUNITIES FUND
Nominal Security Coupon Rate
Maturity Date
Value USD
% Net Assets
TRANSFERABLE SECURITIES 96.46% (30 September 2015: 91.15%)
FRANCE 2.42% (30 September 2015: 2.84%) Corporate Bond
250,000 BPCE SA 2.650% 03/02/2021 258,743 2.42
IRELAND 4.42% (30 September 2015: 4.90%) Corporate Bond
400,000 XLIT Ltd 4.450% 31/03/2025 408,177 3.82 65,000 XLIT Ltd 5.500% 31/03/2045 64,383 0.60
ITALY 0.00% (30 September 2015: 5.76%)
MEXICO 0.00% (30 September 2015: 4.22%)
NETHERLANDS 3.55% (30 September 2015: 8.49%) Corporate Bond
350,000 Cooperatieve Rabobank UA 4.625% 01/12/2023 380,479 3.55
SPAIN 3.42% (30 September 2015: 0.00%) Corporate Bond
400,000 Banco Santander SA 6.375% Perpetual 365,993 3.42
SWEDEN 6.74% (30 September 2015: 4.62%) Corporate Bond
425,000 Skandinaviska Enskilda Banken AB 5.750% Perpetual 423,803 3.96 300,000 Svenska Handelsbanken AB 5.250% Perpetual 297,188 2.78
SWITZERLAND 7.14% (30 September 2015: 3.56%) Corporate Bond
400,000 Credit Suisse AG/Guernsey 5.860% Perpetual 407,328 3.81 350,000 UBS AG/Jersey 7.250% 22/02/2022 356,538 3.33
UNITED KINGDOM 11.30% (30 September 2015: 0.98%) Corporate Bond
350,000 Lloyds Banking Group Plc 4.650% 24/03/2026 364,202 3.41 325,000 Nationwide Building Society 4.000% 14/09/2026 326,872 3.06 430,000 Royal Bank of Scotland Group Plc 7.648% Perpetual 517,075 4.83
UNITED STATES 57.47% (30 September 2015: 55.78%) Corporate Bond
600,000 American International Group Inc 3.875% 15/01/2035 592,897 5.54 315,000 Associated Banc-Corp 4.250% 15/01/2025 329,572 3.08 50,000 Bank of America Corp 3.500% 19/04/2026 52,273 0.49 100,000 Bank of America Corp 4.750% 21/04/2045 109,127 1.02 325,000 Bank of America Corp 5.125% Perpetual 319,910 2.99 335,000 First Horizon National Corp 3.500% 15/12/2020 342,753 3.21 550,000 First Republic Bank/CA 4.375% 01/08/2046 554,349 5.18 350,000 Goldman Sachs Group Inc/The 5.950% 15/01/2027 417,409 3.90 250,000 HCP Inc 4.250% 15/11/2023 263,620 2.47 200,000 Healthcare Trust of America Holdings LP 3.500% 01/08/2026 203,864 1.91 415,000 JPMorgan Chase & Co 4.125% 15/12/2026 445,428 4.17 100,000 JPMorgan Chase & Co 4.250% 01/10/2027 108,105 1.01 450,000 JPMorgan Chase & Co 5.300% Perpetual 456,750 4.27 830,000 Morgan Stanley 5.000% 24/11/2025 933,801 8.73 150,000 Prudential Financial Inc 5.375% 15/05/2045 156,900 1.47 250,000 Ventas Realty LP / Ventas Capital Corp 4.750% 01/06/2021 278,282 2.60 140,000 VEREIT Operating Partnership LP 4.125% 01/06/2021 145,250 1.36 160,000 Wells Fargo & Co 4.400% 14/06/2046 163,942 1.53 250,000 Welltower Inc 4.250% 01/04/2026 271,733 2.54 Total Value of Transferable Securities at Mid Market Prices (Cost: USD10,041,253) 10,316,746 96.46
Interest Receivable on Transferable Securities 130,743 1.22
Total Value of Transferable Securities 10,447,489 97.68
Open Forward Foreign Currency Exchange Contracts 0.00% (30 September 2015: (0.00%)) Settlement Date
Buy Amount Bought
Sell Amount Sold
Unrealised Gain/Loss
% Net Assets
17/10/2016 USD 82 CHF (80) (1) (0 .00)
17/10/2016 USD 3,654 EUR (3,262) 4 0 .00
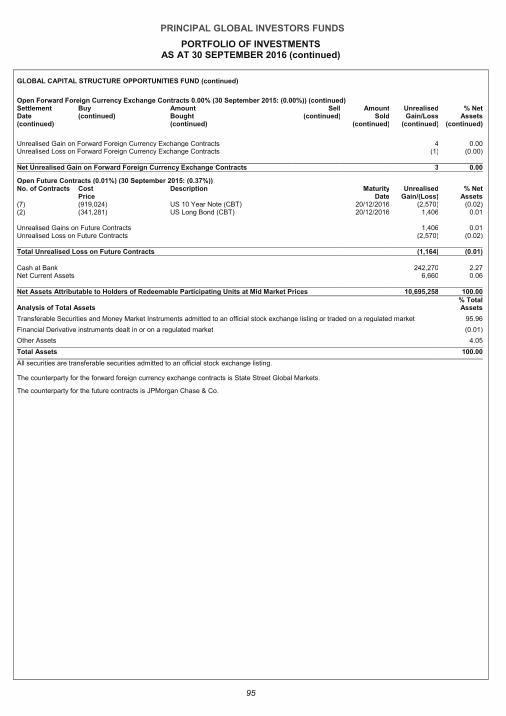
PRINCIPAL GLOBAL INVESTORS FUNDS
PORTFOLIO OF INVESTMENTS AS AT 30 SEPTEMBER 2016 (continued)
95
GLOBAL CAPITAL STRUCTURE OPPORTUNITIES FUND (continued)
Open Forward Foreign Currency Exchange Contracts 0.00% (30 September 2015: (0.00%)) (continued) Settlement Date (continued)
Buy (continued)
Amount Bought (continued)
Sell (continued)
Amount Sold
(continued)
Unrealised Gain/Loss
(continued)
% Net Assets
(continued)
Unrealised Gain on Forward Foreign Currency Exchange Contracts 4 0 .00
Unrealised Loss on Forward Foreign Currency Exchange Contracts (1) (0 .00)
Net Unrealised Gain on Forward Foreign Currency Exchange Contracts 3 0 .00
Open Future Contracts (0.01%) (30 September 2015: (0.37%)) No. of Contracts Cost Description Maturity Unrealised % Net Price Date Gain/(Loss) Assets (7) (919,024) US 10 Year Note (CBT) 20/12/2016 (2,570) (0.02) (2) (341,281) US Long Bond (CBT) 20/12/2016 1,406 0.01
Unrealised Gains on Future Contracts 1,406 0.01 Unrealised Loss on Future Contracts (2,570) (0.02)
Total Unrealised Loss on Future Contracts (1,164) (0.01)
Cash at Bank 242,270 2.27 Net Current Assets 6,660 0.06 Net Assets Attributable to Holders of Redeemable Participating Units at Mid Market Prices 10,695,258 100.00
Analysis of Total Assets % Total Assets
Transferable Securities and Money Market Instruments admitted to an official stock exchange listing or traded on a regulated market 95.96
Financial Derivative instruments dealt in or on a regulated market (0.01)
Other Assets 4.05
Total Assets 100.00
All securities are transferable securities admitted to an official stock exchange listing.
The counterparty for the forward foreign currency exchange contracts is State Street Global Markets.
The counterparty for the future contracts is JPMorgan Chase & Co.
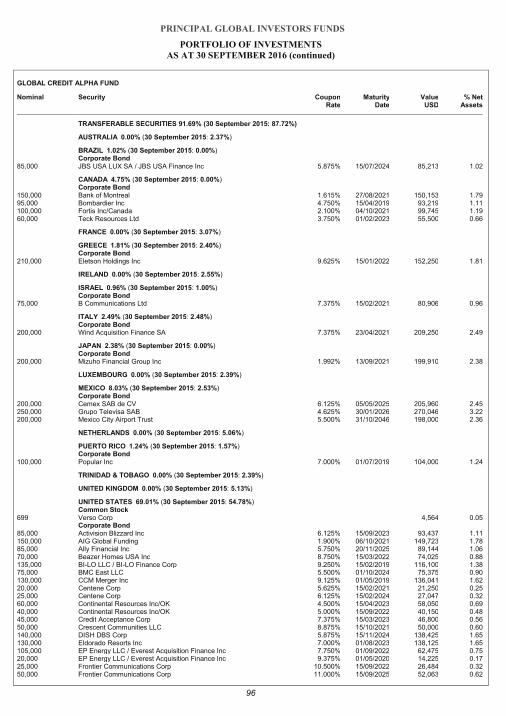
PRINCIPAL GLOBAL INVESTORS FUNDS
PORTFOLIO OF INVESTMENTS
AS AT 30 SEPTEMBER 2016 (continued)
96
GLOBAL CREDIT ALPHA FUND
Nominal Security Coupon Rate
Maturity Date
Value USD
% Net Assets
TRANSFERABLE SECURITIES 91.69% (30 September 2015: 87.72%)
AUSTRALIA 0.00% (30 September 2015: 2.37%)
BRAZIL 1.02% (30 September 2015: 0.00%) Corporate Bond
85,000 JBS USA LUX SA / JBS USA Finance Inc 5.875% 15/07/2024 85,213 1.02
CANADA 4.75% (30 September 2015: 0.00%) Corporate Bond
150,000 Bank of Montreal 1.615% 27/08/2021 150,153 1.79 95,000 Bombardier Inc 4.750% 15/04/2019 93,219 1.11 100,000 Fortis Inc/Canada 2.100% 04/10/2021 99,745 1.19 60,000 Teck Resources Ltd 3.750% 01/02/2023 55,500 0.66
FRANCE 0.00% (30 September 2015: 3.07%)
GREECE 1.81% (30 September 2015: 2.40%) Corporate Bond
210,000 Eletson Holdings Inc 9.625% 15/01/2022 152,250 1.81
IRELAND 0.00% (30 September 2015: 2.55%)
ISRAEL 0.96% (30 September 2015: 1.00%) Corporate Bond
75,000 B Communications Ltd 7.375% 15/02/2021 80,906 0.96
ITALY 2.49% (30 September 2015: 2.48%) Corporate Bond
200,000 Wind Acquisition Finance SA 7.375% 23/04/2021 209,250 2.49
JAPAN 2.38% (30 September 2015: 0.00%) Corporate Bond
200,000 Mizuho Financial Group Inc 1.992% 13/09/2021 199,910 2.38
LUXEMBOURG 0.00% (30 September 2015: 2.39%)
MEXICO 8.03% (30 September 2015: 2.53%) Corporate Bond
200,000 Cemex SAB de CV 6.125% 05/05/2025 205,960 2.45 250,000 Grupo Televisa SAB 4.625% 30/01/2026 270,046 3.22 200,000 Mexico City Airport Trust 5.500% 31/10/2046 198,000 2.36
NETHERLANDS 0.00% (30 September 2015: 5.06%)
PUERTO RICO 1.24% (30 September 2015: 1.57%) Corporate Bond
100,000 Popular Inc 7.000% 01/07/2019 104,000 1.24
TRINIDAD & TOBAGO 0.00% (30 September 2015: 2.39%)
UNITED KINGDOM 0.00% (30 September 2015: 5.13%)
UNITED STATES 69.01% (30 September 2015: 54.78%) Common Stock
699 Verso Corp 4,564 0.05 Corporate Bond
85,000 Activision Blizzard Inc 6.125% 15/09/2023 93,437 1.11 150,000 AIG Global Funding 1.900% 06/10/2021 149,723 1.78 85,000 Ally Financial Inc 5.750% 20/11/2025 89,144 1.06 70,000 Beazer Homes USA Inc 8.750% 15/03/2022 74,025 0.88 135,000 BI-LO LLC / BI-LO Finance Corp 9.250% 15/02/2019 116,100 1.38 75,000 BMC East LLC 5.500% 01/10/2024 75,375 0.90 130,000 CCM Merger Inc 9.125% 01/05/2019 136,041 1.62 20,000 Centene Corp 5.625% 15/02/2021 21,250 0.25 25,000 Centene Corp 6.125% 15/02/2024 27,047 0.32 60,000 Continental Resources Inc/OK 4.500% 15/04/2023 58,050 0.69 40,000 Continental Resources Inc/OK 5.000% 15/09/2022 40,150 0.48 45,000 Credit Acceptance Corp 7.375% 15/03/2023 46,800 0.56 50,000 Crescent Communities LLC 8.875% 15/10/2021 50,000 0.60 140,000 DISH DBS Corp 5.875% 15/11/2024 138,425 1.65 130,000 Eldorado Resorts Inc 7.000% 01/08/2023 138,125 1.65 105,000 EP Energy LLC / Everest Acquisition Finance Inc 7.750% 01/09/2022 62,475 0.75 20,000 EP Energy LLC / Everest Acquisition Finance Inc 9.375% 01/05/2020 14,225 0.17 25,000 Frontier Communications Corp 10.500% 15/09/2022 26,484 0.32 50,000 Frontier Communications Corp 11.000% 15/09/2025 52,063 0.62
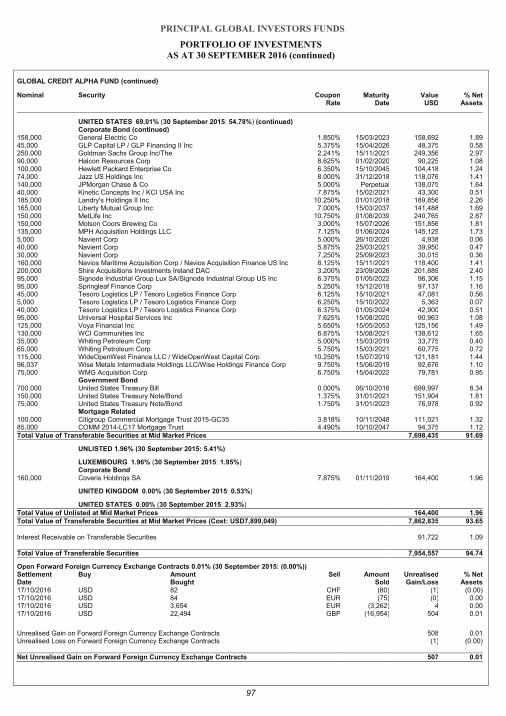
PRINCIPAL GLOBAL INVESTORS FUNDS
PORTFOLIO OF INVESTMENTS
AS AT 30 SEPTEMBER 2016 (continued)
97
GLOBAL CREDIT ALPHA FUND (continued)
Nominal Security Coupon Rate
Maturity Date
Value USD
% Net Assets
UNITED STATES 69.01% (30 September 2015: 54.78%) (continued) Corporate Bond (continued)
158,000 General Electric Co 1.850% 15/03/2023 158,692 1.89 45,000 GLP Capital LP / GLP Financing II Inc 5.375% 15/04/2026 48,375 0.58 250,000 Goldman Sachs Group Inc/The 2.241% 15/11/2021 249,356 2.97 90,000 Halcon Resources Corp 8.625% 01/02/2020 90,225 1.08 100,000 Hewlett Packard Enterprise Co 6.350% 15/10/2045 104,418 1.24 74,000 Jazz US Holdings Inc 8.000% 31/12/2018 118,076 1.41 140,000 JPMorgan Chase & Co 5.000% Perpetual 138,075 1.64 40,000 Kinetic Concepts Inc / KCI USA Inc 7.875% 15/02/2021 43,300 0.51 185,000 Landry's Holdings II Inc 10.250% 01/01/2018 189,856 2.26 165,000 Liberty Mutual Group Inc 7.000% 15/03/2037 141,488 1.69 150,000 MetLife Inc 10.750% 01/08/2039 240,765 2.87 150,000 Molson Coors Brewing Co 3.000% 15/07/2026 151,856 1.81 135,000 MPH Acquisition Holdings LLC 7.125% 01/06/2024 145,125 1.73 5,000 Navient Corp 5.000% 26/10/2020 4,938 0.06 40,000 Navient Corp 5.875% 25/03/2021 39,950 0.47 30,000 Navient Corp 7.250% 25/09/2023 30,015 0.36 160,000 Navios Maritime Acquisition Corp / Navios Acquisition Finance US Inc 8.125% 15/11/2021 118,400 1.41 200,000 Shire Acquisitions Investments Ireland DAC 3.200% 23/09/2026 201,889 2.40 95,000 Signode Industrial Group Lux SA/Signode Industrial Group US Inc 6.375% 01/05/2022 96,306 1.15 95,000 Springleaf Finance Corp 5.250% 15/12/2019 97,137 1.16 45,000 Tesoro Logistics LP / Tesoro Logistics Finance Corp 6.125% 15/10/2021 47,081 0.56 5,000 Tesoro Logistics LP / Tesoro Logistics Finance Corp 6.250% 15/10/2022 5,363 0.07 40,000 Tesoro Logistics LP / Tesoro Logistics Finance Corp 6.375% 01/05/2024 42,900 0.51 95,000 Universal Hospital Services Inc 7.625% 15/08/2020 90,963 1.08 125,000 Voya Financial Inc 5.650% 15/05/2053 125,156 1.49 130,000 WCI Communities Inc 6.875% 15/08/2021 138,612 1.65 35,000 Whiting Petroleum Corp 5.000% 15/03/2019 33,775 0.40 65,000 Whiting Petroleum Corp 5.750% 15/03/2021 60,775 0.72 115,000 WideOpenWest Finance LLC / WideOpenWest Capital Corp 10.250% 15/07/2019 121,181 1.44 96,037 Wise Metals Intermediate Holdings LLC/Wise Holdings Finance Corp 9.750% 15/06/2019 92,676 1.10 75,000 WMG Acquisition Corp 6.750% 15/04/2022 79,781 0.95
Government Bond 700,000 United States Treasury Bill 0.000% 06/10/2016 699,997 8.34 150,000 United States Treasury Note/Bond 1.375% 31/01/2021 151,904 1.81 75,000 United States Treasury Note/Bond 1.750% 31/01/2023 76,978 0.92
Mortgage Related 100,000 Citigroup Commercial Mortgage Trust 2015-GC35 3.818% 10/11/2048 111,021 1.32 85,000 COMM 2014-LC17 Mortgage Trust 4.490% 10/10/2047 94,375 1.12 Total Value of Transferable Securities at Mid Market Prices 7,698,435 91.69
UNLISTED 1.96% (30 September 2015: 5.41%)
LUXEMBOURG 1.96% (30 September 2015: 1.95%) Corporate Bond
160,000 Coveris Holdings SA 7.875% 01/11/2019 164,400 1.96
UNITED KINGDOM 0.00% (30 September 2015: 0.53%)
UNITED STATES 0.00% (30 September 2015: 2.93%) Total Value of Unlisted at Mid Market Prices 164,400 1.96 Total Value of Transferable Securities at Mid Market Prices (Cost: USD7,899,049) 7,862,835 93.65
Interest Receivable on Transferable Securities 91,722 1.09
Total Value of Transferable Securities 7,954,557 94.74
Open Forward Foreign Currency Exchange Contracts 0.01% (30 September 2015: (0.00%)) Settlement Date
Buy Amount Bought
Sell Amount Sold
Unrealised Gain/Loss
% Net Assets
17/10/2016 USD 82 CHF (80) (1) (0 .00)
17/10/2016 USD 84 EUR (75) (0) 0 .00
17/10/2016 USD 3,654 EUR (3,262) 4 0 .00
17/10/2016 USD 22,494 GBP (16,954) 504 0 .01
Unrealised Gain on Forward Foreign Currency Exchange Contracts 508 0 .01
Unrealised Loss on Forward Foreign Currency Exchange Contracts (1) (0 .00)
Net Unrealised Gain on Forward Foreign Currency Exchange Contracts 507 0 .01
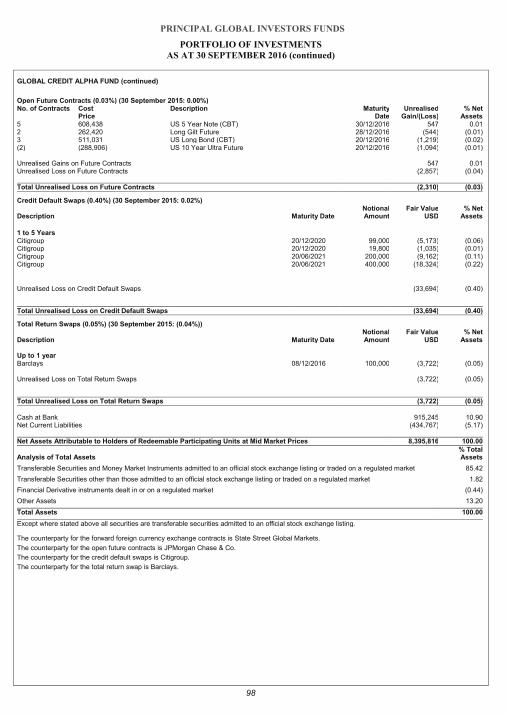
PRINCIPAL GLOBAL INVESTORS FUNDS
PORTFOLIO OF INVESTMENTS
AS AT 30 SEPTEMBER 2016 (continued)
98
GLOBAL CREDIT ALPHA FUND (continued)
Open Future Contracts (0.03%) (30 September 2015: 0.00%) No. of Contracts Cost Description Maturity Unrealised % Net Price Date Gain/(Loss) Assets 5 608,438 US 5 Year Note (CBT) 30/12/2016 547 0.01 2 262,420 Long Gilt Future 28/12/2016 (544) (0.01) 3 511,031 US Long Bond (CBT) 20/12/2016 (1,219) (0.02) (2) (288,906) US 10 Year Ultra Future 20/12/2016 (1,094) (0.01)
Unrealised Gains on Future Contracts 547 0.01 Unrealised Loss on Future Contracts (2,857) (0.04)
Total Unrealised Loss on Future Contracts (2,310) (0.03)
Credit Default Swaps (0.40%) (30 September 2015: 0.02%)
Description Maturity Date Notional Amount
Fair Value USD
% Net Assets
1 to 5 Years Citigroup 20/12/2020 99,000 (5,173) (0.06) Citigroup 20/12/2020 19,800 (1,035) (0.01) Citigroup 20/06/2021 200,000 (9,162) (0.11) Citigroup 20/06/2021 400,000 (18,324) (0.22)
Unrealised Loss on Credit Default Swaps (33,694) (0.40)
Total Unrealised Loss on Credit Default Swaps (33,694) (0.40)
Total Return Swaps (0.05%) (30 September 2015: (0.04%))
Description Maturity Date Notional Amount
Fair Value USD
% Net Assets
Up to 1 year Barclays 08/12/2016 100,000 (3,722) (0.05)
Unrealised Loss on Total Return Swaps (3,722) (0.05)
Total Unrealised Loss on Total Return Swaps (3,722) (0.05)
Cash at Bank 915,245 10.90 Net Current Liabilities (434,767) (5.17) Net Assets Attributable to Holders of Redeemable Participating Units at Mid Market Prices 8,395,816 100.00
Analysis of Total Assets % Total Assets
Transferable Securities and Money Market Instruments admitted to an official stock exchange listing or traded on a regulated market 85.42
Transferable Securities other than those admitted to an official stock exchange listing or traded on a regulated market 1.82
Financial Derivative instruments dealt in or on a regulated market (0.44)
Other Assets 13.20
Total Assets 100.00
Except where stated above all securities are transferable securities admitted to an official stock exchange listing.
The counterparty for the forward foreign currency exchange contracts is State Street Global Markets.
The counterparty for the open future contracts is JPMorgan Chase & Co.
The counterparty for the credit default swaps is Citigroup.
The counterparty for the total return swap is Barclays.
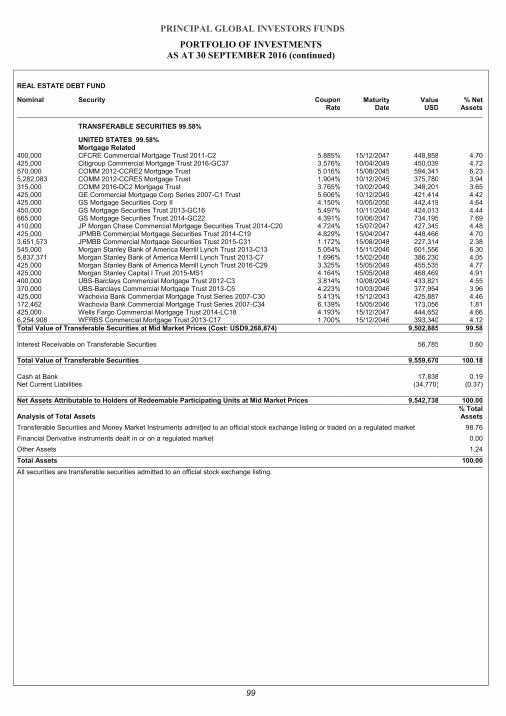
PRINCIPAL GLOBAL INVESTORS FUNDS
PORTFOLIO OF INVESTMENTS
AS AT 30 SEPTEMBER 2016 (continued)
99
REAL ESTATE DEBT FUND
Nominal Security Coupon Rate
Maturity Date
Value USD
% Net Assets
TRANSFERABLE SECURITIES 99.58%
UNITED STATES 99.58% Mortgage Related
400,000 CFCRE Commercial Mortgage Trust 2011-C2 5.885% 15/12/2047 448,858 4.70 425,000 Citigroup Commercial Mortgage Trust 2016-GC37 3.576% 10/04/2049 450,039 4.72 570,000 COMM 2012-CCRE2 Mortgage Trust 5.016% 15/08/2045 594,341 6.23 5,282,083 COMM 2012-CCRE5 Mortgage Trust 1.904% 10/12/2045 375,780 3.94 315,000 COMM 2016-DC2 Mortgage Trust 3.765% 10/02/2049 348,201 3.65 425,000 GE Commercial Mortgage Corp Series 2007-C1 Trust 5.606% 10/12/2049 421,414 4.42 425,000 GS Mortgage Securities Corp II 4.150% 10/05/2050 442,419 4.64 450,000 GS Mortgage Securities Trust 2013-GC16 5.497% 10/11/2046 424,013 4.44 665,000 GS Mortgage Securities Trust 2014-GC22 4.391% 10/06/2047 734,195 7.69 410,000 JP Morgan Chase Commercial Mortgage Securities Trust 2014-C20 4.724% 15/07/2047 427,345 4.48 425,000 JPMBB Commercial Mortgage Securities Trust 2014-C19 4.829% 15/04/2047 448,466 4.70 3,651,573 JPMBB Commercial Mortgage Securities Trust 2015-C31 1.172% 15/08/2048 227,314 2.38 545,000 Morgan Stanley Bank of America Merrill Lynch Trust 2013-C13 5.054% 15/11/2046 601,556 6.30 5,837,371 Morgan Stanley Bank of America Merrill Lynch Trust 2013-C7 1.696% 15/02/2046 386,230 4.05 425,000 Morgan Stanley Bank of America Merrill Lynch Trust 2016-C29 3.325% 15/05/2049 455,535 4.77 425,000 Morgan Stanley Capital I Trust 2015-MS1 4.164% 15/05/2048 468,469 4.91 400,000 UBS-Barclays Commercial Mortgage Trust 2012-C3 3.814% 10/08/2049 433,821 4.55 370,000 UBS-Barclays Commercial Mortgage Trust 2013-C5 4.223% 10/03/2046 377,954 3.96 425,000 Wachovia Bank Commercial Mortgage Trust Series 2007-C30 5.413% 15/12/2043 425,887 4.46 172,462 Wachovia Bank Commercial Mortgage Trust Series 2007-C34 6.139% 15/05/2046 173,056 1.81 425,000 Wells Fargo Commercial Mortgage Trust 2014-LC18 4.193% 15/12/2047 444,652 4.66 6,254,908 WFRBS Commercial Mortgage Trust 2013-C17 1.700% 15/12/2046 393,340 4.12 Total Value of Transferable Securities at Mid Market Prices (Cost: USD9,268,874) 9,502,885 99.58
Interest Receivable on Transferable Securities 56,785 0.60
Total Value of Transferable Securities 9,559,670 100.18
Cash at Bank 17,838 0.19 Net Current Liabilities (34,770) (0.37) Net Assets Attributable to Holders of Redeemable Participating Units at Mid Market Prices 9,542,738 100.00
Analysis of Total Assets % Total Assets
Transferable Securities and Money Market Instruments admitted to an official stock exchange listing or traded on a regulated market 98.76
Financial Derivative instruments dealt in or on a regulated market 0.00
Other Assets 1.24
Total Assets 100.00
All securities are transferable securities admitted to an official stock exchange listing.
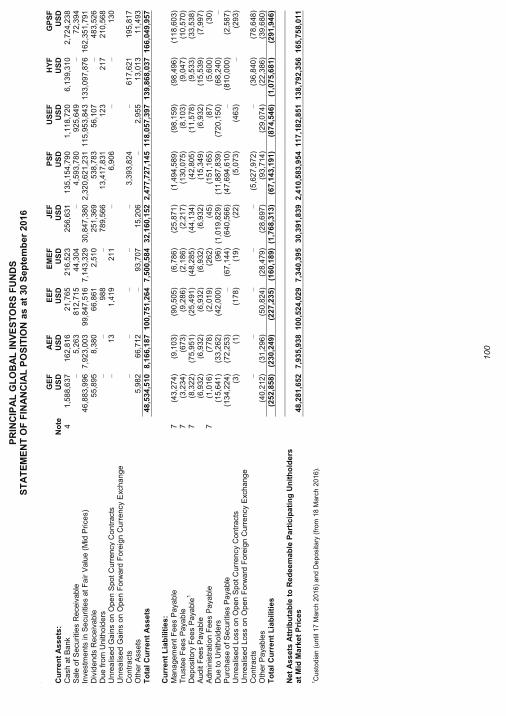
PR
INC
IPA
L G
LO
BA
L IN
VE
ST
OR
S F
UN
DS
S
TA
TE
ME
NT
OF
FIN
AN
CIA
L P
OS
ITIO
N a
s a
t 30
Se
pte
mb
er
201
6
100
kin
GE
F
AE
F
EE
F
EM
EF
J
EF
P
SF
U
SE
F
HY
F
GP
SF
C
urr
en
t A
ss
ets
: N
ote
U
SD
U
SD
U
SD
U
SD
U
SD
U
SD
U
SD
U
SD
U
SD
C
ash
at
Ba
nk
4
1,5
88
,63
7
16
2,8
16
21
,765
21
6,5
23
25
6,6
31
13
5,1
54
,79
0
1,1
18
,72
0
6,1
39
,31
0
2,7
24
,23
8
Sa
le o
f S
ecu
ritie
s R
eceiv
ab
le
–
5,2
63
81
2,7
15
44
,304
–
4,5
93
,78
0
92
5,6
49
–
72
,394
Inve
stm
en
ts in S
ecu
ritie
s a
t F
air
Va
lue
(M
id P
rice
s)
4
6,8
83
,996
7,9
23
,00
3
99
,847
,516
7,1
43
,32
9
30
,847
,380
2,3
20
,62
1,2
31
1
15
,95
3,8
43
13
3,0
97
,87
6
16
2,3
51
,79
1
Div
ide
nds R
ece
iva
ble
55
,895
8,3
80
66
,861
2,5
10
25
1,3
69
53
8,7
83
56
,107
–
48
3,5
26
Due
fro
m U
nith
old
ers
–
–
98
8
–
78
9,5
66
13
,417
,831
12
3
21
7
21
0,5
68
Unre
alis
ed G
ain
s o
n O
pe
n S
po
t C
urr
ency
Co
ntr
acts
–
13
1,4
19
21
1
–
6,9
06
–
–
13
0
Unre
alis
ed G
ain
s o
n O
pe
n F
orw
ard
Fo
reig
n C
urr
ency
Exc
ha
ng
e
Con
tra
cts
–
–
–
–
–
3,3
93
,82
4
–
61
7,6
21
19
5,8
17
Oth
er
Ass
ets
5,9
82
66
,712
–
93
,707
15
,206
–
2,9
55
13
,013
11
,493
To
tal
Cu
rre
nt
As
se
ts
4
8,5
34
,510
8,1
66
,18
7
10
0,7
51
,26
4
7,5
00
,58
4
32
,160
,152
2,4
77
,72
7,1
45
1
18
,05
7,3
97
13
9,8
68
,03
7
16
6,0
49
,95
7
C
urr
en
t L
iab
ilit
ies
:
M
an
ag
em
en
t F
ees P
aya
ble
7
(4
3,2
74
) (9
,10
3)
(90
,505
) (6
,78
6)
(25
,871
) (1
,49
4,5
89
) (9
8,1
59
) (9
8,4
96
) (1
18
,60
3)
Tru
ste
e F
ee
s P
aya
ble
7
(3
,23
4)
(67
3)
(9,2
86
) (2
,18
6)
(2,2
17
) (1
30
,07
5)
(8,1
03
) (9
,04
7)
(10
,570
) D
ep
osi
tory
Fe
es P
aya
ble
1
7
(8,3
22
) (7
5,9
51
) (2
5,4
91
) (4
8,2
85
) (4
4,1
34
) (4
2,8
05
) (1
1,5
78
) (9
,53
3)
(33
,538
) A
ud
it F
ee
s P
aya
ble
(6,9
32
) (6
,93
2)
(6,9
32
) (6
,93
2)
(6,9
32
) (1
5,3
49
) (6
,93
2)
(15
,539
) (7
,99
7)
Ad
min
istr
ation
Fee
s P
aya
ble
7
(1
,01
6)
(77
8)
(2,0
19
) (2
62
) (4
5)
(15
1,1
65
) (8
7)
(5,6
00
) (3
0)
Due
to
Unith
old
ers
(15
,641
) (3
3,2
62
) (4
2,0
00
) (9
6)
(1,0
19
,82
9)
(11
,887
,839
) (7
20
,15
0)
(68
,240
) –
Pu
rch
ase
of
Secu
ritie
s P
aya
ble
(13
4,2
24
) (7
2,2
53
) –
(67
,144
) (6
40
,56
6)
(47
,694
,610
) –
(81
0,0
00
) (2
,58
7)
Unre
alis
ed L
oss o
n O
pen
Sp
ot C
urr
en
cy
Co
ntr
act
s
(3
) (1
) (1
78
) (1
9)
(22
) (5
,07
3)
(46
3)
–
(29
3)
Unre
alis
ed L
oss o
n O
pen
Fo
rwa
rd F
ore
ign
Cu
rre
ncy
Exc
ha
ng
e
Con
tra
cts
–
–
–
–
–
(5,6
27
,97
2)
–
(36
,840
) (7
8,6
48
) O
the
r P
aya
ble
s
(4
0,2
12
) (3
1,2
96
) (5
0,8
24
) (2
8,4
79
) (2
8,6
97
) (9
3,7
14
) (2
9,0
74
) (2
2,3
86
) (3
9,6
80
) T
ota
l C
urr
en
t L
iab
ilit
ies
(25
2,8
58
) (2
30
,24
9)
(22
7,2
35
) (1
60
,18
9)
(1,7
68
,31
3)
(67
,143
,191
) (8
74
,54
6)
(1,0
75
,68
1)
(29
1,9
46
)
Net
As
se
ts A
ttri
bu
tab
le t
o R
ed
ee
ma
ble
Pa
rtic
ipa
tin
g U
nit
ho
lde
rs
at
Mid
Ma
rke
t P
ric
es
4
8,2
81
,652
7,9
35
,93
8
10
0,5
24
,02
9
7,3
40
,39
5
30
,391
,839
2,4
10
,58
3,9
54
1
17
,18
2,8
51
13
8,7
92
,35
6
16
5,7
58
,01
1
1C
usto
dia
n (
until
17 M
arc
h 2
016)
and D
epositary
(fr
om
18 M
arc
h 2
016).
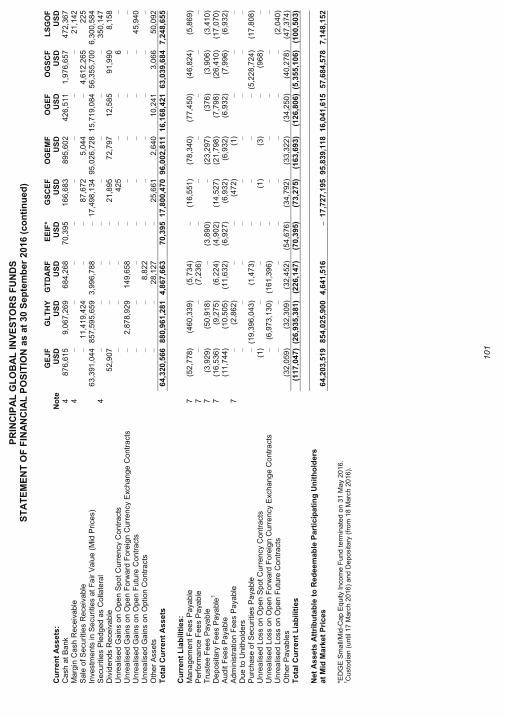
PR
INC
IPA
L G
LO
BA
L I
NV
ES
TO
RS
FU
ND
S
ST
AT
EM
EN
T O
F F
INA
NC
IAL
PO
SIT
ION
as a
t 30
Se
pte
mb
er
201
6 (
co
nti
nu
ed
)
101
GE
JF
G
LT
HY
G
TD
AR
F
EE
IF*
GS
CE
F
OG
EM
F
OG
EF
O
GS
CF
L
SG
OF
C
urr
en
t A
ss
ets
: N
ote
U
SD
U
SD
U
SD
U
SD
U
SD
U
SD
U
SD
U
SD
U
SD
C
ash
at
Ba
nk
4
87
6,6
15
9,0
67
,26
9
68
4,2
68
70
,395
16
6,6
83
89
5,6
02
42
6,5
11
1,9
76
,65
7
47
2,3
67
Ma
rgin
Ca
sh
Rece
iva
ble
4
–
–
–
–
–
–
–
–
21
,142
Sa
le o
f S
ecu
ritie
s R
eceiv
ab
le
–
11
,419
,424
–
–
87
,672
5,0
44
–
4,6
12
,26
5
22
5
Inve
stm
en
ts in S
ecu
ritie
s a
t F
air
Va
lue
(M
id P
rice
s)
6
3,3
91
,044
85
7,5
95
,65
9
3,9
96
,78
8
–
17
,498
,134
95
,026
,728
15
,719
,084
56
,355
,700
6,3
00
,58
4
Se
cu
rities P
led
ged
as C
olla
tera
l 4
–
–
–
–
–
–
–
–
35
0,1
47
Div
ide
nds R
ece
iva
ble
52
,907
–
–
–
21
,895
72
,797
12
,585
91
,990
8,1
58
Unre
alis
ed G
ain
s o
n O
pe
n S
po
t C
urr
ency
Co
ntr
acts
–
–
–
–
42
5
–
–
6
–
Unre
alis
ed G
ain
s o
n O
pe
n F
orw
ard
Fo
reig
n C
urr
ency
Exc
ha
ng
e C
ontr
act
s
–
2,8
78
,92
9
14
9,6
58
–
–
–
–
–
–
Unre
alis
ed G
ain
s o
n O
pe
n F
utu
re C
on
tra
cts
–
–
–
–
–
–
–
–
45
,940
Unre
alis
ed G
ain
s o
n O
ption
Co
ntr
acts
–
–
8,8
22
–
–
–
–
–
–
Oth
er
Ass
ets
–
–
28
,127
–
25
,661
2,6
40
10
,241
3,0
66
50
,092
To
tal
Cu
rre
nt
As
se
ts
6
4,3
20
,566
88
0,9
61
,28
1
4,8
67
,66
3
70
,395
17
,800
,470
96
,002
,811
16
,168
,421
63
,039
,684
7,2
48
,65
5
C
urr
en
t L
iab
ilit
ies
:
M
an
ag
em
en
t F
ees P
aya
ble
7
(5
2,7
78
) (4
60
,33
9)
(5,7
34
) –
(16
,551
) (7
8,3
40
) (7
7,4
50
) (4
6,8
24
) (5
,86
9)
Pe
rfo
rma
nce
Fee
s P
aya
ble
7
–
–
(7,2
36
) –
–
–
–
–
–
Tru
ste
e F
ee
s P
aya
ble
7
(3
,92
9)
(50
,918
) –
(3,8
90
) –
(23
,297
) (3
76
) (3
,90
6)
(3,4
10
) D
ep
osi
tary
Fe
es P
aya
ble
1
7
(16
,536
) (9
,27
5)
(6,2
24
) (4
,90
2)
(14
,527
) (2
1,7
98
) (7
,79
8)
(26
,410
) (1
7,0
70
) A
ud
it F
ee
s P
aya
ble
(11
,744
) (1
0,5
05
) (1
1,6
32
) (6
,92
7)
(6,9
32
) (6
,93
2)
(6,9
32
) (7
,99
6)
(6,9
32
) A
dm
inis
tra
tion
Fee
s P
aya
ble
7
–
(2,8
62
) –
–
(47
2)
(1)
–
–
–
Due
to
Unith
old
ers
–
–
–
–
–
–
–
–
–
Pu
rch
ase
of
Secu
ritie
s P
aya
ble
–
(19
,396
,043
) (1
,47
3)
–
–
–
– (5
,22
8,7
24
) (1
7,8
08
) U
nre
alis
ed L
oss o
n O
pen
Sp
ot C
urr
en
cy
Co
ntr
act
s
(1
) –
–
–
(1)
(3)
–
(96
8)
–
Unre
alis
ed L
oss o
n O
pen
Fo
rwa
rd F
ore
ign
Cu
rre
ncy
Exc
ha
ng
e C
ontr
act
s
–
(6,9
73
,13
0)
(16
1,3
96
) –
–
–
–
–
–
Unre
alis
ed L
oss o
n O
pen
Fu
ture
Co
ntr
acts
–
–
–
–
–
–
–
–
(2,0
40
) O
the
r P
aya
ble
s
(3
2,0
59
) (3
2,3
09
) (3
2,4
52
) (5
4,6
76
) (3
4,7
92
) (3
3,3
22
) (3
4,2
50
) (4
0,2
78
) (4
7,3
74
) T
ota
l C
urr
en
t L
iab
ilit
ies
(11
7,0
47
) (2
6,9
35
,381
) (2
26
,14
7)
(70
,395
) (7
3,2
75
) (1
63
,69
3)
(12
6,8
06
) (5
,35
5,1
06
) (1
00
,50
3)
N
et
As
se
ts A
ttri
bu
tab
le t
o R
ed
ee
ma
ble
Pa
rtic
ipa
tin
g U
nit
ho
lde
rs
at
Mid
Ma
rke
t P
ric
es
6
4,2
03
,519
85
4,0
25
,90
0
4,6
41
,51
6
–
17
,727
,195
95
,839
,118
16
,041
,615
57
,684
,578
7,1
48
,15
2
*ED
GE
Sm
all/
Mid
-Cap E
quity
Inco
me F
und term
inate
d o
n 3
1 M
ay 2
016.
1C
usto
dia
n (
until
17 M
arc
h 2
016)
and D
epositary
(fr
om
18 M
arc
h 2
016).
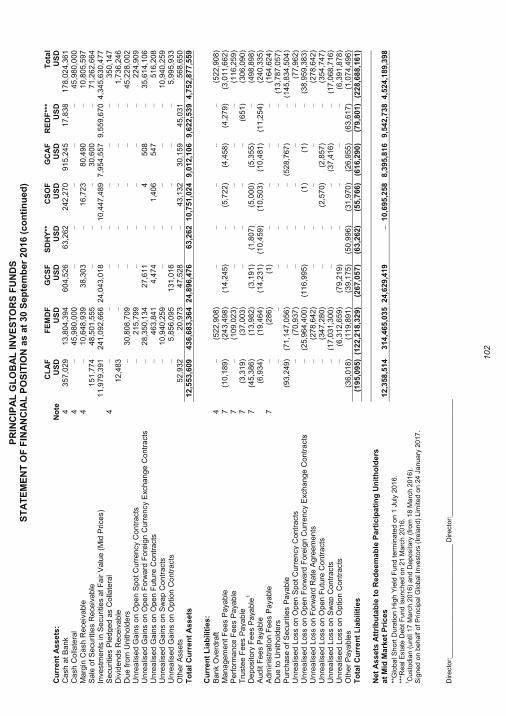
PR
INC
IPA
L G
LO
BA
L I
NV
ES
TO
RS
FU
ND
S
ST
AT
EM
EN
T O
F F
INA
NC
IAL
PO
SIT
ION
as a
t 30
Se
pte
mb
er
201
6 (
co
nti
nu
ed
)
102
CL
AF
F
EM
DF
G
CS
F
SD
HY
**
CS
OF
G
CA
F
RE
DF
***
To
tal
Cu
rre
nt
As
se
ts:
No
te
US
D
US
D
US
D
US
D
US
D
US
D
US
D
US
D
Cash
at
Ba
nk
4
35
7,0
29
13
,804
,394
60
4,5
26
63
,262
24
2,2
70
91
5,2
45
17
,838
17
8,0
24
,36
1
Cash
Colla
tera
l 4
–
45
,980
,000
–
–
–
–
–
45
,980
,000
Ma
rgin
Ca
sh
Rece
iva
ble
4
–
10
,648
,939
38
,303
–
16
,723
80
,490
–
10
,805
,597
Sa
le o
f S
ecu
ritie
s R
eceiv
ab
le
1
51
,77
4
48
,501
,555
–
–
–
30
,600
–
71
,262
,664
Inve
stm
en
ts in S
ecu
ritie
s a
t F
air
Va
lue
(M
id P
rice
s)
1
1,9
79
,391
24
1,0
92
,66
6
24
,043
,018
–
10
,447
,489
7,9
54
,55
7
9,5
59
,67
0
4,3
45
,63
0,4
77
Se
cu
rities P
led
ged
as C
olla
tera
l 4
–
–
–
–
–
–
–
35
0,1
47
Div
ide
nds R
ece
iva
ble
12
,483
–
–
–
–
–
–
1,7
36
,24
6
Due
fro
m U
nith
old
ers
–
30
,808
,709
–
–
–
–
–
45
,228
,002
Unre
alis
ed G
ain
s o
n O
pe
n S
po
t C
urr
ency
Co
ntr
acts
–
21
5,7
99
–
–
–
–
–
22
4,9
09
Unre
alis
ed G
ain
s o
n O
pe
n F
orw
ard
Fo
reig
n C
urr
ency
Exc
ha
ng
e C
ontr
act
s
–
28
,350
,134
27
,611
–
4
50
8
–
35
,614
,106
Unre
alis
ed G
ain
s o
n O
pe
n F
utu
re C
on
tra
cts
–
46
3,8
41
4,4
74
–
1,4
06
54
7
–
51
6,2
08
Unre
alis
ed G
ain
s o
n S
wa
p C
on
tra
cts
–
10
,940
,259
–
–
–
–
–
10
,940
,259
Unre
alis
ed G
ain
s o
n O
ption
Co
ntr
acts
–
5,8
56
,09
5
13
1,0
16
–
–
–
–
5,9
95
,93
3
Oth
er
Ass
ets
52
,932
20
,973
47
,528
–
43
,132
30
,159
45
,031
56
8,6
50
To
tal
Cu
rre
nt
As
se
ts
1
2,5
53
,609
43
6,6
83
,36
4
24
,896
,476
63
,262
10
,751
,024
9,0
12
,10
6
9,6
22
,53
9
4,7
52
,87
7,5
59
Cu
rre
nt
Lia
bilit
ies
:
Ba
nk O
verd
raft
4
–
(52
2,9
08
) –
–
–
–
–
(52
2,9
08
) M
an
ag
em
en
t F
ees P
aya
ble
7
(1
0,1
89
) (2
43
,49
8)
(14
,245
) –
(5,7
22
) (4
,45
8)
(4,2
79
) (3
,01
1,6
62
) P
erf
orm
an
ce F
ee
s P
aya
ble
7
–
(10
9,0
23
) –
–
–
–
–
(11
6,2
59
) T
ruste
e F
ee
s P
aya
ble
7
(3
,31
9)
(37
,003
) –
–
–
–
(65
1)
(30
6,0
90
) D
ep
osi
tory
Fe
es P
aya
ble
1
7
(45
,386
) (1
3,9
82
) (3
,19
1)
(1,8
07
) (5
,00
0)
(5,3
55
) –
(49
8,8
98
) A
ud
it F
ee
s P
aya
ble
(6,9
34
) (1
9,4
64
) (1
4,2
31
) (1
0,4
59
) (1
0,5
03
) (1
0,4
81
) (1
1,2
54
) (2
40
,33
5)
Ad
min
istr
ation
Fee
s P
aya
ble
7
–
(28
6)
(1)
–
–
–
–
(16
4,6
24
) D
ue
to
Unith
old
ers
–
–
–
–
–
–
–
(13
,787
,057
) P
urc
hase
of
Secu
ritie
s P
aya
ble
(93
,249
) (7
1,1
47
,056
) –
–
–
(52
8,7
67
) –
(14
5,8
34
,50
4)
Unre
alis
ed L
oss o
n O
pen
Sp
ot C
urr
en
cy
Co
ntr
act
s
–
(70
,937
) –
–
–
–
–
(77
,962
) U
nre
alis
ed L
oss o
n O
pen
Fo
rwa
rd F
ore
ign
Cu
rre
ncy
Exc
ha
ng
e C
ontr
act
s
–
(25
,964
,400
) (1
16
,99
5)
–
(1)
(1)
–
(38
,959
,383
) U
nre
alis
ed L
oss o
n F
orw
ard
Ra
te A
gre
em
en
ts
–
(27
8,6
42
) –
–
–
–
–
(27
8,6
42
) U
nre
alis
ed L
oss o
n O
pen
Fu
ture
Co
ntr
acts
–
(34
7,2
80
) –
–
(2,5
70
) (2
,85
7)
–
(35
4,7
47
) U
nre
alis
ed L
oss o
n S
wa
p C
ontr
acts
–
(17
,031
,300
) –
–
–
(37
,416
) –
(17
,068
,716
) U
nre
alis
ed L
oss o
n O
ptio
n C
on
tra
cts
–
(6,3
12
,65
9)
(79
,219
) –
–
–
–
(6,3
91
,87
8)
Oth
er
Pa
yab
les
(3
6,0
18
) (1
19
,89
1)
(39
,175
) (5
0,9
96
) (3
1,9
70
) (2
6,9
55
) (6
3,6
17
) (1
,07
4,4
96
) T
ota
l C
urr
en
t L
iab
ilit
ies
(19
5,0
95
) (1
22
,21
8,3
29
) (2
67
,05
7)
(63
,262
) (5
5,7
66
) (6
16
,29
0)
(79
,801
) (2
28
,68
8,1
61
)
N
et
As
se
ts A
ttri
bu
tab
le t
o R
ed
ee
ma
ble
Pa
rtic
ipa
tin
g U
nit
ho
lde
rs
at
Mid
Ma
rke
t P
ric
es
1
2,3
58
,514
31
4,4
65
,03
5
24
,629
,419
–
10
,695
,258
8,3
95
,81
6
9,5
42
,73
8
4,5
24
,18
9,3
98
**G
lobal S
hort
Dura
tion H
igh Y
ield
Fund term
inate
d o
n 1
July
2016.
***R
eal E
sta
te D
ebt
Fund launched o
n 2
1 M
arc
h 2
016.
1C
usto
dia
n (
until
17 M
arc
h 2
016)
and D
epositary
(fr
om
18 M
arc
h 2
016).
S
igned o
n b
ehalf
of P
rincip
al G
lobal In
vest
ors
(Ir
ela
nd)
Lim
ited o
n 2
4 J
anuary
2017.
Directo
r:____________________
__________ D
irecto
r:____
________________________
___
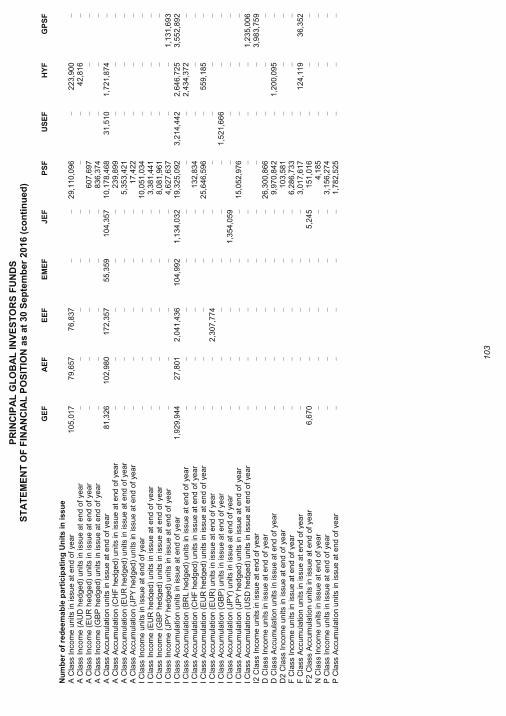
PR
INC
IPA
L G
LO
BA
L I
NV
ES
TO
RS
FU
ND
S
ST
AT
EM
EN
T O
F F
INA
NC
IAL
PO
SIT
ION
as a
t 30
Se
pte
mb
er
201
6 (
co
nti
nu
ed
)
103
G
EF
A
EF
E
EF
E
ME
F
JE
F
PS
F
US
EF
H
YF
G
PS
F
Nu
mb
er
of
red
ee
ma
ble
pa
rtic
ipa
tin
g U
nit
s in
iss
ue
A C
lass
Inco
me
un
its in
issu
e a
t e
nd o
f ye
ar
10
5,0
17
79
,657
76
,837
–
–
29
,110
,096
–
22
3,9
00
–
A C
lass
Inco
me
(A
UD
hed
ge
d)
un
its in
issue
at e
nd
of
yea
r –
–
–
–
–
–
–
42
,816
–
A C
lass
Inco
me
(E
UR
hed
ge
d)
un
its in
issue
at e
nd
of
yea
r –
–
–
–
–
60
7,6
97
–
–
–
A C
lass
Inco
me
(G
BP
hed
ge
d)
un
its in
issue
at e
nd
of
yea
r –
–
–
–
–
83
6,3
74
–
–
–
A C
lass
Acc
um
ula
tio
n u
nits in
issu
e a
t e
nd
of
yea
r 8
1,3
26
10
2,9
80
17
2,3
57
55
,359
10
4,3
57
10
,178
,468
31
,510
1,7
21
,87
4
–
A C
lass
Acc
um
ula
tio
n (
CH
F h
ed
ge
d)
units in
issu
e a
t e
nd
of ye
ar
–
–
–
–
–
23
9,8
99
–
–
–
A C
lass
Acc
um
ula
tio
n (
EU
R h
ed
ge
d)
units in
issu
e a
t e
nd
of ye
ar
–
–
–
–
–
5,3
53
,42
1
–
–
–
A C
lass
Acc
um
ula
tio
n (
JP
Y h
ed
ge
d)
un
its in
issue
at e
nd o
f ye
ar
–
–
–
–
–
17
,422
–
–
–
I C
lass
Incom
e u
nits
in iss
ue
at
en
d o
f ye
ar
–
–
–
–
–
10
,051
,034
–
–
–
I C
lass
Incom
e (
EU
R h
ed
ged
) u
nits
in iss
ue a
t en
d o
f ye
ar
–
–
–
–
–
3,3
81
,44
1
–
–
–
I C
lass
Incom
e (
GB
P h
ed
ged
) u
nits
in iss
ue a
t en
d o
f ye
ar
–
–
–
–
–
8,0
81
,96
1
–
–
–
I C
lass
Incom
e (
JP
Y h
ed
ge
d)
un
its in iss
ue a
t en
d o
f ye
ar
–
–
–
–
–
4,6
27
,63
7
–
–
1,1
31
,69
3
I C
lass
Acc
um
ula
tion
units
in is
sue
at e
nd
of
yea
r 1
,92
9,9
44
27
,801
2,0
41
,43
6
10
4,9
92
1,1
34
,03
2
19
,325
,092
3,2
14
,44
2
2,6
46
,72
5
3,5
52
,89
2
I C
lass
Acc
um
ula
tion
(B
RL
hed
ge
d)
un
its in
issue
at e
nd o
f ye
ar
–
–
–
–
–
–
–
2,4
34
,37
2
–
I C
lass
Acc
um
ula
tion
(C
HF
hed
ge
d)
un
its in
issue
at e
nd o
f ye
ar
–
–
–
–
–
13
2,8
34
–
–
–
I C
lass
Acc
um
ula
tion
(E
UR
hed
ge
d)
un
its in
issue
at e
nd o
f ye
ar
–
–
–
–
–
25
,646
,596
–
55
9,1
85
–
I C
lass
Acc
um
ula
tion
(E
UR
) un
its in
issu
e a
t e
nd
of ye
ar
–
–
2,3
07
,77
4
–
–
–
–
–
–
I C
lass
Acc
um
ula
tion
(G
BP
) un
its in
issu
e a
t e
nd
of ye
ar
–
–
–
–
–
–
1,5
21
,66
6
–
–
I C
lass
Acc
um
ula
tion
(JP
Y)
units in
issu
e a
t e
nd o
f ye
ar
–
–
–
–
1,3
54
,05
9
–
–
–
–
I C
lass
Acc
um
ula
tion
(JP
Y h
ed
ge
d)
un
its in
issue
at e
nd o
f ye
ar
–
–
–
–
–
15
,052
,976
–
–
–
I C
lass
Acc
um
ula
tion
(U
SD
hed
ge
d)
un
its in
issue
at e
nd o
f ye
ar
–
–
–
–
–
–
–
–
1,2
35
,00
6
I2 C
lass In
com
e u
nits
in is
sue
at
en
d o
f ye
ar
–
–
–
–
–
–
–
–
3,9
83
,75
9
D C
lass
Inco
me
units
in is
su
e a
t e
nd o
f ye
ar
–
–
–
–
–
26
,300
,866
–
–
–
D C
lass
Acc
um
ula
tion u
nits
in is
sue
at
end
of
yea
r –
–
–
–
–
9,9
70
,84
2
–
1,2
00
,09
5
–
D2 C
lass
Incom
e u
nits
in iss
ue
at
en
d o
f ye
ar
–
–
–
–
–
10
3,5
81
–
–
–
F C
lass
Incom
e u
nits
in iss
ue
at
en
d o
f ye
ar
–
–
–
–
–
6,2
86
,73
3
–
–
–
F C
lass
Acc
um
ula
tion
units
in is
sue
at e
nd
of
yea
r –
–
–
–
–
3,0
17
,61
7
–
12
4,1
19
36
,352
F2
Cla
ss A
ccum
ula
tion
un
its in
iss
ue a
t en
d o
f ye
ar
6,6
70
–
–
–
5,2
45
15
1,0
16
–
–
–
N C
lass
Inco
me
units
in is
su
e a
t e
nd o
f ye
ar
–
–
–
–
–
4,1
85
–
–
–
P C
lass
Inco
me
un
its in
issu
e a
t e
nd o
f ye
ar
–
–
–
–
–
3,1
56
,27
4
–
–
–
P C
lass
Acc
um
ula
tio
n u
nits in
issu
e a
t e
nd
of
yea
r –
–
–
–
–
1,7
82
,52
5
–
–
–
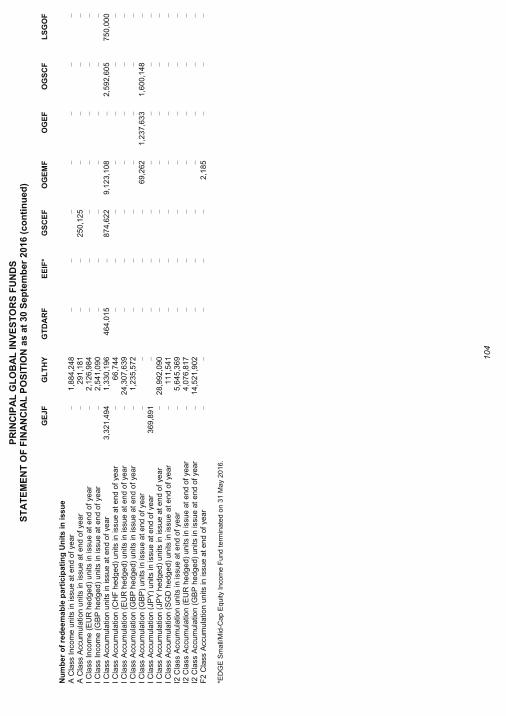
PR
INC
IPA
L G
LO
BA
L I
NV
ES
TO
RS
FU
ND
S
ST
AT
EM
EN
T O
F F
INA
NC
IAL
PO
SIT
ION
as a
t 30
Se
pte
mb
er
201
6 (
co
nti
nu
ed
)
104
G
EJ
F
GL
TH
Y
GT
DA
RF
E
EIF
* G
SC
EF
O
GE
MF
O
GE
F
OG
SC
F
LS
GO
F
Nu
mb
er
of
red
ee
ma
ble
pa
rtic
ipa
tin
g U
nit
s in
iss
ue
A C
lass
Inco
me
un
its in
issu
e a
t e
nd o
f ye
ar
–
1,8
84
,24
8
–
–
–
–
–
–
–
A C
lass
Acc
um
ula
tio
n u
nits in
issu
e a
t e
nd
of
yea
r –
29
1,1
81
–
–
25
0,1
25
–
–
–
–
I C
lass
Incom
e (
EU
R h
ed
ged
) u
nits
in iss
ue a
t en
d o
f ye
ar
–
2,1
26
,98
4
–
–
–
–
–
–
–
I C
lass
Incom
e (
GB
P h
ed
ged
) u
nits
in iss
ue a
t en
d o
f ye
ar
–
2,5
41
,09
0
–
–
–
–
–
–
–
I C
lass
Acc
um
ula
tion
units
in is
sue
at e
nd
of
yea
r 3
,32
1,4
94
1,3
30
,19
6
46
4,0
15
–
87
4,6
22
9,1
23
,10
8
–
2,5
92
,60
5
75
0,0
00
I C
lass
Acc
um
ula
tion
(C
HF
hed
ge
d)
un
its in
issue
at e
nd o
f ye
ar
–
66
,744
–
–
–
–
–
–
–
I C
lass
Acc
um
ula
tion
(E
UR
hed
ge
d)
un
its in
issue
at e
nd o
f ye
ar
–
24
,307
,639
–
–
–
–
–
–
–
I C
lass
Acc
um
ula
tion
(G
BP
hed
ge
d)
un
its in
issue
at e
nd o
f ye
ar
–
1,2
35
,57
2
–
–
–
–
–
–
–
I C
lass
Acc
um
ula
tion
(G
BP
) un
its in
issu
e a
t e
nd
of ye
ar
–
–
–
–
–
69
,262
1,2
37
,63
3
1,6
00
,14
8
–
I C
lass
Acc
um
ula
tion
(JP
Y)
units in
issu
e a
t e
nd o
f ye
ar
36
9,8
91
–
–
–
–
–
–
–
–
I C
lass
Acc
um
ula
tion
(JP
Y h
ed
ge
d)
un
its in
issue
at e
nd o
f ye
ar
–
28
,992
,090
–
–
–
–
–
–
–
I C
lass
Acc
um
ula
tion
(S
GD
hed
ge
d)
un
its in
issue
at e
nd o
f ye
ar
–
11
1,5
41
–
–
–
–
–
–
–
I2 C
lass A
ccum
ula
tion
un
its in is
sue
at
end
of
yea
r –
5,6
45
,36
9
–
–
–
–
–
–
–
I2 C
lass A
ccum
ula
tion
(E
UR
he
dg
ed
) u
nits in
issu
e a
t e
nd
of ye
ar
–
4,0
76
,81
7
–
–
–
–
–
–
–
I2 C
lass A
ccum
ula
tion
(G
BP
he
dg
ed
) u
nits in
issu
e a
t e
nd
of ye
ar
–
14
,521
,902
–
–
–
–
–
–
–
F2
Cla
ss A
ccum
ula
tion
un
its in
iss
ue a
t en
d o
f ye
ar
–
–
–
–
–
2,1
85
–
–
–
*ED
GE
Sm
all/
Mid
-Cap E
quity
Inco
me F
und term
inate
d o
n 3
1 M
ay 2
016.
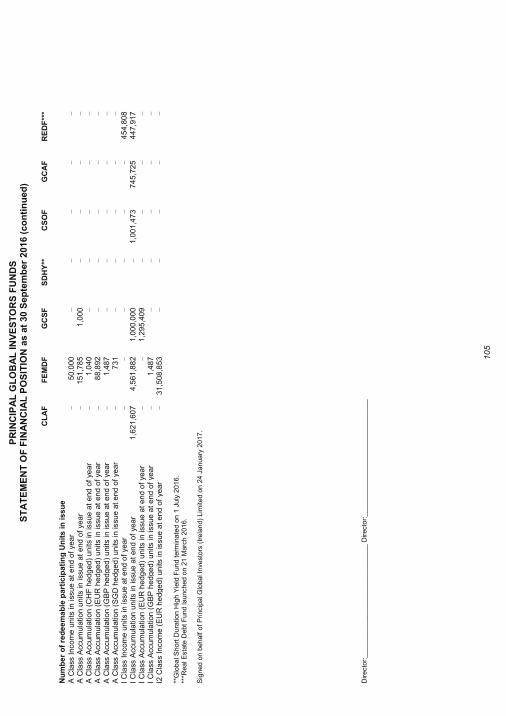
PR
INC
IPA
L G
LO
BA
L I
NV
ES
TO
RS
FU
ND
S
ST
AT
EM
EN
T O
F F
INA
NC
IAL
PO
SIT
ION
as a
t 30
Se
pte
mb
er
201
6 (
co
nti
nu
ed
)
105
C
LA
F
FE
MD
F
GC
SF
S
DH
Y**
C
SO
F
GC
AF
R
ED
F**
*
N
um
be
r o
f re
de
em
ab
le p
art
icip
ati
ng
Un
its
in
iss
ue
A C
lass
Inco
me
un
its in
issu
e a
t e
nd o
f ye
ar
–
50
,000
–
–
–
–
–
A C
lass
Acc
um
ula
tio
n u
nits in
issu
e a
t e
nd
of
yea
r –
15
1,7
85
1,0
00
–
–
–
–
A C
lass
Acc
um
ula
tio
n (
CH
F h
ed
ge
d)
units in
issu
e a
t e
nd
of ye
ar
–
1,0
40
–
–
–
–
–
A C
lass
Acc
um
ula
tio
n (
EU
R h
ed
ge
d)
units in
issu
e a
t e
nd
of ye
ar
–
88
,892
–
–
–
–
–
A C
lass
Acc
um
ula
tio
n (
GB
P h
ed
ge
d)
units in
issu
e a
t e
nd
of ye
ar
–
1,4
87
–
–
–
–
–
A C
lass
Acc
um
ula
tio
n (
SG
D h
ed
ge
d)
units in
issu
e a
t e
nd
of ye
ar
–
73
1
–
–
–
–
–
I C
lass
Incom
e u
nits
in iss
ue
at
en
d o
f ye
ar
–
–
–
–
–
–
45
4,8
08
I C
lass
Acc
um
ula
tion
units
in is
sue
at e
nd
of
yea
r 1
,62
1,6
07
4,5
61
,88
2
1,0
00
,00
0
–
1,0
01
,47
3
74
5,7
25
44
7,9
17
I C
lass
Acc
um
ula
tion
(E
UR
hed
ge
d)
un
its in
issue
at e
nd o
f ye
ar
–
–
1,2
95
,40
9
–
–
–
–
I C
lass
Acc
um
ula
tion
(G
BP
hed
ge
d)
un
its in
issue
at e
nd o
f ye
ar
–
1,4
87
–
–
–
–
–
I2 C
lass In
com
e (
EU
R h
ed
ge
d)
un
its in
issue
at e
nd
of
yea
r –
31
,508
,853
–
–
–
–
–
**G
lobal S
hort
Dura
tion H
igh Y
ield
Fund term
inate
d o
n 1
July
2016.
***R
eal E
sta
te D
ebt F
und launched o
n 2
1 M
arc
h 2
016.
S
igned o
n b
ehalf
of P
rincip
al G
lobal In
vest
ors
(Ir
ela
nd)
Lim
ited o
n 2
4 J
anuary
2017.
Directo
r:____________________
__________ D
irecto
r:____
________________________
___
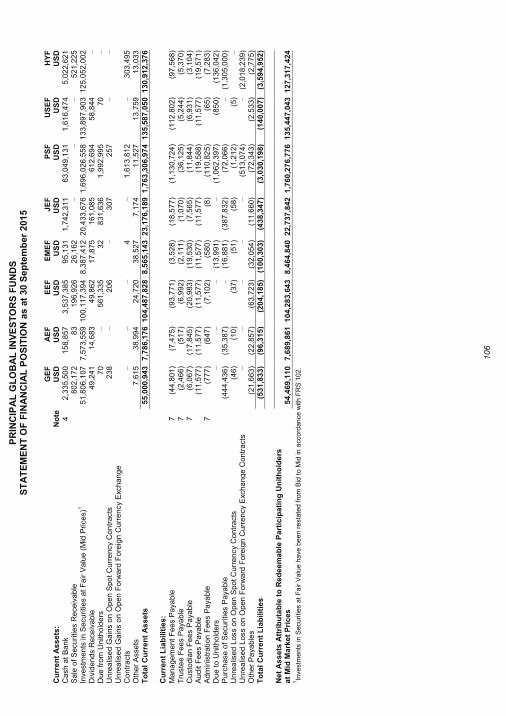
PR
INC
IPA
L G
LO
BA
L IN
VE
ST
OR
S F
UN
DS
S
TA
TE
ME
NT
OF
FIN
AN
CIA
L P
OS
ITIO
N a
s a
t 30
Se
pte
mb
er
201
5
106
GE
F
AE
F
EE
F
EM
EF
J
EF
P
SF
U
SE
F
HY
F
Cu
rre
nt
As
se
ts:
No
te
US
D
US
D
US
D
US
D
US
D
US
D
US
D
US
D
Cash
at
Ba
nk
4
2,3
35
,50
0
15
8,8
57
3,5
37
,38
5
95
,131
1,7
42
,31
1
63
,049
,131
1,6
16
,47
4
5,0
22
,62
1
Sa
le o
f S
ecu
ritie
s R
eceiv
ab
le
8
02
,17
2
83
19
6,9
26
26
,162
–
–
–
52
1,2
25
Inve
stm
en
ts in S
ecu
ritie
s a
t F
air
Va
lue
(M
id P
rice
s)1
51
,806
,107
7,5
73
,55
9 1
00
,11
7,3
94
8,3
87
,41
2
20
,433
,676 1
,69
6,0
26
,55
8
13
3,8
97
,90
3
12
5,0
52
,00
2
Div
ide
nds R
ece
iva
ble
49
,241
14
,683
49
,862
17
,875
16
1,0
85
61
2,6
94
58
,844
–
Due
fro
m U
nith
old
ers
70
–
56
1,3
35
32
83
1,6
36
1,9
92
,99
5
70
–
Unre
alis
ed G
ain
s o
n O
pe
n S
po
t C
urr
ency
Co
ntr
acts
23
8
–
20
6
–
30
7
25
7
–
–
Unre
alis
ed G
ain
s o
n O
pe
n F
orw
ard
Fo
reig
n C
urr
ency
Exc
ha
ng
e
Con
tra
cts
–
–
–
4
–
1,6
13
,81
2
–
30
3,4
95
Oth
er
Ass
ets
7,6
15
38
,994
24
,720
38
,527
7,1
74
11
,527
13
,759
13
,033
To
tal
Cu
rre
nt
As
se
ts
5
5,0
00
,943
7,7
86
,17
6 1
04
,48
7,8
28
8,5
65
,14
3
23
,176
,189 1
,76
3,3
06
,97
4
13
5,5
87
,05
0
13
0,9
12
,37
6
Cu
rre
nt
Lia
bilit
ies
:
Ma
na
ge
me
nt F
ees P
aya
ble
7
(4
4,8
01
) (7
,47
5)
(93
,771
) (3
,52
8)
(18
,577
) (1
,13
0,7
24
) (1
12
,80
2)
(97
,568
) T
ruste
e F
ee
s P
aya
ble
7
(2
,46
6)
(51
7)
(6,9
92
) (2
,11
1)
(1,0
70
) (3
6,1
25
) (5
,24
4)
(5,3
70
) C
usto
dia
n F
ees P
aya
ble
7
(6
,06
7)
(17
,845
) (2
0,9
83
) (1
9,5
30
) (7
,56
5)
(11
,844
) (6
,93
1)
(3,1
04
) A
ud
it F
ee
s P
aya
ble
(11
,577
) (1
1,5
77
) (1
1,5
77
) (1
1,5
77
) (1
1,5
77
) (1
9,5
88
) (1
1,5
77
) (1
9,5
71
) A
dm
inis
tra
tion
Fee
s P
aya
ble
7
(7
77
) (6
47
) (7
,10
2)
(58
0)
(8)
(11
0,8
25
) (6
5)
(7,2
83
) D
ue
to
Unith
old
ers
–
–
–
(13
,991
) –
(1,0
62
,39
7)
(85
0)
(13
6,0
42
) P
urc
hase
of
Secu
ritie
s P
aya
ble
(44
4,4
36
) (3
5,3
87
) –
(16
,881
) (3
87
,83
2)
(72
,066
) –
(1,3
05
,00
0)
Unre
alis
ed L
oss o
n O
pen
Sp
ot C
urr
en
cy
Co
ntr
act
s
(4
6)
(10
) (3
7)
(51
) (5
8)
(1,2
12
) (5
) –
Unre
alis
ed L
oss o
n O
pen
Fo
rwa
rd F
ore
ign
Cu
rre
ncy
Exc
ha
ng
e C
ontr
act
s
–
–
–
–
–
(51
3,0
74
) –
(2,0
18
,23
9)
Oth
er
Pa
yab
les
(2
1,6
63
) (2
2,8
57
) (6
3,7
23
) (3
2,0
54
) (1
1,6
60
) (7
2,3
43
) (2
,53
3)
(2,7
75
) T
ota
l C
urr
en
t L
iab
ilit
ies
(53
1,8
33
) (9
6,3
15
) (2
04
,18
5)
(10
0,3
03
) (4
38
,34
7)
(3,0
30
,19
8)
(14
0,0
07
) (3
,59
4,9
52
)
N
et
As
se
ts A
ttri
bu
tab
le t
o R
ed
ee
ma
ble
Pa
rtic
ipa
tin
g U
nit
ho
lde
rs
at
Mid
Ma
rke
t P
ric
es
5
4,4
69
,110
7,6
89
,86
1 1
04
,28
3,6
43
8,4
64
,84
0
22
,737
,842 1
,76
0,2
76
,77
6
13
5,4
47
,04
3
12
7,3
17
,42
4
1In
vestm
ents
in S
ecurities
at F
air V
alu
e h
ave
been r
est
ate
d f
rom
Bid
to M
id in
acc
ord
ance w
ith F
RS
102.
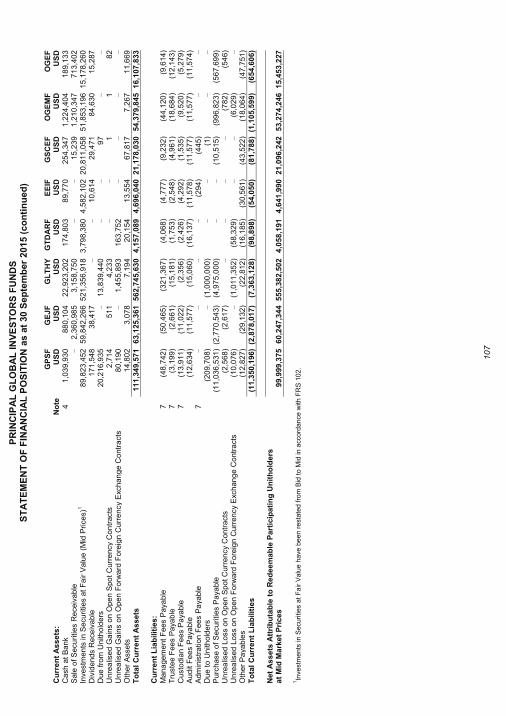
PR
INC
IPA
L G
LO
BA
L IN
VE
ST
OR
S F
UN
DS
S
TA
TE
ME
NT
OF
FIN
AN
CIA
L P
OS
ITIO
N a
s a
t 30
Se
pte
mb
er
201
5 (
co
nti
nu
ed
)
107
GP
SF
G
EJ
F
GL
TH
Y
GT
DA
RF
E
EIF
G
SC
EF
O
GE
MF
O
GE
F
Cu
rre
nt
As
se
ts:
No
te
US
D
US
D
US
D
US
D
US
D
US
D
US
D
US
D
Cash
at
Ba
nk
4
1,0
39
,93
0
88
0,1
04
22
,923
,202
17
4,8
03
89
,770
25
4,3
47
1,2
24
,40
4
18
9,1
33
Sa
le o
f S
ecu
ritie
s R
eceiv
ab
le
–
2,3
60
,98
5
3,1
58
,75
0
–
–
15
,239
1,2
10
,34
7
71
3,4
02
Inve
stm
en
ts in S
ecu
ritie
s a
t F
air
Va
lue
(M
id P
rice
s)1
89
,823
,452
59
,842
,266
52
1,3
56
,91
8
3,7
98
,38
0
4,5
82
,10
2
20
,811
,058
51
,853
,196
15
,178
,260
Div
ide
nds R
ece
iva
ble
17
1,5
48
38
,417
–
–
10
,614
29
,471
84
,630
15
,287
Due
fro
m U
nith
old
ers
20
,216
,935
–
13
,839
,440
–
–
97
–
–
Unre
alis
ed G
ain
s o
n O
pe
n S
po
t C
urr
ency
Co
ntr
acts
2,7
14
51
1
4,2
33
–
–
1
1
82
Unre
alis
ed G
ain
s o
n O
pe
n F
orw
ard
Fo
reig
n C
urr
ency
Exc
ha
ng
e C
ontr
act
s
8
0,1
90
–
1,4
55
,89
3
16
3,7
52
–
–
–
–
Oth
er
Ass
ets
14
,802
3,0
78
7,1
94
20
,154
13
,554
67
,817
7,2
67
11
,669
To
tal
Cu
rre
nt
As
se
ts
1
11
,34
9,5
71
63
,125
,361
56
2,7
45
,63
0
4,1
57
,08
9
4,6
96
,04
0
21
,178
,030
54
,379
,845
16
,107
,833
Cu
rre
nt
Lia
bilit
ies
:
Ma
na
ge
me
nt F
ees P
aya
ble
7
(4
8,7
42
) (5
0,4
65
) (3
21
,36
7)
(4,0
68
) (4
,77
7)
(9,2
32
) (4
4,1
20
) (9
,61
4)
Tru
ste
e F
ee
s P
aya
ble
7
(3
,19
9)
(2,6
61
) (1
5,1
81
) (1
,75
3)
(2,5
48
) (4
,96
1)
(18
,684
) (1
2,1
43
) C
usto
dia
n F
ees P
aya
ble
7
(1
3,9
11
) (1
1,0
22
) (2
,35
6)
(2,4
26
) (4
,29
2)
(1,5
35
) (9
,52
0)
(5,2
79
) A
ud
it F
ee
s P
aya
ble
(12
,634
) (1
1,5
77
) (1
5,0
60
) (1
6,1
37
) (1
1,5
78
) (1
1,5
77
) (1
1,5
77
) (1
1,5
74
) A
dm
inis
tra
tion
Fee
s P
aya
ble
7
–
–
–
–
(29
4)
(44
5)
–
–
Due
to
Unith
old
ers
(20
9,7
08
) –
(1,0
00
,00
0)
–
–
(1)
–
–
Pu
rch
ase
of
Secu
ritie
s P
aya
ble
(11
,036
,531
) (2
,77
0,5
43
) (4
,97
5,0
00
) –
–
(10
,515
) (9
96
,82
3)
(56
7,6
99
) U
nre
alis
ed L
oss o
n O
pen
Sp
ot C
urr
en
cy
Co
ntr
act
s
(2
,56
8)
(2,6
17
) –
–
–
–
(78
2)
(54
6)
Unre
alis
ed L
oss o
n O
pen
Fo
rwa
rd F
ore
ign
Cu
rre
ncy
Exc
ha
ng
e C
ontr
act
s
(1
0,0
76
) –
(1,0
11
,35
2)
(58
,329
) –
–
(6,0
29
) –
Oth
er
Pa
yab
les
(1
2,8
27
) (2
9,1
32
) (2
2,8
12
) (1
6,1
85
) (3
0,5
61
) (4
3,5
22
) (1
8,0
64
) (4
7,7
51
) T
ota
l C
urr
en
t L
iab
ilit
ies
(11
,350
,196
) (2
,87
8,0
17
) (7
,36
3,1
28
) (9
8,8
98
) (5
4,0
50
) (8
1,7
88
) (1
,10
5,5
99
) (6
54
,60
6)
Net
As
se
ts A
ttri
bu
tab
le t
o R
ed
ee
ma
ble
Pa
rtic
ipa
tin
g U
nit
ho
lde
rs
at
Mid
Ma
rke
t P
ric
es
9
9,9
99
,375
60
,247
,344
55
5,3
82
,50
2
4,0
58
,19
1
4,6
41
,99
0
21
,096
,242
53
,274
,246
15
,453
,227
1In
vestm
ents
in S
ecurities
at F
air V
alu
e h
ave
been r
est
ate
d f
rom
Bid
to M
id in
acc
ord
ance w
ith F
RS
102.
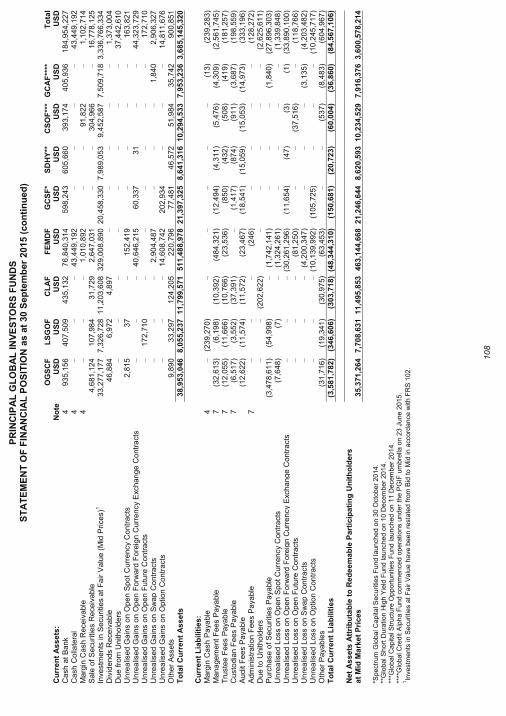
PR
INC
IPA
L G
LO
BA
L IN
VE
ST
OR
S F
UN
DS
S
TA
TE
ME
NT
OF
FIN
AN
CIA
L P
OS
ITIO
N a
s a
t 30
Se
pte
mb
er
201
5 (
co
nti
nu
ed
)
108
OG
SC
F
LS
GO
F
CL
AF
F
EM
DF
G
CS
F*
SD
HY
**
CS
OF
***
GC
AF
****
T
ota
l C
urr
en
t A
ss
ets
: N
ote
U
SD
U
SD
U
SD
U
SD
U
SD
U
SD
U
SD
U
SD
U
SD
C
ash
at
Ba
nk
4
93
5,1
56
40
7,5
09
43
5,1
32
76
,840
,314
59
8,2
43
60
5,6
60
39
3,1
74
40
5,9
36
18
4,9
54
,22
7
Cash
Colla
tera
l 4
–
–
–
43
,449
,192
–
–
–
–
43
,449
,192
Ma
rgin
Ca
sh
Rece
iva
ble
4
–
–
–
1,0
10
,89
2
–
–
91
,822
–
1,1
02
,71
4
Sa
le o
f S
ecu
ritie
s R
eceiv
ab
le
4
,68
1,1
24
10
7,9
84
31
,729
2,6
47
,03
1
–
–
30
4,9
66
–
16
,778
,125
Inve
stm
en
ts in S
ecu
ritie
s a
t F
air
Va
lue
(M
id P
rice
s)1
33
,277
,177
7,3
26
,72
8
11
,203
,608
32
9,0
08
,89
0
20
,458
,330
7,9
89
,05
3
9,4
52
,58
7
7,5
09
,71
8
3,3
36
,76
6,3
34
D
ivid
en
ds R
ece
iva
ble
46
,884
6,9
72
4,8
97
–
–
–
–
–
1,3
73
,00
4
Due
fro
m U
nith
old
ers
–
–
–
–
–
–
–
–
37
,442
,610
Unre
alis
ed G
ain
s o
n O
pe
n S
po
t C
urr
ency
Co
ntr
acts
2,8
15
37
–
15
2,4
19
–
–
–
–
16
3,8
21
Unre
alis
ed G
ain
s o
n O
pe
n F
orw
ard
Fo
reig
n C
urr
ency
Exc
ha
ng
e C
ontr
act
s
–
–
–
40
,646
,215
60
,337
31
–
–
44
,323
,729
Unre
alis
ed G
ain
s o
n O
pe
n F
utu
re C
on
tra
cts
–
17
2,7
10
–
–
–
–
–
–
17
2,7
10
Unre
alis
ed G
ain
s o
n S
wa
p C
on
tra
cts
–
–
–
2,9
04
,48
7
–
–
–
1,8
40
2,9
06
,32
7
Unre
alis
ed G
ain
s o
n O
ption
Co
ntr
acts
–
–
–
14
,608
,742
20
2,9
34
–
–
–
14
,811
,676
Oth
er
Ass
ets
9,8
90
33
,297
12
4,2
05
22
0,7
96
77
,481
46
,572
51
,984
35
,742
90
0,8
51
To
tal
Cu
rre
nt
As
se
ts
3
8,9
53
,046
8,0
55
,23
7
11
,799
,571
51
1,4
88
,97
8
21
,397
,325
8,6
41
,31
6
10
,294
,533
7,9
53
,23
6
3,6
85
,14
5,3
20
Cu
rre
nt
Lia
bilit
ies
:
M
arg
in C
ash
Pa
yable
4
–
(23
9,2
70
) –
–
–
–
–
(13
) (2
39
,28
3)
Ma
na
ge
me
nt F
ees P
aya
ble
7
(3
2,6
13
) (6
,19
8)
(10
,392
) (4
84
,32
1)
(12
,494
) (4
,31
1)
(5,4
76
) (4
,30
9)
(2,5
61
,74
5)
Tru
ste
e F
ee
s P
aya
ble
7
(1
2,0
55
) (1
1,6
66
) (1
0,7
66
) (2
3,5
36
) (8
50
) (4
32
) (5
08
) (4
19
) (1
81
,25
7)
Custo
dia
n F
ees P
aya
ble
7
(6
,51
7)
(3,5
52
) (3
7,3
91
) –
(1,4
17
) (8
74
) (9
11
) (3
,68
7)
(19
8,5
59
) A
ud
it F
ee
s P
aya
ble
(12
,622
) (1
1,5
74
) (1
1,5
72
) (2
3,4
67
) (1
8,5
41
) (1
5,0
59
) (1
5,0
53
) (1
4,9
73
) (3
33
,19
6)
Ad
min
istr
ation
Fee
s P
aya
ble
7
–
–
–
(24
6)
–
–
–
–
(12
8,2
72
) D
ue
to
Unith
old
ers
–
–
(20
2,6
22
) –
–
–
–
–
(2,6
25
,61
1)
Pu
rch
ase
of
Secu
ritie
s P
aya
ble
(3,4
78
,61
1)
(54
,998
) –
(1,7
42
,14
1)
–
–
–
(1,8
40
) (2
7,8
96
,303
) U
nre
alis
ed L
oss o
n O
pen
Sp
ot C
urr
en
cy
Co
ntr
act
s
(7
,64
8)
(7)
–
(1,3
24
,26
1)
–
–
–
–
(1,3
39
,84
8)
Unre
alis
ed L
oss o
n O
pen
Fo
rwa
rd F
ore
ign
Cu
rre
ncy
Exc
ha
ng
e C
ontr
act
s
–
–
–
(30
,261
,296
) (1
1,6
54
) (4
7)
(3)
(1)
(33
,890
,100
) U
nre
alis
ed L
oss o
n O
pen
Fu
ture
Co
ntr
acts
–
–
–
(81
,250
) –
–
(37
,516
) –
(11
8,7
66
) U
nre
alis
ed L
oss o
n S
wa
p C
ontr
acts
–
–
–
(4,2
00
,34
7)
–
–
–
(3,1
35
) (4
,20
3,4
82
) U
nre
alis
ed L
oss o
n O
ptio
n C
on
tra
cts
–
–
–
(10
,139
,992
) (1
05
,72
5)
–
–
–
(10
,245
,717
) O
the
r P
aya
ble
s
(3
1,7
16
) (1
9,3
41
) (3
0,9
75
) (6
3,4
53
) –
–
(53
7)
(8,4
83
) (6
04
,96
7)
To
tal
Cu
rre
nt
Lia
bilit
ies
(3,5
81
,78
2)
(34
6,6
06
) (3
03
,71
8)
(48
,344
,310
) (1
50
,68
1)
(20
,723
) (6
0,0
04
) (3
6,8
60
) (8
4,5
67
,106
)
Net
As
se
ts A
ttri
bu
tab
le t
o R
ed
ee
ma
ble
Pa
rtic
ipa
tin
g U
nit
ho
lde
rs
at
Mid
Ma
rke
t P
ric
es
3
5,3
71
,264
7,7
08
,63
1
11
,495
,853
46
3,1
44
,66
8
21
,246
,644
8,6
20
,59
3
10
,234
,529
7,9
16
,37
6
3,6
00
,57
8,2
14
*Spect
rum
Glo
bal C
apital S
ecuritie
s F
und launched o
n 3
0 O
cto
ber
2014.
**
Glo
bal S
hort
Dura
tion H
igh Y
ield
Fund launched o
n 1
0 D
ecem
ber
2014.
**
*Glo
bal C
apital S
truct
ure
Opport
unitie
s F
und launched o
n 1
1 D
ecem
ber
2014.
**
**G
lobal C
redit
Alp
ha F
und c
om
menced o
pera
tions u
nder
the P
GIF
um
bre
lla o
n 2
3 J
une 2
015.
1In
vestm
ents
in S
ecurities
at F
air V
alu
e h
ave
been r
est
ate
d f
rom
Bid
to M
id in
acc
ord
ance w
ith F
RS
102.
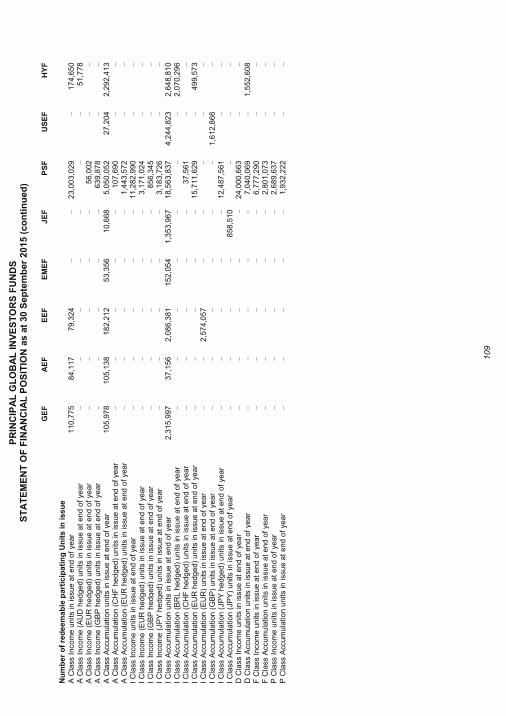
PR
INC
IPA
L G
LO
BA
L IN
VE
ST
OR
S F
UN
DS
S
TA
TE
ME
NT
OF
FIN
AN
CIA
L P
OS
ITIO
N a
s a
t 30
Se
pte
mb
er
201
5 (
co
nti
nu
ed
)
109
G
EF
A
EF
E
EF
E
ME
F
JE
F
PS
F
US
EF
H
YF
Nu
mb
er
of
red
ee
ma
ble
pa
rtic
ipa
tin
g U
nit
s in
iss
ue
A
Cla
ss I
nco
me
un
its in
issu
e a
t e
nd o
f ye
ar
11
0,7
75
84
,117
79
,324
–
–
23
,003
,029
–
17
4,6
50
A C
lass
Inco
me
(A
UD
hed
ge
d)
un
its in
issue
at e
nd
of
yea
r –
–
–
–
–
–
–
51
,778
A C
lass
Inco
me
(E
UR
hed
ge
d)
un
its in
issue
at e
nd
of
yea
r –
–
–
–
–
56
,002
–
–
A C
lass
Inco
me
(G
BP
hed
ge
d)
un
its in
issue
at e
nd
of
yea
r –
–
–
–
–
63
9,8
78
–
–
A C
lass
Acc
um
ula
tio
n u
nits in
issu
e a
t e
nd
of
yea
r 1
05
,97
8
10
5,1
38
18
2,2
12
53
,356
10
,668
5,0
50
,05
2
27
,204
2,2
92
,41
3
A C
lass
Acc
um
ula
tio
n (
CH
F h
ed
ge
d)
units in
issu
e a
t e
nd
of ye
ar
–
–
–
–
–
10
7,6
90
–
–
A C
lass
Acc
um
ula
tio
n (
EU
R h
ed
ge
d)
units in
issu
e a
t e
nd
of ye
ar
–
–
–
–
–
1,4
43
,57
2
–
–
I C
lass
Incom
e u
nits
in iss
ue
at
en
d o
f ye
ar
–
–
–
–
–
11
,282
,990
–
–
I C
lass
Incom
e (
EU
R h
ed
ged
) u
nits
in iss
ue a
t en
d o
f ye
ar
–
–
–
–
–
3,1
71
,02
4
–
–
I C
lass
Incom
e (
GB
P h
ed
ged
) u
nits
in iss
ue a
t en
d o
f ye
ar
–
–
–
–
–
85
6,3
45
–
–
I C
lass
Incom
e (
JP
Y h
ed
ge
d)
un
its in iss
ue a
t en
d o
f ye
ar
–
–
–
–
–
3,1
83
,72
6
–
–
I C
lass
Acc
um
ula
tion
units
in is
sue
at e
nd
of
yea
r 2
,31
5,9
97
37
,156
2,0
86
,38
1
15
2,0
54
1,3
53
,96
7
18
,563
,837
4,2
44
,82
3
2,6
48
,81
0
I C
lass
Acc
um
ula
tion
(B
RL
hed
ge
d)
un
its in
issue
at e
nd o
f ye
ar
–
–
–
–
–
–
–
2,0
70
,29
6
I C
lass
Acc
um
ula
tion
(C
HF
hed
ge
d)
un
its in
issue
at e
nd o
f ye
ar
–
–
–
–
–
37
,561
–
–
I C
lass
Acc
um
ula
tion
(E
UR
hed
ge
d)
un
its in
issue
at e
nd o
f ye
ar
–
–
–
–
–
15
,711
,629
–
49
9,5
73
I C
lass
Acc
um
ula
tion
(E
UR
) un
its in
issu
e a
t e
nd
of ye
ar
–
–
2,5
74
,05
7
–
–
–
–
–
I C
lass
Acc
um
ula
tion
(G
BP
) un
its in
issu
e a
t e
nd
of ye
ar
–
–
–
–
–
–
1,6
12
,86
6
–
I C
lass
Acc
um
ula
tion
(JP
Y h
ed
ge
d)
un
its in
issue
at e
nd
of
yea
r –
–
–
–
–
12
,487
,561
–
–
I C
lass
Acc
um
ula
tion
(JP
Y)
units in
issu
e a
t e
nd o
f ye
ar
–
–
–
–
85
8,5
10
–
–
–
D C
lass
Inco
me
units
in is
su
e a
t e
nd o
f ye
ar
–
–
–
–
–
24
,000
,663
–
–
D C
lass
Acc
um
ula
tion u
nits
in is
sue
at
end
of
yea
r –
–
–
–
–
7,0
40
,06
9
–
1,5
52
,60
8
F C
lass
Incom
e u
nits
in iss
ue
at
en
d o
f ye
ar
–
–
–
–
–
6,7
77
,29
0
–
–
F C
lass
Acc
um
ula
tion
units
in is
sue
at e
nd
of
yea
r –
–
–
–
–
2,8
01
,07
3
–
–
P C
lass
Inco
me
un
its in
issu
e a
t e
nd o
f ye
ar
–
–
–
–
–
2,6
89
,63
7
–
–
P C
lass
Acc
um
ula
tio
n u
nits in
issu
e a
t e
nd
of
yea
r –
–
–
–
–
1,9
32
,22
2
–
–
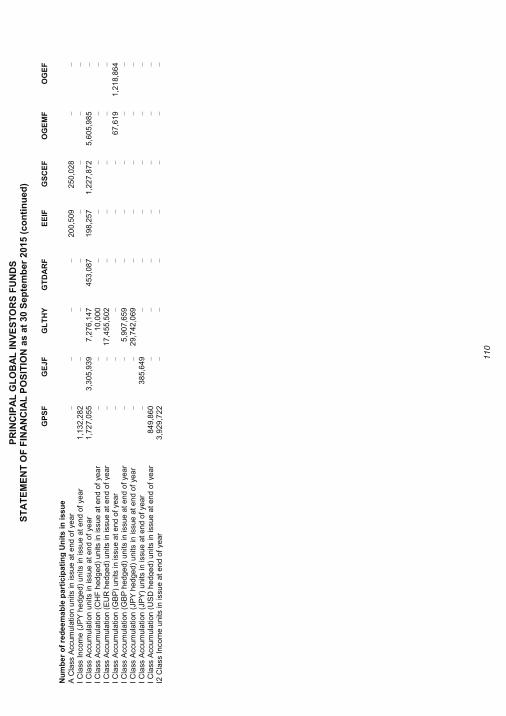
PR
INC
IPA
L G
LO
BA
L IN
VE
ST
OR
S F
UN
DS
S
TA
TE
ME
NT
OF
FIN
AN
CIA
L P
OS
ITIO
N a
s a
t 30
Se
pte
mb
er
201
5 (
co
nti
nu
ed
)
110
G
PS
F
GE
JF
G
LT
HY
G
TD
AR
F
EE
IF
GS
CE
F
OG
EM
F
OG
EF
Nu
mb
er
of
red
ee
ma
ble
pa
rtic
ipa
tin
g U
nit
s in
iss
ue
A
Cla
ss A
ccum
ula
tio
n u
nits in
issu
e a
t e
nd
of
yea
r –
–
–
–
20
0,5
09
25
0,0
28
–
–
I C
lass
Incom
e (
JP
Y h
ed
ge
d)
un
its in iss
ue a
t en
d o
f ye
ar
1,1
32
,28
2
–
–
–
–
–
–
–
I C
lass
Acc
um
ula
tion
units
in is
sue
at e
nd
of
yea
r 1
,72
7,0
55
3,3
05
,93
9
7,2
76
,14
7
45
3,0
87
19
8,2
57
1,2
27
,87
2
5,6
05
,98
5
–
I C
lass
Acc
um
ula
tion
(C
HF
hed
ge
d)
un
its in
issue
at e
nd o
f ye
ar
–
–
10
,000
–
–
–
–
–
I C
lass
Acc
um
ula
tion
(E
UR
hed
ge
d)
un
its in
issue
at e
nd o
f ye
ar
–
–
17
,455
,502
–
–
–
–
–
I C
lass
Acc
um
ula
tion
(G
BP
) un
its in
issu
e a
t e
nd
of ye
ar
–
–
–
–
–
–
67
,619
1,2
18
,86
4
I C
lass
Acc
um
ula
tion
(G
BP
hed
ge
d)
un
its in
issue
at e
nd o
f ye
ar
–
–
5,9
07
,65
9
–
–
–
–
–
I C
lass
Acc
um
ula
tion
(JP
Y h
ed
ge
d)
un
its in
issue
at e
nd o
f ye
ar
–
–
29
,742
,069
–
–
–
–
–
I C
lass
Acc
um
ula
tion
(JP
Y)
units in
issu
e a
t e
nd o
f ye
ar
–
38
5,6
49
–
–
–
–
–
–
I C
lass
Acc
um
ula
tion
(U
SD
hed
ge
d)
un
its in
issue
at e
nd o
f ye
ar
84
9,8
60
–
–
–
–
–
–
–
I2 C
lass In
com
e u
nits
in is
sue
at
en
d o
f ye
ar
3,9
29
,72
2
–
–
–
–
–
–
–
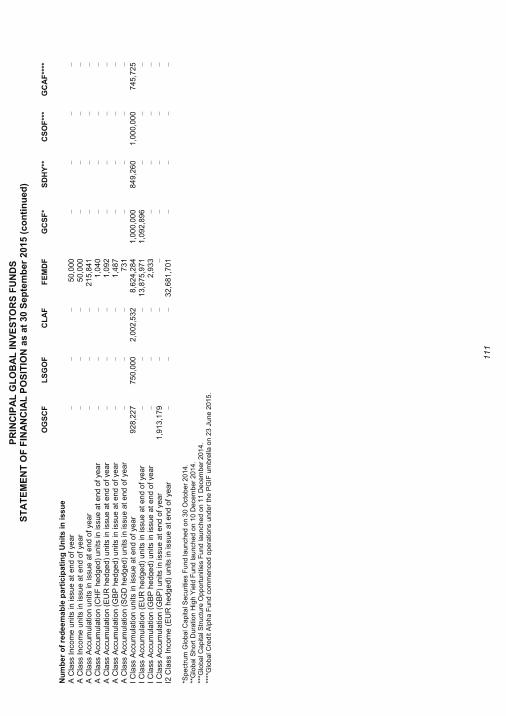
PR
INC
IPA
L G
LO
BA
L IN
VE
ST
OR
S F
UN
DS
S
TA
TE
ME
NT
OF
FIN
AN
CIA
L P
OS
ITIO
N a
s a
t 30
Se
pte
mb
er
201
5 (
co
nti
nu
ed
)
111
O
GS
CF
L
SG
OF
C
LA
F
FE
MD
F
GC
SF
* S
DH
Y**
C
SO
F**
* G
CA
F**
**
N
um
be
r o
f re
de
em
ab
le p
art
icip
ati
ng
Un
its
in
iss
ue
A
Cla
ss I
nco
me
un
its in
issu
e a
t e
nd o
f ye
ar
–
–
–
50
,000
–
–
–
–
A C
lass
Inco
me
un
its in
issu
e a
t e
nd o
f ye
ar
–
–
–
50
,000
–
–
–
–
A C
lass
Acc
um
ula
tio
n u
nits in
issu
e a
t e
nd
of
yea
r –
–
–
21
5,8
41
–
–
–
–
A C
lass
Acc
um
ula
tio
n (
CH
F h
ed
ge
d)
units in
issu
e a
t e
nd
of ye
ar
–
–
–
1,0
40
–
–
–
–
A C
lass
Acc
um
ula
tio
n (
EU
R h
ed
ge
d)
units in
issu
e a
t e
nd
of ye
ar
–
–
–
1,0
92
–
–
–
–
A C
lass
Acc
um
ula
tio
n (
GB
P h
ed
ge
d)
units in
issu
e a
t e
nd
of ye
ar
–
–
–
1,4
87
–
–
–
–
A C
lass
Acc
um
ula
tio
n (
SG
D h
ed
ge
d)
units in
issu
e a
t e
nd
of ye
ar
–
–
–
73
1
–
–
–
–
I C
lass
Acc
um
ula
tion
units
in is
sue
at e
nd
of
yea
r 9
28
,22
7
75
0,0
00
2,0
02
,53
2
8,6
24
,28
4
1,0
00
,00
0
84
9,2
60
1,0
00
,00
0
74
5,7
25
I C
lass
Acc
um
ula
tion
(E
UR
hed
ge
d)
un
its in
issue
at e
nd o
f ye
ar
–
–
–
13
,875
,971
1,0
92
,89
6
–
–
–
I C
lass
Acc
um
ula
tion
(G
BP
hed
ge
d)
un
its in
issue
at e
nd o
f ye
ar
–
–
–
2,9
33
–
–
–
–
I C
lass
Acc
um
ula
tion
(G
BP
) un
its in
issu
e a
t e
nd
of ye
ar
1,9
13
,17
9
–
–
–
–
–
–
–
I2 C
lass In
com
e (
EU
R h
ed
ge
d)
un
its in
issue
at e
nd
of
yea
r –
–
–
32
,681
,701
–
–
–
–
*Spect
rum
Glo
bal C
apital S
ecuritie
s F
und launched o
n 3
0 O
cto
ber
2014.
**
Glo
bal S
hort
Dura
tion H
igh Y
ield
Fund launched o
n 1
0 D
ecem
ber
2014.
**
*Glo
bal C
apital S
truct
ure
Opport
unitie
s F
und launched o
n 1
1 D
ecem
ber
2014.
**
**G
lobal C
redit
Alp
ha F
und c
om
menced o
pera
tions u
nder
the P
GIF
um
bre
lla o
n 2
3 J
une 2
015.
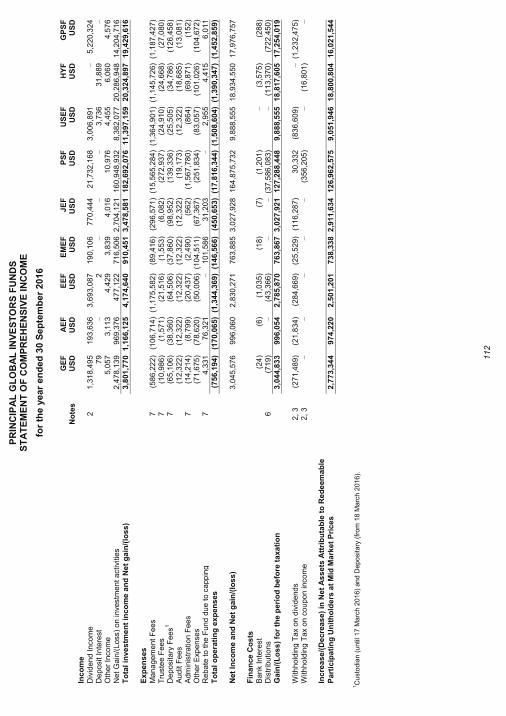
PR
INC
IPA
L G
LO
BA
L IN
VE
ST
OR
S F
UN
DS
S
TA
TE
ME
NT
OF
CO
MP
RE
HE
NS
IVE
IN
CO
ME
for
the y
ear
en
ded
30 S
ep
tem
ber
201
6
112
GE
F
AE
F
EE
F
EM
EF
J
EF
P
SF
U
SE
F
HY
F
GP
SF
No
tes
US
D
US
D
US
D
US
D
US
D
US
D
US
D
US
D
US
D
Inc
om
e
0
D
ivid
en
d In
com
e
2
1,3
18
,49
5
19
3,6
36
3,6
93
,08
7
19
0,1
06
77
0,4
44
21
,732
,168
3,0
06
,89
1
–
5,2
20
,32
4
Dep
osi
t In
tere
st
0
79
–
2
–
–
–
3,7
36
31
,889
–
Oth
er
Inco
me
0
5,0
57
3,1
13
4,4
29
3,8
39
4,0
16
10
,976
4,4
55
6,0
60
4,5
76
Net
Gain
/(Lo
ss)
on
in
vestm
en
t a
ctivi
ties
0
2,4
78
,13
9
96
9,3
76
47
7,1
22
71
6,5
06
2,7
04
,12
1
16
0,9
48
,93
2
8,3
82
,07
7
20
,286
,948
14
,204
,716
To
tal
inve
stm
en
t in
co
me
an
d N
et
ga
in/(
loss
) 0
3
,80
1,7
70
1,1
66
,12
5
4,1
74
,64
0
91
0,4
51
3,4
78
,58
1
18
2,6
92
,07
6
11
,397
,159
20
,324
,897
19
,429
,616
0
Ex
pe
ns
es
0
M
an
ag
em
en
t F
ees
7
(58
6,2
22
) (1
06
,71
4)
(1,1
75
,58
2)
(89
,416
) (2
96
,57
1)
(15
,565
,284
) (1
,36
4,9
01
) (1
,14
5,7
26
) (1
,18
7,4
27
) T
ruste
e F
ee
s
7
(10
,986
) (1
,57
1)
(21
,516
) (1
,55
3)
(6,0
82
) (2
72
,93
7)
(24
,910
) (2
4,6
68
) (2
7,0
80
) D
ep
osi
tary
Fe
es
1
7
(65
,106
) (3
8,3
60
) (6
4,5
06
) (3
7,8
60
) (9
8,9
52
) (1
39
,33
6)
(25
,505
) (3
4,7
86
) (1
26
,45
8)
Au
dit F
ee
s
0
(12
,322
) (1
2,3
22
) (1
2,3
22
) (1
2,3
22
) (1
2,3
22
) (1
9,1
73
) (1
2,3
22
) (1
8,6
85
) (1
3,0
81
) A
dm
inis
tra
tion
Fee
s
7
(14
,214
) (8
,79
9)
(20
,437
) (2
,49
0)
(56
2)
(1,5
67
,78
0)
(86
4)
(69
,871
) (1
52
) O
the
r E
xpe
nse
s
0
(71
,675
) (7
8,6
20
) (5
0,0
06
) (1
04
,51
1)
(67
,367
) (2
51
,83
4)
(83
,057
) (1
01
,02
6)
(10
4,6
72
) R
eb
ate
to
the
Fun
d d
ue
to c
app
ing
7
4
,33
1
76
,321
–
10
1,5
86
31
,203
–
2,9
55
4,4
15
6,0
11
To
tal
op
era
tin
g e
xp
en
ses
0
(7
56
,19
4)
(17
0,0
65
) (1
,34
4,3
69
) (1
46
,56
6)
(45
0,6
53
) (1
7,8
16
,344
) (1
,50
8,6
04
) (1
,39
0,3
47
) (1
,45
2,8
59
)
0
N
et
Inc
om
e a
nd
Net
gain
/(lo
ss
) 0
3
,04
5,5
76
99
6,0
60
2,8
30
,27
1
76
3,8
85
3,0
27
,92
8
16
4,8
75
,73
2
9,8
88
,55
5
18
,934
,550
17
,976
,757
0
Fin
an
ce
Co
sts
B
an
k In
tere
st
0
(24
) (6
) (1
,03
5)
(18
) (7
) (1
,20
1)
–
(3,5
75
) (2
88
) D
istr
ibu
tion
s
6
(71
9)
–
(43
,366
) –
–
(37
,586
,083
) –
(11
3,3
70
) (7
22
,45
0)
Ga
in/(
Lo
ss
) fo
r th
e p
eri
od
be
fore
ta
xa
tio
n
0
3,0
44
,83
3
99
6,0
54
2,7
85
,87
0
76
3,8
67
3,0
27
,92
1
12
7,2
88
,44
8
9,8
88
,55
5
18
,817
,605
17
,254
,019
0
With
ho
ldin
g T
ax
on
div
ide
nd
s
2,
3
(27
1,4
89
) (2
1,8
34
) (2
84
,66
9)
(25
,529
) (1
16
,28
7)
30
,332
(83
6,6
09
) –
(1,2
32
,47
5)
With
ho
ldin
g T
ax
on
co
upo
n in
co
me
2
, 3
–
–
–
–
–
(35
6,2
05
) –
(16
,801
) –
0
Inc
rea
se
/(D
ec
rea
se
) in
Net
As
se
ts A
ttri
bu
tab
le t
o R
ed
eem
ab
le
Pa
rtic
ipa
tin
g U
nit
ho
lde
rs a
t M
id M
ark
et
Pri
ce
s
0
2,7
73
,34
4
97
4,2
20
2,5
01
,20
1
73
8,3
38
2,9
11
,63
4
12
6,9
62
,57
5
9,0
51
,94
6
18
,800
,804
16
,021
,544
0
1C
usto
dia
n (
until
17 M
arc
h 2
016)
and D
epositary
(fr
om
18 M
arc
h 2
016).
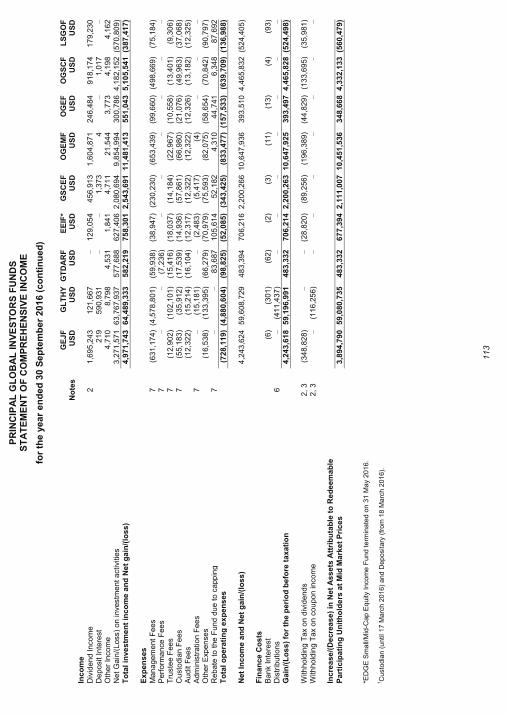
PR
INC
IPA
L G
LO
BA
L IN
VE
ST
OR
S F
UN
DS
S
TA
TE
ME
NT
OF
CO
MP
RE
HE
NS
IVE
IN
CO
ME
for
the y
ear
en
ded
30 S
ep
tem
ber
201
6 (
co
nti
nu
ed
)
113
GE
JF
G
LT
HY
G
TD
AR
F
EE
IF*
GS
CE
F
OG
EM
F
OG
EF
O
GS
CF
L
SG
OF
No
tes
US
D
US
D
US
D
US
D
US
D
US
D
US
D
US
D
US
D
Inc
om
e
0
D
ivid
en
d In
com
e
2
1,6
95
,24
3
12
1,6
67
–
12
9,0
54
45
6,9
13
1,6
04
,87
1
24
6,4
84
91
8,1
74
17
9,2
30
Dep
osi
t In
tere
st
0
21
9
59
0,9
31
–
–
1,3
73
4
–
1,0
17
–
Oth
er
Inco
me
0
4,7
10
8,7
98
4,5
31
1,8
41
4,7
11
21
,544
3,7
73
4,1
98
4,1
62
Net
Gain
/(Lo
ss)
on
in
vestm
en
t a
ctivi
ties
0
3,2
71
,57
1
63
,767
,937
57
7,6
88
62
7,4
06
2,0
80
,69
4
9,8
54
,99
4
30
0,7
86
4,1
82
,15
2 (5
70
,80
9)
To
tal
inve
stm
en
t in
co
me
an
d N
et
ga
in/(
loss
) 0
4
,97
1,7
43
64
,489
,333
58
2,2
19
75
8,3
01
2,5
43
,69
1
11
,481
,413
55
1,0
43
5,1
05
,54
1 (3
87
,41
7)
0
Ex
pe
ns
es
0
M
an
ag
em
en
t F
ees
7
(63
1,1
74
) (4
,57
8,8
01
) (5
9,9
38
) (3
8,9
47
) (2
30
,23
0)
(65
3,4
39
) (9
9,6
60
) (4
98
,66
9)
(75
,184
) P
erf
orm
an
ce F
ee
s
7
–
–
(7,2
36
) –
–
–
–
–
–
Tru
ste
e F
ee
s
7
(12
,902
) (1
02
,10
1)
(15
,416
) (1
8,0
37
) (1
4,1
84
) (2
2,9
67
) (1
0,5
58
) (1
3,4
01
) (9
,30
6)
Custo
dia
n F
ees
7
(55
,183
) (3
5,9
12
) (1
7,5
39
) (1
4,9
36
) (5
7,8
61
) (6
6,9
80
) (2
1,0
76
) (4
9,9
63
) (3
7,0
68
) A
ud
it F
ee
s
0
(12
,322
) (1
5,2
14
) (1
6,1
04
) (1
2,3
17
) (1
2,3
22
) (1
2,3
22
) (1
2,3
26
) (1
3,1
82
) (1
2,3
25
) A
dm
inis
tra
tion
Fee
s
7
–
(15
,181
) –
(2,4
83
) (5
,41
7)
(4)
–
–
–
Oth
er
Exp
en
se
s
0
(16
,538
) (1
33
,39
5)
(66
,279
) (7
0,9
79
) (7
5,5
93
) (8
2,0
75
) (5
8,6
54
) (7
0,8
42
) (9
0,7
97
) R
eb
ate
to
the
Fun
d d
ue
to c
app
ing
7
–
–
83
,687
10
5,6
14
52
,182
4,3
10
44
,741
6,3
48
87
,692
To
tal
op
era
tin
g e
xp
en
ses
0
(7
28
,11
9)
(4,8
80
,60
4)
(98
,825
) (5
2,0
85
) (3
43
,42
5)
(83
3,4
77
) (1
57
,53
3)
(63
9,7
09
) (1
36
,98
8)
0
Net
Inc
om
e a
nd
Net
gain
/(lo
ss
) 0
4
,24
3,6
24
59
,608
,729
48
3,3
94
70
6,2
16
2,2
00
,26
6
10
,647
,936
39
3,5
10
4,4
65
,83
2 (5
24
,40
5)
0
Fin
an
ce
Co
sts
B
an
k In
tere
st
0
(6)
(30
1)
(62
) (2
) (3
) (1
1)
(13
) (4
) (9
3)
Dis
trib
utio
ns
6
–
(41
1,4
37
) –
–
–
–
–
–
–
Ga
in/(
Lo
ss
) fo
r th
e p
eri
od
be
fore
ta
xa
tio
n
0
4,2
43
,61
8
59
,196
,991
48
3,3
32
70
6,2
14
2,2
00
,26
3
10
,647
,925
39
3,4
97
4,4
65
,82
8 (5
24
,49
8)
0
With
ho
ldin
g T
ax
on
div
ide
nd
s
2,
3
(34
8,8
28
) –
–
(28
,820
) (8
9,2
56
) (1
96
,38
9)
(44
,829
) (1
33
,69
5)
(35
,981
) W
ithho
ldin
g T
ax
on
co
upo
n in
co
me
2
, 3
–
(11
6,2
56
) –
–
–
–
–
–
–
0
Inc
rea
se
/(D
ec
rea
se
) in
Net
As
se
ts A
ttri
bu
tab
le t
o R
ed
eem
ab
le
Pa
rtic
ipa
tin
g U
nit
ho
lde
rs a
t M
id M
ark
et
Pri
ce
s
0
3,8
94
,79
0
59
,080
,735
48
3,3
32
67
7,3
94
2,1
11
,00
7
10
,451
,536
34
8,6
68
4,3
32
,13
3 (5
60
,47
9)
0
*ED
GE
Sm
all/
Mid
-Cap E
quity
Inco
me F
und term
inate
d o
n 3
1 M
ay 2
016.
1C
usto
dia
n (
until
17 M
arc
h 2
016)
and D
epositary
(fr
om
18 M
arc
h 2
016).
PR
INC
IPA
L G
LO
BA
L IN
VE
ST
OR
S F
UN
DS
S
TA
TE
ME
NT
OF
CO
MP
RE
HE
NS
IVE
IN
CO
ME
for
the y
ear
en
ded
30 S
ep
tem
ber
201
6 (
co
nti
nu
ed
)
114
CL
AF
F
EM
DF
G
CS
F
SD
HY
**
CS
OF
G
CA
F
RE
DF
***
To
tal
N
ote
s
US
D
US
D
US
D
US
D
US
D
US
D
US
D
US
D
Inc
om
e
0
Div
ide
nd
In
com
e
2
32
8,4
59
–
–
–
–
–
–
41
,805
,246
Dep
osi
t In
tere
st
0
4
2,8
60
–
–
–
2,5
95
–
63
4,7
09
Oth
er
Inco
me
0
3,9
34
7,0
41
4,7
03
2,3
99
5,4
09
4,2
13
–
13
2,4
88
Net
Gain
/(Lo
ss)
on
in
vestm
en
t a
ctivi
ties
0
3,1
11
,66
6
16
,545
,131
1,6
51
,20
3
34
9,9
56
56
3,2
53
54
5,6
92
58
1,7
45
31
8,6
09
,00
2
To
tal
inve
stm
en
t in
co
me
an
d N
et
ga
in/(
loss
) 0
3
,44
4,0
63
16
,555
,032
1,6
55
,90
6
35
2,3
55
56
8,6
62
55
2,5
00
58
1,7
45
36
1,1
81
,44
5
0
E
xp
en
ses
0
Ma
na
ge
me
nt F
ees
7
(11
6,9
31
) (3
,78
0,1
92
) (1
59
,87
6)
(39
,508
) (6
7,5
98
) (5
6,3
73
) (2
5,8
94
) (3
2,6
30
,257
) P
erf
orm
an
ce F
ee
s
7
–
(10
9,2
07
) –
–
–
–
–
(11
6,4
43
) T
ruste
e F
ee
s
7
(9,1
88
) (5
7,7
22
) (4
,68
8)
(3,7
15
) (2
,13
3)
(1,6
35
) (9
89
) (6
90
,24
5)
Custo
dia
n F
ees
7
(58
,692
) (1
37
,98
2)
(16
,286
) (8
,95
1)
(16
,635
) (1
6,4
86
) (1
,00
0)
(1,2
43
,41
9)
Au
dit F
ee
s
0
(12
,327
) (2
2,4
87
) (1
8,2
60
) (1
5,1
69
) (1
5,2
18
) (1
5,2
77
) (1
6,0
65
) (3
58
,10
8)
Ad
min
istr
ation
Fee
s
7
–
(3,1
03
) (2
) –
–
–
–
(1,7
11
,35
9)
Lis
ting
Exp
en
se
0
–
–
–
–
–
–
(16
,185
) (1
6,1
85
) O
the
r E
xpe
nse
s
0
(68
,203
) (1
52
,17
7)
(10
5,0
09
) (1
05
,66
1)
(10
7,0
92
) (6
8,5
52
) (5
5,5
74
) (2
,24
0,1
88
) R
eb
ate
to
the
Fun
d d
ue
to c
app
ing
7
5
8,9
88
–
11
6,7
60
14
1,1
32
11
0,0
68
86
,915
76
,741
1,2
02
,00
0
To
tal
op
era
tin
g e
xp
en
ses
0
(2
06
,35
3)
(4,2
62
,87
0)
(18
7,3
61
) (3
1,8
72
) (9
8,6
08
) (7
1,4
08
) (3
8,9
66
) (3
7,8
04
,204
)
0
Net
Inc
om
e a
nd
Net
gain
/(lo
ss
) 0
3
,23
7,7
10
12
,292
,162
1,4
68
,54
5
32
0,4
83
47
0,0
54
48
1,0
92
54
2,7
79
32
3,3
77
,24
1
0
F
ina
nce
Co
sts
Ba
nk In
tere
st
0
(61
) (8
5,9
39
) (2
,60
9)
(20
8)
(14
) –
(41
) (9
5,5
21
) D
istr
ibu
tion
s
6
–
(45
7,5
79
) –
–
–
–
(71
,039
) (3
9,4
06
,043
) G
ain
/(L
os
s)
for
the
pe
rio
d b
efo
re t
axa
tio
n
0
3,2
37
,64
9
11
,748
,644
1,4
65
,93
6
32
0,2
75
47
0,0
40
48
1,0
92
47
1,6
99
28
3,8
75
,67
7
0
W
ithho
ldin
g T
ax
on
div
ide
nd
s
2,
3
(25
,023
) –
–
–
–
–
–
(3,6
61
,38
1)
With
ho
ldin
g T
ax
on
co
upo
n in
co
me
2
, 3
–
(53
,379
) (1
1,2
06
) 4
93
(21
,543
) (1
,65
2)
–
(57
6,5
49
)
0
Inc
rea
se
/(D
ec
rea
se
) in
Net
As
se
ts A
ttri
bu
tab
le t
o R
ed
eem
ab
le
P
art
icip
ati
ng
Un
ith
old
ers
at
Mid
Ma
rke
t P
ric
es
0
3
,21
2,6
26
11
,695
,265
1,4
54
,73
0
32
0,7
68
44
8,4
97
47
9,4
40
47
1,6
99
27
9,6
37
,74
7
0
1C
usto
dia
n (
until
17 M
arc
h 2
016)
and D
epositary
(fr
om
18 M
arc
h 2
016).
G
ain
s a
nd loss
es a
rose s
ole
ly f
rom
continuin
g in
vestm
ent act
ivitie
s. T
here
were
no g
ain
s o
r lo
sses
oth
er
than t
hose d
ealt
wit
h in t
he S
tate
ment
of
Com
pre
hensi
ve I
ncom
e
**G
lobal S
hort
Dura
tion H
igh Y
ield
Fund term
inate
d o
n 1
July
2016.
***R
eal E
sta
te D
ebt F
und launched o
n 2
1 M
arc
h 2
016.
S
igned o
n b
ehalf
of P
rincip
al G
lobal In
vest
ors
(Ir
ela
nd)
Lim
ited o
n 2
4 J
anuary
2017.
Directo
r: _
___________________
__________ D
irecto
r:__
__________________________
___
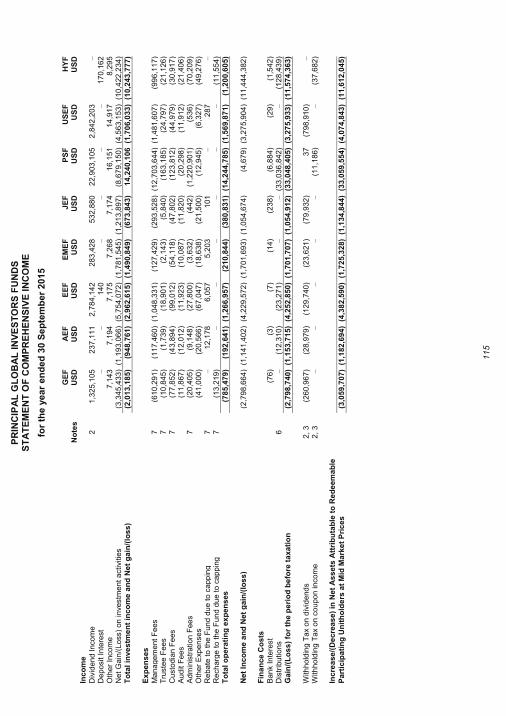
PR
INC
IPA
L G
LO
BA
L IN
VE
ST
OR
S F
UN
DS
S
TA
TE
ME
NT
OF
CO
MP
RE
HE
NS
IVE
IN
CO
ME
for
the y
ear
en
ded
30 S
ep
tem
ber
201
5
115
GE
F
AE
F
EE
F
EM
EF
J
EF
P
SF
U
SE
F
HY
F
N
ote
s
US
D
US
D
US
D
US
D
US
D
US
D
US
D
US
D
Inc
om
e
0
Div
ide
nd
In
com
e
2
1,3
25
,10
5
23
7,1
11
2,7
84
,14
2
28
3,4
28
53
2,8
80
22
,903
,105
2,8
42
,20
3
–
Dep
osi
t In
tere
st
0
–
–
14
0
–
–
–
–
17
0,1
62
Oth
er
Inco
me
0
7,1
43
7,1
94
7,1
75
7,2
68
7,1
74
16
,151
14
,917
8,2
95
Net
Gain
/(Lo
ss)
on
in
vestm
en
t a
ctivi
ties
0
(3,3
45
,43
3)
(1,1
93
,06
6)
(5,7
54
,07
2)
(1,7
81
,54
5)
(1,2
13
,89
7)
(8,6
79
,15
0)
(4,5
63
,15
3)
(10
,422
,234
) T
ota
l in
ve
stm
en
t in
co
me
an
d N
et
ga
in/(
loss
) 0
(2
,01
3,1
85
) (9
48
,76
1)
(2,9
62
,61
5)
(1,4
90
,84
9)
(67
3,8
43
) 1
4,2
40
,106 (1
,70
6,0
33
) (1
0,2
43
,777
)
0
E
xp
en
ses
0
Ma
na
ge
me
nt F
ees
7
(61
0,2
91
) (1
17
,46
0)
(1,0
48
,33
1)
(12
7,4
29
) (2
93
,52
8)
(12
,703
,644
) (1
,48
1,6
07
) (9
96
,11
7)
Tru
ste
e F
ee
s
7
(10
,845
) (1
,73
9)
(18
,901
) (2
,14
3)
(5,8
40
) (1
63
,18
5)
(24
,797
) (2
1,1
26
) C
usto
dia
n F
ees
7
(77
,852
) (4
3,8
94
) (9
9,0
12
) (5
4,1
18
) (4
7,8
02
) (1
23
,81
2)
(44
,979
) (3
0,9
17
) A
ud
it F
ee
s
0
(11
,867
) (1
2,0
12
) (1
1,9
23
) (1
0,0
87
) (1
1,8
20
) (2
0,2
98
) (1
1,9
12
) (2
1,4
06
) A
dm
inis
tra
tion
Fee
s
7
(20
,405
) (9
,14
8)
(27
,800
) (3
,63
2)
(44
2)
(1,2
20
,90
1)
(53
6)
(70
,209
) O
the
r E
xpe
nse
s
0
(41
,000
) (2
0,5
66
) (6
7,0
47
) (1
8,6
38
) (2
1,5
00
) (1
2,9
45
) (6
,32
7)
(49
,276
) R
eb
ate
to
the
Fun
d d
ue
to c
app
ing
7
–
12
,178
6,0
57
5,2
03
10
1
–
28
7
–
Rech
arg
e t
o t
he
Fu
nd d
ue t
o c
ap
pin
g
7
(13
,219
) –
–
–
–
–
–
(11
,554
) T
ota
l o
pe
rati
ng
ex
pen
ses
0
(7
85
,47
9)
(19
2,6
41
) (1
,26
6,9
57
) (2
10
,84
4)
(38
0,8
31
) (1
4,2
44
,785
) (1
,56
9,8
71
) (1
,20
0,6
05
)
0
N
et
Inc
om
e a
nd
Net
gain
/(lo
ss
) 0
(2
,79
8,6
64
) (1
,14
1,4
02
) (4
,22
9,5
72
) (1
,70
1,6
93
) (1
,05
4,6
74
) (4
,67
9)
(3,2
75
,90
4)
(11
,444
,382
)
0
Fin
an
ce
Co
sts
Ba
nk In
tere
st
0
(76
) (3
) (7
) (1
4)
(23
8)
(6,8
84
) (2
9)
(1,5
42
) D
istr
ibu
tion
s
6
–
(12
,310
) (2
3,2
71
) –
–
(33
,036
,842
) –
(12
8,4
39
) G
ain
/(L
os
s)
for
the
pe
rio
d b
efo
re t
axa
tio
n
0
(2,7
98
,74
0)
(1,1
53
,71
5)
(4,2
52
,85
0)
(1,7
01
,70
7)
(1,0
54
,91
2)
(33
,048
,405
) (3
,27
5,9
33
) (1
1,5
74
,363
)
0
W
ithho
ldin
g T
ax
on
div
ide
nd
s
2,
3
(26
0,9
67
) (2
8,9
79
) (1
29
,74
0)
(23
,621
) (7
9,9
32
) 3
7
(79
8,9
10
) –
With
ho
ldin
g T
ax
on
co
upo
n in
co
me
2
, 3
–
–
–
–
–
(11
,186
) –
(37
,682
)
0
Inc
rea
se
/(D
ec
rea
se
) in
Net
As
se
ts A
ttri
bu
tab
le t
o R
ed
eem
ab
le
P
art
icip
ati
ng
Un
ith
old
ers
at
Mid
Ma
rke
t P
ric
es
0
(3
,05
9,7
07
) (1
,18
2,6
94
) (4
,38
2,5
90
) (1
,72
5,3
28
) (1
,13
4,8
44
) (3
3,0
59
,554
) (4
,07
4,8
43
) (1
1,6
12
,045
)
0
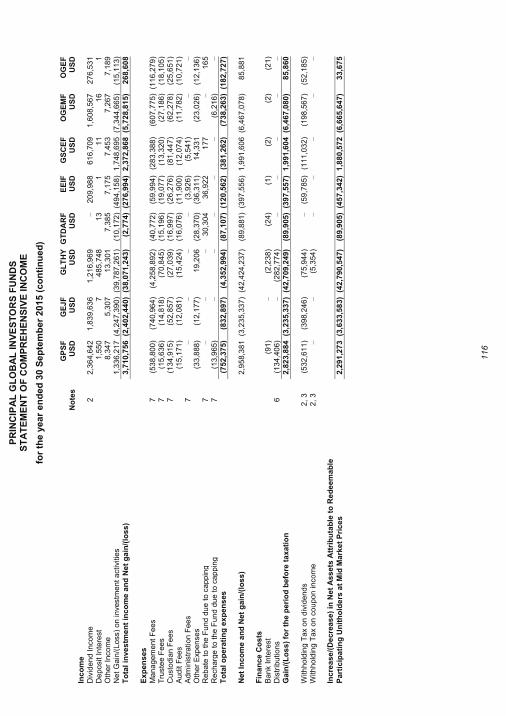
PR
INC
IPA
L G
LO
BA
L IN
VE
ST
OR
S F
UN
DS
S
TA
TE
ME
NT
OF
CO
MP
RE
HE
NS
IVE
IN
CO
ME
for
the y
ear
en
ded
30 S
ep
tem
ber
201
5 (
co
nti
nu
ed
)
116
GP
SF
G
EJ
F
GL
TH
Y
GT
DA
RF
E
EIF
G
SC
EF
O
GE
MF
O
GE
F
N
ote
s
US
D
US
D
US
D
US
D
US
D
US
D
US
D
US
D
Inc
om
e
0
Div
ide
nd
In
com
e
2
2,3
64
,64
2
1,8
39
,63
6
1,2
16
,96
9
–
20
9,9
88
61
6,7
09
1,6
08
,56
7
27
6,5
31
Dep
osi
t In
tere
st
0
1,5
50
7
48
5,7
48
13
1
11
16
1
Oth
er
Inco
me
0
8,3
47
5,3
07
13
,301
7,3
85
7,1
75
7,4
53
7,2
67
7,1
89
Net
Gain
/(Lo
ss)
on
in
vestm
en
t a
ctivi
ties
0
1,3
36
,21
7
(4,2
47
,39
0)
(39
,787
,261
) (1
0,1
72
) (4
94
,15
8)
1,7
48
,69
5 (7
,34
4,6
65
) (1
5,1
13
) T
ota
l in
ve
stm
en
t in
co
me
an
d N
et
ga
in/(
loss
) 0
3
,71
0,7
56
(2,4
02
,44
0)
(38
,071
,243
) (2
,77
4)
(27
6,9
94
) 2
,37
2,8
68 (5
,72
8,8
15
) 2
68
,60
8
0
E
xp
en
ses
0
Ma
na
ge
me
nt F
ees
7
(53
8,8
00
) (7
40
,96
4)
(4,2
58
,89
2)
(40
,772
) (5
9,9
94
) (2
83
,38
8)
(60
7,7
75
) (1
16
,27
9)
Tru
ste
e F
ee
s
7
(15
,636
) (1
4,8
18
) (7
0,8
45
) (1
5,1
96
) (1
9,0
77
) (1
3,3
20
) (2
7,1
86
) (1
8,1
05
) C
usto
dia
n F
ees
7
(13
4,9
15
) (5
2,8
57
) (2
7,0
39
) (1
6,9
97
) (2
6,2
76
) (8
1,4
47
) (6
2,2
78
) (2
5,6
51
) A
ud
it F
ee
s
0
(15
,171
) (1
2,0
81
) (1
5,4
24
) (1
6,0
76
) (1
1,9
00
) (1
2,0
74
) (1
1,7
82
) (1
0,7
21
) A
dm
inis
tra
tion
Fee
s
7
–
–
–
–
(3,9
26
) (5
,54
1)
–
–
Oth
er
Exp
en
se
s
0
(33
,888
) (1
2,1
77
) 1
9,2
06
(28
,370
) (3
6,3
11
) 1
4,3
31
(23
,026
) (1
2,1
36
) R
eb
ate
to
the
Fun
d d
ue
to c
app
ing
7
–
–
–
30
,304
36
,922
17
7
–
16
5
Rech
arg
e t
o t
he
Fu
nd d
ue t
o c
ap
pin
g
7
(13
,965
) –
–
–
–
–
(6,2
16
) –
To
tal
op
era
tin
g e
xp
en
ses
0
(7
52
,37
5)
(83
2,8
97
) (4
,35
2,9
94
) (8
7,1
07
) (1
20
,56
2)
(38
1,2
62
) (7
38
,26
3)
(18
2,7
27
)
0
Net
Inc
om
e a
nd
Net
gain
/(lo
ss
) 0
2
,95
8,3
81
(3,2
35
,33
7)
(42
,424
,237
) (8
9,8
81
) (3
97
,55
6)
1,9
91
,60
6 (6
,46
7,0
78
) 8
5,8
81
0
F
ina
nce
Co
sts
Ba
nk In
tere
st
0
(91
) –
(2,2
38
) (2
4)
(1)
(2)
(2)
(21
) D
istr
ibu
tion
s
6
(13
4,4
06
) –
(28
2,7
74
) –
–
–
–
–
Ga
in/(
Lo
ss
) fo
r th
e p
eri
od
be
fore
ta
xa
tio
n
0
2,8
23
,88
4
(3,2
35
,33
7)
(42
,709
,249
) (8
9,9
05
) (3
97
,55
7)
1,9
91
,60
4 (6
,46
7,0
80
) 8
5,8
60
0
W
ithho
ldin
g T
ax
on
div
ide
nd
s
2,
3
(53
2,6
11
) (3
98
,24
6)
(75
,944
) –
(59
,785
) (1
11
,03
2)
(19
8,5
67
) (5
2,1
85
) W
ithho
ldin
g T
ax
on
co
upo
n inco
me
2,
3
–
–
(5,3
54
) –
–
–
–
–
0
In
cre
ase
/(D
ec
rea
se
) in
Net
As
se
ts A
ttri
bu
tab
le t
o R
ed
eem
ab
le
P
art
icip
ati
ng
Un
ith
old
ers
at
Mid
Ma
rke
t P
ric
es
0
2
,29
1,2
73
(3,6
33
,58
3)
(42
,790
,547
) (8
9,9
05
) (4
57
,34
2)
1,8
80
,57
2 (6
,66
5,6
47
) 3
3,6
75
0
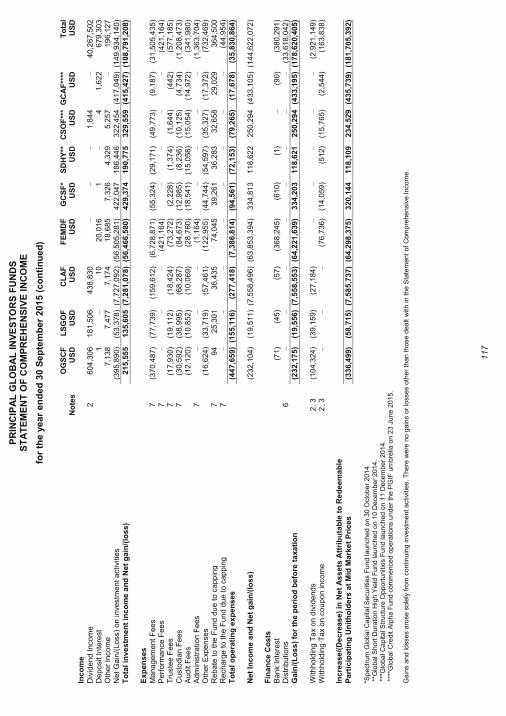
PR
INC
IPA
L G
LO
BA
L IN
VE
ST
OR
S F
UN
DS
S
TA
TE
ME
NT
OF
CO
MP
RE
HE
NS
IVE
IN
CO
ME
for
the y
ear
en
ded
30 S
ep
tem
ber
201
5 (
co
nti
nu
ed
)
117
OG
SC
F
LS
GO
F
CL
AF
F
EM
DF
G
CS
F*
SD
HY
**
CS
OF
***
GC
AF
****
T
ota
l
No
tes
US
D
US
D
US
D
US
D
US
D
US
D
US
D
US
D
US
D
Inc
om
e
0
D
ivid
en
d In
com
e
2
60
4,3
06
18
1,5
06
43
8,8
30
–
–
–
1,8
44
–
40
,267
,502
Dep
osi
t In
tere
st
0
1
–
10
20
,016
1
–
4
1,6
22
67
9,3
03
Oth
er
Inco
me
0
7,1
38
7,4
77
7,1
74
18
,685
7,3
26
4,3
29
5,2
57
–
19
6,1
27
Net
Ga
in/(
Lo
ss)
on
in
vestm
en
t a
ctivi
ties
0
(39
5,8
90
) (5
3,3
78
) (7
,72
7,0
92
) (5
6,5
05
,281
) 4
22
,04
7
18
6,4
46
32
2,4
54
(41
7,0
49
) (1
49
,93
4,1
40
) T
ota
l in
ve
stm
en
t in
co
me
an
d N
et
ga
in/(
loss
) 0
2
15
,55
5
13
5,6
05
(7,2
81
,07
8)
(56
,466
,580
) 4
29
,37
4
19
0,7
75
32
9,5
59
(41
5,4
27
) (1
08
,79
1,2
08
)
0
E
xp
en
ses
0
M
an
ag
em
en
t F
ees
7
(37
0,4
87
) (7
7,7
39
) (1
59
,61
2)
(6,7
28
,87
1)
(55
,324
) (2
9,1
71
) (4
9,7
73
) (9
,18
7)
(31
,505
,435
) P
erf
orm
an
ce F
ee
s
7
–
–
–
(42
1,1
64
) –
–
–
–
(42
1,1
64
) T
ruste
e F
ee
s
7
(17
,930
) (1
9,1
12
) (1
8,4
24
) (7
3,2
72
) (2
,22
8)
(1,3
74
) (1
,64
4)
(44
2)
(57
7,1
85
) C
usto
dia
n F
ees
7
(30
,592
) (3
8,9
95
) (6
8,2
87
) (8
4,6
73
) (1
2,9
85
) (8
,23
6)
(10
,125
) (4
,73
4)
(1,2
08
,47
3)
Au
dit F
ee
s
0
(12
,120
) (1
0,8
52
) (1
0,0
69
) (2
8,7
60
) (1
8,5
41
) (1
5,0
58
) (1
5,0
54
) (1
4,9
72
) (3
41
,98
0)
Ad
min
istr
ation
Fee
s
7
–
–
–
(1,1
64
) –
–
–
–
(1,3
63
,70
4)
Oth
er
Exp
en
se
s
0
(16
,624
) (3
3,7
19
) (5
7,4
61
) (1
22
,95
5)
(44
,744
) (5
4,5
97
) (3
5,3
27
) (1
7,3
72
) (7
32
,46
9)
Reb
ate
to
the
Fun
d d
ue
to c
app
ing
7
9
4
25
,301
36
,435
74
,045
39
,261
36
,283
32
,658
29
,029
36
4,5
00
Rech
arg
e t
o t
he
Fu
nd d
ue t
o c
ap
pin
g
7
–
–
–
–
–
–
–
–
(44
,954
) T
ota
l o
pe
rati
ng
ex
pen
ses
0
(4
47
,65
9)
(15
5,1
16
) (2
77
,41
8)
(7,3
86
,81
4)
(94
,561
) (7
2,1
53
) (7
9,2
65
) (1
7,6
78
) (3
5,8
30
,864
)
0
Net
Inc
om
e a
nd
Net
gain
/(lo
ss
) 0
(2
32
,10
4)
(19
,511
) (7
,55
8,4
96
) (6
3,8
53
,394
) 3
34
,81
3
11
8,6
22
25
0,2
94
(43
3,1
05
) (1
44
,62
2,0
72
)
0
F
ina
nce
Co
sts
B
an
k In
tere
st
0
(71
) (4
5)
(57
) (3
68
,24
5)
(61
0)
(1)
–
(90
) (3
80
,29
1)
Dis
trib
utio
ns
6
–
–
–
–
–
–
–
–
(33
,618
,042
) G
ain
/(L
os
s)
for
the
pe
rio
d b
efo
re t
axa
tio
n
0
(23
2,1
75
) (1
9,5
56
) (7
,55
8,5
53
) (6
4,2
21
,639
) 3
34
,20
3
11
8,6
21
25
0,2
94
(43
3,1
95
) (1
78
,62
0,4
05
)
0
With
ho
ldin
g T
ax
on
div
ide
nd
s
2,
3
(10
4,3
24
) (3
9,1
59
) (2
7,1
84
) –
–
–
–
–
(2,9
21
,14
9)
With
ho
ldin
g T
ax
on
co
upo
n in
co
me
2
, 3
–
–
–
(76
,736
) (1
4,0
59
) (5
12
) (1
5,7
65
) (2
,54
4)
(16
3,8
38
)
0
In
cre
ase
/(D
ec
rea
se
) in
Net
As
se
ts A
ttri
bu
tab
le t
o R
ed
eem
ab
le
Pa
rtic
ipa
tin
g U
nit
ho
lde
rs a
t M
id M
ark
et
Pri
ce
s
0
(33
6,4
99
) (5
8,7
15
) (7
,58
5,7
37
) (6
4,2
98
,375
) 3
20
,14
4
11
8,1
09
23
4,5
29
(43
5,7
39
) (1
81
,70
5,3
92
)
0
*Spect
rum
Glo
bal C
apital S
ecuritie
s F
und launched o
n 3
0 O
cto
ber
2014.
**G
lobal S
hort
Dura
tion H
igh Y
ield
Fund launched o
n 1
0 D
ecem
ber
2014.
***
Glo
bal C
apita
l Str
uctu
re O
pport
unitie
s F
und launched o
n 1
1 D
ece
mber
2014.
***
*Glo
bal C
redit
Alp
ha F
und c
om
menced o
pera
tions u
nder
the P
GIF
um
bre
lla o
n 2
3 J
une 2
015.
Gain
s a
nd loss
es a
rose s
ole
ly f
rom
continuin
g in
vestm
ent act
ivitie
s. T
here
were
no g
ain
s o
r lo
sses
oth
er
than t
hose d
ealt
wit
h in t
he S
tate
ment
of
Com
pre
hensi
ve I
ncom
e.
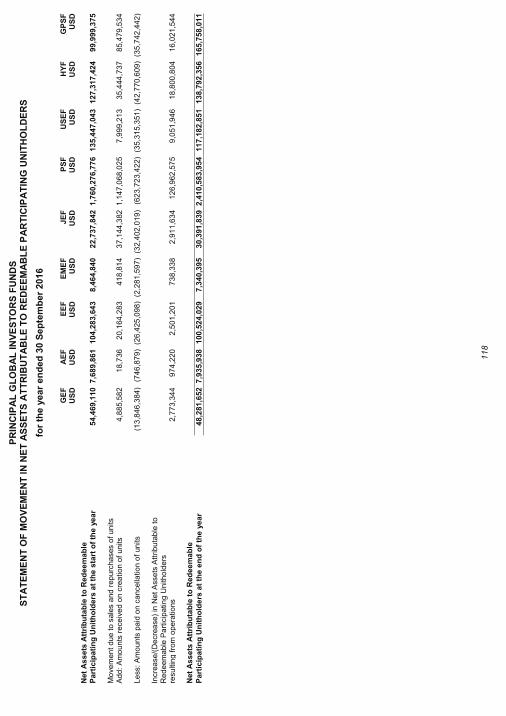
PR
INC
IPA
L G
LO
BA
L IN
VE
ST
OR
S F
UN
DS
S
TA
TE
ME
NT
OF
MO
VE
ME
NT
IN
NE
T A
SS
ET
S A
TT
RIB
UT
AB
LE
TO
RE
DE
EM
AB
LE
PA
RT
ICIP
AT
ING
UN
ITH
OL
DE
RS
for
the y
ear
en
ded
30 S
ep
tem
ber
201
6
118
GE
F
AE
F
EE
F
EM
EF
J
EF
P
SF
U
SE
F
HY
F
GP
SF
US
D
US
D
US
D
US
D
US
D
US
D
US
D
US
D
US
D
Net
As
se
ts A
ttri
bu
tab
le t
o R
ed
ee
ma
ble
P
art
icip
ati
ng
Un
ith
old
ers
at
the
sta
rt o
f th
e y
ea
r
54
,469
,110 7
,68
9,8
61
10
4,2
83
,64
3
8,4
64
,84
0
22
,737
,842 1
,76
0,2
76
,77
6
13
5,4
47
,04
3
12
7,3
17
,42
4
99
,999
,375
M
ove
me
nt
du
e t
o s
ale
s a
nd
rep
urc
ha
ses o
f u
nits
Ad
d:
Am
ou
nts
rece
ived
on
cre
atio
n o
f un
its
4
,88
5,5
82
18
,736
20
,164
,283
41
8,8
14
37
,144
,382 1
,14
7,0
68
,02
5
7,9
99
,21
3
35
,444
,737
85
,479
,534
L
ess
: A
mo
un
ts p
aid
on
ca
nce
llatio
n o
f un
its
(1
3,8
46
,384
) (7
46
,87
9)
(26
,425
,098
) (2
,28
1,5
97
) (3
2,4
02
,019
) (6
23
,72
3,4
22
) (3
5,3
15
,351
) (4
2,7
70
,609
) (3
5,7
42
,442
)
Incre
ase
/(D
ecre
ase)
in N
et
Ass
ets
Att
rib
uta
ble
to
R
ed
ee
ma
ble
Pa
rtic
ipa
ting
Unith
old
ers
re
su
ltin
g f
rom
ope
ratio
ns
2
,77
3,3
44
97
4,2
20
2,5
01
,20
1
73
8,3
38
2,9
11
,63
4
12
6,9
62
,57
5
9,0
51
,94
6
18
,800
,804
16
,021
,544
N
et
As
se
ts A
ttri
bu
tab
le t
o R
ed
ee
ma
ble
0
Pa
rtic
ipa
tin
g U
nit
ho
lde
rs a
t th
e e
nd
of
the
ye
ar
0
48
,281
,652 7
,93
5,9
38
10
0,5
24
,02
9
7,3
40
,39
5
30
,391
,839 2
,41
0,5
83
,95
4
11
7,1
82
,85
1
13
8,7
92
,35
6
16
5,7
58
,01
1
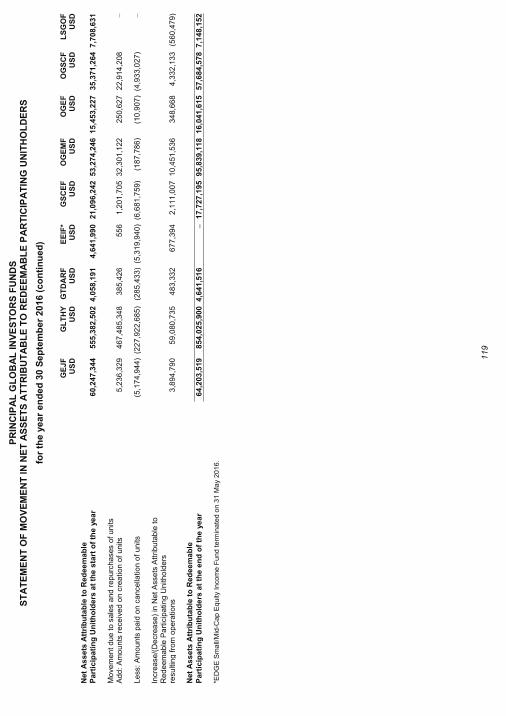
PR
INC
IPA
L G
LO
BA
L IN
VE
ST
OR
S F
UN
DS
S
TA
TE
ME
NT
OF
MO
VE
ME
NT
IN
NE
T A
SS
ET
S A
TT
RIB
UT
AB
LE
TO
RE
DE
EM
AB
LE
PA
RT
ICIP
AT
ING
UN
ITH
OL
DE
RS
for
the y
ear
en
ded
30 S
ep
tem
ber
201
6 (
co
nti
nu
ed
)
119
GE
JF
G
LT
HY
G
TD
AR
F
EE
IF*
GS
CE
F
OG
EM
F
OG
EF
O
GS
CF
L
SG
OF
US
D
US
D
US
D
US
D
US
D
US
D
US
D
US
D
US
D
Net
As
se
ts A
ttri
bu
tab
le t
o R
ed
ee
ma
ble
P
art
icip
ati
ng
Un
ith
old
ers
at
the
sta
rt o
f th
e y
ea
r
60
,247
,344
55
5,3
82
,50
2
4,0
58
,19
1
4,6
41
,99
0
21
,096
,242
53
,274
,246
15
,453
,227
35
,371
,264
7,7
08
,63
1
M
ove
me
nt
du
e t
o s
ale
s a
nd
rep
urc
ha
ses o
f u
nits
Ad
d:
Am
ou
nts
rece
ived
on
cre
atio
n o
f un
its
5
,23
6,3
29
46
7,4
85
,34
8
38
5,4
26
55
6
1,2
01
,70
5
32
,301
,122
25
0,6
27
22
,914
,208
–
L
ess
: A
mo
un
ts p
aid
on
ca
nce
llatio
n o
f un
its
(5
,17
4,9
44
) (2
27
,92
2,6
85
) (2
85
,43
3)
(5,3
19
,94
0)
(6,6
81
,75
9)
(18
7,7
86
) (1
0,9
07
) (4
,93
3,0
27
) –
In
cre
ase
/(D
ecre
ase)
in N
et
Ass
ets
Att
rib
uta
ble
to
R
ed
ee
ma
ble
Pa
rtic
ipa
ting
Unith
old
ers
re
su
ltin
g f
rom
ope
ratio
ns
3
,89
4,7
90
59
,080
,735
48
3,3
32
67
7,3
94
2,1
11
,00
7
10
,451
,536
34
8,6
68
4,3
32
,13
3
(56
0,4
79
)
Net
As
se
ts A
ttri
bu
tab
le t
o R
ed
ee
ma
ble
0
Pa
rtic
ipa
tin
g U
nit
ho
lde
rs a
t th
e e
nd
of
the
ye
ar
0
64
,203
,519
85
4,0
25
,90
0
4,6
41
,51
6
–
17
,727
,195
95
,839
,118
16
,041
,615
57
,684
,578
7,1
48
,15
2
*ED
GE
Sm
all/
Mid
-Cap E
quity
Inco
me F
und term
inate
d o
n 3
1 M
ay 2
016.
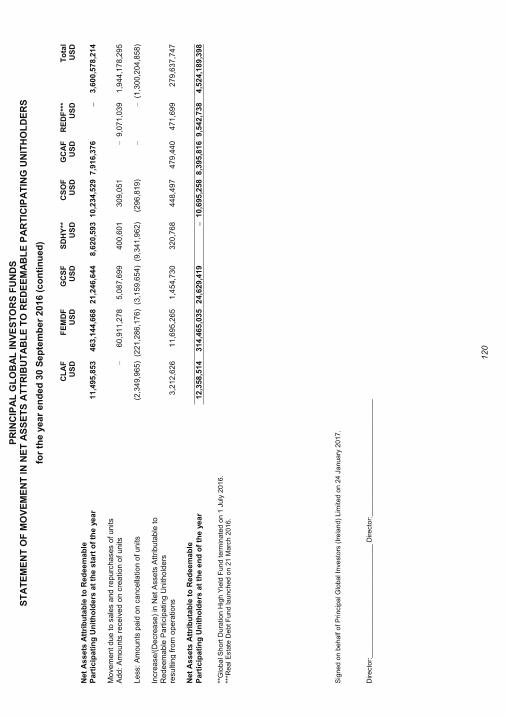
PR
INC
IPA
L G
LO
BA
L IN
VE
ST
OR
S F
UN
DS
S
TA
TE
ME
NT
OF
MO
VE
ME
NT
IN
NE
T A
SS
ET
S A
TT
RIB
UT
AB
LE
TO
RE
DE
EM
AB
LE
PA
RT
ICIP
AT
ING
UN
ITH
OL
DE
RS
for
the y
ear
en
ded
30 S
ep
tem
ber
201
6 (
co
nti
nu
ed
)
120
CL
AF
F
EM
DF
G
CS
F
SD
HY
**
CS
OF
G
CA
F
RE
DF
***
To
tal
US
D
US
D
US
D
US
D
US
D
US
D
US
D
US
D
Net
As
se
ts A
ttri
bu
tab
le t
o R
ed
ee
ma
ble
P
art
icip
ati
ng
Un
ith
old
ers
at
the
sta
rt o
f th
e y
ea
r
11
,495
,853
46
3,1
44
,66
8
21
,246
,644
8,6
20
,59
3
10
,234
,529 7
,91
6,3
76
–
3,6
00
,57
8,2
14
Mo
vem
en
t du
e t
o s
ale
s a
nd
rep
urc
ha
ses o
f u
nits
Ad
d:
Am
ou
nts
rece
ived
on
cre
atio
n o
f un
its
–
60
,911
,278
5,0
87
,69
9
40
0,6
01
30
9,0
51
–
9,0
71
,03
9
1,9
44
,17
8,2
95
Le
ss:
Am
ou
nts
pa
id o
n c
ance
llatio
n o
f un
its
(2
,34
9,9
65
) (2
21
,28
6,1
76
) (3
,15
9,6
54
) (9
,34
1,9
62
) (2
96
,81
9)
–
–
(1,3
00
,20
4,8
58
)
In
cre
ase
/(D
ecre
ase)
in N
et
Ass
ets
Att
rib
uta
ble
to
R
ed
ee
ma
ble
Pa
rtic
ipa
ting
Unith
old
ers
re
su
ltin
g f
rom
ope
ratio
ns
3
,21
2,6
26
11
,695
,265
1,4
54
,73
0
32
0,7
68
44
8,4
97
47
9,4
40
47
1,6
99
27
9,6
37
,74
7
Net
As
se
ts A
ttri
bu
tab
le t
o R
ed
ee
ma
ble
0
P
art
icip
ati
ng
Un
ith
old
ers
at
the
en
d o
f th
e y
ea
r 0
1
2,3
58
,514
31
4,4
65
,03
5
24
,629
,419
–
10
,695
,258 8
,39
5,8
16
9,5
42
,73
8
4,5
24
,18
9,3
98
**G
lobal S
hort
Dura
tion H
igh Y
ield
Fund term
inate
d o
n 1
July
2016.
***R
eal E
sta
te D
ebt F
und launched o
n 2
1 M
arc
h 2
016.
S
igned o
n b
ehalf
of P
rincip
al G
lobal In
vest
ors
(Ir
ela
nd)
Lim
ited o
n 2
4 J
anuary
2017.
Directo
r:____________________
__________ D
irecto
r:___
_________________________
___
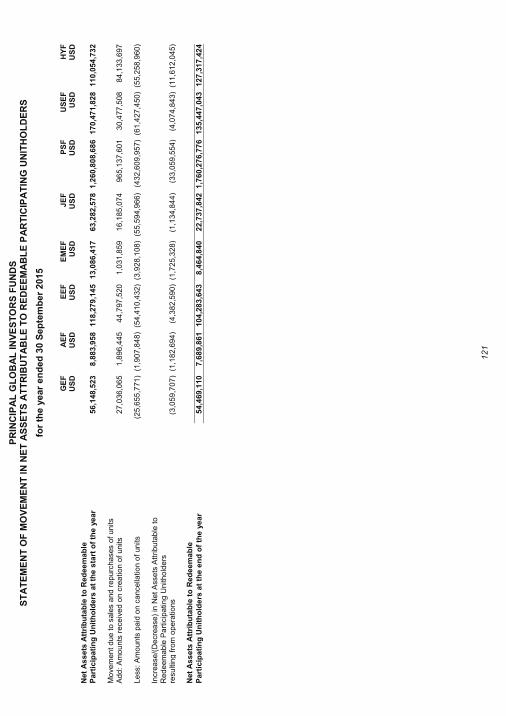
PR
INC
IPA
L G
LO
BA
L IN
VE
ST
OR
S F
UN
DS
S
TA
TE
ME
NT
OF
MO
VE
ME
NT
IN
NE
T A
SS
ET
S A
TT
RIB
UT
AB
LE
TO
RE
DE
EM
AB
LE
PA
RT
ICIP
AT
ING
UN
ITH
OL
DE
RS
for
the y
ear
en
ded
30 S
ep
tem
ber
201
5
121
GE
F
AE
F
EE
F
EM
EF
J
EF
P
SF
U
SE
F
HY
F
US
D
US
D
US
D
US
D
US
D
US
D
US
D
US
D
Net
As
se
ts A
ttri
bu
tab
le t
o R
ed
ee
ma
ble
P
art
icip
ati
ng
Un
ith
old
ers
at
the
sta
rt o
f th
e y
ea
r
56
,148
,523
8,8
83
,95
8
11
8,2
79
,14
5
13
,086
,417
63
,282
,578
1,2
60
,80
8,6
86
1
70
,47
1,8
28
11
0,0
54
,73
2
Mo
vem
en
t du
e t
o s
ale
s a
nd
rep
urc
ha
ses o
f u
nits
Ad
d:
Am
ou
nts
rece
ived
on
cre
atio
n o
f un
its
2
7,0
36
,065
1,8
96
,44
5
44
,797
,520
1,0
31
,85
9
16
,185
,074
96
5,1
37
,60
1
30
,477
,508
84
,133
,697
Le
ss:
Am
ou
nts
pa
id o
n c
ance
llatio
n o
f un
its
(2
5,6
55
,771
) (1
,90
7,8
48
) (5
4,4
10
,432
) (3
,92
8,1
08
) (5
5,5
94
,966
) (4
32
,60
9,9
57
) (6
1,4
27
,450
) (5
5,2
58
,960
)
In
cre
ase
/(D
ecre
ase)
in N
et
Ass
ets
Att
rib
uta
ble
to
R
ed
ee
ma
ble
Pa
rtic
ipa
ting
Unith
old
ers
re
su
ltin
g f
rom
ope
ratio
ns
(3
,05
9,7
07
) (1
,18
2,6
94
) (4
,38
2,5
90
) (1
,72
5,3
28
) (1
,13
4,8
44
) (3
3,0
59
,554
) (4
,07
4,8
43
) (1
1,6
12
,045
)
N
et
As
se
ts A
ttri
bu
tab
le t
o R
ed
ee
ma
ble
0
P
art
icip
ati
ng
Un
ith
old
ers
at
the
en
d o
f th
e y
ea
r 0
5
4,4
69
,110
7,6
89
,86
1
10
4,2
83
,64
3
8,4
64
,84
0
22
,737
,842
1,7
60
,27
6,7
76
1
35
,44
7,0
43
12
7,3
17
,42
4
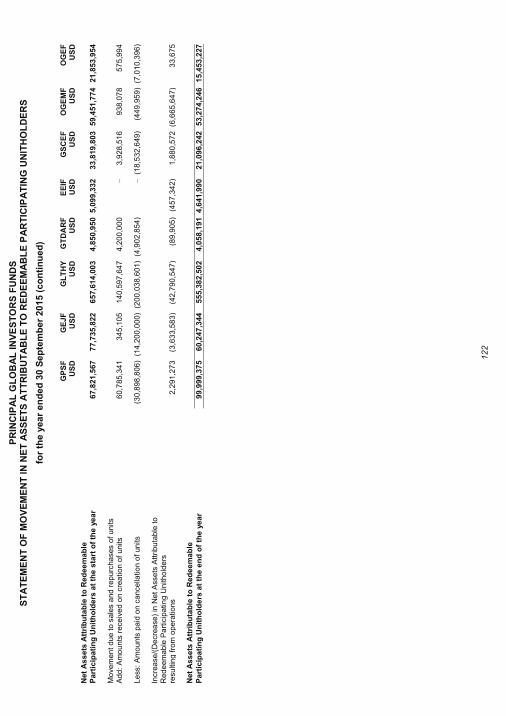
PR
INC
IPA
L G
LO
BA
L IN
VE
ST
OR
S F
UN
DS
S
TA
TE
ME
NT
OF
MO
VE
ME
NT
IN
NE
T A
SS
ET
S A
TT
RIB
UT
AB
LE
TO
RE
DE
EM
AB
LE
PA
RT
ICIP
AT
ING
UN
ITH
OL
DE
RS
for
the y
ear
en
ded
30 S
ep
tem
ber
201
5 (
co
nti
nu
ed
)
122
GP
SF
G
EJ
F
GL
TH
Y
GT
DA
RF
E
EIF
G
SC
EF
O
GE
MF
O
GE
F
US
D
US
D
US
D
US
D
US
D
US
D
US
D
US
D
Net
As
se
ts A
ttri
bu
tab
le t
o R
ed
ee
ma
ble
P
art
icip
ati
ng
Un
ith
old
ers
at
the
sta
rt o
f th
e y
ea
r
67
,821
,567
77
,735
,822
65
7,6
14
,00
3
4,8
50
,95
0
5,0
99
,33
2
33
,819
,803
59
,451
,774
21
,853
,954
Mo
vem
en
t du
e t
o s
ale
s a
nd
rep
urc
ha
ses o
f u
nits
Ad
d:
Am
ou
nts
rece
ived
on
cre
atio
n o
f un
its
6
0,7
85
,341
34
5,1
05
14
0,5
97
,64
7
4,2
00
,00
0
–
3,9
28
,51
6
93
8,0
78
57
5,9
94
Le
ss:
Am
ou
nts
pa
id o
n c
ance
llatio
n o
f un
its
(3
0,8
98
,806
) (1
4,2
00
,000
) (2
00
,03
8,6
01
) (4
,90
2,8
54
) –
(18
,532
,649
) (4
49
,95
9)
(7,0
10
,39
6)
Incre
ase
/(D
ecre
ase)
in N
et
Ass
ets
Att
rib
uta
ble
to
Red
ee
ma
ble
Pa
rtic
ipa
ting
Unith
old
ers
re
su
ltin
g f
rom
ope
ratio
ns
2
,29
1,2
73
(3,6
33
,58
3)
(42
,790
,547
) (8
9,9
05
) (4
57
,34
2)
1,8
80
,57
2
(6,6
65
,64
7)
33
,675
Net
As
se
ts A
ttri
bu
tab
le t
o R
ed
ee
ma
ble
0
P
art
icip
ati
ng
Un
ith
old
ers
at
the
en
d o
f th
e y
ea
r 0
9
9,9
99
,375
60
,247
,344
55
5,3
82
,50
2
4,0
58
,19
1
4,6
41
,99
0
21
,096
,242
53
,274
,246
15
,453
,227
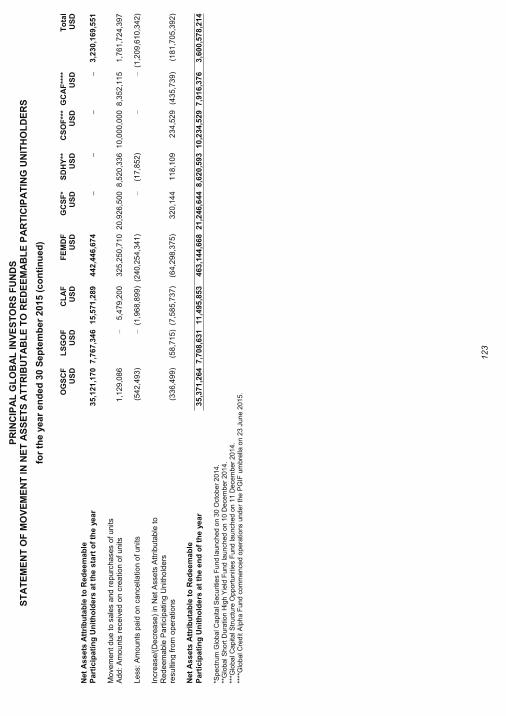
PR
INC
IPA
L G
LO
BA
L IN
VE
ST
OR
S F
UN
DS
S
TA
TE
ME
NT
OF
MO
VE
ME
NT
IN
NE
T A
SS
ET
S A
TT
RIB
UT
AB
LE
TO
RE
DE
EM
AB
LE
PA
RT
ICIP
AT
ING
UN
ITH
OL
DE
RS
for
the y
ear
en
ded
30 S
ep
tem
ber
201
5 (
co
nti
nu
ed
)
123
OG
SC
F
LS
GO
F
CL
AF
F
EM
DF
G
CS
F*
SD
HY
**
CS
OF
***
GC
AF
****
T
ota
l
US
D
US
D
US
D
US
D
US
D
US
D
US
D
US
D
US
D
Net
As
se
ts A
ttri
bu
tab
le t
o R
ed
ee
ma
ble
P
art
icip
ati
ng
Un
ith
old
ers
at
the
sta
rt o
f th
e y
ea
r
35
,121
,170 7
,76
7,3
46
15
,571
,289
44
2,4
46
,67
4
–
–
–
–
3,2
30
,16
9,5
51
Mo
vem
en
t du
e t
o s
ale
s a
nd
rep
urc
ha
ses o
f u
nits
Ad
d:
Am
ou
nts
rece
ived
on
cre
atio
n o
f un
its
1
,12
9,0
86
–
5,4
79
,20
0
32
5,2
50
,71
0
20
,926
,500
8,5
20
,33
6
10
,000
,000 8
,35
2,1
15
1,7
61
,72
4,3
97
Le
ss:
Am
ou
nts
pa
id o
n c
ance
llatio
n o
f un
its
(5
42
,49
3)
–
(1,9
68
,89
9)
(24
0,2
54
,34
1)
–
(17
,852
) –
–
(1,2
09
,61
0,3
42
)
Incre
ase
/(D
ecre
ase)
in N
et
Ass
ets
Att
rib
uta
ble
to
R
ed
ee
ma
ble
Pa
rtic
ipa
ting
Unith
old
ers
re
su
ltin
g f
rom
ope
ratio
ns
(3
36
,49
9)
(58
,715
) (7
,58
5,7
37
) (6
4,2
98
,375
) 3
20
,14
4
11
8,1
09
23
4,5
29
(43
5,7
39
) (1
81
,70
5,3
92
)
Net
As
se
ts A
ttri
bu
tab
le t
o R
ed
ee
ma
ble
0
Pa
rtic
ipa
tin
g U
nit
ho
lde
rs a
t th
e e
nd
of
the
ye
ar
0
35
,371
,264 7
,70
8,6
31
11
,495
,853
46
3,1
44
,66
8
21
,246
,644
8,6
20
,59
3
10
,234
,529 7
,91
6,3
76
3,6
00
,57
8,2
14
*Spect
rum
Glo
bal C
apital S
ecuritie
s F
und launched o
n 3
0 O
cto
ber
2014.
**G
lobal S
hort
Dura
tion H
igh Y
ield
Fund launched o
n 1
0 D
ecem
ber
2014.
***G
lobal C
apital S
truct
ure
Opport
unitie
s F
und launched o
n 1
1 D
ecem
ber
2014.
****
Glo
bal C
redit
Alp
ha F
und c
om
menced o
pera
tions u
nder
the P
GIF
um
bre
lla o
n 2
3 J
une 2
015.
PRINCIPAL GLOBAL INVESTORS FUNDS
NOTES TO THE ANNUAL REPORT AND FINANCIAL STATEMENTS
for the year ended 30 September 2016
124
1. FORMATION
The Principal Global Investors Funds (“the Trust”) was constituted under the laws of Ireland by a Trust Deed dated 13 October 1992 as an open-ended umbrella Unit Trust established as an Undertaking for Collective Investment in Transferable Securities (“UCITS”). It is an umbrella Unit Trust in that different classes of units may be issued from time to time by the Manager. Units of certain classes of the Trust are listed on the Irish Stock Exchange. The Trust has been authorised by the Central Bank of Ireland (the “Central Bank”) pursuant to the European Communities (Undertakings for Collective Investment in Transferable Securities) Regulations, 2011 (as amended), the Central Bank (Supervision and Enforcement Act 2013 (Section 48(1)) (Undertakings for Collective Investment in Transferable Securities) Regulations 2015, and the Central Bank (Supervision and Enforcement) Act 2013 (Section 48 (1)) (Undertakings for Collective Investment in Transferable Securities) (Amendment) Regulations 2016 (the “UCITS Regulations”).
The Financial Statements have been prepared for the year ended 30 September 2016.
The investment portfolios (“Funds”) of the Trust are listed on pages 4 to 6. The Portfolios of Investments are listed on pages 30 to 99 of which there is a change in presentation basis from country of incorporation to country of risk.
2. PRINCIPAL ACCOUNTING POLICIES
Accounting Convention and Basis of Accounting The financial statements are prepared in accordance with accounting standards generally accepted in Ireland (“Irish GAAP”) including Financial Reporting Standard (“FRS”) 102, the financial reporting standard applicable in the United Kingdom and Republic of Ireland and the provisions of the UCITS Regulations and the Hong Kong Securities and Futures Commission’s Code on Unit Trusts and Mutual Funds. Irish GAAP used in preparing financial statements which present a true and fair view are those standards published by the Institute of Chartered Accountants in Ireland (the “Institute”) and issued by the Financial Reporting Council (“FRC”). The Trust has also applied the “Amendments to FRS 102 – Fair value hierarchy disclosures” which were issued in March 2016 and are applicable for accounting periods beginning on or after 1 January 2017 with early application permitted. The Trust has taken the option to early adopt the amendments.
The Trust has availed of the exemption available to open ended investment funds that hold a substantial proportion of highly liquid and fair valued investments under Section 7 “Statement of Cash Flows” of FRS 102 and is not presenting cash flow statements.
The report has been prepared on a going concern basis for all Funds in the Trust under the historical cost convention, as modified by the revaluation of financial assets at fair value through profit or loss except for the EDGE Small/Mid-Cap Equity Income Fund and Global Short Duration High Yield Fund which have terminated during the period – these have been prepared on a non-going concern basis. The report has been prepared in USD for all Funds on the platform. The functional and presentation currency of the Trust is the USD.
The format and certain wordings of the financial statements have been adapted from those contained in Irish statute so that, in the opinion of the Directors, they more appropriately reflect the nature of the Trusts business as an investment fund.
Under FRS 102, in accounting for its financial instruments a reporting entity is required to apply either (a) the full provisions of Section 11 "Basic Financial Instruments" and Section 12 "Other Financial Instruments Issues" of FRS 102, (b) the recognition and measurement provisions of International Accounting Standards (“IAS”) 39 “Financial Instruments: Recognition and Measurement” (“IAS 39”) and only the disclosure requirements of Sections 11 and 12 of FRS 102; or c) the recognition and measurement provisions of International Financial Reporting Standards (“IFRS”) 9 “Financial Instruments” (“IFRS 9”) and the disclosure requirements of Sections 11 and 12. The Trust has elected to apply the recognition and measurement provisions of IAS 39 and the disclosure requirements of Sections 11 and 12. The Trust has also early adopted the “Amendments to FRS 102 – Fair value hierarchy disclosures”.
The information required by FRS 102, to be included in a Statement of Total Recognised Gains and Losses and a Reconciliation of Movements in Shareholders’ Funds are, in the opinion of the Directors, contained in the Statements of Comprehensive Income and the Statements of Movement in Net Assets Attributable to Redeemable Participating Unitholders on pages 118 to 120. In arriving at the results for the period, all amounts in the Statements of Comprehensive Income on pages 112 to 114 relate to continuing activities except for the EDGE Small/Mid-Cap Equity Income Fund and Global Short Duration High Yield Fund which have terminated. In the opinion of the Directors, the financial statements give, in all other respects, the information required by the UCITS Regulations and the Hong Kong Securities and Futures Commission’s Code on Unit Trusts and Mutual Funds.
All gains or losses for the period are reflected in the Statements of Comprehensive Income on pages 112 to 114.
PRINCIPAL GLOBAL INVESTORS FUNDS
NOTES TO THE ANNUAL REPORT AND FINANCIAL STATEMENTS
for the year ended 30 September 2016 (continued)
125
2. PRINCIPAL ACCOUNTING POLICIES (continued)
Financial Instruments at Fair Value through Profit or Loss This category has two sub-categories: financial assets and liabilities held for trading, and those designated by the Investment Adviser at fair value through profit or loss at inception. All instruments on the Portfolio of Investments are classified as held at fair value through profit or loss. Subsequent to initial recognition, all instruments classified at fair value through profit or loss are measured at fair value with changes in their fair value recognised in the Statement of Comprehensive Income. Financial assets are derecognised when the rights to receive the cashflow from the investments have expired or the Funds have transferred substantially all of the risks or rewards of ownership
Accounting for Investments Investments are recognised at the trade date at mid or last traded prices. Realised gains or losses on investment disposals are calculated using the average cost method. Realised gains or losses on investment transactions in debt instruments are calculated using the amortised cost method based on the effective interest rate.
Valuation of Investments The year end valuation date was 30 September 2016, the last business day of the year. Securities listed on a recognised stock exchange or traded on any other organised market, are valued at the current mid price at each valuation point on the stock exchange or market which constitutes the principal market for such securities. If trades are received after the dealing cut-off time they will be accounted for in the next valuation. If for specific assets the current mid prices do not, in the opinion of the Manager, reflect their fair value or are not available, the price of the most recent transaction provides evidence of the current fair value as long as there has not been a significant change in economic circumstances since the time of the transaction or the Manager may also apply a fair value adjustment where they deem appropriate in order to reflect fair value.
In the case of any security not listed, quoted or dealt on a regulated market or for which no quotation or value is available which would provide a fair valuation, or in respect of which the price is unrepresentative, the fair value of such security is determined on the basis of the probable realisation value and is determined by the Investment Adviser, Sub-Investment Adviser, a stockbroker or other competent person appointed by the Investment Adviser and approved for the purpose by the Trustee, using valuation techniques.
Futures A futures contract obligates one party to sell and the other party to purchase a specific instrument for an agreed price at an agreed future date. Futures may be used subject to the conditions and limits laid down by the Central Bank and the Trust Deed and subject to any other restrictions or regulations which may affect the portfolio management of the Funds or the Investment Adviser/Sub-Investment Adviser. Certain Funds may buy or sell futures to provide an efficient, liquid and effective method for the management of risks by “locking in” gains and/or protecting against future declines in value. The fair value of open future contracts is calculated as the difference between the contracted rate and the current rate that would close out the contract on the Statement of Financial Position date. Gains or losses on futures are included in the Unrealised Gain/(Loss) on Open Future Contracts on the Statement of Financial Position and are shown in the Portfolio of Investments. When the contract is terminated, the Fund will recognised a realised gain or loss in the Statement of Comprehensive Income equal to the difference between the value of the contract at the time it was entered into and the time it was closed.
Forward Foreign Currency Exchange Contracts In a Forward Foreign Currency Exchange Contract, the Fund agrees to receive or deliver a fixed quantity of one currency for another, at a pre-determined price at a future date. The fair value of Forward Foreign Currency Exchange Contracts is calculated as the difference between the contracted rate and the current forward rate that would close out the contract on the Statement of Financial Position date. Gains or losses on Forward Foreign Currency Exchange Contracts are included in the Unrealised Gain/(Loss) on Forward Foreign Currency Exchange Contracts on the Statement of Financial Position and are shown in the Portfolio of Investments. Any realised gains or losses are recognised in the Statement of Comprehensive Income at trade date. The Funds may enter into these contracts to hedge against changes in currency exchange rates. The Forward Foreign Currency Exchange Contracts are used to hedge the currency exposure on individual positions taken by the Funds and to hedge non base currency investors.
Spot Currency Contracts In a Spot Currency Contract the Fund agrees to receive or deliver a fixed quantity of one currency for another, at a pre-determined price at a future date (the spot date) this date is typically within three business days of inception of the contract. The fair value of Open Spot Currency Contracts is calculated as the difference between the contracted rate and the current forward rate that would close out the contract on the Statement of Financial Position date. Gains or losses on Spot Currency Contracts are included in the Unrealised Gain/(Loss) on Open Spot Currency Contracts on the Statement of Financial Position and are shown in the Portfolio of Investments. Any realised gains or losses are recognised in the Statement of Comprehensive Income at trade date. The Funds may enter into these contracts to hedge against changes in currency exchange rates.
PRINCIPAL GLOBAL INVESTORS FUNDS
NOTES TO THE ANNUAL REPORT AND FINANCIAL STATEMENTS
for the year ended 30 September 2016 (continued)
126
2. PRINCIPAL ACCOUNTING POLICIES (continued)
Forward Rate Agreements A Forward Rate Agreement (“FRA”) is a forward contract on a short-term interest rate, usually Libor, in which cash flow obligations at maturity are calculated on a notional amount and based on the difference between a predetermined forward rate and the market rate prevailing on that date. The settlement rate of an FRA is the date on which cash flow obligations are determined. Gains or losses on FRA’s are included in the Unrealised Gain/(Loss) on Forward Rate Agreements on the Statement of Financial Position and are shown in the Portfolio of Investments. Any realised gains or losses are recognised in the Statement of Comprehensive Income at trade date. The Funds may enter into these contracts to hedge against changes in currency exchange rates.
Credit Default Swaps A Credit Default Swap is a credit derivative transaction in which two parties enter into an agreement, whereby one party pays the other a fixed periodic coupon for the specified life of the agreement. The other party makes no payments unless a credit event, relating to a predetermined reference asset occurs. If such an event occurs, the party will then make a payment to the first party and the swap will terminate. When the swap terminates any gains or losses arising are reflected in the Statement of Comprehensive Income as part of the Net Gain/(Loss) on investment activities. A Credit Default Swap provides the Fund with an alternative to investing in assets themselves for a potentially higher return with the same risk or they may be used to obtain exposure to assets which the Fund could not otherwise acquire due to illiquidity in the relevant market. The Fund recognises the swap when it becomes party to the contract. The Credit Default Swaps are marked to market daily based upon quotations from market makers and recorded in the Statement of Financial Position as Unrealised Gain on Swap Contracts. At 30 September 2016, there was Cash Collateral pledged by the Funds. This collateral is pledged with the counterparty to the contract.
Interest Rate Swaps An Interest Rate Swap is a bilateral agreement in which each of the parties agrees to exchange a series of interest payments for another series of payments (usually fixed/floating) based on a notional amount that serves as a computation basis and that is usually not exchanged. The Interest Rate Swaps are marked to market daily based upon quotations from market makers and recorded in the Statement of Financial Position as Unrealised Gain on Swap Contracts. When the swap terminates any gains or losses arising are reflected in the Statement of Comprehensive Income as part of the Net Gain/(Loss) on investment activities. At 30 September 2016, there was Cash Collateral pledged by the Funds. This collateral is pledged with the counterparty to the contract.
Cross Currency Swaps A Cross Currency Swap is an interest rate swap in which the cash flows are in different currencies. Upon initiation of a Cross Currency Swap, the counterparties make an initial exchange of notional principles in the two currencies. During the life of the swap, each party pays interest (in the currency of the principle received) to the other at fixed dates and at the maturity of the swap, the parties make the final exchange of the initial principle amounts, reversing the initial exchange at the same spot rate. The Cross Currency Swaps are marked to market daily based upon quotations from market makers and recorded in the Statement of Financial Position as Unrealised Gain on Swap Contracts. When the swap terminates any gains or losses arising are reflected in the Statement of Comprehensive Income as part of the Net Gain/(Loss) on investment activities. At 30 September 2016, there was Cash Collateral pledged by the Funds. This collateral is pledged with the counterparty to the contract.
Total Return Swaps A Total Return Swap is a financial contract whereby one party agrees to pay another party the total return of a defined asset in return for receiving a floating rate return. The Trust enters into unfunded swap agreements on behalf of the Fund. Total Return Swaps are marked to market using valuation sources/methods and the fair value is recorded in the Statement of Financial Position as Unrealised Gain on Swap Contracts. The change in unrealised gains and losses is shown in Net gain/(loss) on investment activities in the Statement of Comprehensive Income.
Total Return Swap positions are valued using models which utilise observable data to the extent practicable and contain assumptions on the application of this data. Changes in data inputs and assumptions about these factors could affect the reported fair value of the Total Return Swaps.
Option Contracts Options are Financial Derivative Instruments (“FDIs”) that give the buyer, in exchange for a premium payment, the right, but not the obligation, to either purchase (call option) or to sell to (put option) the writer a specified underlying instrument at a specified price on or before a specified date. The Funds enter into exchange-traded contracts to meet the requirements of its risk management and trading activities. All open option positions are detailed in the Unrealised Gain/(Loss) on Option Contracts in the Statement of Financial Position.
PRINCIPAL GLOBAL INVESTORS FUNDS
NOTES TO THE ANNUAL REPORT AND FINANCIAL STATEMENTS
for the year ended 30 September 2016 (continued)
127
2. PRINCIPAL ACCOUNTING POLICIES (continued)
Option Contracts (continued) When options are closed, the difference between the premium and the amount paid or received, net of brokerage commissions, or the full amount of the premium if the option expires worthless, is treated as a realised gain or loss and is included in Net Gain/Loss on investment activities in the Statement of Comprehensive Income. The Funds may enter into these contracts to hedge against changes in currency exchange rates.
Foreign Currency Transactions In accordance with Section 30 “Foreign Currency Translation” of FRS 102, items included in the individual Fund’s financial statements are measured using the currency of the primary economic environment in which it operates (functional currency). The Fund’s selection of the functional currency is attributable to the functional currency being: a) the major component of the Fund’s benchmark and b) the common proxy for most clients in the Fund’s varied client base. The functional currency assessment was completed at a Fund level. The Funds’ presentation currencies equated to their respective functional currencies when assessed under FRS 102. The functional currency of each Fund of the Trust is USD.
For each Fund: (i) Currency gains or losses can arise where there is a difference between the amounts of foreign dividends and
interest is recorded on the Fund’s books and the Fund’s functional currency equivalent of the amounts actually received or paid. These gains or losses are included where appropriate in the dividend and interest income figure in the individual Fund’s Statement of Comprehensive Income on pages 112 to 114;
(ii) Currency gains or losses realised on securities purchases and sales transactions are included in Net Gain/(Loss) on investment activities in the individual Fund’s Statement of Comprehensive Income on pages 112 to 114;
(iii) Unrealised currency gains or losses on securities held at year end are included in Net Gain/(Loss) on investment activities in the individual Fund’s Statement of Comprehensive Income on pages 112 to 114; and
(iv) Monetary assets and liabilities denominated in currencies other than the Fund’s functional currency are translated at the rate of exchange ruling at the close of business on the Statement of Financial Position date and exchange differences are included in Net Gain/(Loss) on investment activities in the individual Fund’s Statement of Comprehensive Income on pages 112 to 114.
Income from Investments Dividends are credited to the Statement of Comprehensive Income on the dates on which the relevant securities are listed as “ex-dividend”. Interest income is accounted for daily on an effective yield basis. Income is shown gross of any non-recoverable withholding taxes, which are disclosed separately in the Statement of Comprehensive Income, and net of any tax credits. Realised gains or losses on investment transactions in debt instruments are calculated using the amortised cost method based on the effective interest rate.
Net Gain/(Loss) on Investment Activities In respect of each instrument type classified as Financial Instruments at Fair Value through Profit or Loss, the movement in unrealised gains/(losses) since the prior period end and realised gains/(losses) are included in Net Gain/(Loss) on investment activities in the Statement of Comprehensive Income. Interest earned on fixed income securities such as bonds are included here also.
Expenses Operating expenses inclusive of Performance Fees, are recognised on an accruals basis in the Statement of Comprehensive Income.
Formation Costs As at 30 September 2016 on the EDGE Small/Mid-Cap Equity Income Fund and Global Short Duration High Yield Fund, formation costs of USD Nil (30 September 2015: USD 39,256) and USD Nil (30 September 2015: USD 18,738) were expensed as incurred in line with Irish GAAP requirements. However, formation costs per the dealing valuation are being written off over a five year period.
Anti Dilution Levy The Manager may exercise its discretion to apply an anti dilution levy in relation to subscriptions and redemptions of units. The levy is an allowance for fiscal and other charges that may be deducted from the Net Asset Value per Unit of the relevant class to reflect the costs of acquiring or disposing of underlying assets to fund subscriptions or redemptions from the Fund, respectively. The levy is intended to be used to ensure that all investors in the Trust are treated equitably by allocating transaction costs to the investors whose transactions give rise to those costs.
PRINCIPAL GLOBAL INVESTORS FUNDS
NOTES TO THE ANNUAL REPORT AND FINANCIAL STATEMENTS
for the year ended 30 September 2016 (continued)
128
2. PRINCIPAL ACCOUNTING POLICIES (continued)
Cash at Bank Cash is valued at amortised cost, which approximates fair value. Cash is held with the Bank of New York Mellon Trust Company (Ireland) Limited.
Cash Collateral & Pledged Collateral Cash Collateral provided by the Fund is identified in the Statement of Financial Position as Cash Collateral and is not included as a component of Cash at Bank. For collateral other than cash, if the party to whom the collateral is provided has the right by contract or custom to sell or re-pledge the collateral, the Fund classifies that asset in its Statement of Financial Position separately from Other Assets and identifies the asset as pledged collateral. Where the party to whom the collateral is provided does not have the right to sell or re-pledge; a disclosure of the collateral provided is made in the notes to the financial statements.
Margin Cash Receivable/Payable Cash Collateral Receivable/Payable to the Trust in relation to the open Futures Contracts and open Swap Contracts is identified in the Statement of Financial Position as Margin Cash Receivable/Payable and is not included as a component of Cash at Bank. Margin Cash Receivable/Payable at 30 September 2016 is held with the brokers Citigroup, JP Morgan Chase & Co and Morgan Stanley.
Distributions The Preferred Securities Fund will declare and pay quarterly distributions to Unitholders holding the A, I, D, F, N and P Income Unit Classes.
The High Yield Fund will declare and pay quarterly distributions to Unitholders holding the A Income Unit Class.
The Post Global Limited Term High Yield Fund will declare and pay quarterly distributions to Unitholders holding the I Income Unit Class and A Income Unit Class.
The A Income Unit Classes from the Global Equity Fund, Asian Equity Fund, European Equity Fund and Finisterre Emerging Market Debt Fund will declare and pay annual distributions to Unitholders.
The I and I2 Income Unit Classes from the Global Property Securities Fund and the I2 Income Unit Class from the Finisterre Emerging Market Debt Fund will also declare and pay annual distributions to Unitholders.
The Real Estate Debt Fund will declare and pay quarterly distribution to Unitholders holding the I Income Unit Class.
The D2 Income Unit Classes from the Preferred Securities Fund, High Yield Fund, Global Property Securities Fund and Real Estate Debt Fund will declare and pay monthly distributions to Unitholders.
Distributions are recorded by each Fund on ex-dividend date in the Statement of Comprehensive Income once approved by the board.
Offsetting Financial assets and liabilities are offset and the net amount reported in the Statement of Financial Position when there is a legally enforceable right to set-off the recognised amounts and there is an intention to settle on a net basis, or minimise the assets and settle the liability simultaneously.
Participating Units All participating units issued by the Funds provide the investors the right to acquire redemptions for cash at the value proportionate to the investor’s share in the Fund’s net assets at the redemption date. Such instruments give rise to a financial liability for the present value of the redemption amount. In accordance with the issued prospectus the Funds are contractually obliged to redeem units at the traded Net Asset Value per unit which is calculated at each valuation point.
PRINCIPAL GLOBAL INVESTORS FUNDS
NOTES TO THE ANNUAL REPORT AND FINANCIAL STATEMENTS
for the year ended 30 September 2016 (continued)
129
3. TAXATION
Under current law and practice the Trust qualifies as an investment undertaking as defined in Section 739B of the Taxes Consolidation Act, 1997, as amended. On that basis, it is not chargeable to Irish tax on its income or gains.
However, Irish tax may arise on the happening of a “chargeable event”. A chargeable event includes any distribution payments to Unitholders, any encashment, redemption, cancellation or transfer of units and the holding of units at the end of each eight year period beginning with the acquisition of such units. No Irish tax will arise on the Trust in respect of chargeable events in respect of:
(i) a Unitholder who is neither Irish resident nor ordinarily resident in Ireland for tax purposes, at the time of the chargeable event, provided appropriate valid declarations in accordance with the provisions of the Taxes Consolidation Act, 1997, as amended, are held by the Trust or the Trust has been authorised by the Irish Revenue to make gross payments in the absence of appropriate declarations; and
(ii) certain exempted Irish tax resident Unitholders who have provided the Trust with the necessary signed statutory declarations.
Dividends, interest and capital gains (if any) received on investments made by the Trust may be subject to taxes imposed by the country from which the investment income/gains are received and such taxes may not be recoverable by the Trust or its Unitholders. Redeeming Units When a redemption request has been submitted by a Unitholder who is or is deemed to be an Irish resident, or is acting on behalf of an Irish resident, the Manager shall deduct from the redemption proceeds an amount which is equal to the tax payable by the Unit Trust to the Revenue Commissioners in Ireland in respect of the relevant transaction.
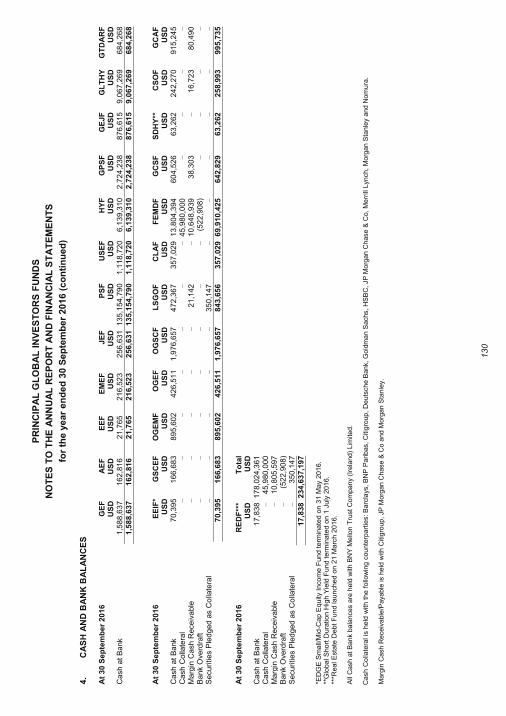
PR
INC
IPA
L G
LO
BA
L IN
VE
ST
OR
S F
UN
DS
NO
TE
S T
O T
HE
AN
NU
AL
RE
PO
RT
AN
D F
INA
NC
IAL
ST
AT
EM
EN
TS
for
the y
ear
en
ded
30 S
ep
tem
ber
201
6 (
co
nti
nu
ed
)
130
4.
CA
SH
AN
D B
AN
K B
AL
AN
CE
S
At
30
Se
pte
mb
er
20
16
G
EF
U
SD
A
EF
U
SD
E
EF
U
SD
E
ME
F
US
D
JE
F
US
D
PS
F
US
D
US
EF
U
SD
H
YF
U
SD
G
PS
F
US
D
GE
JF
U
SD
G
LT
HY
U
SD
G
TD
AR
F
US
D
Cash
at
Ba
nk
1,5
88
,63
7
16
2,8
16
21
,765
21
6,5
23
25
6,6
31
13
5,1
54
,79
0
1,1
18
,72
0
6,1
39
,31
0
2,7
24
,23
8
87
6,6
15
9,0
67
,26
9
68
4,2
68
1
,58
8,6
37
16
2,8
16
21
,765
21
6,5
23
25
6,6
31
13
5,1
54
,79
0
1,1
18
,72
0
6,1
39
,31
0
2,7
24
,23
8
87
6,6
15
9,0
67
,26
9
68
4,2
68
At
30
Se
pte
mb
er
20
16
E
EIF
* U
SD
G
SC
EF
U
SD
O
GE
MF
U
SD
O
GE
F
US
D
OG
SC
F
US
D
LS
GO
F
US
D
CL
AF
U
SD
F
EM
DF
U
SD
G
CS
F
US
D
SD
HY
**
US
D
CS
OF
U
SD
G
CA
F
US
D
Cash
at
Ba
nk
70
,395
16
6,6
83
89
5,6
02
42
6,5
11
1,9
76
,65
7
47
2,3
67
35
7,0
29
13
,804
,394
60
4,5
26
63
,262
24
2,2
70
91
5,2
45
Cash
Colla
tera
l –
–
–
–
–
–
–
45
,980
,000
–
–
–
–
Ma
rgin
Ca
sh
Rece
iva
ble
–
–
–
–
–
21
,142
–
10
,648
,939
38
,303
–
16
,723
80
,490
Ba
nk O
verd
raft
–
–
–
–
–
–
–
(52
2,9
08
) –
–
–
–
Se
cu
rities P
led
ged
as C
olla
tera
l –
–
–
–
–
35
0,1
47
–
–
–
–
–
–
7
0,3
95
16
6,6
83
89
5,6
02
42
6,5
11
1,9
76
,65
7
84
3,6
56
35
7,0
29
69
,910
,425
64
2,8
29
63
,262
25
8,9
93
99
5,7
35
At
30
Se
pte
mb
er
20
16
R
ED
F**
* U
SD
T
ota
l U
SD
C
ash
at
Ba
nk
17
,838
17
8,0
24
,36
1
Cash
Colla
tera
l –
45
,980
,000
Ma
rgin
Ca
sh
Rece
iva
ble
–
10
,805
,597
Ba
nk O
verd
raft
–
(52
2,9
08
) S
ecu
rities P
led
ged
as C
olla
tera
l –
35
0,1
47
1
7,8
38
23
4,6
37
,19
7
*ED
GE
Sm
all/
Mid
-Cap E
quity
Inco
me F
und term
inate
d o
n 3
1 M
ay 2
016.
**G
lobal S
hort
Dura
tion H
igh Y
ield
Fund term
inate
d o
n 1
July
2016.
***R
eal E
sta
te D
ebt F
und launched o
n 2
1 M
arc
h 2
016.
All
Cash a
t B
ank
bala
nces a
re h
eld
with B
NY
Mello
n T
rust
Com
pany
(Ire
land)
Lim
ited.
Cash C
olla
tera
l is
held
with t
he f
ollo
win
g c
ounte
rpart
ies:
Barc
lays
, B
NP
Paribas,
Citig
roup,
Deuts
che B
ank,
Gold
man S
achs,
HS
BC
, JP
Morg
an C
hase &
Co, M
err
ill L
ynch,
Morg
an S
tanle
y and N
om
ura
. M
arg
in C
ash R
eceiv
able
/Paya
ble
is h
eld
with C
itig
roup
, JP
Morg
an C
hase &
Co a
nd M
org
an S
tanle
y.
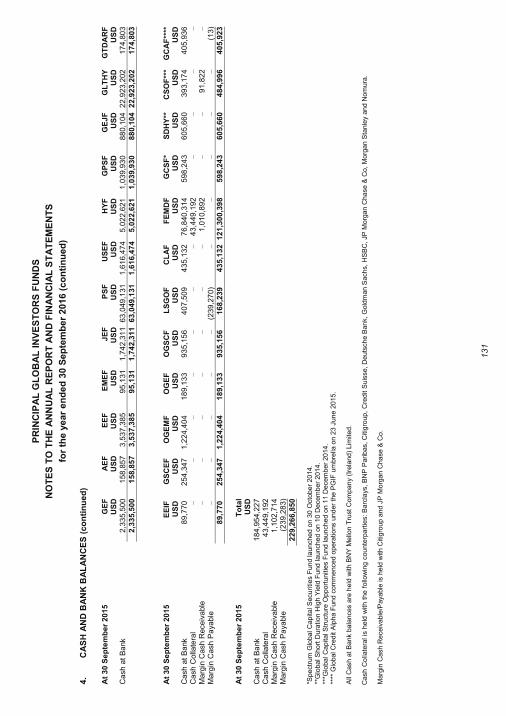
PR
INC
IPA
L G
LO
BA
L IN
VE
ST
OR
S F
UN
DS
NO
TE
S T
O T
HE
AN
NU
AL
RE
PO
RT
AN
D F
INA
NC
IAL
ST
AT
EM
EN
TS
for
the y
ear
en
ded
30 S
ep
tem
ber
201
6 (
co
nti
nu
ed
)
131
4.
CA
SH
AN
D B
AN
K B
AL
AN
CE
S (
co
nti
nu
ed
)
At
30
Se
pte
mb
er
20
15
G
EF
U
SD
A
EF
U
SD
E
EF
U
SD
E
ME
F
US
D
JE
F
US
D
PS
F
US
D
US
EF
U
SD
H
YF
U
SD
G
PS
F
US
D
GE
JF
U
SD
G
LT
HY
U
SD
G
TD
AR
F
US
D
Cash
at
Ba
nk
2,3
35
,50
0
15
8,8
57
3,5
37
,38
5
95
,131
1,7
42
,31
1
63
,049
,131
1,6
16
,47
4
5,0
22
,62
1
1,0
39
,93
0
88
0,1
04
22
,923
,202
17
4,8
03
2
,33
5,5
00
15
8,8
57
3,5
37
,38
5
95
,131
1,7
42
,31
1
63
,049
,131
1,6
16
,47
4
5,0
22
,62
1
1,0
39
,93
0
88
0,1
04
22
,923
,202
17
4,8
03
At
30
Se
pte
mb
er
20
15
E
EIF
U
SD
G
SC
EF
U
SD
O
GE
MF
U
SD
O
GE
F
US
D
OG
SC
F
US
D
LS
GO
F
US
D
CL
AF
U
SD
F
EM
DF
U
SD
G
CS
F*
US
D
SD
HY
**
US
D
CS
OF
***
US
D
GC
AF
****
U
SD
C
ash
at
Ba
nk
89
,770
25
4,3
47
1,2
24
,40
4
18
9,1
33
93
5,1
56
40
7,5
09
43
5,1
32
76
,840
,314
59
8,2
43
60
5,6
60
39
3,1
74
40
5,9
36
Cash
Colla
tera
l –
–
–
–
–
–
–
43
,449
,192
–
–
–
–
Ma
rgin
Ca
sh
Rece
iva
ble
–
–
–
–
–
–
–
1,0
10
,89
2
–
–
91
,822
–
Ma
rgin
Ca
sh
Pa
yable
–
–
–
–
–
(23
9,2
70
) –
–
–
–
–
(13
)
89
,770
25
4,3
47
1,2
24
,40
4
18
9,1
33
93
5,1
56
16
8,2
39
43
5,1
32
12
1,3
00
,39
8
59
8,2
43
60
5,6
60
48
4,9
96
40
5,9
23
At
30
Se
pte
mb
er
20
15
T
ota
l U
SD
C
ash
at
Ba
nk
18
4,9
54
,22
7
Cash
Colla
tera
l 4
3,4
49
,192
Ma
rgin
Ca
sh
Rece
iva
ble
1
,10
2,7
14
Ma
rgin
Ca
sh
Pa
yable
(2
39
,28
3)
2
29
,26
6,8
50
*Spect
rum
Glo
bal C
apital S
ecuritie
s F
und launched o
n 3
0 O
cto
ber
2014.
**G
lobal S
hort
Dura
tion H
igh Y
ield
Fund launched o
n 1
0 D
ecem
ber
2014.
***G
lobal C
apital S
truct
ure
Opport
unitie
s F
und launched o
n 1
1 D
ecem
ber
2014.
****
Glo
bal C
redit
Alp
ha F
und c
om
menced o
pera
tions u
nder
the P
GIF
um
bre
lla o
n 2
3 J
une 2
015.
All
Cash a
t B
ank b
ala
nces a
re h
eld
with B
NY
Mello
n T
rust
Com
pany
(Ire
land)
Lim
ited.
Cash C
olla
tera
l is
held
with t
he f
ollo
win
g c
ounte
rpart
ies:
Barc
lays
, B
NP
Paribas, C
itig
roup,
Cre
dit S
uis
se, D
euts
che B
ank,
Gold
man S
ach
s, H
SB
C, JP
Morg
an C
hase &
Co,
Morg
an S
tanle
y and N
om
ura
. M
arg
in C
ash R
eceiv
able
/Paya
ble
is h
eld
with C
itig
roup a
nd J
P M
org
an C
hase &
Co.
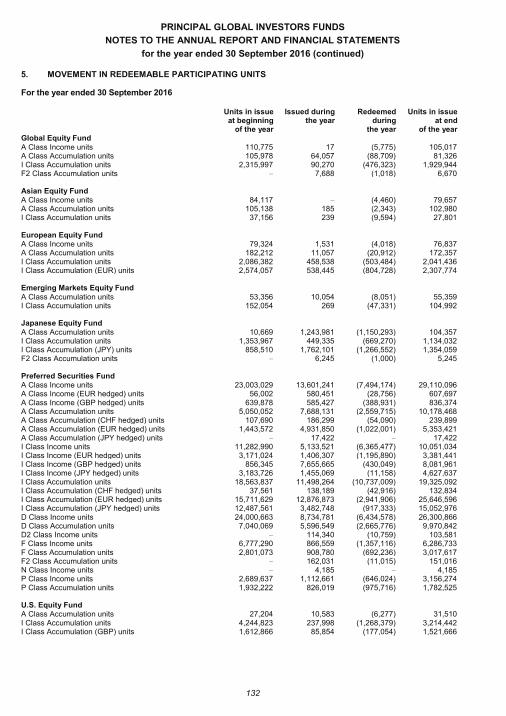
PRINCIPAL GLOBAL INVESTORS FUNDS
NOTES TO THE ANNUAL REPORT AND FINANCIAL STATEMENTS
for the year ended 30 September 2016 (continued)
132
5. MOVEMENT IN REDEEMABLE PARTICIPATING UNITS
For the year ended 30 September 2016
Units in issue at beginning
of the year
Issued during the year
Redeemed during
the year
Units in issue at end
of the year Global Equity Fund A Class Income units 110,775 17 (5,775) 105,017 A Class Accumulation units 105,978 64,057 (88,709) 81,326 I Class Accumulation units 2,315,997 90,270 (476,323) 1,929,944 F2 Class Accumulation units – 7,688 (1,018) 6,670 Asian Equity Fund A Class Income units 84,117 – (4,460) 79,657 A Class Accumulation units 105,138 185 (2,343) 102,980 I Class Accumulation units 37,156 239 (9,594) 27,801 European Equity Fund A Class Income units 79,324 1,531 (4,018) 76,837 A Class Accumulation units 182,212 11,057 (20,912) 172,357 I Class Accumulation units 2,086,382 458,538 (503,484) 2,041,436 I Class Accumulation (EUR) units 2,574,057 538,445 (804,728) 2,307,774 Emerging Markets Equity Fund A Class Accumulation units 53,356 10,054 (8,051) 55,359 I Class Accumulation units 152,054 269 (47,331) 104,992 Japanese Equity Fund A Class Accumulation units 10,669 1,243,981 (1,150,293) 104,357 I Class Accumulation units 1,353,967 449,335 (669,270) 1,134,032 I Class Accumulation (JPY) units 858,510 1,762,101 (1,266,552) 1,354,059 F2 Class Accumulation units – 6,245 (1,000) 5,245 Preferred Securities Fund A Class Income units 23,003,029 13,601,241 (7,494,174) 29,110,096 A Class Income (EUR hedged) units 56,002 580,451 (28,756) 607,697 A Class Income (GBP hedged) units 639,878 585,427 (388,931) 836,374 A Class Accumulation units 5,050,052 7,688,131 (2,559,715) 10,178,468 A Class Accumulation (CHF hedged) units 107,690 186,299 (54,090) 239,899 A Class Accumulation (EUR hedged) units 1,443,572 4,931,850 (1,022,001) 5,353,421 A Class Accumulation (JPY hedged) units – 17,422 – 17,422 I Class Income units 11,282,990 5,133,521 (6,365,477) 10,051,034 I Class Income (EUR hedged) units 3,171,024 1,406,307 (1,195,890) 3,381,441 I Class Income (GBP hedged) units 856,345 7,655,665 (430,049) 8,081,961 I Class Income (JPY hedged) units 3,183,726 1,455,069 (11,158) 4,627,637 I Class Accumulation units 18,563,837 11,498,264 (10,737,009) 19,325,092 I Class Accumulation (CHF hedged) units 37,561 138,189 (42,916) 132,834 I Class Accumulation (EUR hedged) units 15,711,629 12,876,873 (2,941,906) 25,646,596 I Class Accumulation (JPY hedged) units 12,487,561 3,482,748 (917,333) 15,052,976 D Class Income units 24,000,663 8,734,781 (6,434,578) 26,300,866 D Class Accumulation units 7,040,069 5,596,549 (2,665,776) 9,970,842 D2 Class Income units – 114,340 (10,759) 103,581 F Class Income units 6,777,290 866,559 (1,357,116) 6,286,733 F Class Accumulation units 2,801,073 908,780 (692,236) 3,017,617 F2 Class Accumulation units – 162,031 (11,015) 151,016 N Class Income units – 4,185 – 4,185 P Class Income units 2,689,637 1,112,661 (646,024) 3,156,274 P Class Accumulation units 1,932,222 826,019 (975,716) 1,782,525 U.S. Equity Fund A Class Accumulation units 27,204 10,583 (6,277) 31,510 I Class Accumulation units 4,244,823 237,998 (1,268,379) 3,214,442 I Class Accumulation (GBP) units 1,612,866 85,854 (177,054) 1,521,666
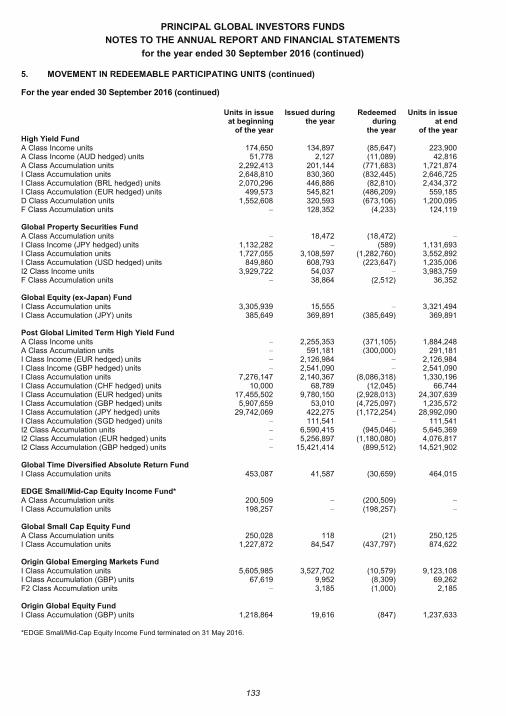
PRINCIPAL GLOBAL INVESTORS FUNDS
NOTES TO THE ANNUAL REPORT AND FINANCIAL STATEMENTS
for the year ended 30 September 2016 (continued)
133
5. MOVEMENT IN REDEEMABLE PARTICIPATING UNITS (continued)
For the year ended 30 September 2016 (continued)
Units in issue at beginning
of the year
Issued during the year
Redeemed during
the year
Units in issue at end
of the year High Yield Fund A Class Income units 174,650 134,897 (85,647) 223,900 A Class Income (AUD hedged) units 51,778 2,127 (11,089) 42,816 A Class Accumulation units 2,292,413 201,144 (771,683) 1,721,874 I Class Accumulation units 2,648,810 830,360 (832,445) 2,646,725 I Class Accumulation (BRL hedged) units 2,070,296 446,886 (82,810) 2,434,372 I Class Accumulation (EUR hedged) units 499,573 545,821 (486,209) 559,185 D Class Accumulation units 1,552,608 320,593 (673,106) 1,200,095 F Class Accumulation units – 128,352 (4,233) 124,119 Global Property Securities Fund A Class Accumulation units – 18,472 (18,472) – I Class Income (JPY hedged) units 1,132,282 – (589) 1,131,693 I Class Accumulation units 1,727,055 3,108,597 (1,282,760) 3,552,892 I Class Accumulation (USD hedged) units 849,860 608,793 (223,647) 1,235,006 I2 Class Income units 3,929,722 54,037 – 3,983,759 F Class Accumulation units – 38,864 (2,512) 36,352 Global Equity (ex-Japan) Fund I Class Accumulation units 3,305,939 15,555 – 3,321,494 I Class Accumulation (JPY) units 385,649 369,891 (385,649) 369,891 Post Global Limited Term High Yield Fund A Class Income units – 2,255,353 (371,105) 1,884,248 A Class Accumulation units – 591,181 (300,000) 291,181 I Class Income (EUR hedged) units – 2,126,984 – 2,126,984 I Class Income (GBP hedged) units – 2,541,090 – 2,541,090 I Class Accumulation units 7,276,147 2,140,367 (8,086,318) 1,330,196 I Class Accumulation (CHF hedged) units 10,000 68,789 (12,045) 66,744 I Class Accumulation (EUR hedged) units 17,455,502 9,780,150 (2,928,013) 24,307,639 I Class Accumulation (GBP hedged) units 5,907,659 53,010 (4,725,097) 1,235,572 I Class Accumulation (JPY hedged) units 29,742,069 422,275 (1,172,254) 28,992,090 I Class Accumulation (SGD hedged) units – 111,541 – 111,541 I2 Class Accumulation units – 6,590,415 (945,046) 5,645,369 I2 Class Accumulation (EUR hedged) units – 5,256,897 (1,180,080) 4,076,817 I2 Class Accumulation (GBP hedged) units – 15,421,414 (899,512) 14,521,902 Global Time Diversified Absolute Return Fund I Class Accumulation units 453,087 41,587 (30,659) 464,015 EDGE Small/Mid-Cap Equity Income Fund* A Class Accumulation units 200,509 – (200,509) – I Class Accumulation units 198,257 – (198,257) – Global Small Cap Equity Fund A Class Accumulation units 250,028 118 (21) 250,125 I Class Accumulation units 1,227,872 84,547 (437,797) 874,622 Origin Global Emerging Markets Fund I Class Accumulation units 5,605,985 3,527,702 (10,579) 9,123,108 I Class Accumulation (GBP) units 67,619 9,952 (8,309) 69,262 F2 Class Accumulation units – 3,185 (1,000) 2,185 Origin Global Equity Fund I Class Accumulation (GBP) units 1,218,864 19,616 (847) 1,237,633
*EDGE Small/Mid-Cap Equity Income Fund terminated on 31 May 2016.
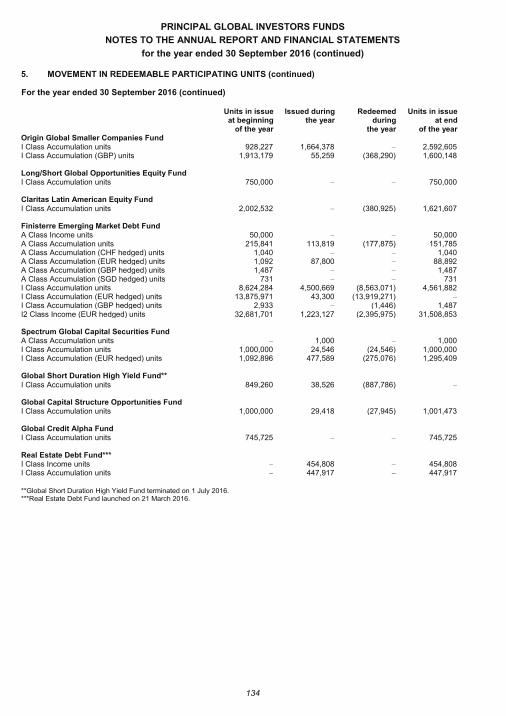
PRINCIPAL GLOBAL INVESTORS FUNDS
NOTES TO THE ANNUAL REPORT AND FINANCIAL STATEMENTS
for the year ended 30 September 2016 (continued)
134
5. MOVEMENT IN REDEEMABLE PARTICIPATING UNITS (continued)
For the year ended 30 September 2016 (continued)
Units in issue at beginning
of the year
Issued during the year
Redeemed during
the year
Units in issue at end
of the year Origin Global Smaller Companies Fund I Class Accumulation units 928,227 1,664,378 – 2,592,605 I Class Accumulation (GBP) units 1,913,179 55,259 (368,290) 1,600,148 Long/Short Global Opportunities Equity Fund I Class Accumulation units 750,000 – – 750,000 Claritas Latin American Equity Fund I Class Accumulation units 2,002,532 – (380,925) 1,621,607 Finisterre Emerging Market Debt Fund A Class Income units 50,000 – – 50,000 A Class Accumulation units 215,841 113,819 (177,875) 151,785 A Class Accumulation (CHF hedged) units 1,040 – – 1,040 A Class Accumulation (EUR hedged) units 1,092 87,800 – 88,892 A Class Accumulation (GBP hedged) units 1,487 – – 1,487 A Class Accumulation (SGD hedged) units 731 – – 731 I Class Accumulation units 8,624,284 4,500,669 (8,563,071) 4,561,882 I Class Accumulation (EUR hedged) units 13,875,971 43,300 (13,919,271) – I Class Accumulation (GBP hedged) units 2,933 – (1,446) 1,487 I2 Class Income (EUR hedged) units 32,681,701 1,223,127 (2,395,975) 31,508,853 Spectrum Global Capital Securities Fund A Class Accumulation units – 1,000 – 1,000 I Class Accumulation units 1,000,000 24,546 (24,546) 1,000,000 I Class Accumulation (EUR hedged) units 1,092,896 477,589 (275,076) 1,295,409 Global Short Duration High Yield Fund** I Class Accumulation units 849,260 38,526 (887,786) – Global Capital Structure Opportunities Fund I Class Accumulation units 1,000,000 29,418 (27,945) 1,001,473 Global Credit Alpha Fund I Class Accumulation units 745,725 – – 745,725 Real Estate Debt Fund*** I Class Income units – 454,808 – 454,808 I Class Accumulation units – 447,917 – 447,917
**Global Short Duration High Yield Fund terminated on 1 July 2016. ***Real Estate Debt Fund launched on 21 March 2016.
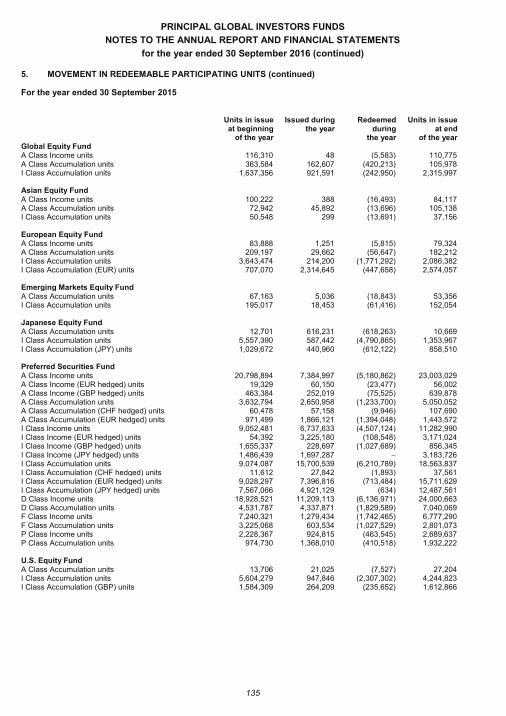
PRINCIPAL GLOBAL INVESTORS FUNDS
NOTES TO THE ANNUAL REPORT AND FINANCIAL STATEMENTS
for the year ended 30 September 2016 (continued)
135
5. MOVEMENT IN REDEEMABLE PARTICIPATING UNITS (continued)
For the year ended 30 September 2015
Units in issue at beginning
of the year
Issued during the year
Redeemed during
the year
Units in issue at end
of the year Global Equity Fund A Class Income units 116,310 48 (5,583) 110,775 A Class Accumulation units 363,584 162,607 (420,213) 105,978 I Class Accumulation units 1,637,356 921,591 (242,950) 2,315,997 Asian Equity Fund A Class Income units 100,222 388 (16,493) 84,117 A Class Accumulation units 72,942 45,892 (13,696) 105,138 I Class Accumulation units 50,548 299 (13,691) 37,156 European Equity Fund A Class Income units 83,888 1,251 (5,815) 79,324 A Class Accumulation units 209,197 29,662 (56,647) 182,212 I Class Accumulation units 3,643,474 214,200 (1,771,292) 2,086,382 I Class Accumulation (EUR) units 707,070 2,314,645 (447,658) 2,574,057 Emerging Markets Equity Fund A Class Accumulation units 67,163 5,036 (18,843) 53,356 I Class Accumulation units 195,017 18,453 (61,416) 152,054 Japanese Equity Fund A Class Accumulation units 12,701 616,231 (618,263) 10,669 I Class Accumulation units 5,557,390 587,442 (4,790,865) 1,353,967 I Class Accumulation (JPY) units 1,029,672 440,960 (612,122) 858,510 Preferred Securities Fund A Class Income units 20,798,894 7,384,997 (5,180,862) 23,003,029 A Class Income (EUR hedged) units 19,329 60,150 (23,477) 56,002 A Class Income (GBP hedged) units 463,384 252,019 (75,525) 639,878 A Class Accumulation units 3,632,794 2,650,958 (1,233,700) 5,050,052 A Class Accumulation (CHF hedged) units 60,478 57,158 (9,946) 107,690 A Class Accumulation (EUR hedged) units 971,499 1,866,121 (1,394,048) 1,443,572 I Class Income units 9,052,481 6,737,633 (4,507,124) 11,282,990 I Class Income (EUR hedged) units 54,392 3,225,180 (108,548) 3,171,024 I Class Income (GBP hedged) units 1,655,337 228,697 (1,027,689) 856,345 I Class Income (JPY hedged) units 1,486,439 1,697,287 – 3,183,726 I Class Accumulation units 9,074,087 15,700,539 (6,210,789) 18,563,837 I Class Accumulation (CHF hedged) units 11,612 27,842 (1,893) 37,561 I Class Accumulation (EUR hedged) units 9,028,297 7,396,816 (713,484) 15,711,629 I Class Accumulation (JPY hedged) units 7,567,066 4,921,129 (634) 12,487,561 D Class Income units 18,928,521 11,209,113 (6,136,971) 24,000,663 D Class Accumulation units 4,531,787 4,337,871 (1,829,589) 7,040,069 F Class Income units 7,240,321 1,279,434 (1,742,465) 6,777,290 F Class Accumulation units 3,225,068 603,534 (1,027,529) 2,801,073 P Class Income units 2,228,367 924,815 (463,545) 2,689,637 P Class Accumulation units 974,730 1,368,010 (410,518) 1,932,222 U.S. Equity Fund A Class Accumulation units 13,706 21,025 (7,527) 27,204 I Class Accumulation units 5,604,279 947,846 (2,307,302) 4,244,823 I Class Accumulation (GBP) units 1,584,309 264,209 (235,652) 1,612,866
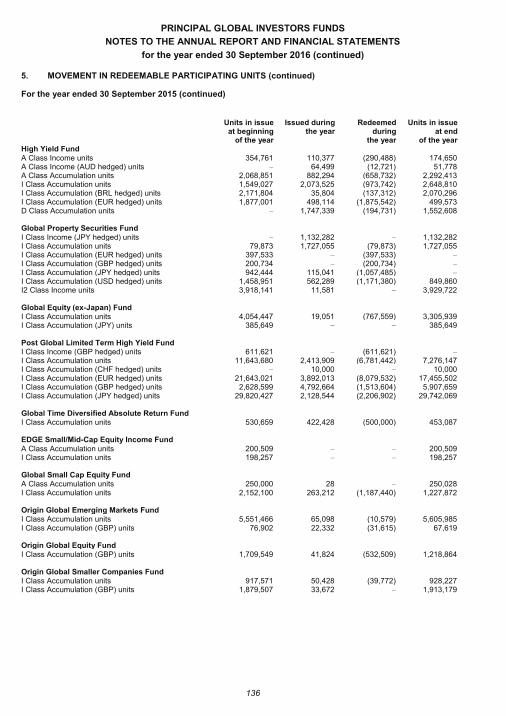
PRINCIPAL GLOBAL INVESTORS FUNDS
NOTES TO THE ANNUAL REPORT AND FINANCIAL STATEMENTS
for the year ended 30 September 2016 (continued)
136
5. MOVEMENT IN REDEEMABLE PARTICIPATING UNITS (continued)
For the year ended 30 September 2015 (continued)
Units in issue at beginning
of the year
Issued during the year
Redeemed during
the year
Units in issue at end
of the year High Yield Fund A Class Income units 354,761 110,377 (290,488) 174,650 A Class Income (AUD hedged) units – 64,499 (12,721) 51,778 A Class Accumulation units 2,068,851 882,294 (658,732) 2,292,413 I Class Accumulation units 1,549,027 2,073,525 (973,742) 2,648,810 I Class Accumulation (BRL hedged) units 2,171,804 35,804 (137,312) 2,070,296 I Class Accumulation (EUR hedged) units 1,877,001 498,114 (1,875,542) 499,573 D Class Accumulation units – 1,747,339 (194,731) 1,552,608 Global Property Securities Fund I Class Income (JPY hedged) units – 1,132,282 – 1,132,282 I Class Accumulation units 79,873 1,727,055 (79,873) 1,727,055 I Class Accumulation (EUR hedged) units 397,533 – (397,533) – I Class Accumulation (GBP hedged) units 200,734 – (200,734) – I Class Accumulation (JPY hedged) units 942,444 115,041 (1,057,485) – I Class Accumulation (USD hedged) units 1,458,951 562,289 (1,171,380) 849,860 I2 Class Income units 3,918,141 11,581 – 3,929,722 Global Equity (ex-Japan) Fund I Class Accumulation units 4,054,447 19,051 (767,559) 3,305,939 I Class Accumulation (JPY) units 385,649 – – 385,649 Post Global Limited Term High Yield Fund I Class Income (GBP hedged) units 611,621 – (611,621) – I Class Accumulation units 11,643,680 2,413,909 (6,781,442) 7,276,147 I Class Accumulation (CHF hedged) units – 10,000 – 10,000 I Class Accumulation (EUR hedged) units 21,643,021 3,892,013 (8,079,532) 17,455,502 I Class Accumulation (GBP hedged) units 2,628,599 4,792,664 (1,513,604) 5,907,659 I Class Accumulation (JPY hedged) units 29,820,427 2,128,544 (2,206,902) 29,742,069 Global Time Diversified Absolute Return Fund I Class Accumulation units 530,659 422,428 (500,000) 453,087 EDGE Small/Mid-Cap Equity Income Fund A Class Accumulation units 200,509 – – 200,509 I Class Accumulation units 198,257 – – 198,257 Global Small Cap Equity Fund A Class Accumulation units 250,000 28 – 250,028 I Class Accumulation units 2,152,100 263,212 (1,187,440) 1,227,872 Origin Global Emerging Markets Fund I Class Accumulation units 5,551,466 65,098 (10,579) 5,605,985 I Class Accumulation (GBP) units 76,902 22,332 (31,615) 67,619 Origin Global Equity Fund I Class Accumulation (GBP) units 1,709,549 41,824 (532,509) 1,218,864 Origin Global Smaller Companies Fund I Class Accumulation units 917,571 50,428 (39,772) 928,227 I Class Accumulation (GBP) units 1,879,507 33,672 – 1,913,179
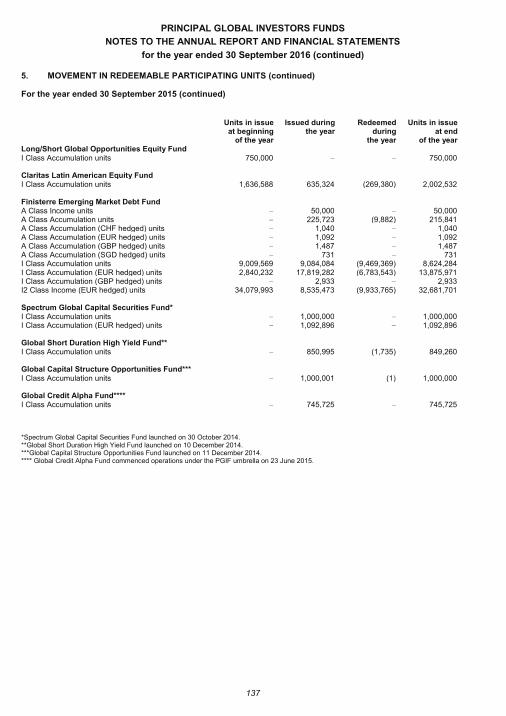
PRINCIPAL GLOBAL INVESTORS FUNDS
NOTES TO THE ANNUAL REPORT AND FINANCIAL STATEMENTS
for the year ended 30 September 2016 (continued)
137
5. MOVEMENT IN REDEEMABLE PARTICIPATING UNITS (continued)
For the year ended 30 September 2015 (continued)
Units in issue at beginning
of the year
Issued during the year
Redeemed during
the year
Units in issue at end
of the year Long/Short Global Opportunities Equity Fund I Class Accumulation units 750,000 – – 750,000 Claritas Latin American Equity Fund I Class Accumulation units 1,636,588 635,324 (269,380) 2,002,532 Finisterre Emerging Market Debt Fund A Class Income units – 50,000 – 50,000 A Class Accumulation units – 225,723 (9,882) 215,841 A Class Accumulation (CHF hedged) units – 1,040 – 1,040 A Class Accumulation (EUR hedged) units – 1,092 – 1,092 A Class Accumulation (GBP hedged) units – 1,487 – 1,487 A Class Accumulation (SGD hedged) units – 731 – 731 I Class Accumulation units 9,009,569 9,084,084 (9,469,369) 8,624,284 I Class Accumulation (EUR hedged) units 2,840,232 17,819,282 (6,783,543) 13,875,971 I Class Accumulation (GBP hedged) units – 2,933 – 2,933 I2 Class Income (EUR hedged) units 34,079,993 8,535,473 (9,933,765) 32,681,701 Spectrum Global Capital Securities Fund* I Class Accumulation units – 1,000,000 – 1,000,000 I Class Accumulation (EUR hedged) units – 1,092,896 – 1,092,896 Global Short Duration High Yield Fund** I Class Accumulation units – 850,995 (1,735) 849,260 Global Capital Structure Opportunities Fund*** I Class Accumulation units – 1,000,001 (1) 1,000,000 Global Credit Alpha Fund**** I Class Accumulation units – 745,725 – 745,725
*Spectrum Global Capital Securities Fund launched on 30 October 2014. **Global Short Duration High Yield Fund launched on 10 December 2014. ***Global Capital Structure Opportunities Fund launched on 11 December 2014. **** Global Credit Alpha Fund commenced operations under the PGIF umbrella on 23 June 2015.
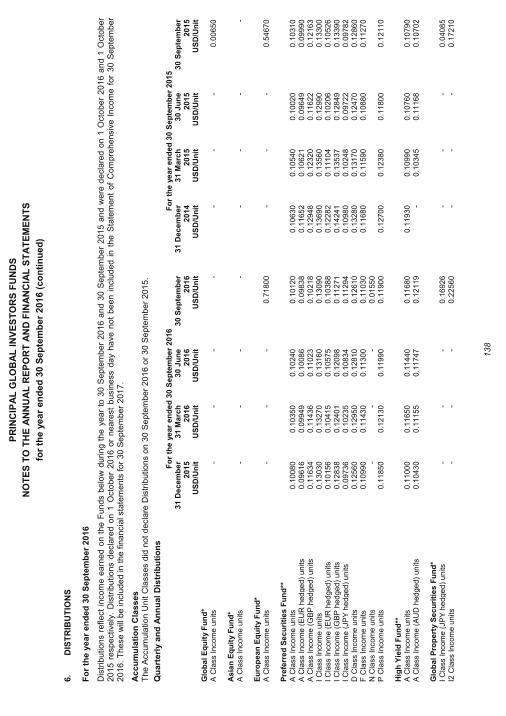
PR
INC
IPA
L G
LO
BA
L IN
VE
ST
OR
S F
UN
DS
NO
TE
S T
O T
HE
AN
NU
AL
RE
PO
RT
AN
D F
INA
NC
IAL
ST
AT
EM
EN
TS
for
the y
ear
en
ded
30 S
ep
tem
ber
201
6 (
co
nti
nu
ed
)
138
6.
DIS
TR
IBU
TIO
NS
Fo
r th
e y
ea
r e
nd
ed
30
Se
pte
mb
er
20
16
Dis
trib
utio
ns r
efle
ct
inco
me
earn
ed
on
th
e F
un
ds b
el o
w d
uri
ng
th
e y
ear
to 3
0 S
ep
tem
ber
201
6 a
nd
30
Se
pte
mb
er
201
5 a
nd
we
re d
ecla
red
on 1
Octo
ber
20
16
an
d 1
Octo
be
r 2015 r
esp
ective
ly.
Dis
trib
utio
ns d
ecla
red
on
1 O
cto
be
r 2016 o
r n
ea
rest
bu
sin
ess d
ay
ha
ve n
ot
be
en i
nclu
de
d i
n t
he
Sta
tem
ent
of
Co
mp
reh
ensiv
e I
nco
me
fo
r 30
Se
pte
mb
er
2016
. T
hese
will
be in
clu
de
d in
the
fin
an
cia
l sta
tem
ents
fo
r 3
0 S
ep
tem
ber
201
7.
Ac
cu
mu
lati
on
Cla
ss
es
T
he A
ccum
ula
tio
n U
nit C
lasse
s d
id n
ot
de
cla
re D
istr
ibu
tion
s o
n 3
0 S
ep
tem
ber
20
16
or
30
Se
pte
mb
er
201
5.
Qu
art
erl
y a
nd
An
nu
al
Dis
trib
uti
on
s
F
or
the
ye
ar
en
de
d 3
0 S
ep
tem
be
r 2
01
6
Fo
r th
e y
ea
r e
nd
ed
30
Se
pte
mb
er
201
5
31
De
cem
be
r
31
Ma
rch
30
Ju
ne
3
0 S
ep
tem
be
r
31
De
cem
be
r
31
Ma
rch
30
Ju
ne
3
0 S
ep
tem
be
r
20
15
US
D/U
nit
20
16
US
D/U
nit
20
16
US
D/U
nit
20
16
US
D/U
nit
20
14
US
D/U
nit
20
15
US
D/U
nit
20
15
US
D/U
nit
20
15
US
D/U
nit
G
lob
al
Eq
uit
y F
un
d*
A C
lass
Inco
me
un
its
-
-
-
-
-
-
-
0
.00
65
0
A
sia
n E
qu
ity F
un
d*
A C
lass
Inco
me
un
its
-
-
-
-
-
-
-
-
E
uro
pe
an
Eq
uit
y F
un
d*
A C
lass
Inco
me
un
its
-
-
-
0
.71
80
0
-
-
-
0
.54
67
0
P
refe
rre
d S
ec
uri
tie
s F
un
d**
A
Cla
ss I
nco
me
un
its
0
.10
08
0
0
.10
35
0
0
.10
24
0
0
.10
12
0
0
.10
63
0
0
.10
54
0
0
.10
02
0
0
.10
31
0
A C
lass
Inco
me
(E
UR
hed
ge
d)
un
its
0
.09
61
6
0
.09
94
9
0
.10
08
6
0
.09
83
8
0
.11
65
2
0
.10
62
1
0
.09
64
9
0
.09
99
0
A C
lass
Inco
me
(G
BP
hed
ge
d)
un
its
0
.11
63
4
0
.11
43
6
0
.11
02
3
0
.10
21
8
0
.12
94
8
0
.12
32
0
0
.11
62
2
0
.12
16
3
I C
lass
Incom
e u
nits
0.1
303
0
0
.13
27
0
0
.13
16
0
0
.13
09
0
0
.13
69
0
0
.13
56
0
0
.12
99
0
0
.13
30
0
I C
lass
Incom
e (
EU
R h
ed
ged
) u
nits
0.1
015
6
0
.10
41
5
0
.10
57
5
0
.10
38
8
0
.12
28
2
0
.11
10
4
0
.10
20
6
0
.10
52
6
I C
lass
Incom
e (
GB
P h
ed
ged
) u
nits
0.1
283
8
0
.12
40
1
0
.12
09
8
0
.11
27
1
0
.14
24
1
0
.13
53
7
0
.12
84
9
0
.13
39
0
I C
lass
Incom
e (
JP
Y h
ed
ge
d)
un
its
0
.09
73
6
0
.10
23
5
0
.10
83
4
0
.11
29
4
0
.10
98
0
0
.10
24
8
0
.09
72
2
0
.09
78
2
D C
lass
Inco
me
units
0
.12
56
0
0
.12
95
0
0
.12
81
0
0
.12
61
0
0
.13
28
0
0
.13
17
0
0
.12
47
0
0
.12
86
0
F C
lass
Incom
e u
nits
0.1
099
0
0
.11
43
0
0
.11
30
0
0
.11
03
0
0
.11
68
0
0
.11
59
0
0
.10
88
0
0
.11
27
0
N C
lass
Inco
me
units
-
-
-
0
.01
55
0
P C
lass
Inco
me
un
its
0
.11
85
0
0
.12
13
0
0
.11
99
0
0
.11
90
0
0
.12
70
0
0
.12
38
0
0
.11
80
0
0
.12
11
0
H
igh
Yie
ld F
un
d**
A
Cla
ss I
nco
me
un
its
0
.11
00
0
0
.11
65
0
0
.11
44
0
0
.11
68
0
0
.11
93
0
0
.10
99
0
0
.10
76
0
0
.10
79
0
A C
lass
Inco
me
(A
UD
hed
ge
d)
un
its
0
.10
43
0
0
.11
15
5
0
.11
74
7
0
.12
11
9
-
0
.10
34
5
0
.11
16
8
0
.10
70
2
G
lob
al
Pro
pe
rty S
ec
uri
tie
s F
un
d*
I C
lass
Incom
e (
JP
Y h
ed
ge
d)
un
its
-
-
-
0
.16
92
6
-
-
-
0
.04
08
5
I2 C
lass In
com
e u
nits
-
-
-
0.2
256
0
-
-
-
0
.17
21
0
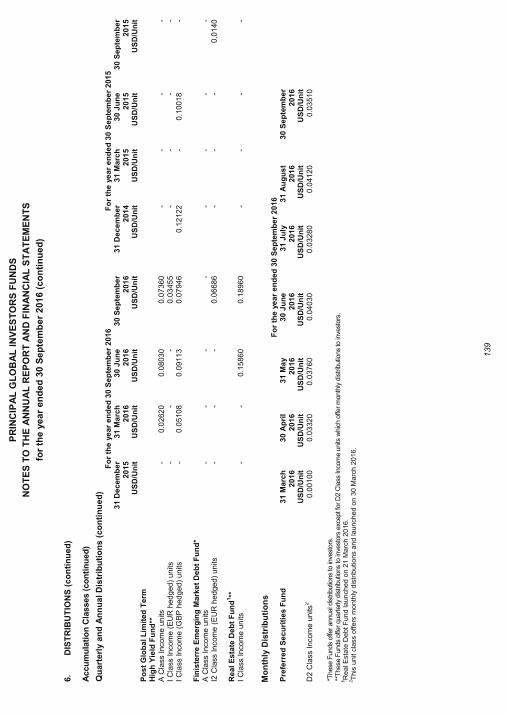
PR
INC
IPA
L G
LO
BA
L IN
VE
ST
OR
S F
UN
DS
NO
TE
S T
O T
HE
AN
NU
AL
RE
PO
RT
AN
D F
INA
NC
IAL
ST
AT
EM
EN
TS
for
the y
ear
en
ded
30 S
ep
tem
ber
201
6 (
co
nti
nu
ed
)
139
6.
DIS
TR
IBU
TIO
NS
(c
on
tin
ue
d)
Ac
cu
mu
lati
on
Cla
sses (
co
nti
nu
ed
)
Qu
art
erl
y a
nd
An
nu
al
Dis
trib
uti
on
s (
co
nti
nu
ed
)
Fo
r th
e y
ea
r e
nd
ed
30
Se
pte
mb
er
201
6
Fo
r th
e y
ea
r e
nd
ed
30
Se
pte
mb
er
201
5
31
De
cem
be
r
31
Ma
rch
30
Ju
ne
3
0 S
ep
tem
be
r
31
De
cem
be
r
31
Ma
rch
30
Ju
ne
3
0 S
ep
tem
be
r
20
15
US
D/U
nit
20
16
US
D/U
nit
20
16
US
D/U
nit
20
16
US
D/U
nit
20
14
US
D/U
nit
20
15
US
D/U
nit
20
15
US
D/U
nit
20
15
US
D/U
nit
P
os
t G
lob
al L
imit
ed
Te
rm
Hig
h Y
ield
Fu
nd
**
A C
lass
Inco
me
un
its
-
0
.02
62
0
0
.08
03
0
0
.07
36
0
-
-
-
-
I C
lass
Incom
e (
EU
R h
ed
ged
) u
nits
-
-
-
0.0
345
5
-
-
-
-
I C
lass
Incom
e (
GB
P h
ed
ged
) u
nits
-
0.0
510
8
0
.09
11
3
0
.07
94
6
0
.12
12
2
-
0
.10
01
8
-
Fin
iste
rre
Em
erg
ing
Ma
rke
t D
eb
t F
un
d*
A C
lass
Inco
me
un
its
-
-
-
-
-
-
-
-
I2 C
lass In
com
e (
EU
R h
ed
ge
d)
un
its
-
-
-
0
.06
68
6
-
-
-
0
.01
40
R
ea
l E
sta
te D
eb
t F
un
d1**
I
Cla
ss I
ncom
e u
nits
-
-
0.1
586
0
0
.18
96
0
-
-
-
-
Mo
nth
ly D
istr
ibu
tio
ns
Fo
r th
e y
ea
r e
nd
ed
30
Se
pte
mb
er
201
6
Pre
ferr
ed
Se
cu
riti
es
Fu
nd
31
Ma
rch
30
Ap
ril
3
1 M
ay
3
0 J
un
e
3
1 J
uly
31
Au
gu
st
3
0 S
ep
tem
be
r
20
16
US
D/U
nit
20
16
US
D/U
nit
20
16
US
D/U
nit
20
16
US
D/U
nit
20
16
US
D/U
nit
20
16
US
D/U
nit
20
16
US
D/U
nit
D2 C
lass
Incom
e u
nits
2
0
.00
10
0
0
.03
32
0
0
.03
76
0
0
.04
03
0
0
.03
28
0
0
.04
12
0
0
.03
51
0
*T
hese
Funds
offe
r annual d
istrib
utio
ns
to in
vest
ors
. **
These
Funds
offe
r quarterly
dis
trib
utio
ns
to in
vest
ors
exc
ept f
or D
2 C
lass
Inco
me u
nits
whic
h o
ffer m
onth
ly d
istrib
utio
ns
to in
vest
ors
. 1R
eal E
sta
te D
ebt F
und launched o
n 2
1 M
arc
h 2
016.
2T
his
unit c
lass o
ffers
month
ly d
istr
ibutions a
nd launched o
n 3
0 M
arc
h 2
016.
PRINCIPAL GLOBAL INVESTORS FUNDS
NOTES TO THE ANNUAL REPORT AND FINANCIAL STATEMENTS
for the year ended 30 September 2016 (continued)
140
7. SIGNIFICANT CONTRACTS AND TRANSACTIONS WITH RELATED PARTIES
Management Fee Pursuant to the Trust Deed dated 13 October 1992, Principal Global Investors (Ireland) Limited (“the Manager”) acts as Manager to the Trust and is responsible for its management and administration. For services rendered, the Trust will pay to the Manager an annual fee, accrued daily in the unit price and payable monthly in arrears. The Management Fee is currently calculated as a percentage of the Net Asset Value of each Fund at rates attributable to “Investor” and “Institutional” units. These related party transactions have been entered into in the ordinary course of business. The Management Fee expense is shown in the Statement of Comprehensive Income and the accrued amount is shown in the Statement of Financial Position. Management Fee rates for each unit class are listed in the supplement for each Fund. These are available from www.principalglobal.com.
Management Fee Rebate I Class Investors in certain Funds, in agreement with the Investment Adviser, are entitled to a reduction in their effective annual Management Fee. This fee reduction is effected by way of a Management Fee Rebate, paid as cash and/or additional units purchased on the investors behalf by the Manager of the Fund. The effective Management Fees paid/accrued by these investors are disclosed in the Statement of Comprehensive Income and Statement of Financial Position. Those Funds to which the rebate applies, the ranges and the amount of the rebate applicable to those ranges are disclosed in the supplements for each Fund.
Expense Cap The Manager, at its discretion, may absorb (directly by waiving a portion of its fees or by reimbursement to the account of each Fund), certain additional fees, costs or expenses for each Fund that may arise in respect of the management and operation of the Trust attributable to each Fund. This Expense Cap fee is shown as Rebate/Recharge to the Fund due to capping in the Statement of Comprehensive Income and the accrual/prepaid amount is shown as part of Other Assets or Other Payables in the Statement of Financial Position.
Administration Fee In addition to the Management Fee, the Trust Deed permits the Manager to charge an Administration Fee of up to 0.15% per annum of the value of the units in the Funds for administering the Trust. Currently the Manager only charges this fee on the Net Asset Value of the Funds attributable to A, D, F and N Class units. This fee is calculated as a percentage of the Net Asset Value of each Fund attributable to A, D, F and N Class units and is accrued every Business Day, and the total accrued amount is paid monthly in arrears. All fees and expenses payable to the Administrator in respect of the administration services it provides to the Manager will be met by the Manager. Administration Fee expense is shown in the Statement of Comprehensive Income and the accrued amount is shown in the Statement of Financial Position.
Trustee The Manager appointed BNY Mellon Trust Company (Ireland) Limited to act as the Trustee to the Trust. The principal activity of the Trustee is to act as the Depositary and Trustee of the assets of collective investment schemes (“CISs”). For the period to 30 June 2016, the Trustee retained for its own use out of each Fund a fee of up to 0.02% per annum of the Net Asset Value of the Units up to US$100 million, and thereafter, a fee of 0.01% calculated on each Business Day during the month, accrued and deducted from the Fund the following month - subject to a minimum fee of US$20,000 per annum which may be waived. Effective 1 July 2016, the Trustee may retain for its own use out of each Fund a fee of up to 0.022% per annum of the Net Asset Value of the units calculated on each Business Day during the month, accrued and deducted from the Fund the following month - subject to a minimum fee of US$15,000 per annum which may be waived. The fee currently charged by the Trustee per Fund is disclosed in the relevant supplement for each Fund. The Trustee Fee expense is shown in the Statement of Comprehensive Income and the accrued amount is shown in the Statement of Financial Position.
Directors’ Remuneration Mr. David Shubotham, Mr. John O’Connell, Mr. Denis Murphy (resigned 3 August 2016), Ms. Bronwyn Wright and Mr Jim Firn (appointed 3 August 2016) are independent non-executive Directors of the Manager and have no executive function with the Investment Adviser or its related party companies. The Manager pays each independent non-executive Director an annual fee of €25,000 (€20,000 prior to 1 July 2016) for their services rendered to the Trust. Mr. Christopher J. Reddy (resigned 26 January 2016), Mr. Nicholas Lyster, Mr. Christopher Henderson and Mr. Mike Beer (appointed 26 January 2016) are related parties to the Investment Adviser and receive no compensation from the Trust.
Depositary Fee The Depositary will be paid a fee at normal commercial rates and such fee shall be paid out of the Fund. The level of Sub-Custodian Fees and expenses will vary depending on the investment profile of the Fund including, in particular, the nature of the securities markets in which the Fund invests, the size of the Fund and the amount of trading in the assets of the Fund. Such fees will be charged at normal commercial rates and will only be reimbursed from a Fund where they are less than 0.50% per annum of the Net Asset Value of the Fund. The Manager will pay any fees that exceed this level. Depositary Fee expense is shown in the Statement of Comprehensive Income and the accrued amount is shown in the Statement of Financial Position. In accordance UCITS V: BNY Mellon Trust Company (Ireland) Limited was the Custodian for the Funds until 17 March 2016 and from 18 March 2016 assumed the role of Depositary for the Funds.
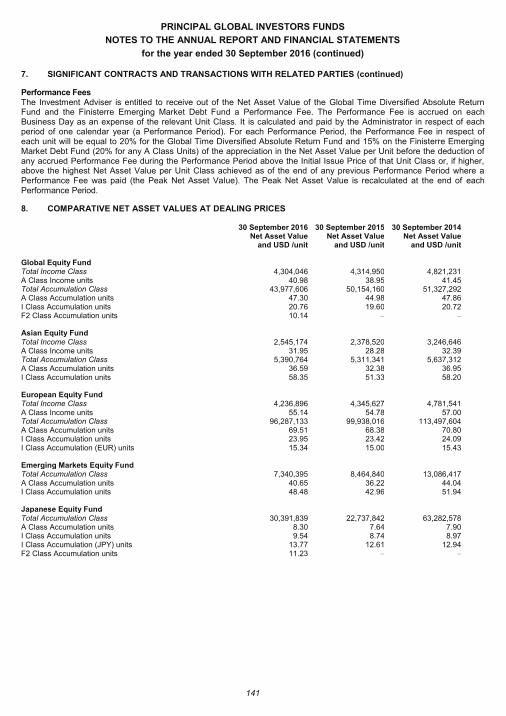
PRINCIPAL GLOBAL INVESTORS FUNDS
NOTES TO THE ANNUAL REPORT AND FINANCIAL STATEMENTS
for the year ended 30 September 2016 (continued)
141
7. SIGNIFICANT CONTRACTS AND TRANSACTIONS WITH RELATED PARTIES (continued)
Performance Fees The Investment Adviser is entitled to receive out of the Net Asset Value of the Global Time Diversified Absolute Return Fund and the Finisterre Emerging Market Debt Fund a Performance Fee. The Performance Fee is accrued on each Business Day as an expense of the relevant Unit Class. It is calculated and paid by the Administrator in respect of each period of one calendar year (a Performance Period). For each Performance Period, the Performance Fee in respect of each unit will be equal to 20% for the Global Time Diversified Absolute Return Fund and 15% on the Finisterre Emerging Market Debt Fund (20% for any A Class Units) of the appreciation in the Net Asset Value per Unit before the deduction of any accrued Performance Fee during the Performance Period above the Initial Issue Price of that Unit Class or, if higher, above the highest Net Asset Value per Unit Class achieved as of the end of any previous Performance Period where a Performance Fee was paid (the Peak Net Asset Value). The Peak Net Asset Value is recalculated at the end of each Performance Period.
8. COMPARATIVE NET ASSET VALUES AT DEALING PRICES
30 September 2016 Net Asset Value
and USD /unit
30 September 2015 Net Asset Value
and USD /unit
30 September 2014 Net Asset Value
and USD /unit Global Equity Fund Total Income Class 4,304,046 4,314,950 4,821,231 A Class Income units 40.98 38.95 41.45 Total Accumulation Class 43,977,606 50,154,160 51,327,292 A Class Accumulation units 47.30 44.98 47.86 I Class Accumulation units 20.76 19.60 20.72 F2 Class Accumulation units 10.14 – – Asian Equity Fund Total Income Class 2,545,174 2,378,520 3,246,646 A Class Income units 31.95 28.28 32.39 Total Accumulation Class 5,390,764 5,311,341 5,637,312 A Class Accumulation units 36.59 32.38 36.95 I Class Accumulation units 58.35 51.33 58.20 European Equity Fund Total Income Class 4,236,896 4,345,627 4,781,541 A Class Income units 55.14 54.78 57.00 Total Accumulation Class 96,287,133 99,938,016 113,497,604 A Class Accumulation units 69.51 68.38 70.80 I Class Accumulation units 23.95 23.42 24.09 I Class Accumulation (EUR) units 15.34 15.00 15.43 Emerging Markets Equity Fund Total Accumulation Class 7,340,395 8,464,840 13,086,417 A Class Accumulation units 40.65 36.22 44.04 I Class Accumulation units 48.48 42.96 51.94 Japanese Equity Fund Total Accumulation Class 30,391,839 22,737,842 63,282,578 A Class Accumulation units 8.30 7.64 7.90 I Class Accumulation units 9.54 8.74 8.97 I Class Accumulation (JPY) units 13.77 12.61 12.94 F2 Class Accumulation units 11.23 – –
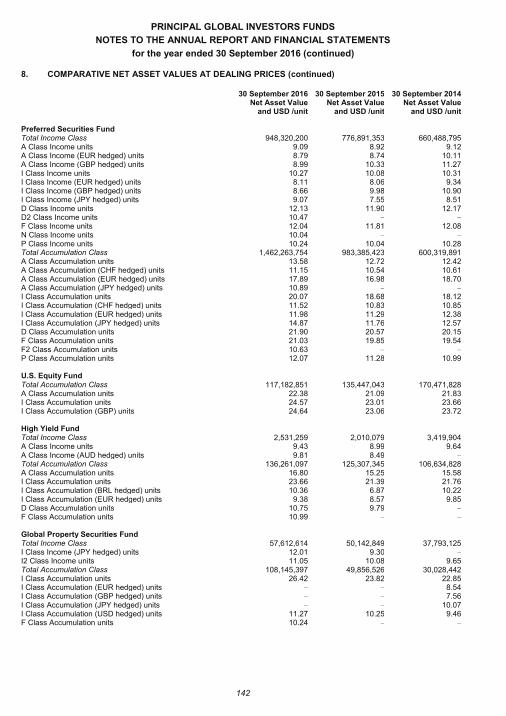
PRINCIPAL GLOBAL INVESTORS FUNDS
NOTES TO THE ANNUAL REPORT AND FINANCIAL STATEMENTS
for the year ended 30 September 2016 (continued)
142
8. COMPARATIVE NET ASSET VALUES AT DEALING PRICES (continued)
30 September 2016 Net Asset Value
and USD /unit
30 September 2015 Net Asset Value
and USD /unit
30 September 2014 Net Asset Value
and USD /unit Preferred Securities Fund Total Income Class 948,320,200 776,891,353 660,488,795 A Class Income units 9.09 8.92 9.12 A Class Income (EUR hedged) units 8.79 8.74 10.11 A Class Income (GBP hedged) units 8.99 10.33 11.27 I Class Income units 10.27 10.08 10.31 I Class Income (EUR hedged) units 8.11 8.06 9.34 I Class Income (GBP hedged) units 8.66 9.98 10.90 I Class Income (JPY hedged) units 9.07 7.55 8.51 D Class Income units 12.13 11.90 12.17 D2 Class Income units 10.47 – – F Class Income units 12.04 11.81 12.08 N Class Income units 10.04 – – P Class Income units 10.24 10.04 10.28 Total Accumulation Class 1,462,263,754 983,385,423 600,319,891 A Class Accumulation units 13.58 12.72 12.42 A Class Accumulation (CHF hedged) units 11.15 10.54 10.61 A Class Accumulation (EUR hedged) units 17.89 16.98 18.70 A Class Accumulation (JPY hedged) units 10.89 – – I Class Accumulation units 20.07 18.68 18.12 I Class Accumulation (CHF hedged) units 11.52 10.83 10.85 I Class Accumulation (EUR hedged) units 11.98 11.29 12.38 I Class Accumulation (JPY hedged) units 14.87 11.76 12.57 D Class Accumulation units 21.90 20.57 20.15 F Class Accumulation units 21.03 19.85 19.54 F2 Class Accumulation units 10.63 – – P Class Accumulation units 12.07 11.28 10.99 U.S. Equity Fund Total Accumulation Class 117,182,851 135,447,043 170,471,828 A Class Accumulation units 22.38 21.09 21.83 I Class Accumulation units 24.57 23.01 23.66 I Class Accumulation (GBP) units 24.64 23.06 23.72 High Yield Fund Total Income Class 2,531,259 2,010,079 3,419,904 A Class Income units 9.43 8.99 9.64 A Class Income (AUD hedged) units 9.81 8.49 – Total Accumulation Class 136,261,097 125,307,345 106,634,828 A Class Accumulation units 16.80 15.25 15.58 I Class Accumulation units 23.66 21.39 21.76 I Class Accumulation (BRL hedged) units 10.36 6.87 10.22 I Class Accumulation (EUR hedged) units 9.38 8.57 9.85 D Class Accumulation units 10.75 9.79 – F Class Accumulation units 10.99 – – Global Property Securities Fund Total Income Class 57,612,614 50,142,849 37,793,125 I Class Income (JPY hedged) units 12.01 9.30 – I2 Class Income units 11.05 10.08 9.65 Total Accumulation Class 108,145,397 49,856,526 30,028,442 I Class Accumulation units 26.42 23.82 22.85 I Class Accumulation (EUR hedged) units – – 8.54 I Class Accumulation (GBP hedged) units – – 7.56 I Class Accumulation (JPY hedged) units – – 10.07 I Class Accumulation (USD hedged) units 11.27 10.25 9.46 F Class Accumulation units 10.24 – –
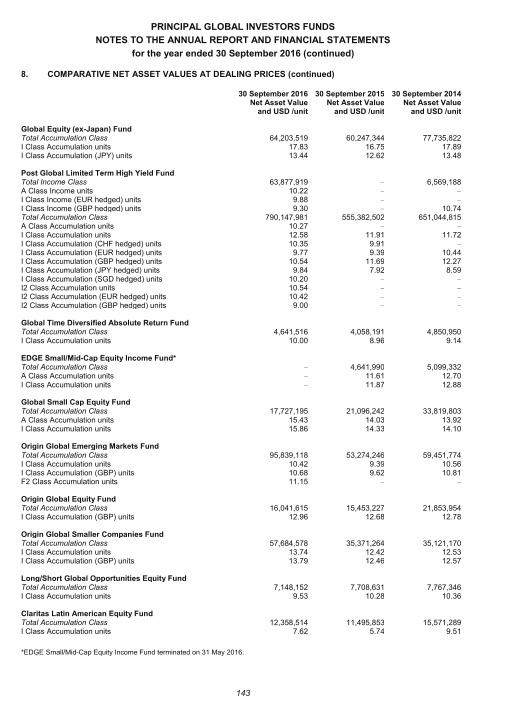
PRINCIPAL GLOBAL INVESTORS FUNDS
NOTES TO THE ANNUAL REPORT AND FINANCIAL STATEMENTS
for the year ended 30 September 2016 (continued)
143
8. COMPARATIVE NET ASSET VALUES AT DEALING PRICES (continued)
30 September 2016 Net Asset Value
and USD /unit
30 September 2015 Net Asset Value
and USD /unit
30 September 2014 Net Asset Value
and USD /unit Global Equity (ex-Japan) Fund Total Accumulation Class 64,203,519 60,247,344 77,735,822 I Class Accumulation units 17.83 16.75 17.89 I Class Accumulation (JPY) units 13.44 12.62 13.48 Post Global Limited Term High Yield Fund Total Income Class 63,877,919 – 6,569,188 A Class Income units 10.22 – – I Class Income (EUR hedged) units 9.88 – – I Class Income (GBP hedged) units 9.30 – 10.74 Total Accumulation Class 790,147,981 555,382,502 651,044,815 A Class Accumulation units 10.27 – – I Class Accumulation units 12.58 11.91 11.72 I Class Accumulation (CHF hedged) units 10.35 9.91 – I Class Accumulation (EUR hedged) units 9.77 9.39 10.44 I Class Accumulation (GBP hedged) units 10.54 11.69 12.27 I Class Accumulation (JPY hedged) units 9.84 7.92 8.59 I Class Accumulation (SGD hedged) units 10.20 – – I2 Class Accumulation units 10.54 – – I2 Class Accumulation (EUR hedged) units 10.42 – – I2 Class Accumulation (GBP hedged) units 9.00 – – Global Time Diversified Absolute Return Fund Total Accumulation Class 4,641,516 4,058,191 4,850,950 I Class Accumulation units 10.00 8.96 9.14 EDGE Small/Mid-Cap Equity Income Fund* Total Accumulation Class – 4,641,990 5,099,332 A Class Accumulation units – 11.61 12.70 I Class Accumulation units – 11.87 12.88 Global Small Cap Equity Fund Total Accumulation Class 17,727,195 21,096,242 33,819,803 A Class Accumulation units 15.43 14.03 13.92 I Class Accumulation units 15.86 14.33 14.10 Origin Global Emerging Markets Fund Total Accumulation Class 95,839,118 53,274,246 59,451,774 I Class Accumulation units 10.42 9.39 10.56 I Class Accumulation (GBP) units 10.68 9.62 10.81 F2 Class Accumulation units 11.15 – – Origin Global Equity Fund Total Accumulation Class 16,041,615 15,453,227 21,853,954 I Class Accumulation (GBP) units 12.96 12.68 12.78 Origin Global Smaller Companies Fund Total Accumulation Class 57,684,578 35,371,264 35,121,170 I Class Accumulation units 13.74 12.42 12.53 I Class Accumulation (GBP) units 13.79 12.46 12.57 Long/Short Global Opportunities Equity Fund Total Accumulation Class 7,148,152 7,708,631 7,767,346 I Class Accumulation units 9.53 10.28 10.36 Claritas Latin American Equity Fund Total Accumulation Class 12,358,514 11,495,853 15,571,289 I Class Accumulation units 7.62 5.74 9.51
*EDGE Small/Mid-Cap Equity Income Fund terminated on 31 May 2016.
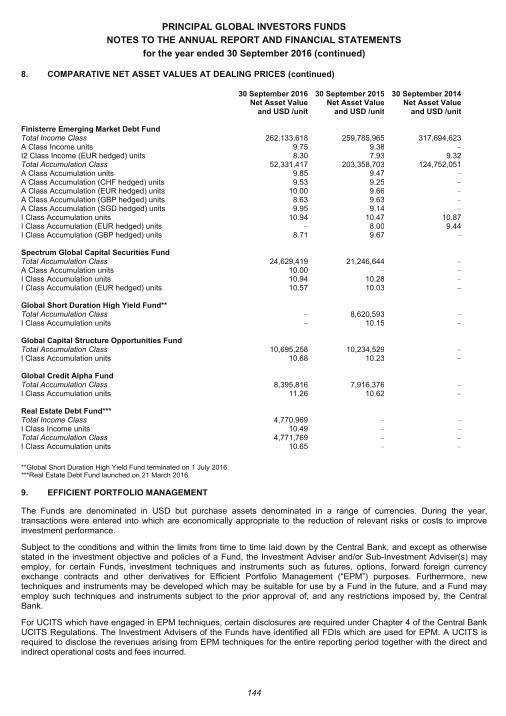
PRINCIPAL GLOBAL INVESTORS FUNDS
NOTES TO THE ANNUAL REPORT AND FINANCIAL STATEMENTS
for the year ended 30 September 2016 (continued)
144
8. COMPARATIVE NET ASSET VALUES AT DEALING PRICES (continued)
30 September 2016 Net Asset Value
and USD /unit
30 September 2015 Net Asset Value
and USD /unit
30 September 2014 Net Asset Value
and USD /unit Finisterre Emerging Market Debt Fund Total Income Class 262,133,618 259,785,965 317,694,623 A Class Income units 9.75 9.38 – I2 Class Income (EUR hedged) units 8.30 7.93 9.32 Total Accumulation Class 52,331,417 203,358,703 124,752,051 A Class Accumulation units 9.85 9.47 – A Class Accumulation (CHF hedged) units 9.53 9.25 – A Class Accumulation (EUR hedged) units 10.00 9.66 – A Class Accumulation (GBP hedged) units 8.63 9.63 – A Class Accumulation (SGD hedged) units 9.95 9.14 – I Class Accumulation units 10.94 10.47 10.87 I Class Accumulation (EUR hedged) units – 8.00 9.44 I Class Accumulation (GBP hedged) units 8.71 9.67 – Spectrum Global Capital Securities Fund Total Accumulation Class 24,629,419 21,246,644 – A Class Accumulation units 10.00 – – I Class Accumulation units 10.94 10.28 – I Class Accumulation (EUR hedged) units 10.57 10.03 – Global Short Duration High Yield Fund** Total Accumulation Class – 8,620,593 – I Class Accumulation units – 10.15 – Global Capital Structure Opportunities Fund Total Accumulation Class 10,695,258 10,234,529 – I Class Accumulation units 10.68 10.23 – Global Credit Alpha Fund Total Accumulation Class 8,395,816 7,916,376 – I Class Accumulation units 11.26 10.62 – Real Estate Debt Fund*** Total Income Class 4,770,969 – – I Class Income units 10.49 – – Total Accumulation Class 4,771,769 – – I Class Accumulation units 10.65 – –
**Global Short Duration High Yield Fund terminated on 1 July 2016. ***Real Estate Debt Fund launched on 21 March 2016.
9. EFFICIENT PORTFOLIO MANAGEMENT
The Funds are denominated in USD but purchase assets denominated in a range of currencies. During the year, transactions were entered into which are economically appropriate to the reduction of relevant risks or costs to improve investment performance.
Subject to the conditions and within the limits from time to time laid down by the Central Bank, and except as otherwise stated in the investment objective and policies of a Fund, the Investment Adviser and/or Sub-Investment Adviser(s) may employ, for certain Funds, investment techniques and instruments such as futures, options, forward foreign currency exchange contracts and other derivatives for Efficient Portfolio Management (“EPM”) purposes. Furthermore, new techniques and instruments may be developed which may be suitable for use by a Fund in the future, and a Fund may employ such techniques and instruments subject to the prior approval of, and any restrictions imposed by, the Central Bank.
For UCITS which have engaged in EPM techniques, certain disclosures are required under Chapter 4 of the Central Bank UCITS Regulations. The Investment Advisers of the Funds have identified all FDIs which are used for EPM. A UCITS is required to disclose the revenues arising from EPM techniques for the entire reporting period together with the direct and indirect operational costs and fees incurred.
PRINCIPAL GLOBAL INVESTORS FUNDS
NOTES TO THE ANNUAL REPORT AND FINANCIAL STATEMENTS
for the year ended 30 September 2016 (continued)
145
9. EFFICIENT PORTFOLIO MANAGEMENT (continued)
The Investment Adviser considers only repurchase agreements, reverse repurchase agreements and securities lending to be EPM techniques. None of the Funds held repurchase agreements, reverse repurchase agreements or took part in securities lending as at year end date 30 September 2016 or at 30 September 2015. Details of all open transactions at the year end are disclosed in the Portfolios of Investments.
10. DEALING COMMISSION ARRANGEMENTS
The Investment Adviser appointed in relation to each Fund is responsible for the selection of brokers with whom they deal. In relation to certain equity funds, the Investment Advisers have entered into dealing commission arrangements with brokers whereby they obtain services or benefits from them, or from third parties – which are paid for out of commissions charged to the Funds. Such services or benefits relate primarily to research and portfolio management, and their purchase is compliant with relevant local regulation; including being a permitted service. The relevant Investment Advisers are satisfied that trades generating soft commissions comply with the relevant local regulations requiring best execution – which requires consideration of relevant factors, including price and execution quality.
11. FINANCIAL RISK MANAGEMENT
Strategy in Using Financial Instruments
The activities of each Fund expose it to a variety of financial risks such as market risk (including currency risk, interest rate risk and price risk), credit risk and liquidity risk. The Funds’ overall risk management programme focuses on the unpredictability of financial markets and seeks to minimise potential adverse effects on the Funds’ financial performance. The Funds make use of FDIs to moderate certain risk exposures. The general risk factors set out in the “Special Investment Considerations and Risks” section of the Prospectus apply to the Funds and risks specific to these Funds are set out below. These risk factors do not purport to be an exhaustive or complete explanation of all the risks associated with an investment in the Funds and persons considering purchasing units should inform themselves as to (i) the legal requirements within their own countries for the purchase of units, (ii) any foreign exchange restrictions which may be applicable and (iii) the income and other tax consequences of purchase and repurchase of units.
The risk management process operates at a number of levels. In addition to the Investment Adviser monitoring investment activity and exposure at the point of execution ensuring a Fund is managed according to its guidelines and objectives, the Depositary and the Trustee of the Funds also provide an independent analysis of financial instrument exposure by monitoring investment limits in accordance with the UCITS Regulations and the Funds’ Prospectus.
The Funds’ overall market positions are monitored on a daily basis by the Investment Adviser and compliance with the Funds’ investment guidelines are monitored on an ongoing basis by the Investment Adviser/Sub Investment Adviser(s) and Trustee. The Board of Directors of the Manager have oversight of the risk management process and receive monthly and quarterly reports from the Investment Adviser/Sub-Investment Adviser(s) and the Trustee. The Funds’ investments in securities are subject to normal market fluctuations and other risks inherent in investing in securities. The value of investments and the income from them, and therefore the value of the units can go down as well as up and an investor may not get back the amount they invest. The strategies as enumerated for the funds below and overleaf are summarised, please refer to the prospectus and supplements of the individual funds for greater detail. These are available on the www.principalglobal.com website. Global Equity Fund The Fund seeks to achieve capital growth by investing principally in equity securities from investment markets around the world. Investments can also include unlisted securities (limited to 10% of the net assets), bank deposits, debt securities, and fixed interest and money market securities. The Fund may also invest in Real Estate Investment Trusts (“REITS”) and in other Funds of the Trust. No more than 15% of the net assets will be invested in Russia.
Asian Equity Fund The Fund seeks to achieve capital growth by investing principally in the equity securities of companies domiciled or with their core business in the Asian region (excluding Japan). Investments can also include unlisted securities (limited to 10% of the net assets), bank deposits, debt securities, fixed interest and money market securities. The Fund may also invest in REITS and in other Funds of the Trust. No more than 30% of the net assets will be invested in Pakistan.
PRINCIPAL GLOBAL INVESTORS FUNDS
NOTES TO THE ANNUAL REPORT AND FINANCIAL STATEMENTS
for the year ended 30 September 2016 (continued)
146
11. FINANCIAL RISK MANAGEMENT (continued)
Strategy in Using Financial Instruments (continued)
European Equity Fund The Fund seeks to achieve capital growth by investing principally in the equity securities of companies domiciled or with their core business in Europe (including Eastern Europe). Investments can also include unlisted securities (limited to 10% of the net assets), bank deposits, debt securities, and fixed interest and money market securities. The Fund may also invest in REITS and in other Funds of the Trust. No more than 15% of the net assets will be invested in Russia.
Emerging Markets Equity Fund The Fund seeks to achieve capital growth by investing principally in the equity securities of companies domiciled or with their core business in the world’s emerging investment markets as identified by the International Finance Corporation (a division of the World Bank). Investments can also include unlisted securities (limited to 10% of the net assets), bank deposits, debt securities, fixed interest, money market securities and other CISs. The Fund may also invest in REITS and in other Funds of the Trust. No more than 15% of the net assets will be invested in Russia.
Japanese Equity Fund The Fund seeks to achieve capital growth by investing principally in the equity securities of companies domiciled or with their core business in Japan. Investments can also include unlisted securities (limited to 10% of the net assets), bank deposits, debt securities, fixed interest and money market securities. The Fund may also invest in REITS and in other Funds of the Trust.
Preferred Securities Fund The Fund will seek to provide a return consisting of income and capital preservation by investing primarily in a portfolio of USD denominated preferred securities and debt securities. Investments can also include ancillary liquid assets such as bank deposits. The Fund’s investment universe will include REITS.
U.S. Equity Fund The Fund seeks to achieve capital growth by investing principally in the equity securities of companies domiciled or with their core business in the United States, which the Investment Adviser believes are mispriced by the market and have the potential for significant growth. The Fund can invest in both listed and unlisted equity securities, with a level of 10% of the net assets of the Fund permitted in unlisted securities. The Fund may also invest in debt securities, as set out in the Prospectus, as well as REITS and other Funds of the Trust.
High Yield Fund The Fund will seek to provide a return consisting of income and, over the long term, capital appreciation by investing primarily in a portfolio of USD denominated public and private issued high-yield fixed income securities. The Fund may also hold ancillary liquid assets such as bank deposits as well as invest in REITS and in other Funds of the Trust.
Global Property Securities Fund
The Fund will seek to provide a total return primarily through investment in a global portfolio of publicly traded securities of companies engaged in the property industry or whose value is derived from property assets. The Fund’s investments will include no less than 80% of the net assets in REITS or real estate operating companies (“REOCs”). The Fund may also invest in common and preferred equity securities, debt securities, options, warrants (up to 5% of the Fund), convertible securities, exchange traded funds (“ETFs”) and depositary receipts.
Global Equity (ex-Japan) Fund
The Fund seeks to achieve capital growth by investing in equity securities from investment markets around the world, with the exception of Japan. Investments can also include unlisted securities (limited to 10% of the net assets), bank deposits, debt securities, fixed interest and money market securities. The Fund may also invest in REITS and in other Funds of the Trust.
PRINCIPAL GLOBAL INVESTORS FUNDS
NOTES TO THE ANNUAL REPORT AND FINANCIAL STATEMENTS
for the year ended 30 September 2016 (continued)
147
11. FINANCIAL RISK MANAGEMENT (continued)
Strategy in Using Financial Instruments (continued)
Post Global Limited Term High Yield Fund The Fund aims to provide a high rate of return with low volatility relative to typical high yield investments by investing primarily in a portfolio of global short-term, lower volatility high yield debt securities with an average duration of approximately 12-24 months. These securities will generally be rated below investment grade. The portfolio will be diversified, consisting from time to time of securities including fixed and floating rate global corporate bonds, debt issued in the leveraged loan market such as bank loan assignments and participations, convertible bonds, commercial paper, private placements, such as section 144A securities, preferred securities, hybrids and taxable municipal bonds. The Fund may also invest in other Funds of the Trust in order to obtain its objective.
Global Time Diversified Absolute Return Fund The Global Time Diversified Absolute Return Fund will seek to provide a consistent stream of positive returns in excess of USD 3 month LIBOR (“London Inter-Bank Offer Rate”) over a 3-5 year horizon by investing primarily in FDIs to gain exposure to a portfolio of cross currency positions on a leveraged basis. The FDIs will gain exposure to an investible currency universe which will primarily comprise 12 currencies which the Sub-Investment Adviser considers to be the most tradable currencies in the developed world at any given time.
EDGE Small/Mid-Cap Equity Income Fund The investment objective of the Fund was to provide income with long-term growth in both income and capital. The Fund sought to achieve its objective by investing primarily in dividend paying equity securities. The majority of the portfolio was generally invested in the equity securities of US listed companies, but the Fund could also invest in the equity securities of non-US listed companies. The Fund could also hold securities throughout the capitalisation spectrum including mid and small cap securities. The Fund could also invest in REITS and Master Limited Partnerships that were eligible for investment by the Fund. The Fund terminated on 31 May 2016.
Global Small Cap Equity Fund The investment objective of the Fund is to provide medium to long-term capital growth. The Fund seeks to achieve its objective by investing primarily in publicly listed equity securities of smaller capitalisation companies in markets globally. It is anticipated that the Fund will usually hold at least 70% in such securities. The Fund can also invest in REITS and equity securities of issuers that derive income or profits from products or services related to the global property industry. It may also invest in other Funds of the Trust in order to seek to meet its objective.
Origin Global Emerging Markets Fund The objective of the Fund is to seek to achieve capital growth through investment in global emerging market equities. The Fund will invest in transferable equity and equity-related securities of a diversified range of companies in what the Sub-Investment Adviser considers to be emerging economies of the world, normally with a minimum market capitalisation on purchase of USD250 million. These securities will primarily be common stocks and other securities with equity characteristics, including but not limited to preferred stocks, warrants (only held where an existing holding is subject to an issuance of warrants and, in aggregate, normally not more than 5% of the Fund’s Net Asset Value) and rights as well as depositary receipts for such securities, all of which are traded on securities exchanges or regulated markets.
Origin Global Equity Fund The objective of the Fund is to seek to achieve capital growth through investment in global equities. The Fund will invest in transferable equity and equity-related securities of a diversified range of companies throughout the globe, normally with a minimum market capitalisation on purchase of USD1 billion. The Fund is constructed with very limited regard to the characteristics of any market capitalisation weighted global equity indices. These securities will primarily be common stocks and other securities with equity characteristics, including but not limited to preferred stocks, warrants (only held where an existing holding is subject to an issuance of warrants and, in aggregate, normally not more than 5% of the Fund’s Net Asset Value) and rights as well as depositary receipts for such securities, all of which are traded on securities exchanges or regulated markets.
Origin Global Smaller Companies Fund The objective of the Fund is to seek to achieve capital growth through investment in global smaller companies. The Fund will invest in transferable equity and equity-related securities of a diversified range of companies throughout the globe, normally with a maximum market capitalisation on purchase of up to USD5 billion. These securities will primarily be common stocks and other securities with equity characteristics, including but not limited to preferred stocks, warrants (only held where an existing holding is subject to an issuance of warrants and, in aggregate, normally not more than 5% of the Fund’s Net Asset Value) and rights as well as depositary receipts for such securities, all of which are traded on securities exchanges or regulated markets.

PRINCIPAL GLOBAL INVESTORS FUNDS
NOTES TO THE ANNUAL REPORT AND FINANCIAL STATEMENTS
for the year ended 30 September 2016 (continued)
148
11. FINANCIAL RISK MANAGEMENT (continued)
Strategy in Using Financial Instruments (continued)
Long/Short Global Opportunities Equity Fund The investment objective of the Fund is to seek capital growth over the medium to long term with the secondary objective of seeking to limit volatility. The Fund seeks to achieve its objective by investing principally in both long and short posit ions in equity securities and equity related securities (comprising American Depositary Receipts and Global Depositary Receipts) from investment markets around the world. The Fund will hold short positions synthetically through the use of FDIs. The Fund may also invest in eligible REITS or other REIT-like structures which will be the equivalent of REITS. It may also invest in other Funds of the Trust and eligible ETFs.
Claritas Latin American Equity Fund The investment objective of the Fund is to provide capital growth over the medium to long term. The Fund will invest primarily in equity securities of Latin American companies, which are, companies with their principal place of business or principal office in Latin American countries and/or companies for which their principal securities trading market is a Latin American country. “Latin American” is defined as all countries located in the American continent, except Canada and the United States of America.
Finisterre Emerging Market Debt Fund The investment objective of the Fund is to generate medium to long term positive total returns from a combination of current income and capital appreciation by investing in global emerging market securities. The Fund seeks to achieve its objective by investing primarily in fixed income instruments of sovereign and quasi-sovereign issuers and corporate debt obligations in emerging markets. The types of fixed income instruments and corporate debt obligations that the Fund may invest in are bonds, asset-backed securities, convertible bonds, CoCos, credit and index linked securities, Rule 144A and/or Regulation S securities. The Fund may use FDIs for investment purposes as well as for hedging and/or EPM purposes. From time to time, the Fund may hold an unlimited amount of investments which are traded in Russia.
Spectrum Global Capital Securities Fund The investment objective of the Fund is to generate positive total return over the medium to long term including capital preservation. The Fund seeks to achieve its objective by investing the majority of its assets in below investment grade CoCos from around the world, together with volatility mitigation strategies to mitigate the credit and interest rate volatility associated with CoCos. The Fund may also invest in UCITS eligible ETFs.
Global Short Duration High Yield Fund The Fund aimed to provide a high rate of return with lower price volatility relative to typical high yield investments by investing in limited duration high yield securities. The Fund sought to achieve its objective by investing the majority of its assets in global short-term, high yield debt securities with lower price volatility, as measured by the Investment Adviser, relative to typical high yield investments and with an average duration of approximately 12-24 months. These securities were generally rated below investment grade. The Fund could also invest in UCITS eligible CISs, including other Funds of
the Trust and ETFs. The Fund terminated on 31 July 2016.
Global Capital Structure Opportunities Fund The Fund aims to provide high single digit returns over any given market cycle while minimising drawdown risk. The Fund seeks to achieve its objective primarily by investing across the capital structure of companies around the world which, together with investment in FDI’s, will seek to minimise certain risks associated with such investments. In certain market
conditions the Fund may also invest in government debt. The Fund may also invest in UCITS eligible CISs and ETFs.
Global Credit Alpha Fund The investment objective of the Fund is to seek a high rate of total return over the medium to long term. The Fund seeks to achieve its objective by investing the majority of its assets in high yield corporate bonds, securitised debt, emerging markets bonds as well as government bonds and investment grade corporate bonds from markets around the world. The Fund may invest in UCITS eligible CISs, including other Funds of the Unit Trust and ETFs.
Real Estate Debt Fund The objective of the Fund is to provide attractive long term risk adjusted returns. The Fund seeks to achieve the investment objective by investing the majority of its assets in a diversified portfolio of U.S. commercial mortgage-backed securities (“CMBS”). CMBS are structured debt securities, typically secured by diversified pools of mortgages on commercial real estate properties located across the U.S. While the Fund will primarily invest in CMBS, it may also invest in unsecured bonds issued by companies primarily engaged in a real estate or real estate related business. The CMBS and unsecured bonds may include Rule 144A securities. The Fund may also use certain FDI’s for investment purposes and the Fund may also hold ancillary liquid assets such as bank deposits and U.S. Treasury Securities.
PRINCIPAL GLOBAL INVESTORS FUNDS
NOTES TO THE ANNUAL REPORT AND FINANCIAL STATEMENTS
for the year ended 30 September 2016 (continued)
149
11. FINANCIAL RISK MANAGEMENT (continued)
Market Price Risk
All securities and investments present a risk of loss of capital. The Investment Adviser/Sub-Investment Adviser(s) moderates this risk through diversification and a careful selection of securities and other financial instruments within the limits defined in the Prospectus.
Except for derivatives, the maximum risk resulting from financial instruments is determined by the fair value of the financial instruments. Possible losses from written options can be unlimited and losses on forwards and futures can result from the movement in currency exchange rates in the time between the forward trade date and the settlement date depending on the volatility of the currencies.
The maximum risk of the Interest Rate Swaps, Credit Default Swaps, Cross Currency Swaps and Total Return Swaps is determined by the fair value of the swaps. The Funds’ overall market positions are monitored on a daily basis by the Funds’ Sub-Investment Adviser.
The Investment Adviser reviews the portfolio characteristics of each Fund in its entirety. This review may include as appropriate a review of country allocations, country weights, capitalization, distribution, industry sector weights, price/book levels, currency exposure, portfolio maturity, portfolio duration, sector exposure, quality exposure and other key risk measures.
The Funds may employ investment techniques and FDIs for EPM and/or investment purposes within the limits set out in the Prospectus as described in the sections ‘General Information’ and ‘Special Investment Considerations and Risks’. The Funds may hold a combination of FDIs such as options, futures, options on futures, forward foreign currency exchange contracts, repurchase contracts, reverse repurchase agreements, sale and buyback agreements, stock lending agreements, credit default swaps, interest rate swaps and other over the counter derivative instruments may be used subject to the conditions and limits laid down by the Central Bank and the Trust Deed and subject to any other restrictions or regulations which may affect the portfolio management of the Funds.
Sensitivity Analysis Sensitivity Analysis is an indication based on historical data showing what an impact of 5% movement in the Benchmark would do to the net asset of the Funds at the Statement of Financial Position date.
Limitations of Sensitivity Analysis:
Some limitations of sensitivity analysis are;
· the models are based on historical data and cannot take account of the fact that future market price movements, correlations between markets and levels of market liquidity in conditions of market stress may bear no relation to historical patterns;
· the market price risk information is a relative estimate of risk rather than a precise and accurate number;
· the market price information represents a hypothetical outcome and is not intended to be predictive; and future market conditions could vary significantly from those experienced in the past.
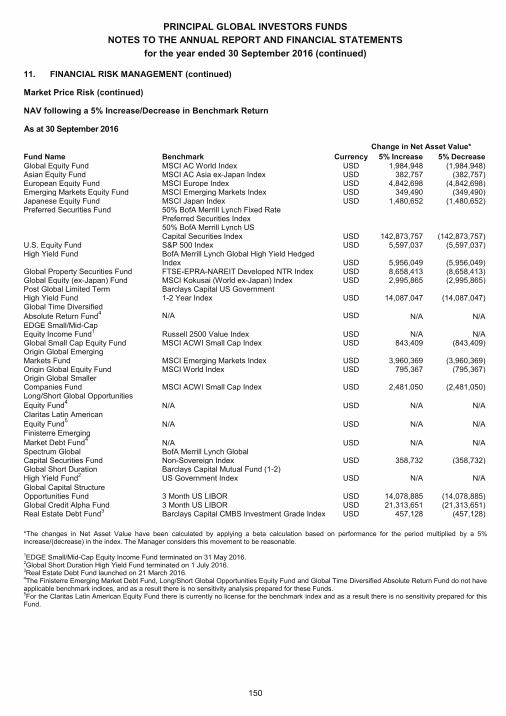
PRINCIPAL GLOBAL INVESTORS FUNDS
NOTES TO THE ANNUAL REPORT AND FINANCIAL STATEMENTS
for the year ended 30 September 2016 (continued)
150
11. FINANCIAL RISK MANAGEMENT (continued)
Market Price Risk (continued)
NAV following a 5% Increase/Decrease in Benchmark Return
As at 30 September 2016
Change in Net Asset Value*
Fund Name Benchmark Currency 5% Increase 5% Decrease Global Equity Fund MSCI AC World Index USD 1,984,948 (1,984,948) Asian Equity Fund MSCI AC Asia ex-Japan Index USD 382,757 (382,757) European Equity Fund MSCI Europe Index USD 4,842,698 (4,842,698) Emerging Markets Equity Fund MSCI Emerging Markets Index USD 349,490 (349,490) Japanese Equity Fund MSCI Japan Index USD 1,480,652 (1,480,652) Preferred Securities Fund 50% BofA Merrill Lynch Fixed Rate
Preferred Securities Index 50% BofA Merrill Lynch US Capital Securities Index USD 142,873,757 (142,873,757)
U.S. Equity Fund S&P 500 Index USD 5,597,037 (5,597,037) High Yield Fund BofA Merrill Lynch Global High Yield Hedged
Index USD 5,956,049 (5,956,049) Global Property Securities Fund FTSE-EPRA-NAREIT Developed NTR Index USD 8,658,413 (8,658,413) Global Equity (ex-Japan) Fund MSCI Kokusai (World ex-Japan) Index USD 2,995,865 (2,995,865) Post Global Limited Term Barclays Capital US Government High Yield Fund 1-2 Year Index USD 14,087,047 (14,087,047) Global Time Diversified
Absolute Return Fund4 N/A USD N/A N/A
EDGE Small/Mid-Cap Equity Income Fund
1 Russell 2500 Value Index USD N/A N/A
Global Small Cap Equity Fund MSCI ACWI Small Cap Index USD 843,409 (843,409) Origin Global Emerging Markets Fund MSCI Emerging Markets Index USD 3,960,369 (3,960,369) Origin Global Equity Fund MSCI World Index USD 795,367 (795,367) Origin Global Smaller Companies Fund MSCI ACWI Small Cap Index USD 2,481,050 (2,481,050) Long/Short Global Opportunities
Equity Fund4 N/A USD N/A N/A
Claritas Latin American
Equity Fund5 N/A USD N/A N/A
Finisterre Emerging
Market Debt Fund4 N/A USD N/A N/A
Spectrum Global BofA Merrill Lynch Global Capital Securities Fund Non-Sovereign Index USD 358,732 (358,732) Global Short Duration Barclays Capital Mutual Fund (1-2) High Yield Fund
2 US Government Index USD N/A N/A
Global Capital Structure Opportunities Fund 3 Month US LIBOR USD 14,078,885 (14,078,885) Global Credit Alpha Fund 3 Month US LIBOR USD 21,313,651 (21,313,651) Real Estate Debt Fund
3 Barclays Capital CMBS Investment Grade Index USD 457,128 (457,128)
*The changes in Net Asset Value have been calculated by applying a beta calculation based on performance for the period multiplied by a 5% increase/(decrease) in the index. The Manager considers this movement to be reasonable. 1EDGE Small/Mid-Cap Equity Income Fund terminated on 31 May 2016. 2Global Short Duration High Yield Fund terminated on 1 July 2016. 3Real Estate Debt Fund launched on 21 March 2016. 4The Finisterre Emerging Market Debt Fund, Long/Short Global Opportunities Equity Fund and Global Time Diversified Absolute Return Fund do not have applicable benchmark indices, and as a result there is no sensitivity analysis prepared for these Funds. 5For the Claritas Latin American Equity Fund there is currently no license for the benchmark index and as a result there is no sensitivity prepared for this Fund.
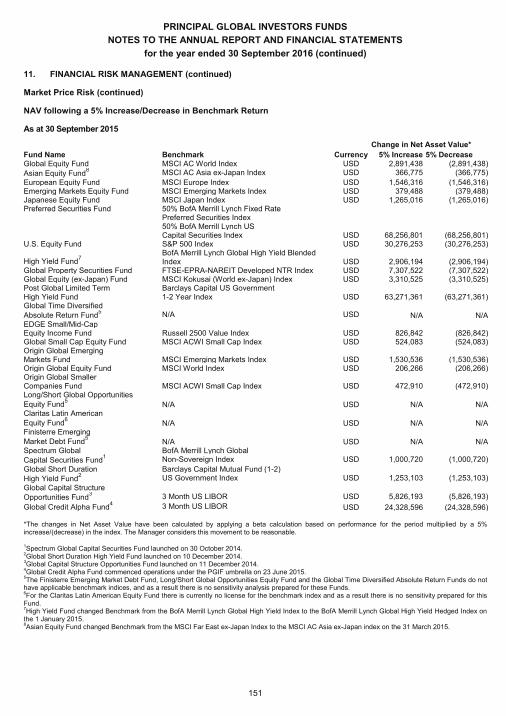
PRINCIPAL GLOBAL INVESTORS FUNDS
NOTES TO THE ANNUAL REPORT AND FINANCIAL STATEMENTS
for the year ended 30 September 2016 (continued)
151
11. FINANCIAL RISK MANAGEMENT (continued)
Market Price Risk (continued)
NAV following a 5% Increase/Decrease in Benchmark Return
As at 30 September 2015
Change in Net Asset Value*
Fund Name Benchmark Currency 5% Increase 5% Decrease Global Equity Fund MSCI AC World Index USD 2,891,438 (2,891,438)
Asian Equity Fund8 MSCI AC Asia ex-Japan Index USD 366,775 (366,775)
European Equity Fund MSCI Europe Index USD 1,546,316 (1,546,316) Emerging Markets Equity Fund MSCI Emerging Markets Index USD 379,488 (379,488) Japanese Equity Fund MSCI Japan Index USD 1,265,016 (1,265,016) Preferred Securities Fund 50% BofA Merrill Lynch Fixed Rate
Preferred Securities Index 50% BofA Merrill Lynch US Capital Securities Index USD 68,256,801 (68,256,801)
U.S. Equity Fund S&P 500 Index USD 30,276,253 (30,276,253)
High Yield Fund7
BofA Merrill Lynch Global High Yield Blended Index USD 2,906,194 (2,906,194)
Global Property Securities Fund FTSE-EPRA-NAREIT Developed NTR Index USD 7,307,522 (7,307,522) Global Equity (ex-Japan) Fund MSCI Kokusai (World ex-Japan) Index USD 3,310,525 (3,310,525) Post Global Limited Term Barclays Capital US Government High Yield Fund 1-2 Year Index USD 63,271,361 (63,271,361) Global Time Diversified
Absolute Return Fund5 N/A USD N/A N/A
EDGE Small/Mid-Cap Equity Income Fund Russell 2500 Value Index USD 826,842 (826,842) Global Small Cap Equity Fund MSCI ACWI Small Cap Index USD 524,083 (524,083) Origin Global Emerging Markets Fund MSCI Emerging Markets Index USD 1,530,536 (1,530,536) Origin Global Equity Fund MSCI World Index USD 206,266 (206,266) Origin Global Smaller Companies Fund MSCI ACWI Small Cap Index USD 472,910 (472,910) Long/Short Global Opportunities
Equity Fund5 N/A USD N/A N/A
Claritas Latin American
Equity Fund6 N/A USD N/A N/A
Finisterre Emerging
Market Debt Fund5 N/A USD N/A N/A
Spectrum Global BofA Merrill Lynch Global
Capital Securities Fund1 Non-Sovereign Index USD 1,000,720 (1,000,720)
Global Short Duration Barclays Capital Mutual Fund (1-2)
High Yield Fund2 US Government Index USD 1,253,103 (1,253,103)
Global Capital Structure
Opportunities Fund3 3 Month US LIBOR USD 5,826,193 (5,826,193)
Global Credit Alpha Fund4 3 Month US LIBOR USD 24,328,596 (24,328,596)
*The changes in Net Asset Value have been calculated by applying a beta calculation based on performance for the period multiplied by a 5% increase/(decrease) in the index. The Manager considers this movement to be reasonable.
1Spectrum Global Capital Securities Fund launched on 30 October 2014. 2Global Short Duration High Yield Fund launched on 10 December 2014. 3Global Capital Structure Opportunities Fund launched on 11 December 2014. 4Global Credit Alpha Fund commenced operations under the PGIF umbrella on 23 June 2015. 5The Finisterre Emerging Market Debt Fund, Long/Short Global Opportunities Equity Fund and the Global Time Diversified Absolute Return Funds do not have applicable benchmark indices, and as a result there is no sensitivity analysis prepared for these Funds. 6For the Claritas Latin American Equity Fund there is currently no license for the benchmark index and as a result there is no sensitivity prepared for this Fund. 7High Yield Fund changed Benchmark from the BofA Merrill Lynch Global High Yield Index to the BofA Merrill Lynch Global High Yield Hedged Index on the 1 January 2015. 8Asian Equity Fund changed Benchmark from the MSCI Far East ex-Japan Index to the MSCI AC Asia ex-Japan index on the 31 March 2015.
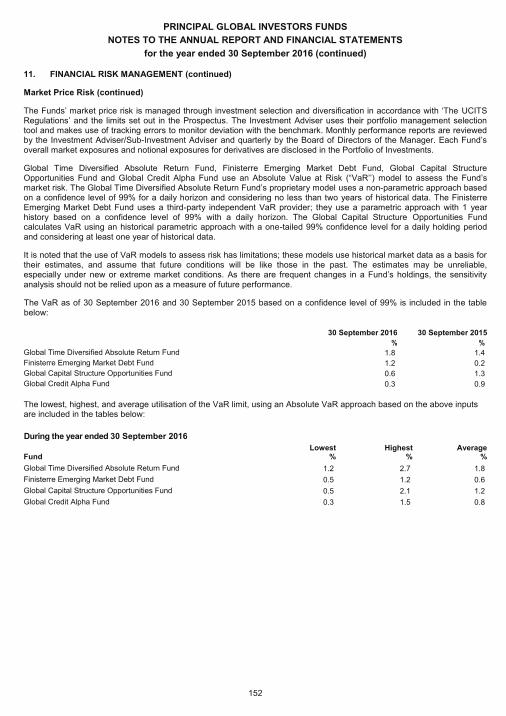
PRINCIPAL GLOBAL INVESTORS FUNDS
NOTES TO THE ANNUAL REPORT AND FINANCIAL STATEMENTS
for the year ended 30 September 2016 (continued)
152
11. FINANCIAL RISK MANAGEMENT (continued)
Market Price Risk (continued)
The Funds’ market price risk is managed through investment selection and diversification in accordance with ‘The UCITS Regulations’ and the limits set out in the Prospectus. The Investment Adviser uses their portfolio management selection tool and makes use of tracking errors to monitor deviation with the benchmark. Monthly performance reports are reviewed by the Investment Adviser/Sub-Investment Adviser and quarterly by the Board of Directors of the Manager. Each Fund’s overall market exposures and notional exposures for derivatives are disclosed in the Portfolio of Investments.
Global Time Diversified Absolute Return Fund, Finisterre Emerging Market Debt Fund, Global Capital Structure Opportunities Fund and Global Credit Alpha Fund use an Absolute Value at Risk (“VaR’’) model to assess the Fund’s market risk. The Global Time Diversified Absolute Return Fund’s proprietary model uses a non-parametric approach based on a confidence level of 99% for a daily horizon and considering no less than two years of historical data. The Finisterre Emerging Market Debt Fund uses a third-party independent VaR provider; they use a parametric approach with 1 year history based on a confidence level of 99% with a daily horizon. The Global Capital Structure Opportunities Fund calculates VaR using an historical parametric approach with a one-tailed 99% confidence level for a daily holding period and considering at least one year of historical data.
It is noted that the use of VaR models to assess risk has limitations; these models use historical market data as a basis for their estimates, and assume that future conditions will be like those in the past. The estimates may be unreliable, especially under new or extreme market conditions. As there are frequent changes in a Fund’s holdings, the sensitivity analysis should not be relied upon as a measure of future performance.
The VaR as of 30 September 2016 and 30 September 2015 based on a confidence level of 99% is included in the table below:
30 September 2016 30 September 2015 % %
Global Time Diversified Absolute Return Fund 1.8 1.4
Finisterre Emerging Market Debt Fund 1.2 0.2
Global Capital Structure Opportunities Fund 0.6 1.3
Global Credit Alpha Fund 0.3 0.9
The lowest, highest, and average utilisation of the VaR limit, using an Absolute VaR approach based on the above inputs are included in the tables below:
During the year ended 30 September 2016 Lowest Highest Average
Fund % % %
Global Time Diversified Absolute Return Fund 1.2 2.7 1.8
Finisterre Emerging Market Debt Fund 0.5 1.2 0.6
Global Capital Structure Opportunities Fund 0.5 2.1 1.2
Global Credit Alpha Fund 0.3 1.5 0.8
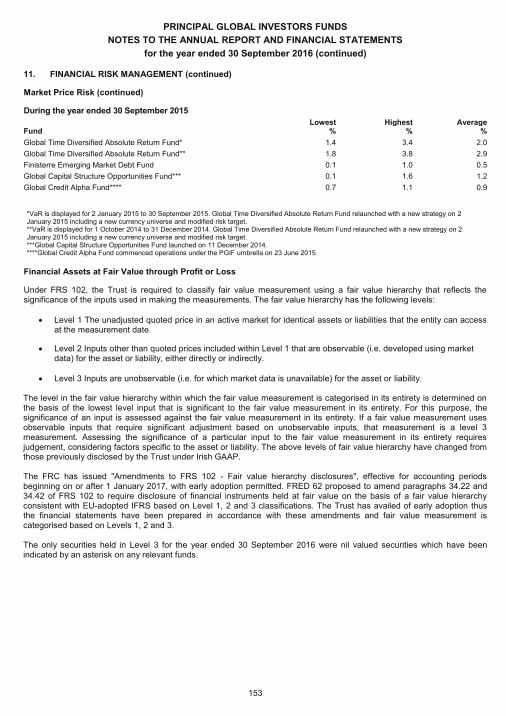
PRINCIPAL GLOBAL INVESTORS FUNDS
NOTES TO THE ANNUAL REPORT AND FINANCIAL STATEMENTS
for the year ended 30 September 2016 (continued)
153
11. FINANCIAL RISK MANAGEMENT (continued)
Market Price Risk (continued)
During the year ended 30 September 2015 Lowest Highest Average
Fund % % %
Global Time Diversified Absolute Return Fund* 1.4 3.4 2.0
Global Time Diversified Absolute Return Fund** 1.8 3.8 2.9
Finisterre Emerging Market Debt Fund 0.1 1.0 0.5
Global Capital Structure Opportunities Fund*** 0.1 1.6 1.2
Global Credit Alpha Fund**** 0.7 1.1 0.9
*VaR is displayed for 2 January 2015 to 30 September 2015. Global Time Diversified Absolute Return Fund relaunched with a new strategy on 2 January 2015 including a new currency universe and modified risk target. **VaR is displayed for 1 October 2014 to 31 December 2014. Global Time Diversified Absolute Return Fund relaunched with a new strategy on 2 January 2015 including a new currency universe and modified risk target. ***Global Capital Structure Opportunities Fund launched on 11 December 2014. ****Global Credit Alpha Fund commenced operations under the PGIF umbrella on 23 June 2015.
Financial Assets at Fair Value through Profit or Loss
Under FRS 102, the Trust is required to classify fair value measurement using a fair value hierarchy that reflects the significance of the inputs used in making the measurements. The fair value hierarchy has the following levels:
· Level 1 The unadjusted quoted price in an active market for identical assets or liabilities that the entity can access at the measurement date.
· Level 2 Inputs other than quoted prices included within Level 1 that are observable (i.e. developed using market data) for the asset or liability, either directly or indirectly.
· Level 3 Inputs are unobservable (i.e. for which market data is unavailable) for the asset or liability.
The level in the fair value hierarchy within which the fair value measurement is categorised in its entirety is determined on the basis of the lowest level input that is significant to the fair value measurement in its entirety. For this purpose, the significance of an input is assessed against the fair value measurement in its entirety. If a fair value measurement uses observable inputs that require significant adjustment based on unobservable inputs, that measurement is a level 3 measurement. Assessing the significance of a particular input to the fair value measurement in its entirety requires judgement, considering factors specific to the asset or liability. The above levels of fair value hierarchy have changed from those previously disclosed by the Trust under Irish GAAP. The FRC has issued "Amendments to FRS 102 - Fair value hierarchy disclosures", effective for accounting periods beginning on or after 1 January 2017, with early adoption permitted. FRED 62 proposed to amend paragraphs 34.22 and 34.42 of FRS 102 to require disclosure of financial instruments held at fair value on the basis of a fair value hierarchy consistent with EU-adopted IFRS based on Level 1, 2 and 3 classifications. The Trust has availed of early adoption thus the financial statements have been prepared in accordance with these amendments and fair value measurement is categorised based on Levels 1, 2 and 3. The only securities held in Level 3 for the year ended 30 September 2016 were nil valued securities which have been indicated by an asterisk on any relevant funds.
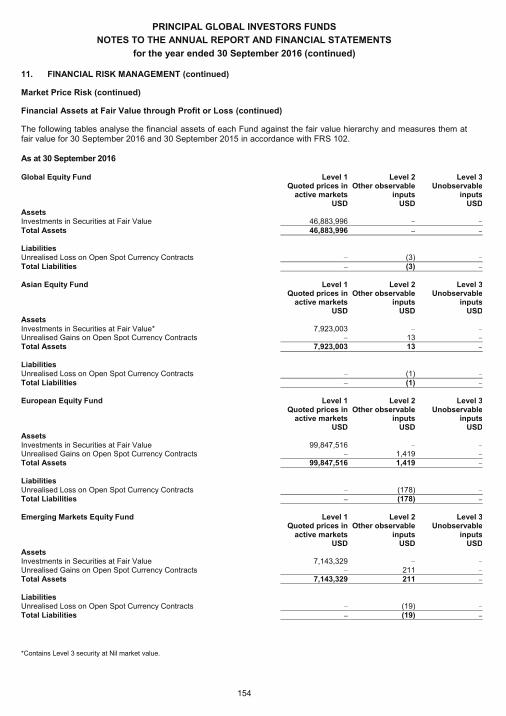
PRINCIPAL GLOBAL INVESTORS FUNDS
NOTES TO THE ANNUAL REPORT AND FINANCIAL STATEMENTS
for the year ended 30 September 2016 (continued)
154
11. FINANCIAL RISK MANAGEMENT (continued)
Market Price Risk (continued)
Financial Assets at Fair Value through Profit or Loss (continued)
The following tables analyse the financial assets of each Fund against the fair value hierarchy and measures them at fair value for 30 September 2016 and 30 September 2015 in accordance with FRS 102.
As at 30 September 2016
Global Equity Fund Level 1 Level 2 Level 3 Quoted prices in Other observable Unobservable active markets inputs inputs USD USD USD Assets Investments in Securities at Fair Value 46,883,996 – – Total Assets 46,883,996 – – Liabilities Unrealised Loss on Open Spot Currency Contracts – (3) – Total Liabilities – (3) – Asian Equity Fund Level 1 Level 2 Level 3 Quoted prices in Other observable Unobservable active markets inputs inputs USD USD USD Assets Investments in Securities at Fair Value* 7,923,003 – – Unrealised Gains on Open Spot Currency Contracts – 13 – Total Assets 7,923,003 13 – Liabilities Unrealised Loss on Open Spot Currency Contracts – (1) – Total Liabilities – (1) – European Equity Fund Level 1 Level 2 Level 3 Quoted prices in Other observable Unobservable active markets inputs inputs USD USD USD Assets Investments in Securities at Fair Value 99,847,516 – – Unrealised Gains on Open Spot Currency Contracts – 1,419 – Total Assets 99,847,516 1,419 – Liabilities Unrealised Loss on Open Spot Currency Contracts – (178) – Total Liabilities – (178) – Emerging Markets Equity Fund Level 1 Level 2 Level 3 Quoted prices in Other observable Unobservable active markets inputs inputs USD USD USD Assets Investments in Securities at Fair Value 7,143,329 – – Unrealised Gains on Open Spot Currency Contracts – 211 – Total Assets 7,143,329 211 – Liabilities Unrealised Loss on Open Spot Currency Contracts – (19) – Total Liabilities – (19) –
*Contains Level 3 security at Nil market value.
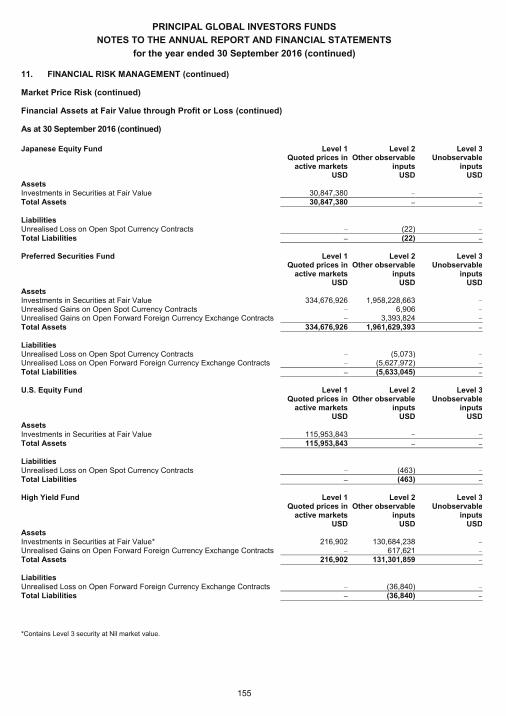
PRINCIPAL GLOBAL INVESTORS FUNDS
NOTES TO THE ANNUAL REPORT AND FINANCIAL STATEMENTS
for the year ended 30 September 2016 (continued)
155
11. FINANCIAL RISK MANAGEMENT (continued)
Market Price Risk (continued)
Financial Assets at Fair Value through Profit or Loss (continued)
As at 30 September 2016 (continued)
Japanese Equity Fund Level 1 Level 2 Level 3 Quoted prices in Other observable Unobservable active markets inputs inputs USD USD USD Assets Investments in Securities at Fair Value 30,847,380 – – Total Assets 30,847,380 – – Liabilities Unrealised Loss on Open Spot Currency Contracts – (22) – Total Liabilities – (22) – Preferred Securities Fund Level 1 Level 2 Level 3 Quoted prices in Other observable Unobservable active markets inputs inputs USD USD USD Assets Investments in Securities at Fair Value 334,676,926 1,958,228,663 – Unrealised Gains on Open Spot Currency Contracts – 6,906 – Unrealised Gains on Open Forward Foreign Currency Exchange Contracts – 3,393,824 – Total Assets 334,676,926 1,961,629,393 – Liabilities Unrealised Loss on Open Spot Currency Contracts – (5,073) – Unrealised Loss on Open Forward Foreign Currency Exchange Contracts – (5,627,972) – Total Liabilities – (5,633,045) – U.S. Equity Fund Level 1 Level 2 Level 3 Quoted prices in Other observable Unobservable active markets inputs inputs USD USD USD Assets Investments in Securities at Fair Value 115,953,843 – – Total Assets 115,953,843 – – Liabilities Unrealised Loss on Open Spot Currency Contracts – (463) – Total Liabilities – (463) – High Yield Fund Level 1 Level 2 Level 3 Quoted prices in Other observable Unobservable active markets inputs inputs USD USD USD Assets Investments in Securities at Fair Value* 216,902 130,684,238 – Unrealised Gains on Open Forward Foreign Currency Exchange Contracts – 617,621 – Total Assets 216,902 131,301,859 – Liabilities Unrealised Loss on Open Forward Foreign Currency Exchange Contracts – (36,840) – Total Liabilities – (36,840) –
*Contains Level 3 security at Nil market value.
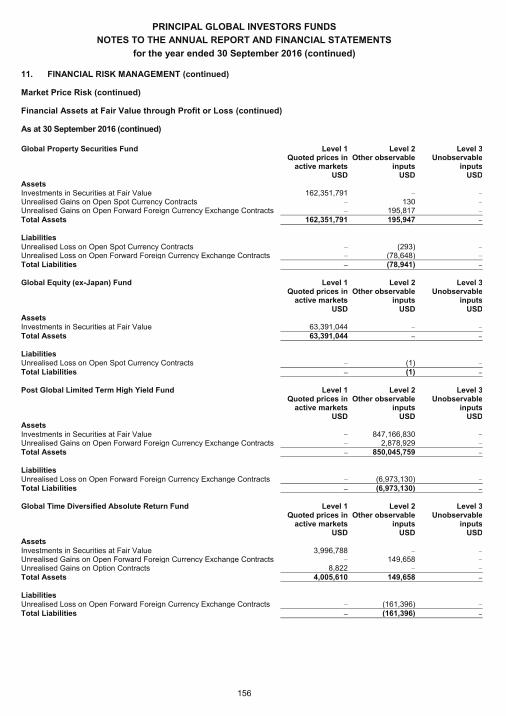
PRINCIPAL GLOBAL INVESTORS FUNDS
NOTES TO THE ANNUAL REPORT AND FINANCIAL STATEMENTS
for the year ended 30 September 2016 (continued)
156
11. FINANCIAL RISK MANAGEMENT (continued)
Market Price Risk (continued)
Financial Assets at Fair Value through Profit or Loss (continued)
As at 30 September 2016 (continued)
Global Property Securities Fund Level 1 Level 2 Level 3 Quoted prices in Other observable Unobservable active markets inputs inputs USD USD USD Assets Investments in Securities at Fair Value 162,351,791 – – Unrealised Gains on Open Spot Currency Contracts – 130 – Unrealised Gains on Open Forward Foreign Currency Exchange Contracts – 195,817 – Total Assets 162,351,791 195,947 – Liabilities Unrealised Loss on Open Spot Currency Contracts – (293) – Unrealised Loss on Open Forward Foreign Currency Exchange Contracts – (78,648) – Total Liabilities – (78,941) – Global Equity (ex-Japan) Fund Level 1 Level 2 Level 3 Quoted prices in Other observable Unobservable active markets inputs inputs USD USD USD Assets Investments in Securities at Fair Value 63,391,044 – – Total Assets 63,391,044 – – Liabilities Unrealised Loss on Open Spot Currency Contracts – (1) – Total Liabilities – (1) – Post Global Limited Term High Yield Fund Level 1 Level 2 Level 3 Quoted prices in Other observable Unobservable active markets inputs inputs USD USD USD Assets Investments in Securities at Fair Value – 847,166,830 – Unrealised Gains on Open Forward Foreign Currency Exchange Contracts – 2,878,929 – Total Assets – 850,045,759 – Liabilities Unrealised Loss on Open Forward Foreign Currency Exchange Contracts – (6,973,130) – Total Liabilities – (6,973,130) – Global Time Diversified Absolute Return Fund Level 1 Level 2 Level 3 Quoted prices in Other observable Unobservable active markets inputs inputs USD USD USD Assets Investments in Securities at Fair Value 3,996,788 – – Unrealised Gains on Open Forward Foreign Currency Exchange Contracts – 149,658 – Unrealised Gains on Option Contracts 8,822 – – Total Assets 4,005,610 149,658 – Liabilities Unrealised Loss on Open Forward Foreign Currency Exchange Contracts – (161,396) – Total Liabilities – (161,396) –

PRINCIPAL GLOBAL INVESTORS FUNDS
NOTES TO THE ANNUAL REPORT AND FINANCIAL STATEMENTS
for the year ended 30 September 2016 (continued)
157
11. FINANCIAL RISK MANAGEMENT (continued)
Market Price Risk (continued)
Financial Assets at Fair Value through Profit or Loss (continued)
As at 30 September 2016 (continued)
Global Small Cap Equity Fund Level 1 Level 2 Level 3 Quoted prices in Other observable Unobservable active markets inputs inputs USD USD USD Assets Investments in Securities at Fair Value 17,498,134 – – Unrealised Gains on Open Spot Currency Contracts – 425 – Total Assets 17,498,134 425 – Liabilities Unrealised Loss on Open Spot Currency Contracts – (1) – Total Liabilities – (1) – Origin Global Emerging Markets Fund Level 1 Level 2 Level 3 Quoted prices in Other observable Unobservable active markets inputs inputs USD USD USD Assets Investments in Securities at Fair Value 95,026,728 – – Total Assets 95,026,728 – – Liabilities Unrealised Loss on Open Spot Currency Contracts – (3) – Total Liabilities – (3) – Origin Global Equity Fund Level 1 Level 2 Level 3 Quoted prices in Other observable Unobservable active markets inputs inputs USD USD USD Assets Investments in Securities at Fair Value 15,719,084 – – Total Assets 15,719,084 – – Origin Global Smaller Companies Fund Level 1 Level 2 Level 3 Quoted prices in Other observable Unobservable active markets inputs inputs USD USD USD Assets Investments in Securities at Fair Value* 56,355,700 – – Unrealised Gains on Open Spot Currency Contracts – 6 – Total Assets 56,355,700 6 – Liabilities Unrealised Loss on Open Spot Currency Contracts – (968) – Total Liabilities – (968) –
*Contains Level 3 security at Nil market value.
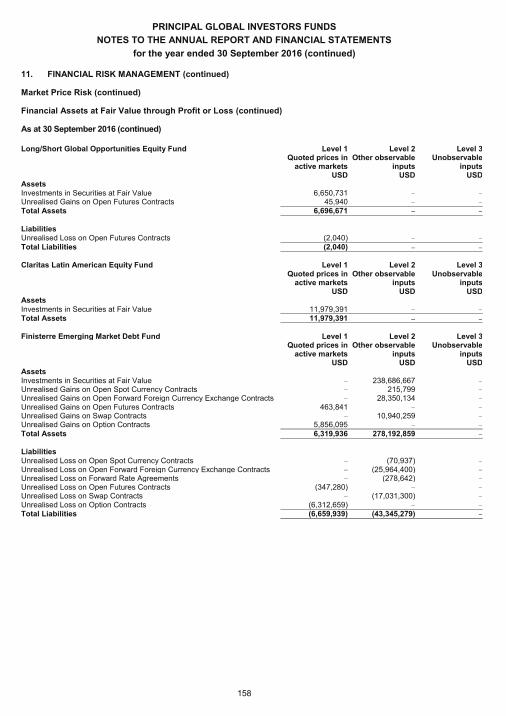
PRINCIPAL GLOBAL INVESTORS FUNDS
NOTES TO THE ANNUAL REPORT AND FINANCIAL STATEMENTS
for the year ended 30 September 2016 (continued)
158
11. FINANCIAL RISK MANAGEMENT (continued)
Market Price Risk (continued)
Financial Assets at Fair Value through Profit or Loss (continued)
As at 30 September 2016 (continued)
Long/Short Global Opportunities Equity Fund Level 1 Level 2 Level 3 Quoted prices in Other observable Unobservable active markets inputs inputs USD USD USD Assets Investments in Securities at Fair Value 6,650,731 – – Unrealised Gains on Open Futures Contracts 45,940 – – Total Assets 6,696,671 – – Liabilities Unrealised Loss on Open Futures Contracts (2,040) – – Total Liabilities (2,040) – – Claritas Latin American Equity Fund Level 1 Level 2 Level 3 Quoted prices in Other observable Unobservable active markets inputs inputs USD USD USD Assets Investments in Securities at Fair Value 11,979,391 – – Total Assets 11,979,391 – – Finisterre Emerging Market Debt Fund Level 1 Level 2 Level 3 Quoted prices in Other observable Unobservable active markets inputs inputs USD USD USD Assets Investments in Securities at Fair Value – 238,686,667 – Unrealised Gains on Open Spot Currency Contracts – 215,799 – Unrealised Gains on Open Forward Foreign Currency Exchange Contracts – 28,350,134 – Unrealised Gains on Open Futures Contracts 463,841 – – Unrealised Gains on Swap Contracts – 10,940,259 – Unrealised Gains on Option Contracts 5,856,095 – – Total Assets 6,319,936 278,192,859 – Liabilities Unrealised Loss on Open Spot Currency Contracts – (70,937) – Unrealised Loss on Open Forward Foreign Currency Exchange Contracts – (25,964,400) – Unrealised Loss on Forward Rate Agreements – (278,642) – Unrealised Loss on Open Futures Contracts (347,280) – – Unrealised Loss on Swap Contracts – (17,031,300) – Unrealised Loss on Option Contracts (6,312,659) – – Total Liabilities (6,659,939) (43,345,279) –
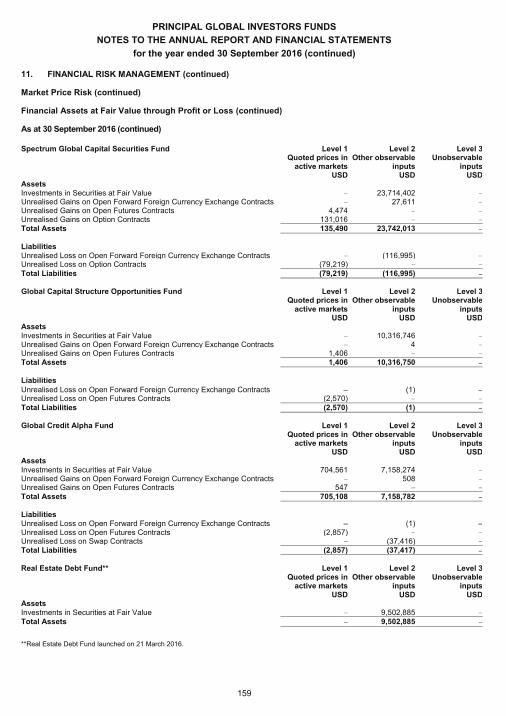
PRINCIPAL GLOBAL INVESTORS FUNDS
NOTES TO THE ANNUAL REPORT AND FINANCIAL STATEMENTS
for the year ended 30 September 2016 (continued)
159
11. FINANCIAL RISK MANAGEMENT (continued)
Market Price Risk (continued)
Financial Assets at Fair Value through Profit or Loss (continued)
As at 30 September 2016 (continued)
Spectrum Global Capital Securities Fund Level 1 Level 2 Level 3 Quoted prices in Other observable Unobservable active markets inputs inputs USD USD USD Assets Investments in Securities at Fair Value – 23,714,402 – Unrealised Gains on Open Forward Foreign Currency Exchange Contracts – 27,611 – Unrealised Gains on Open Futures Contracts 4,474 – – Unrealised Gains on Option Contracts 131,016 – – Total Assets 135,490 23,742,013 – Liabilities Unrealised Loss on Open Forward Foreign Currency Exchange Contracts – (116,995) – Unrealised Loss on Option Contracts (79,219) – – Total Liabilities (79,219) (116,995) – Global Capital Structure Opportunities Fund Level 1 Level 2 Level 3 Quoted prices in Other observable Unobservable active markets inputs inputs USD USD USD Assets Investments in Securities at Fair Value – 10,316,746 – Unrealised Gains on Open Forward Foreign Currency Exchange Contracts – 4 – Unrealised Gains on Open Futures Contracts 1,406 – – Total Assets 1,406 10,316,750 – Liabilities Unrealised Loss on Open Forward Foreign Currency Exchange Contracts – (1) – Unrealised Loss on Open Futures Contracts (2,570) – – Total Liabilities (2,570) (1) – Global Credit Alpha Fund Level 1 Level 2 Level 3 Quoted prices in Other observable Unobservable active markets inputs inputs USD USD USD Assets Investments in Securities at Fair Value 704,561 7,158,274 – Unrealised Gains on Open Forward Foreign Currency Exchange Contracts – 508 – Unrealised Gains on Open Futures Contracts 547 – – Total Assets 705,108 7,158,782 – Liabilities Unrealised Loss on Open Forward Foreign Currency Exchange Contracts – (1) – Unrealised Loss on Open Futures Contracts (2,857) – – Unrealised Loss on Swap Contracts – (37,416) – Total Liabilities (2,857) (37,417) – Real Estate Debt Fund** Level 1 Level 2 Level 3 Quoted prices in Other observable Unobservable active markets inputs inputs USD USD USD Assets Investments in Securities at Fair Value – 9,502,885 – Total Assets – 9,502,885 –
**Real Estate Debt Fund launched on 21 March 2016.
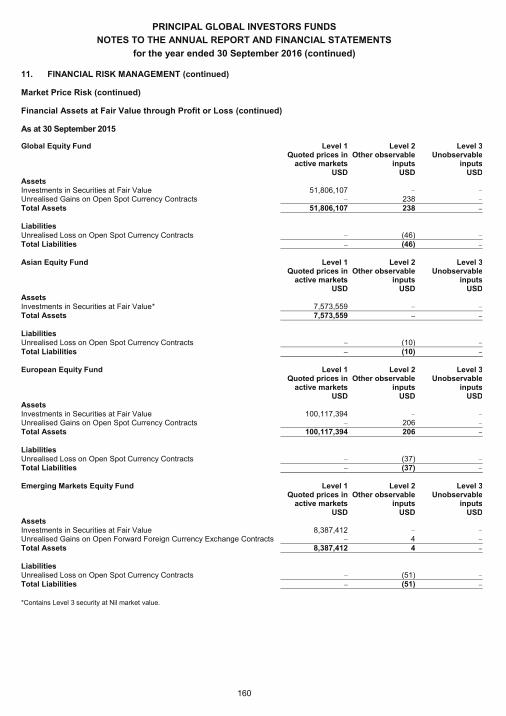
PRINCIPAL GLOBAL INVESTORS FUNDS
NOTES TO THE ANNUAL REPORT AND FINANCIAL STATEMENTS
for the year ended 30 September 2016 (continued)
160
11. FINANCIAL RISK MANAGEMENT (continued)
Market Price Risk (continued)
Financial Assets at Fair Value through Profit or Loss (continued)
As at 30 September 2015
Global Equity Fund Level 1 Level 2 Level 3 Quoted prices in Other observable Unobservable active markets inputs inputs USD USD USD Assets Investments in Securities at Fair Value 51,806,107 – – Unrealised Gains on Open Spot Currency Contracts – 238 – Total Assets 51,806,107 238 – Liabilities Unrealised Loss on Open Spot Currency Contracts – (46) – Total Liabilities – (46) – Asian Equity Fund Level 1 Level 2 Level 3 Quoted prices in Other observable Unobservable active markets inputs inputs USD USD USD Assets Investments in Securities at Fair Value* 7,573,559 – – Total Assets 7,573,559 – – Liabilities Unrealised Loss on Open Spot Currency Contracts – (10) – Total Liabilities – (10) – European Equity Fund Level 1 Level 2 Level 3 Quoted prices in Other observable Unobservable active markets inputs inputs USD USD USD Assets Investments in Securities at Fair Value 100,117,394 – – Unrealised Gains on Open Spot Currency Contracts – 206 – Total Assets 100,117,394 206 – Liabilities Unrealised Loss on Open Spot Currency Contracts – (37) – Total Liabilities – (37) – Emerging Markets Equity Fund Level 1 Level 2 Level 3 Quoted prices in Other observable Unobservable active markets inputs inputs USD USD USD Assets Investments in Securities at Fair Value 8,387,412 – – Unrealised Gains on Open Forward Foreign Currency Exchange Contracts – 4 – Total Assets 8,387,412 4 – Liabilities Unrealised Loss on Open Spot Currency Contracts – (51) – Total Liabilities – (51) –
*Contains Level 3 security at Nil market value.
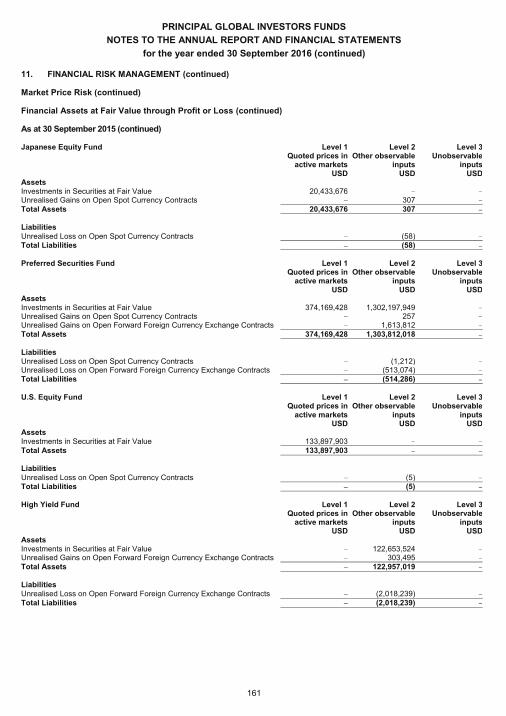
PRINCIPAL GLOBAL INVESTORS FUNDS
NOTES TO THE ANNUAL REPORT AND FINANCIAL STATEMENTS
for the year ended 30 September 2016 (continued)
161
11. FINANCIAL RISK MANAGEMENT (continued)
Market Price Risk (continued)
Financial Assets at Fair Value through Profit or Loss (continued)
As at 30 September 2015 (continued)
Japanese Equity Fund Level 1 Level 2 Level 3 Quoted prices in Other observable Unobservable active markets inputs inputs USD USD USD Assets Investments in Securities at Fair Value 20,433,676 – – Unrealised Gains on Open Spot Currency Contracts – 307 – Total Assets 20,433,676 307 – Liabilities Unrealised Loss on Open Spot Currency Contracts – (58) – Total Liabilities – (58) – Preferred Securities Fund Level 1 Level 2 Level 3 Quoted prices in Other observable Unobservable active markets inputs inputs USD USD USD Assets Investments in Securities at Fair Value 374,169,428 1,302,197,949 – Unrealised Gains on Open Spot Currency Contracts – 257 – Unrealised Gains on Open Forward Foreign Currency Exchange Contracts – 1,613,812 – Total Assets 374,169,428 1,303,812,018 – Liabilities Unrealised Loss on Open Spot Currency Contracts – (1,212) – Unrealised Loss on Open Forward Foreign Currency Exchange Contracts – (513,074) – Total Liabilities – (514,286) – U.S. Equity Fund Level 1 Level 2 Level 3 Quoted prices in Other observable Unobservable active markets inputs inputs USD USD USD Assets Investments in Securities at Fair Value 133,897,903 – – Total Assets 133,897,903 – – Liabilities Unrealised Loss on Open Spot Currency Contracts – (5) – Total Liabilities – (5) – High Yield Fund Level 1 Level 2 Level 3 Quoted prices in Other observable Unobservable active markets inputs inputs USD USD USD Assets Investments in Securities at Fair Value – 122,653,524 – Unrealised Gains on Open Forward Foreign Currency Exchange Contracts – 303,495 – Total Assets – 122,957,019 – Liabilities Unrealised Loss on Open Forward Foreign Currency Exchange Contracts – (2,018,239) – Total Liabilities – (2,018,239) –
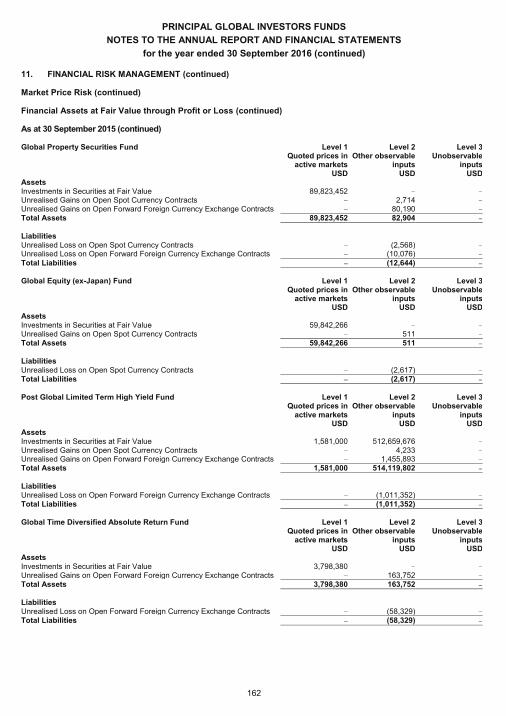
PRINCIPAL GLOBAL INVESTORS FUNDS
NOTES TO THE ANNUAL REPORT AND FINANCIAL STATEMENTS
for the year ended 30 September 2016 (continued)
162
11. FINANCIAL RISK MANAGEMENT (continued)
Market Price Risk (continued)
Financial Assets at Fair Value through Profit or Loss (continued)
As at 30 September 2015 (continued)
Global Property Securities Fund Level 1 Level 2 Level 3 Quoted prices in Other observable Unobservable active markets inputs inputs USD USD USD Assets Investments in Securities at Fair Value 89,823,452 – – Unrealised Gains on Open Spot Currency Contracts – 2,714 – Unrealised Gains on Open Forward Foreign Currency Exchange Contracts – 80,190 – Total Assets 89,823,452 82,904 – Liabilities Unrealised Loss on Open Spot Currency Contracts – (2,568) – Unrealised Loss on Open Forward Foreign Currency Exchange Contracts – (10,076) – Total Liabilities – (12,644) – Global Equity (ex-Japan) Fund Level 1 Level 2 Level 3 Quoted prices in Other observable Unobservable active markets inputs inputs USD USD USD Assets Investments in Securities at Fair Value 59,842,266 – – Unrealised Gains on Open Spot Currency Contracts – 511 – Total Assets 59,842,266 511 – Liabilities Unrealised Loss on Open Spot Currency Contracts – (2,617) – Total Liabilities – (2,617) – Post Global Limited Term High Yield Fund Level 1 Level 2 Level 3 Quoted prices in Other observable Unobservable active markets inputs inputs USD USD USD Assets Investments in Securities at Fair Value 1,581,000 512,659,676 – Unrealised Gains on Open Spot Currency Contracts – 4,233 – Unrealised Gains on Open Forward Foreign Currency Exchange Contracts – 1,455,893 – Total Assets 1,581,000 514,119,802 – Liabilities Unrealised Loss on Open Forward Foreign Currency Exchange Contracts – (1,011,352) – Total Liabilities – (1,011,352) – Global Time Diversified Absolute Return Fund Level 1 Level 2 Level 3 Quoted prices in Other observable Unobservable active markets inputs inputs USD USD USD Assets Investments in Securities at Fair Value 3,798,380 – – Unrealised Gains on Open Forward Foreign Currency Exchange Contracts – 163,752 – Total Assets 3,798,380 163,752 – Liabilities Unrealised Loss on Open Forward Foreign Currency Exchange Contracts – (58,329) – Total Liabilities – (58,329) –
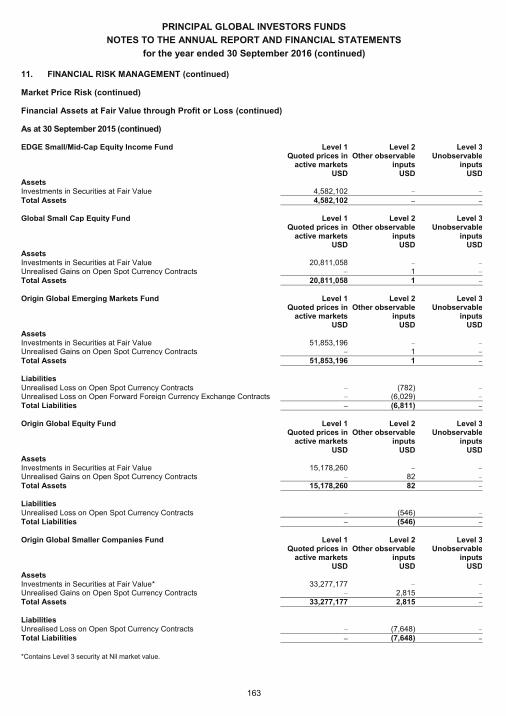
PRINCIPAL GLOBAL INVESTORS FUNDS
NOTES TO THE ANNUAL REPORT AND FINANCIAL STATEMENTS
for the year ended 30 September 2016 (continued)
163
11. FINANCIAL RISK MANAGEMENT (continued)
Market Price Risk (continued)
Financial Assets at Fair Value through Profit or Loss (continued)
As at 30 September 2015 (continued)
EDGE Small/Mid-Cap Equity Income Fund Level 1 Level 2 Level 3 Quoted prices in Other observable Unobservable active markets inputs inputs USD USD USD Assets Investments in Securities at Fair Value 4,582,102 – – Total Assets 4,582,102 – – Global Small Cap Equity Fund Level 1 Level 2 Level 3 Quoted prices in Other observable Unobservable active markets inputs inputs USD USD USD Assets Investments in Securities at Fair Value 20,811,058 – – Unrealised Gains on Open Spot Currency Contracts – 1 – Total Assets 20,811,058 1 – Origin Global Emerging Markets Fund Level 1 Level 2 Level 3 Quoted prices in Other observable Unobservable active markets inputs inputs USD USD USD Assets Investments in Securities at Fair Value 51,853,196 – – Unrealised Gains on Open Spot Currency Contracts – 1 – Total Assets 51,853,196 1 – Liabilities Unrealised Loss on Open Spot Currency Contracts – (782) – Unrealised Loss on Open Forward Foreign Currency Exchange Contracts – (6,029) – Total Liabilities – (6,811) – Origin Global Equity Fund Level 1 Level 2 Level 3 Quoted prices in Other observable Unobservable active markets inputs inputs USD USD USD Assets Investments in Securities at Fair Value 15,178,260 – – Unrealised Gains on Open Spot Currency Contracts – 82 – Total Assets 15,178,260 82 – Liabilities Unrealised Loss on Open Spot Currency Contracts – (546) – Total Liabilities – (546) – Origin Global Smaller Companies Fund Level 1 Level 2 Level 3 Quoted prices in Other observable Unobservable active markets inputs inputs USD USD USD Assets Investments in Securities at Fair Value* 33,277,177 – – Unrealised Gains on Open Spot Currency Contracts – 2,815 – Total Assets 33,277,177 2,815 – Liabilities Unrealised Loss on Open Spot Currency Contracts – (7,648) – Total Liabilities – (7,648) –
*Contains Level 3 security at Nil market value.
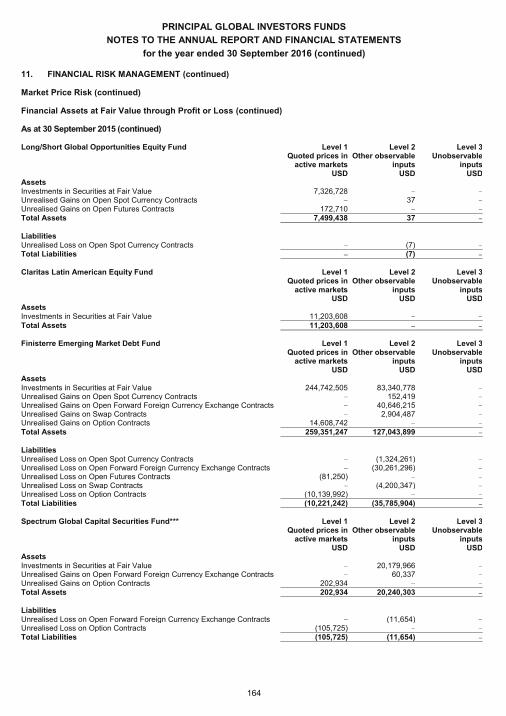
PRINCIPAL GLOBAL INVESTORS FUNDS
NOTES TO THE ANNUAL REPORT AND FINANCIAL STATEMENTS
for the year ended 30 September 2016 (continued)
164
11. FINANCIAL RISK MANAGEMENT (continued)
Market Price Risk (continued)
Financial Assets at Fair Value through Profit or Loss (continued)
As at 30 September 2015 (continued)
Long/Short Global Opportunities Equity Fund Level 1 Level 2 Level 3 Quoted prices in Other observable Unobservable active markets inputs inputs USD USD USD Assets Investments in Securities at Fair Value 7,326,728 – – Unrealised Gains on Open Spot Currency Contracts – 37 – Unrealised Gains on Open Futures Contracts 172,710 – – Total Assets 7,499,438 37 – Liabilities Unrealised Loss on Open Spot Currency Contracts – (7) – Total Liabilities – (7) – Claritas Latin American Equity Fund Level 1 Level 2 Level 3 Quoted prices in Other observable Unobservable active markets inputs inputs USD USD USD Assets Investments in Securities at Fair Value 11,203,608 – – Total Assets 11,203,608 – – Finisterre Emerging Market Debt Fund Level 1 Level 2 Level 3 Quoted prices in Other observable Unobservable active markets inputs inputs USD USD USD Assets Investments in Securities at Fair Value 244,742,505 83,340,778 – Unrealised Gains on Open Spot Currency Contracts – 152,419 – Unrealised Gains on Open Forward Foreign Currency Exchange Contracts – 40,646,215 – Unrealised Gains on Swap Contracts – 2,904,487 – Unrealised Gains on Option Contracts 14,608,742 – – Total Assets 259,351,247 127,043,899 – Liabilities Unrealised Loss on Open Spot Currency Contracts – (1,324,261) – Unrealised Loss on Open Forward Foreign Currency Exchange Contracts – (30,261,296) – Unrealised Loss on Open Futures Contracts (81,250) – – Unrealised Loss on Swap Contracts – (4,200,347) – Unrealised Loss on Option Contracts (10,139,992) – – Total Liabilities (10,221,242) (35,785,904) – Spectrum Global Capital Securities Fund*** Level 1 Level 2 Level 3 Quoted prices in Other observable Unobservable active markets inputs inputs USD USD USD Assets Investments in Securities at Fair Value – 20,179,966 – Unrealised Gains on Open Forward Foreign Currency Exchange Contracts – 60,337 – Unrealised Gains on Option Contracts 202,934 – – Total Assets 202,934 20,240,303 – Liabilities Unrealised Loss on Open Forward Foreign Currency Exchange Contracts – (11,654) – Unrealised Loss on Option Contracts (105,725) – – Total Liabilities (105,725) (11,654) –
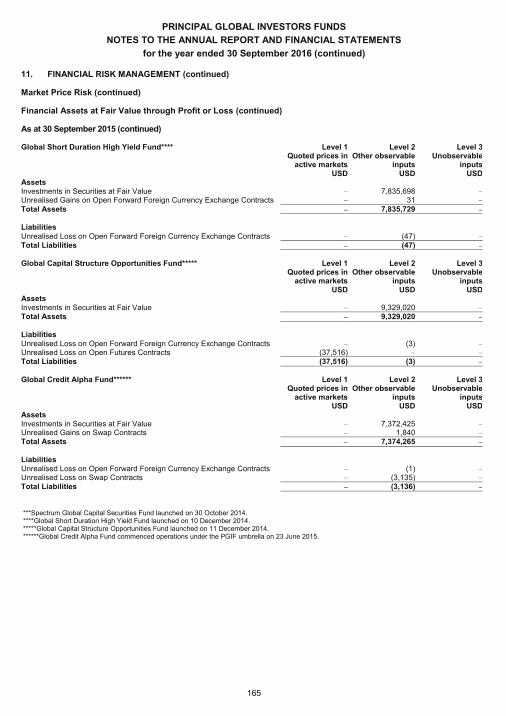
PRINCIPAL GLOBAL INVESTORS FUNDS
NOTES TO THE ANNUAL REPORT AND FINANCIAL STATEMENTS
for the year ended 30 September 2016 (continued)
165
11. FINANCIAL RISK MANAGEMENT (continued)
Market Price Risk (continued)
Financial Assets at Fair Value through Profit or Loss (continued)
As at 30 September 2015 (continued)
Global Short Duration High Yield Fund**** Level 1 Level 2 Level 3 Quoted prices in Other observable Unobservable active markets inputs inputs USD USD USD Assets Investments in Securities at Fair Value – 7,835,698 – Unrealised Gains on Open Forward Foreign Currency Exchange Contracts – 31 – Total Assets – 7,835,729 – Liabilities Unrealised Loss on Open Forward Foreign Currency Exchange Contracts – (47) – Total Liabilities – (47) – Global Capital Structure Opportunities Fund***** Level 1 Level 2 Level 3 Quoted prices in Other observable Unobservable active markets inputs inputs USD USD USD Assets Investments in Securities at Fair Value – 9,329,020 – Total Assets – 9,329,020 – Liabilities Unrealised Loss on Open Forward Foreign Currency Exchange Contracts – (3) – Unrealised Loss on Open Futures Contracts (37,516) – – Total Liabilities (37,516) (3) – Global Credit Alpha Fund****** Level 1 Level 2 Level 3 Quoted prices in Other observable Unobservable active markets inputs inputs USD USD USD Assets Investments in Securities at Fair Value – 7,372,425 – Unrealised Gains on Swap Contracts – 1,840 – Total Assets – 7,374,265 – Liabilities Unrealised Loss on Open Forward Foreign Currency Exchange Contracts – (1) – Unrealised Loss on Swap Contracts – (3,135) – Total Liabilities – (3,136) –
***Spectrum Global Capital Securities Fund launched on 30 October 2014. ****Global Short Duration High Yield Fund launched on 10 December 2014. *****Global Capital Structure Opportunities Fund launched on 11 December 2014. ******Global Credit Alpha Fund commenced operations under the PGIF umbrella on 23 June 2015.
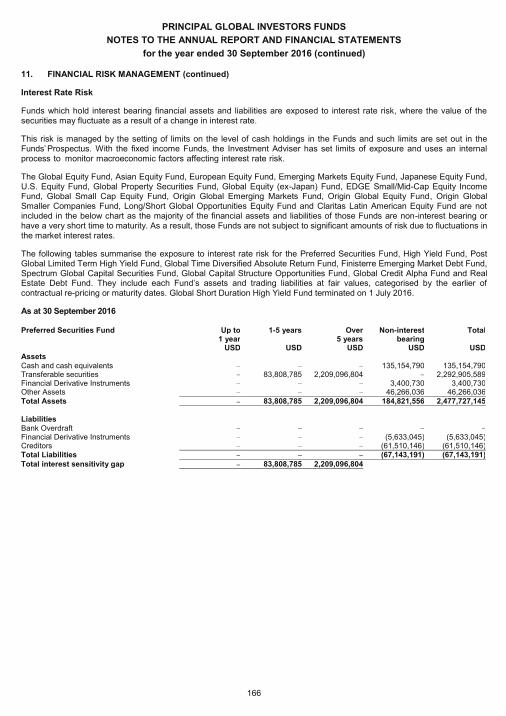
PRINCIPAL GLOBAL INVESTORS FUNDS
NOTES TO THE ANNUAL REPORT AND FINANCIAL STATEMENTS
for the year ended 30 September 2016 (continued)
166
11. FINANCIAL RISK MANAGEMENT (continued)
Interest Rate Risk
Funds which hold interest bearing financial assets and liabilities are exposed to interest rate risk, where the value of the securities may fluctuate as a result of a change in interest rate.
This risk is managed by the setting of limits on the level of cash holdings in the Funds and such limits are set out in the Funds’ Prospectus. With the fixed income Funds, the Investment Adviser has set limits of exposure and uses an internal process to monitor macroeconomic factors affecting interest rate risk.
The Global Equity Fund, Asian Equity Fund, European Equity Fund, Emerging Markets Equity Fund, Japanese Equity Fund, U.S. Equity Fund, Global Property Securities Fund, Global Equity (ex-Japan) Fund, EDGE Small/Mid-Cap Equity Income Fund, Global Small Cap Equity Fund, Origin Global Emerging Markets Fund, Origin Global Equity Fund, Origin Global Smaller Companies Fund, Long/Short Global Opportunities Equity Fund and Claritas Latin American Equity Fund are not included in the below chart as the majority of the financial assets and liabilities of those Funds are non-interest bearing or have a very short time to maturity. As a result, those Funds are not subject to significant amounts of risk due to fluctuations in the market interest rates.
The following tables summarise the exposure to interest rate risk for the Preferred Securities Fund, High Yield Fund, Post Global Limited Term High Yield Fund, Global Time Diversified Absolute Return Fund, Finisterre Emerging Market Debt Fund, Spectrum Global Capital Securities Fund, Global Capital Structure Opportunities Fund, Global Credit Alpha Fund and Real Estate Debt Fund. They include each Fund’s assets and trading liabilities at fair values, categorised by the earlier of contractual re-pricing or maturity dates. Global Short Duration High Yield Fund terminated on 1 July 2016.
As at 30 September 2016
Preferred Securities Fund Up to 1-5 years Over Non-interest Total 1 year 5 years bearing USD USD USD USD USD Assets Cash and cash equivalents – – – 135,154,790 135,154,790 Transferable securities – 83,808,785 2,209,096,804 – 2,292,905,589 Financial Derivative Instruments – – – 3,400,730 3,400,730 Other Assets – – – 46,266,036 46,266,036 Total Assets – 83,808,785 2,209,096,804 184,821,556 2,477,727,145 Liabilities Bank Overdraft – – – – – Financial Derivative Instruments – – – (5,633,045) (5,633,045) Creditors – – – (61,510,146) (61,510,146) Total Liabilities – – – (67,143,191) (67,143,191) Total interest sensitivity gap – 83,808,785 2,209,096,804

PRINCIPAL GLOBAL INVESTORS FUNDS
NOTES TO THE ANNUAL REPORT AND FINANCIAL STATEMENTS
for the year ended 30 September 2016 (continued)
167
11. FINANCIAL RISK MANAGEMENT (continued)
Interest Rate Risk (continued)
As at 30 September 2016 (continued)
High Yield Fund Up to 1-5 years Over Non-interest Total 1 year 5 years bearing USD USD USD USD USD Assets Cash and cash equivalents – – – 6,139,310 6,139,310 Transferable securities 1,098,488 47,507,844 82,077,906 216,902 130,901,140 Financial Derivative Instruments – – – 617,621 617,621 Other Assets – – – 2,209,966 2,209,966 Total Assets 1,098,488 47,507,844 82,077,906 9,183,799 139,868,037 Liabilities Bank Overdraft – – – – – Financial Derivative Instruments – – – (36,840) (36,840) Creditors – – – (1,038,841) (1,038,841) Total Liabilities – – – (1,075,681) (1,075,681) Total interest sensitivity gap 1,098,488 47,507,844 82,077,906 Post Global Limited Term High Yield Fund Up to 1-5 years Over Non-interest Total 1 year 5 years bearing USD USD USD USD USD Assets Cash and cash equivalents – – – 9,067,269 9,067,269 Transferable securities 71,217,038 693,769,512 82,180,280 – 847,166,830 Financial Derivative Instruments – – – 2,878,929 2,878,929 Other Assets – – – 21,848,253 21,848,253 Total Assets 71,217,038 693,769,512 82,180,280 33,794,451 880,961,281 Liabilities Bank Overdraft – – – – – Financial Derivative Instruments – – – (6,973,130) (6,973,130) Creditors – – – (19,962,251) (19,962,251) Total Liabilities – – – (26,935,381) (26,935,381) Total interest sensitivity gap 71,217,038 693,769,512 82,180,280 Global Time Diversified Absolute Return Fund
Up to 1-5 years Over Non-interest Total
1 year 5 years bearing USD USD USD USD USD Assets Cash and cash equivalents – – – 684,268 684,268 Transferable securities 3,996,788 – – – 3,996,788 Financial Derivative Instruments – – – 158,480 158,480 Other Assets – – – 28,127 28,127 Total Assets 3,996,788 – – 870,875 4,867,663 Liabilities Bank Overdraft – – – – – Financial Derivative Instruments – – – (161,396) (161,396) Creditors – – – (64,751) (64,751) Total Liabilities – – – (226,147) (226,147) Total interest sensitivity gap 3,996,788 – –
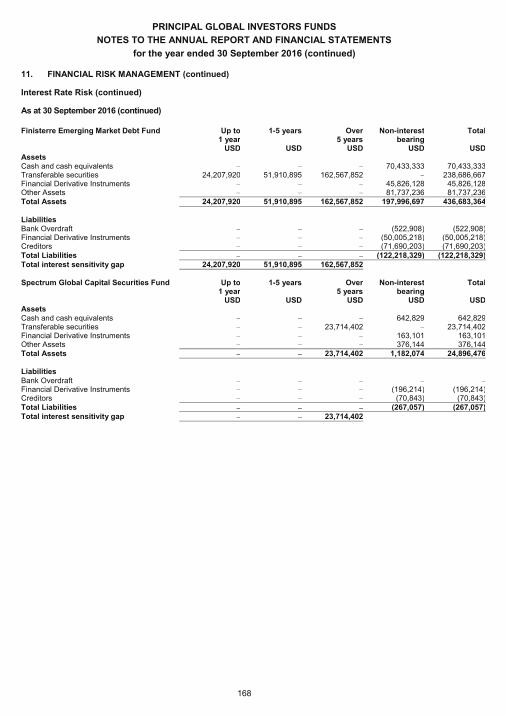
PRINCIPAL GLOBAL INVESTORS FUNDS
NOTES TO THE ANNUAL REPORT AND FINANCIAL STATEMENTS
for the year ended 30 September 2016 (continued)
168
11. FINANCIAL RISK MANAGEMENT (continued)
Interest Rate Risk (continued)
As at 30 September 2016 (continued)
Finisterre Emerging Market Debt Fund Up to 1-5 years Over Non-interest Total 1 year 5 years bearing USD USD USD USD USD Assets Cash and cash equivalents – – – 70,433,333 70,433,333 Transferable securities 24,207,920 51,910,895 162,567,852 – 238,686,667 Financial Derivative Instruments – – – 45,826,128 45,826,128 Other Assets – – – 81,737,236 81,737,236 Total Assets 24,207,920 51,910,895 162,567,852 197,996,697 436,683,364 Liabilities Bank Overdraft – – – (522,908) (522,908) Financial Derivative Instruments – – – (50,005,218) (50,005,218) Creditors – – – (71,690,203) (71,690,203) Total Liabilities – – – (122,218,329) (122,218,329) Total interest sensitivity gap 24,207,920 51,910,895 162,567,852 Spectrum Global Capital Securities Fund Up to 1-5 years Over Non-interest Total 1 year 5 years bearing USD USD USD USD USD Assets Cash and cash equivalents – – – 642,829 642,829 Transferable securities – – 23,714,402 – 23,714,402 Financial Derivative Instruments – – – 163,101 163,101 Other Assets – – – 376,144 376,144 Total Assets – – 23,714,402 1,182,074 24,896,476 Liabilities Bank Overdraft – – – – – Financial Derivative Instruments – – – (196,214) (196,214) Creditors – – – (70,843) (70,843) Total Liabilities – – – (267,057) (267,057) Total interest sensitivity gap – – 23,714,402
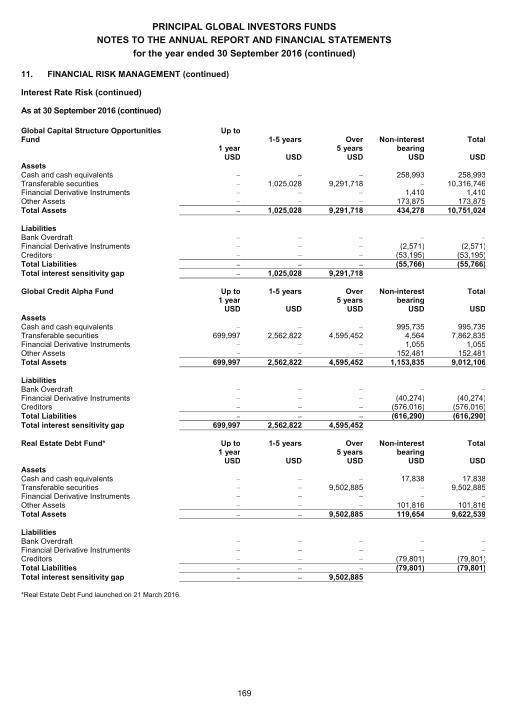
PRINCIPAL GLOBAL INVESTORS FUNDS
NOTES TO THE ANNUAL REPORT AND FINANCIAL STATEMENTS
for the year ended 30 September 2016 (continued)
169
11. FINANCIAL RISK MANAGEMENT (continued)
Interest Rate Risk (continued)
As at 30 September 2016 (continued)
Global Capital Structure Opportunities Fund
Up to 1-5 years Over Non-interest Total
1 year 5 years bearing USD USD USD USD USD Assets Cash and cash equivalents – – – 258,993 258,993 Transferable securities – 1,025,028 9,291,718 – 10,316,746 Financial Derivative Instruments – – – 1,410 1,410 Other Assets – – – 173,875 173,875 Total Assets – 1,025,028 9,291,718 434,278 10,751,024
Liabilities Bank Overdraft – – – – – Financial Derivative Instruments – – – (2,571) (2,571) Creditors – – – (53,195) (53,195) Total Liabilities – – – (55,766) (55,766) Total interest sensitivity gap – 1,025,028 9,291,718 Global Credit Alpha Fund Up to 1-5 years Over Non-interest Total 1 year 5 years bearing USD USD USD USD USD Assets Cash and cash equivalents – – – 995,735 995,735 Transferable securities 699,997 2,562,822 4,595,452 4,564 7,862,835 Financial Derivative Instruments – – – 1,055 1,055 Other Assets – – – 152,481 152,481 Total Assets 699,997 2,562,822 4,595,452 1,153,835 9,012,106 Liabilities Bank Overdraft – – – – – Financial Derivative Instruments – – – (40,274) (40,274) Creditors – – – (576,016) (576,016) Total Liabilities – – – (616,290) (616,290) Total interest sensitivity gap 699,997 2,562,822 4,595,452 Real Estate Debt Fund* Up to 1-5 years Over Non-interest Total 1 year 5 years bearing USD USD USD USD USD Assets Cash and cash equivalents – – – 17,838 17,838 Transferable securities – – 9,502,885 – 9,502,885 Financial Derivative Instruments – – – – – Other Assets – – – 101,816 101,816 Total Assets – – 9,502,885 119,654 9,622,539 Liabilities Bank Overdraft – – – – – Financial Derivative Instruments – – – – – Creditors – – – (79,801) (79,801) Total Liabilities – – – (79,801) (79,801) Total interest sensitivity gap – – 9,502,885
*Real Estate Debt Fund launched on 21 March 2016.
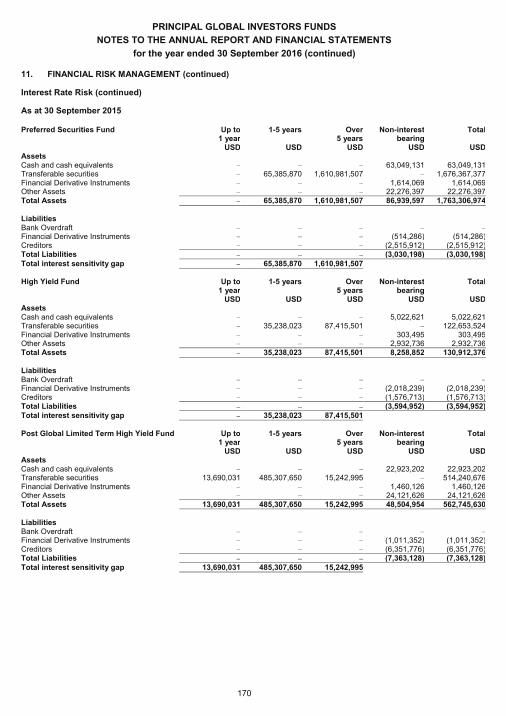
PRINCIPAL GLOBAL INVESTORS FUNDS
NOTES TO THE ANNUAL REPORT AND FINANCIAL STATEMENTS
for the year ended 30 September 2016 (continued)
170
11. FINANCIAL RISK MANAGEMENT (continued)
Interest Rate Risk (continued)
As at 30 September 2015
Preferred Securities Fund Up to 1-5 years Over Non-interest Total 1 year 5 years bearing USD USD USD USD USD Assets Cash and cash equivalents – – – 63,049,131 63,049,131 Transferable securities – 65,385,870 1,610,981,507 – 1,676,367,377 Financial Derivative Instruments – – – 1,614,069 1,614,069 Other Assets – – – 22,276,397 22,276,397 Total Assets – 65,385,870 1,610,981,507 86,939,597 1,763,306,974
Liabilities Bank Overdraft – – – – – Financial Derivative Instruments – – – (514,286) (514,286) Creditors – – – (2,515,912) (2,515,912) Total Liabilities – – – (3,030,198) (3,030,198) Total interest sensitivity gap – 65,385,870 1,610,981,507 High Yield Fund Up to 1-5 years Over Non-interest Total 1 year 5 years bearing USD USD USD USD USD Assets Cash and cash equivalents – – – 5,022,621 5,022,621 Transferable securities – 35,238,023 87,415,501 – 122,653,524 Financial Derivative Instruments – – – 303,495 303,495 Other Assets – – – 2,932,736 2,932,736 Total Assets – 35,238,023 87,415,501 8,258,852 130,912,376
Liabilities Bank Overdraft – – – – – Financial Derivative Instruments – – – (2,018,239) (2,018,239) Creditors – – – (1,576,713) (1,576,713) Total Liabilities – – – (3,594,952) (3,594,952) Total interest sensitivity gap – 35,238,023 87,415,501 Post Global Limited Term High Yield Fund Up to 1-5 years Over Non-interest Total 1 year 5 years bearing USD USD USD USD USD Assets Cash and cash equivalents – – – 22,923,202 22,923,202 Transferable securities 13,690,031 485,307,650 15,242,995 – 514,240,676 Financial Derivative Instruments – – – 1,460,126 1,460,126 Other Assets – – – 24,121,626 24,121,626 Total Assets 13,690,031 485,307,650 15,242,995 48,504,954 562,745,630
Liabilities Bank Overdraft – – – – – Financial Derivative Instruments – – – (1,011,352) (1,011,352) Creditors – – – (6,351,776) (6,351,776) Total Liabilities – – – (7,363,128) (7,363,128) Total interest sensitivity gap 13,690,031 485,307,650 15,242,995
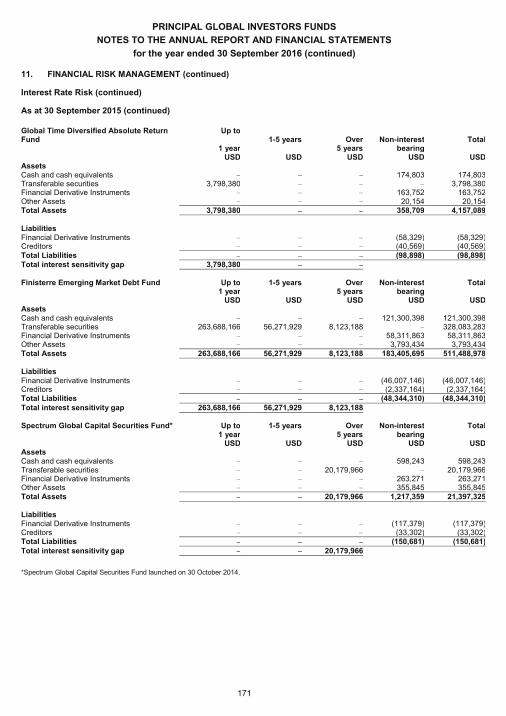
PRINCIPAL GLOBAL INVESTORS FUNDS
NOTES TO THE ANNUAL REPORT AND FINANCIAL STATEMENTS
for the year ended 30 September 2016 (continued)
171
11. FINANCIAL RISK MANAGEMENT (continued)
Interest Rate Risk (continued)
As at 30 September 2015 (continued)
Global Time Diversified Absolute Return Fund
Up to 1-5 years Over Non-interest Total
1 year 5 years bearing USD USD USD USD USD Assets Cash and cash equivalents – – – 174,803 174,803 Transferable securities 3,798,380 – – – 3,798,380 Financial Derivative Instruments – – – 163,752 163,752 Other Assets – – – 20,154 20,154 Total Assets 3,798,380 – – 358,709 4,157,089
Liabilities Financial Derivative Instruments – – – (58,329) (58,329) Creditors – – – (40,569) (40,569) Total Liabilities – – – (98,898) (98,898) Total interest sensitivity gap 3,798,380 – – Finisterre Emerging Market Debt Fund Up to 1-5 years Over Non-interest Total 1 year 5 years bearing USD USD USD USD USD Assets Cash and cash equivalents – – – 121,300,398 121,300,398 Transferable securities 263,688,166 56,271,929 8,123,188 – 328,083,283 Financial Derivative Instruments – – – 58,311,863 58,311,863 Other Assets – – – 3,793,434 3,793,434 Total Assets 263,688,166 56,271,929 8,123,188 183,405,695 511,488,978 Liabilities Financial Derivative Instruments – – – (46,007,146) (46,007,146) Creditors – – – (2,337,164) (2,337,164) Total Liabilities – – – (48,344,310) (48,344,310) Total interest sensitivity gap 263,688,166 56,271,929 8,123,188 Spectrum Global Capital Securities Fund* Up to 1-5 years Over Non-interest Total 1 year 5 years bearing USD USD USD USD USD Assets Cash and cash equivalents – – – 598,243 598,243 Transferable securities – – 20,179,966 – 20,179,966 Financial Derivative Instruments – – – 263,271 263,271 Other Assets – – – 355,845 355,845 Total Assets – – 20,179,966 1,217,359 21,397,325 Liabilities Financial Derivative Instruments – – – (117,379) (117,379) Creditors – – – (33,302) (33,302) Total Liabilities – – – (150,681) (150,681) Total interest sensitivity gap – – 20,179,966
*Spectrum Global Capital Securities Fund launched on 30 October 2014.
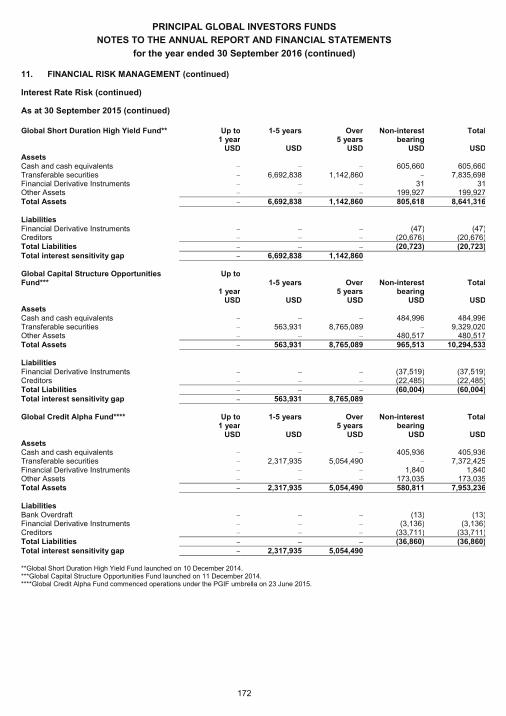
PRINCIPAL GLOBAL INVESTORS FUNDS
NOTES TO THE ANNUAL REPORT AND FINANCIAL STATEMENTS
for the year ended 30 September 2016 (continued)
172
11. FINANCIAL RISK MANAGEMENT (continued)
Interest Rate Risk (continued)
As at 30 September 2015 (continued)
Global Short Duration High Yield Fund** Up to 1-5 years Over Non-interest Total 1 year 5 years bearing USD USD USD USD USD Assets Cash and cash equivalents – – – 605,660 605,660 Transferable securities – 6,692,838 1,142,860 – 7,835,698 Financial Derivative Instruments – – – 31 31 Other Assets – – – 199,927 199,927 Total Assets – 6,692,838 1,142,860 805,618 8,641,316 Liabilities Financial Derivative Instruments – – – (47) (47) Creditors – – – (20,676) (20,676) Total Liabilities – – – (20,723) (20,723) Total interest sensitivity gap – 6,692,838 1,142,860 Global Capital Structure Opportunities Fund***
Up to 1-5 years Over Non-interest Total
1 year 5 years bearing USD USD USD USD USD Assets Cash and cash equivalents – – – 484,996 484,996 Transferable securities – 563,931 8,765,089 – 9,329,020 Other Assets – – – 480,517 480,517 Total Assets – 563,931 8,765,089 965,513 10,294,533 Liabilities Financial Derivative Instruments – – – (37,519) (37,519) Creditors – – – (22,485) (22,485) Total Liabilities – – – (60,004) (60,004) Total interest sensitivity gap – 563,931 8,765,089 Global Credit Alpha Fund**** Up to 1-5 years Over Non-interest Total 1 year 5 years bearing USD USD USD USD USD Assets Cash and cash equivalents – – – 405,936 405,936 Transferable securities – 2,317,935 5,054,490 – 7,372,425 Financial Derivative Instruments – – – 1,840 1,840 Other Assets – – – 173,035 173,035 Total Assets – 2,317,935 5,054,490 580,811 7,953,236
Liabilities Bank Overdraft – – – (13) (13) Financial Derivative Instruments – – – (3,136) (3,136) Creditors – – – (33,711) (33,711) Total Liabilities – – – (36,860) (36,860) Total interest sensitivity gap – 2,317,935 5,054,490
**Global Short Duration High Yield Fund launched on 10 December 2014. ***Global Capital Structure Opportunities Fund launched on 11 December 2014. ****Global Credit Alpha Fund commenced operations under the PGIF umbrella on 23 June 2015.
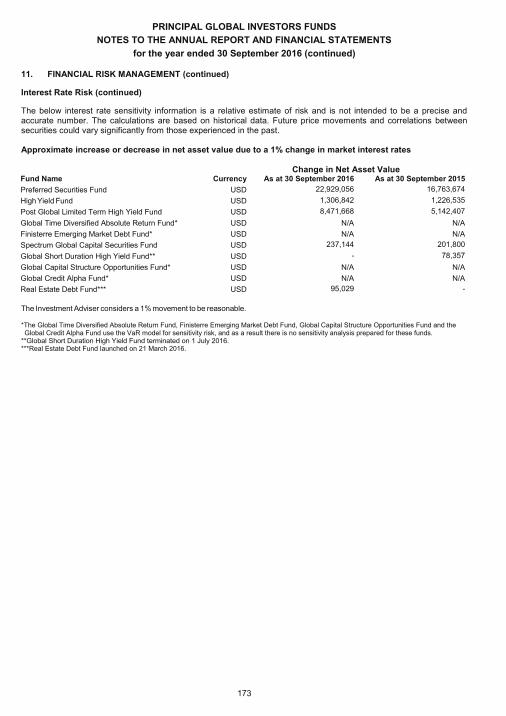
PRINCIPAL GLOBAL INVESTORS FUNDS
NOTES TO THE ANNUAL REPORT AND FINANCIAL STATEMENTS
for the year ended 30 September 2016 (continued)
173
11. FINANCIAL RISK MANAGEMENT (continued)
Interest Rate Risk (continued)
The below interest rate sensitivity information is a relative estimate of risk and is not intended to be a precise and accurate number. The calculations are based on historical data. Future price movements and correlations between securities could vary significantly from those experienced in the past. Approximate increase or decrease in net asset value due to a 1% change in market interest rates
Change in Net Asset Value
Fund Name Currency As at 30 September 2016 As at 30 September 2015
Preferred Securities Fund USD 22,929,056 16,763,674
High Yield Fund USD 1,306,842 1,226,535
Post Global Limited Term High Yield Fund USD 8,471,668 5,142,407
Global Time Diversified Absolute Return Fund* USD N/A N/A
Finisterre Emerging Market Debt Fund* USD N/A N/A
Spectrum Global Capital Securities Fund USD 237,144 201,800
Global Short Duration High Yield Fund** USD - 78,357
Global Capital Structure Opportunities Fund* USD N/A N/A
Global Credit Alpha Fund* USD N/A N/A
Real Estate Debt Fund***
USD 95,029 -
The Investment Adviser considers a 1% movement to be reasonable.
*The Global Time Diversified Absolute Return Fund, Finisterre Emerging Market Debt Fund, Global Capital Structure Opportunities Fund and the Global Credit Alpha Fund use the VaR model for sensitivity risk, and as a result there is no sensitivity analysis prepared for these funds.
**Global Short Duration High Yield Fund terminated on 1 July 2016. ***Real Estate Debt Fund launched on 21 March 2016.

PRINCIPAL GLOBAL INVESTORS FUNDS
NOTES TO THE ANNUAL REPORT AND FINANCIAL STATEMENTS
for the year ended 30 September 2016 (continued)
174
11. FINANCIAL RISK MANAGEMENT (continued)
Currency Risk
The Funds may hold assets denominated in currencies other than the functional currency of a Fund. They are therefore exposed to currency risk, as the value of the securities denominated in other currencies will fluctuate due to changes in exchange rates. A Fund may utilise financial instruments to hedge against fluctuations in the relative values of their portfolio positions.
The Investment Adviser monitors the currency positions on a daily basis utilizing quantitative and fundamental models.
The following tables detail the material monetary currency exposures.
As at 30 September 2016
Global Equity Fund Foreign Currency Exposure Monetary Non-Monetary Forward FX Net Financial Assets Assets Contracts Assets USD USD USD USD Brazilian Real (117,214) 603,487 – 486,273 Canadian Dollar 3,091 2,355,396 (1,513) 2,356,974 Danish Krone – 224,463 – 224,463 Euro (2,116) 6,977,166 – 6,975,050 Hong Kong Dollar – 1,194,401 – 1,194,401 Indonesian Rupiah – 380,245 – 380,245 Japanese Yen 36,728 3,212,665 – 3,249,393 Malaysian Ringgit – 243,088 – 243,088 Mexican Peso – 224,099 – 224,099 Pound Sterling 10,206 4,172,752 (3,617) 4,179,341 South African Rand 1 – – 1 South Korean Won – 1,379,456 – 1,379,456 Swiss Franc – 1,077,397 – 1,077,397 Taiwan Dollar – 279,466 – 279,466 U.S. Dollar 1,466,963 24,559,915 5,127 26,032,005 1,397,659 46,883,996 (3) 48,281,652 Asian Equity Fund Foreign Currency Exposure Monetary Non-Monetary Forward FX Net Financial Assets Assets Contracts Assets USD USD USD USD Chinese Renminbi 1,933 – – 1,933 Euro (1,253) – – (1,253) Hong Kong Dollar (10,162) 3,133,421 15,131 3,138,390 Indian Rupee 86,979 920,780 – 1,007,759 Indonesian Rupiah – 237,437 – 237,437 Singapore Dollar 2,066 145,916 (2,066) 145,916 South Korean Won (29,159) 1,390,614 – 1,361,455 Taiwan Dollar – 1,202,416 – 1,202,416 Thailand Baht – 348,186 – 348,186 U.S. Dollar (37,481) 544,233 (13,053) 493,699 12,923 7,923,003 12 7,935,938
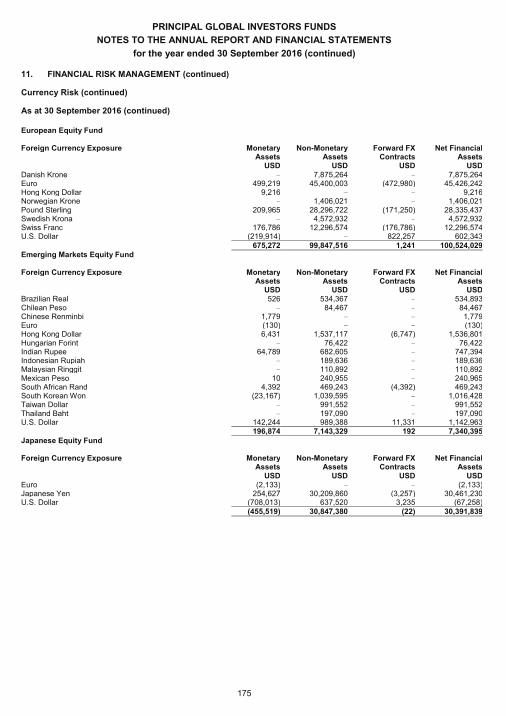
PRINCIPAL GLOBAL INVESTORS FUNDS
NOTES TO THE ANNUAL REPORT AND FINANCIAL STATEMENTS
for the year ended 30 September 2016 (continued)
175
11. FINANCIAL RISK MANAGEMENT (continued)
Currency Risk (continued)
As at 30 September 2016 (continued)
European Equity Fund Foreign Currency Exposure Monetary Non-Monetary Forward FX Net Financial Assets Assets Contracts Assets USD USD USD USD Danish Krone – 7,875,264 – 7,875,264 Euro 499,219 45,400,003 (472,980) 45,426,242 Hong Kong Dollar 9,216 – – 9,216 Norwegian Krone – 1,406,021 – 1,406,021 Pound Sterling 209,965 28,296,722 (171,250) 28,335,437 Swedish Krona – 4,572,932 – 4,572,932 Swiss Franc 176,786 12,296,574 (176,786) 12,296,574 U.S. Dollar (219,914) – 822,257 602,343 675,272 99,847,516 1,241 100,524,029 Emerging Markets Equity Fund Foreign Currency Exposure Monetary Non-Monetary Forward FX Net Financial Assets Assets Contracts Assets USD USD USD USD Brazilian Real 526 534,367 – 534,893 Chilean Peso – 84,467 – 84,467 Chinese Renminbi 1,779 – – 1,779 Euro (130) – – (130) Hong Kong Dollar 6,431 1,537,117 (6,747) 1,536,801 Hungarian Forint – 76,422 – 76,422 Indian Rupee 64,789 682,605 – 747,394 Indonesian Rupiah – 189,636 – 189,636 Malaysian Ringgit – 110,892 – 110,892 Mexican Peso 10 240,955 – 240,965 South African Rand 4,392 469,243 (4,392) 469,243 South Korean Won (23,167) 1,039,595 – 1,016,428 Taiwan Dollar – 991,552 – 991,552 Thailand Baht – 197,090 – 197,090 U.S. Dollar 142,244 989,388 11,331 1,142,963 196,874 7,143,329 192 7,340,395 Japanese Equity Fund Foreign Currency Exposure Monetary Non-Monetary Forward FX Net Financial Assets Assets Contracts Assets USD USD USD USD Euro (2,133) – – (2,133) Japanese Yen 254,627 30,209,860 (3,257) 30,461,230 U.S. Dollar (708,013) 637,520 3,235 (67,258) (455,519) 30,847,380 (22) 30,391,839
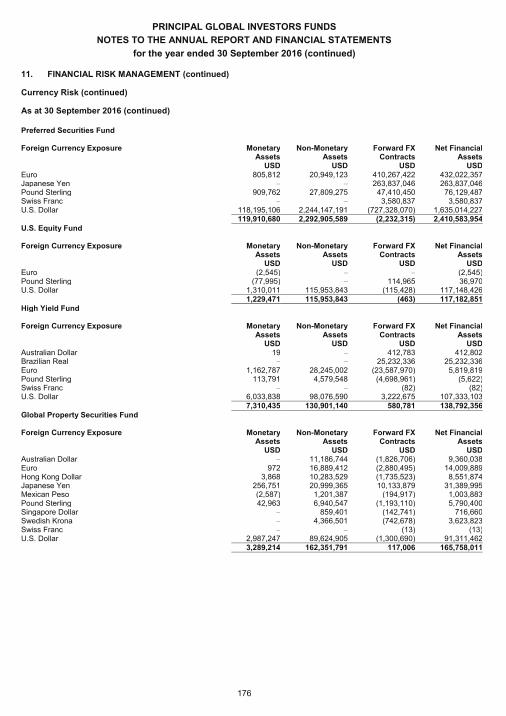
PRINCIPAL GLOBAL INVESTORS FUNDS
NOTES TO THE ANNUAL REPORT AND FINANCIAL STATEMENTS
for the year ended 30 September 2016 (continued)
176
11. FINANCIAL RISK MANAGEMENT (continued)
Currency Risk (continued)
As at 30 September 2016 (continued)
Preferred Securities Fund Foreign Currency Exposure Monetary Non-Monetary Forward FX Net Financial Assets Assets Contracts Assets USD USD USD USD Euro 805,812 20,949,123 410,267,422 432,022,357 Japanese Yen – – 263,837,046 263,837,046 Pound Sterling 909,762 27,809,275 47,410,450 76,129,487 Swiss Franc – – 3,580,837 3,580,837 U.S. Dollar 118,195,106 2,244,147,191 (727,328,070) 1,635,014,227 119,910,680 2,292,905,589 (2,232,315) 2,410,583,954 U.S. Equity Fund Foreign Currency Exposure Monetary Non-Monetary Forward FX Net Financial Assets Assets Contracts Assets USD USD USD USD Euro (2,545) – – (2,545) Pound Sterling (77,995) – 114,965 36,970 U.S. Dollar 1,310,011 115,953,843 (115,428) 117,148,426 1,229,471 115,953,843 (463) 117,182,851 High Yield Fund Foreign Currency Exposure Monetary Non-Monetary Forward FX Net Financial Assets Assets Contracts Assets USD USD USD USD Australian Dollar 19 – 412,783 412,802 Brazilian Real – – 25,232,336 25,232,336 Euro 1,162,787 28,245,002 (23,587,970) 5,819,819 Pound Sterling 113,791 4,579,548 (4,698,961) (5,622) Swiss Franc – – (82) (82) U.S. Dollar 6,033,838 98,076,590 3,222,675 107,333,103 7,310,435 130,901,140 580,781 138,792,356 Global Property Securities Fund Foreign Currency Exposure Monetary Non-Monetary Forward FX Net Financial Assets Assets Contracts Assets USD USD USD USD Australian Dollar – 11,186,744 (1,826,706) 9,360,038 Euro 972 16,889,412 (2,880,495) 14,009,889 Hong Kong Dollar 3,868 10,283,529 (1,735,523) 8,551,874 Japanese Yen 256,751 20,999,365 10,133,879 31,389,995 Mexican Peso (2,587) 1,201,387 (194,917) 1,003,883 Pound Sterling 42,963 6,940,547 (1,193,110) 5,790,400 Singapore Dollar – 859,401 (142,741) 716,660 Swedish Krona – 4,366,501 (742,678) 3,623,823 Swiss Franc – – (13) (13) U.S. Dollar 2,987,247 89,624,905 (1,300,690) 91,311,462 3,289,214 162,351,791 117,006 165,758,011
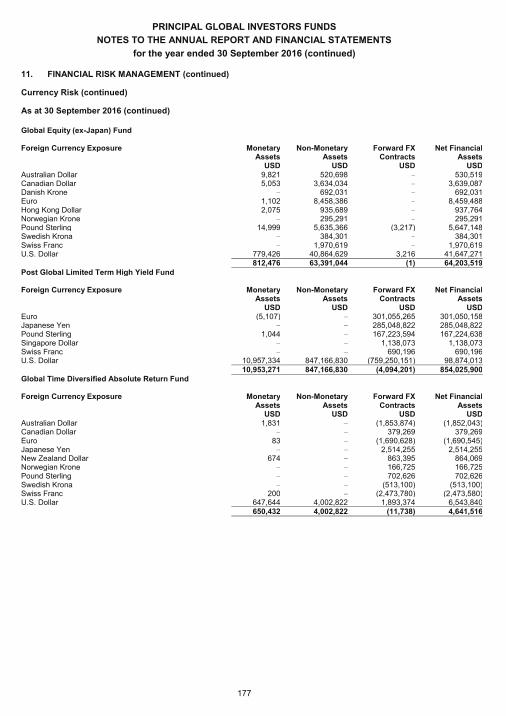
PRINCIPAL GLOBAL INVESTORS FUNDS
NOTES TO THE ANNUAL REPORT AND FINANCIAL STATEMENTS
for the year ended 30 September 2016 (continued)
177
11. FINANCIAL RISK MANAGEMENT (continued)
Currency Risk (continued)
As at 30 September 2016 (continued)
Global Equity (ex-Japan) Fund Foreign Currency Exposure Monetary Non-Monetary Forward FX Net Financial Assets Assets Contracts Assets USD USD USD USD Australian Dollar 9,821 520,698 – 530,519 Canadian Dollar 5,053 3,634,034 – 3,639,087 Danish Krone – 692,031 – 692,031 Euro 1,102 8,458,386 – 8,459,488 Hong Kong Dollar 2,075 935,689 – 937,764 Norwegian Krone – 295,291 – 295,291 Pound Sterling 14,999 5,635,366 (3,217) 5,647,148 Swedish Krona – 384,301 – 384,301 Swiss Franc – 1,970,619 – 1,970,619 U.S. Dollar 779,426 40,864,629 3,216 41,647,271 812,476 63,391,044 (1) 64,203,519 Post Global Limited Term High Yield Fund Foreign Currency Exposure Monetary Non-Monetary Forward FX Net Financial Assets Assets Contracts Assets USD USD USD USD Euro (5,107) – 301,055,265 301,050,158 Japanese Yen – – 285,048,822 285,048,822 Pound Sterling 1,044 – 167,223,594 167,224,638 Singapore Dollar – – 1,138,073 1,138,073 Swiss Franc – – 690,196 690,196 U.S. Dollar 10,957,334 847,166,830 (759,250,151) 98,874,013 10,953,271 847,166,830 (4,094,201) 854,025,900 Global Time Diversified Absolute Return Fund Foreign Currency Exposure Monetary Non-Monetary Forward FX Net Financial Assets Assets Contracts Assets USD USD USD USD Australian Dollar 1,831 – (1,853,874) (1,852,043) Canadian Dollar – – 379,269 379,269 Euro 83 – (1,690,628) (1,690,545) Japanese Yen – – 2,514,255 2,514,255 New Zealand Dollar 674 – 863,395 864,069 Norwegian Krone – – 166,725 166,725 Pound Sterling – – 702,626 702,626 Swedish Krona – – (513,100) (513,100) Swiss Franc 200 – (2,473,780) (2,473,580) U.S. Dollar 647,644 4,002,822 1,893,374 6,543,840 650,432 4,002,822 (11,738) 4,641,516
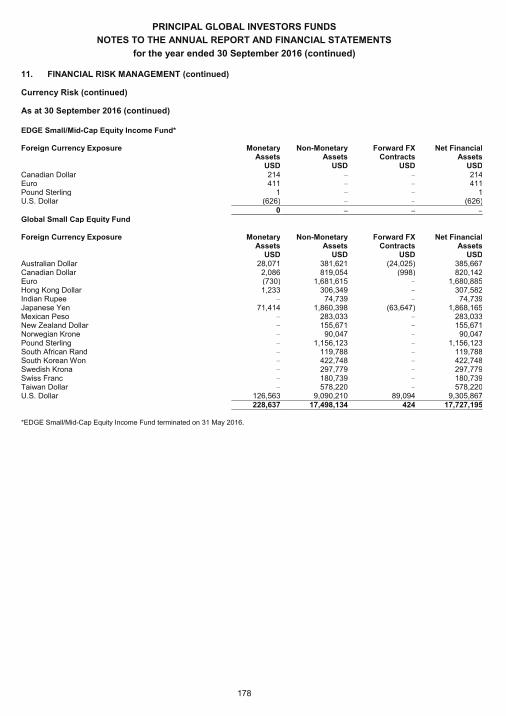
PRINCIPAL GLOBAL INVESTORS FUNDS
NOTES TO THE ANNUAL REPORT AND FINANCIAL STATEMENTS
for the year ended 30 September 2016 (continued)
178
11. FINANCIAL RISK MANAGEMENT (continued)
Currency Risk (continued)
As at 30 September 2016 (continued)
EDGE Small/Mid-Cap Equity Income Fund* Foreign Currency Exposure Monetary Non-Monetary Forward FX Net Financial Assets Assets Contracts Assets USD USD USD USD Canadian Dollar 214 – – 214 Euro 411 – – 411 Pound Sterling 1 – – 1 U.S. Dollar (626) – – (626) 0 – – – Global Small Cap Equity Fund Foreign Currency Exposure Monetary Non-Monetary Forward FX Net Financial Assets Assets Contracts Assets USD USD USD USD Australian Dollar 28,071 381,621 (24,025) 385,667 Canadian Dollar 2,086 819,054 (998) 820,142 Euro (730) 1,681,615 – 1,680,885 Hong Kong Dollar 1,233 306,349 – 307,582 Indian Rupee – 74,739 – 74,739 Japanese Yen 71,414 1,860,398 (63,647) 1,868,165 Mexican Peso – 283,033 – 283,033 New Zealand Dollar – 155,671 – 155,671 Norwegian Krone – 90,047 – 90,047 Pound Sterling – 1,156,123 – 1,156,123 South African Rand – 119,788 – 119,788 South Korean Won – 422,748 – 422,748 Swedish Krona – 297,779 – 297,779 Swiss Franc – 180,739 – 180,739 Taiwan Dollar – 578,220 – 578,220 U.S. Dollar 126,563 9,090,210 89,094 9,305,867 228,637 17,498,134 424 17,727,195
*EDGE Small/Mid-Cap Equity Income Fund terminated on 31 May 2016.
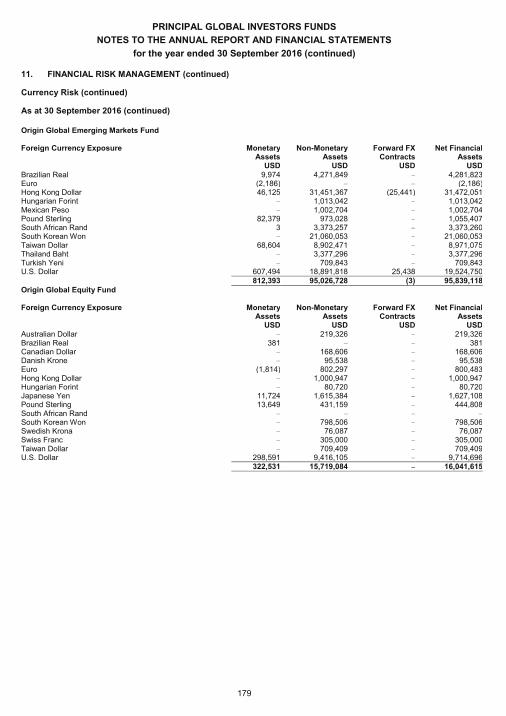
PRINCIPAL GLOBAL INVESTORS FUNDS
NOTES TO THE ANNUAL REPORT AND FINANCIAL STATEMENTS
for the year ended 30 September 2016 (continued)
179
11. FINANCIAL RISK MANAGEMENT (continued)
Currency Risk (continued)
As at 30 September 2016 (continued)
Origin Global Emerging Markets Fund Foreign Currency Exposure Monetary Non-Monetary Forward FX Net Financial Assets Assets Contracts Assets USD USD USD USD Brazilian Real 9,974 4,271,849 – 4,281,823 Euro (2,186) – – (2,186) Hong Kong Dollar 46,125 31,451,367 (25,441) 31,472,051 Hungarian Forint – 1,013,042 – 1,013,042 Mexican Peso – 1,002,704 – 1,002,704 Pound Sterling 82,379 973,028 – 1,055,407 South African Rand 3 3,373,257 – 3,373,260 South Korean Won – 21,060,053 – 21,060,053 Taiwan Dollar 68,604 8,902,471 – 8,971,075 Thailand Baht – 3,377,296 – 3,377,296 Turkish Yeni – 709,843 – 709,843 U.S. Dollar 607,494 18,891,818 25,438 19,524,750 812,393 95,026,728 (3) 95,839,118 Origin Global Equity Fund Foreign Currency Exposure Monetary Non-Monetary Forward FX Net Financial Assets Assets Contracts Assets USD USD USD USD Australian Dollar – 219,326 – 219,326 Brazilian Real 381 – – 381 Canadian Dollar – 168,606 – 168,606 Danish Krone – 95,538 – 95,538 Euro (1,814) 802,297 – 800,483 Hong Kong Dollar – 1,000,947 – 1,000,947 Hungarian Forint – 80,720 – 80,720 Japanese Yen 11,724 1,615,384 – 1,627,108 Pound Sterling 13,649 431,159 – 444,808 South African Rand – – – – South Korean Won – 798,506 – 798,506 Swedish Krona – 76,087 – 76,087 Swiss Franc – 305,000 – 305,000 Taiwan Dollar – 709,409 – 709,409 U.S. Dollar 298,591 9,416,105 – 9,714,696 322,531 15,719,084 – 16,041,615
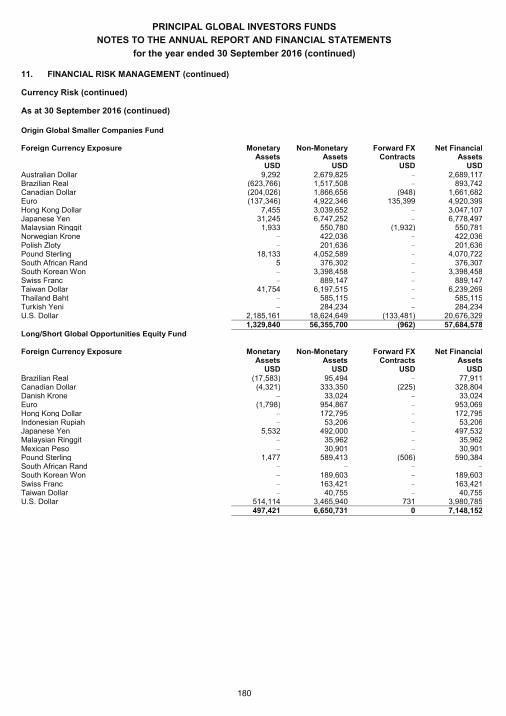
PRINCIPAL GLOBAL INVESTORS FUNDS
NOTES TO THE ANNUAL REPORT AND FINANCIAL STATEMENTS
for the year ended 30 September 2016 (continued)
180
11. FINANCIAL RISK MANAGEMENT (continued)
Currency Risk (continued)
As at 30 September 2016 (continued)
Origin Global Smaller Companies Fund Foreign Currency Exposure Monetary Non-Monetary Forward FX Net Financial Assets Assets Contracts Assets USD USD USD USD Australian Dollar 9,292 2,679,825 – 2,689,117 Brazilian Real (623,766) 1,517,508 – 893,742 Canadian Dollar (204,026) 1,866,656 (948) 1,661,682 Euro (137,346) 4,922,346 135,399 4,920,399 Hong Kong Dollar 7,455 3,039,652 – 3,047,107 Japanese Yen 31,245 6,747,252 – 6,778,497 Malaysian Ringgit 1,933 550,780 (1,932) 550,781 Norwegian Krone – 422,036 – 422,036 Polish Zloty – 201,636 – 201,636 Pound Sterling 18,133 4,052,589 – 4,070,722 South African Rand 5 376,302 – 376,307 South Korean Won – 3,398,458 – 3,398,458 Swiss Franc – 889,147 – 889,147 Taiwan Dollar 41,754 6,197,515 – 6,239,269 Thailand Baht – 585,115 – 585,115 Turkish Yeni – 284,234 – 284,234 U.S. Dollar 2,185,161 18,624,649 (133,481) 20,676,329 1,329,840 56,355,700 (962) 57,684,578 Long/Short Global Opportunities Equity Fund Foreign Currency Exposure Monetary Non-Monetary Forward FX Net Financial Assets Assets Contracts Assets USD USD USD USD Brazilian Real (17,583) 95,494 – 77,911 Canadian Dollar (4,321) 333,350 (225) 328,804 Danish Krone – 33,024 – 33,024 Euro (1,798) 954,867 – 953,069 Hong Kong Dollar – 172,795 – 172,795 Indonesian Rupiah – 53,206 – 53,206 Japanese Yen 5,532 492,000 – 497,532 Malaysian Ringgit – 35,962 – 35,962 Mexican Peso – 30,901 – 30,901 Pound Sterling 1,477 589,413 (506) 590,384 South African Rand – – – – South Korean Won – 189,603 – 189,603 Swiss Franc – 163,421 – 163,421 Taiwan Dollar – 40,755 – 40,755 U.S. Dollar 514,114 3,465,940 731 3,980,785 497,421 6,650,731 0 7,148,152
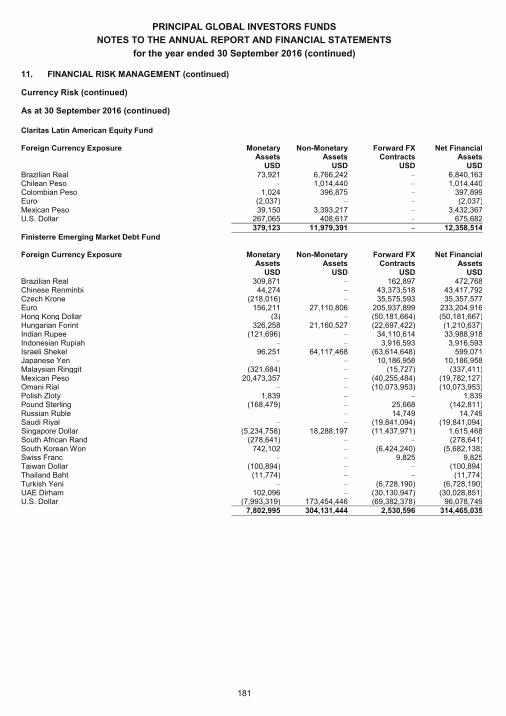
PRINCIPAL GLOBAL INVESTORS FUNDS
NOTES TO THE ANNUAL REPORT AND FINANCIAL STATEMENTS
for the year ended 30 September 2016 (continued)
181
11. FINANCIAL RISK MANAGEMENT (continued)
Currency Risk (continued)
As at 30 September 2016 (continued)
Claritas Latin American Equity Fund Foreign Currency Exposure Monetary Non-Monetary Forward FX Net Financial Assets Assets Contracts Assets USD USD USD USD Brazilian Real 73,921 6,766,242 – 6,840,163 Chilean Peso – 1,014,440 – 1,014,440 Colombian Peso 1,024 396,875 – 397,899 Euro (2,037) – – (2,037) Mexican Peso 39,150 3,393,217 – 3,432,367 U.S. Dollar 267,065 408,617 – 675,682 379,123 11,979,391 – 12,358,514 Finisterre Emerging Market Debt Fund Foreign Currency Exposure Monetary Non-Monetary Forward FX Net Financial Assets Assets Contracts Assets USD USD USD USD Brazilian Real 309,871 – 162,897 472,768 Chinese Renminbi 44,274 – 43,373,518 43,417,792 Czech Krone (218,016) – 35,575,593 35,357,577 Euro 156,211 27,110,806 205,937,899 233,204,916 Hong Kong Dollar (3) – (50,181,664) (50,181,667) Hungarian Forint 326,258 21,160,527 (22,697,422) (1,210,637) Indian Rupee (121,696) – 34,110,614 33,988,918 Indonesian Rupiah – – 3,916,593 3,916,593 Israeli Shekel 96,251 64,117,468 (63,614,648) 599,071 Japanese Yen – – 10,186,958 10,186,958 Malaysian Ringgit (321,684) – (15,727) (337,411) Mexican Peso 20,473,357 – (40,255,484) (19,782,127) Omani Rial – – (10,073,953) (10,073,953) Polish Zloty 1,839 – – 1,839 Pound Sterling (168,479) – 25,668 (142,811) Russian Ruble – 14,749 14,749 Saudi Riyal – – (19,841,094) (19,841,094) Singapore Dollar (5,234,758) 18,288,197 (11,437,971) 1,615,468 South African Rand (278,641) – – (278,641) South Korean Won 742,102 – (6,424,240) (5,682,138) Swiss Franc – – 9,825 9,825 Taiwan Dollar (100,894) – – (100,894) Thailand Baht (11,774) – – (11,774) Turkish Yeni – – (6,728,190) (6,728,190) UAE Dirham 102,096 – (30,130,947) (30,028,851) U.S. Dollar (7,993,319) 173,454,446 (69,382,378) 96,078,749 7,802,995 304,131,444 2,530,596 314,465,035
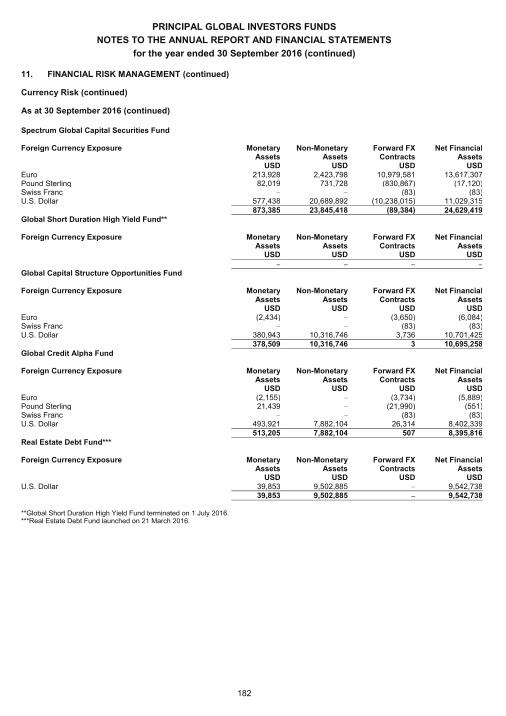
PRINCIPAL GLOBAL INVESTORS FUNDS
NOTES TO THE ANNUAL REPORT AND FINANCIAL STATEMENTS
for the year ended 30 September 2016 (continued)
182
11. FINANCIAL RISK MANAGEMENT (continued)
Currency Risk (continued)
As at 30 September 2016 (continued)
Spectrum Global Capital Securities Fund Foreign Currency Exposure Monetary Non-Monetary Forward FX Net Financial Assets Assets Contracts Assets USD USD USD USD Euro 213,928 2,423,798 10,979,581 13,617,307 Pound Sterling 82,019 731,728 (830,867) (17,120) Swiss Franc – – (83) (83) U.S. Dollar 577,438 20,689,892 (10,238,015) 11,029,315 873,385 23,845,418 (89,384) 24,629,419 Global Short Duration High Yield Fund** Foreign Currency Exposure Monetary Non-Monetary Forward FX Net Financial Assets Assets Contracts Assets USD USD USD USD – – – – Global Capital Structure Opportunities Fund Foreign Currency Exposure Monetary Non-Monetary Forward FX Net Financial Assets Assets Contracts Assets USD USD USD USD Euro (2,434) – (3,650) (6,084) Swiss Franc – – (83) (83) U.S. Dollar 380,943 10,316,746 3,736 10,701,425 378,509 10,316,746 3 10,695,258 Global Credit Alpha Fund Foreign Currency Exposure Monetary Non-Monetary Forward FX Net Financial Assets Assets Contracts Assets USD USD USD USD Euro (2,155) – (3,734) (5,889) Pound Sterling 21,439 – (21,990) (551) Swiss Franc – – (83) (83) U.S. Dollar 493,921 7,882,104 26,314 8,402,339 513,205 7,882,104 507 8,395,816 Real Estate Debt Fund*** Foreign Currency Exposure Monetary Non-Monetary Forward FX Net Financial Assets Assets Contracts Assets USD USD USD USD U.S. Dollar 39,853 9,502,885 – 9,542,738 39,853 9,502,885 – 9,542,738
**Global Short Duration High Yield Fund terminated on 1 July 2016. ***Real Estate Debt Fund launched on 21 March 2016.
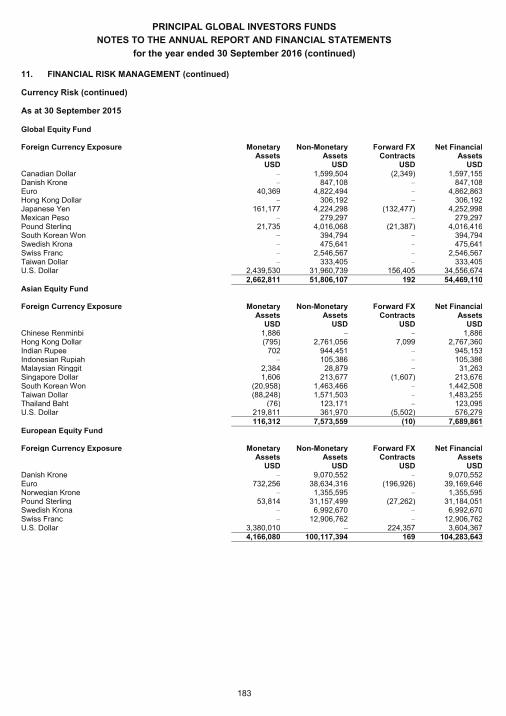
PRINCIPAL GLOBAL INVESTORS FUNDS
NOTES TO THE ANNUAL REPORT AND FINANCIAL STATEMENTS
for the year ended 30 September 2016 (continued)
183
11. FINANCIAL RISK MANAGEMENT (continued)
Currency Risk (continued)
As at 30 September 2015
Global Equity Fund Foreign Currency Exposure Monetary Non-Monetary Forward FX Net Financial Assets Assets Contracts Assets USD USD USD USD Canadian Dollar – 1,599,504 (2,349) 1,597,155 Danish Krone – 847,108 – 847,108 Euro 40,369 4,822,494 – 4,862,863 Hong Kong Dollar – 306,192 – 306,192 Japanese Yen 161,177 4,224,298 (132,477) 4,252,998 Mexican Peso – 279,297 – 279,297 Pound Sterling 21,735 4,016,068 (21,387) 4,016,416 South Korean Won – 394,794 – 394,794 Swedish Krona – 475,641 – 475,641 Swiss Franc – 2,546,567 – 2,546,567 Taiwan Dollar – 333,405 – 333,405 U.S. Dollar 2,439,530 31,960,739 156,405 34,556,674 2,662,811 51,806,107 192 54,469,110 Asian Equity Fund Foreign Currency Exposure Monetary Non-Monetary Forward FX Net Financial Assets Assets Contracts Assets USD USD USD USD Chinese Renminbi 1,886 – – 1,886 Hong Kong Dollar (795) 2,761,056 7,099 2,767,360 Indian Rupee 702 944,451 – 945,153 Indonesian Rupiah – 105,386 – 105,386 Malaysian Ringgit 2,384 28,879 – 31,263 Singapore Dollar 1,606 213,677 (1,607) 213,676 South Korean Won (20,958) 1,463,466 – 1,442,508 Taiwan Dollar (88,248) 1,571,503 – 1,483,255 Thailand Baht (76) 123,171 – 123,095 U.S. Dollar 219,811 361,970 (5,502) 576,279 116,312 7,573,559 (10) 7,689,861 European Equity Fund Foreign Currency Exposure Monetary Non-Monetary Forward FX Net Financial Assets Assets Contracts Assets USD USD USD USD Danish Krone – 9,070,552 – 9,070,552 Euro 732,256 38,634,316 (196,926) 39,169,646 Norwegian Krone – 1,355,595 – 1,355,595 Pound Sterling 53,814 31,157,499 (27,262) 31,184,051 Swedish Krona – 6,992,670 – 6,992,670 Swiss Franc – 12,906,762 – 12,906,762 U.S. Dollar 3,380,010 – 224,357 3,604,367 4,166,080 100,117,394 169 104,283,643
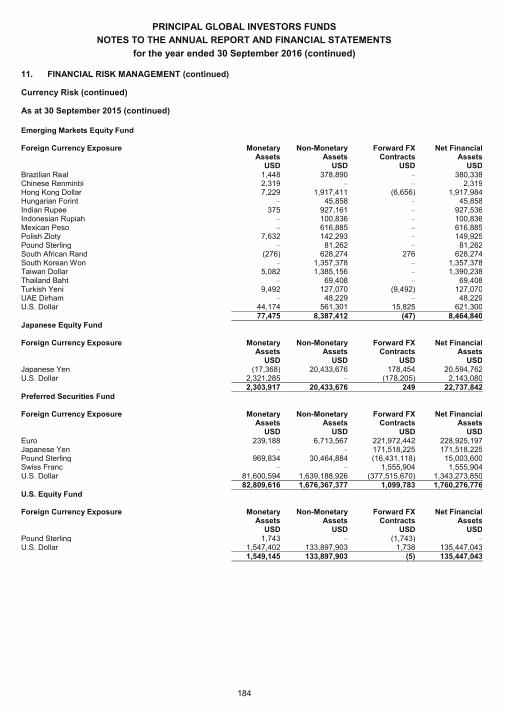
PRINCIPAL GLOBAL INVESTORS FUNDS
NOTES TO THE ANNUAL REPORT AND FINANCIAL STATEMENTS
for the year ended 30 September 2016 (continued)
184
11. FINANCIAL RISK MANAGEMENT (continued)
Currency Risk (continued)
As at 30 September 2015 (continued)
Emerging Markets Equity Fund Foreign Currency Exposure Monetary Non-Monetary Forward FX Net Financial Assets Assets Contracts Assets USD USD USD USD Brazilian Real 1,448 378,890 – 380,338 Chinese Renminbi 2,319 – – 2,319 Hong Kong Dollar 7,229 1,917,411 (6,656) 1,917,984 Hungarian Forint – 45,858 – 45,858 Indian Rupee 375 927,161 – 927,536 Indonesian Rupiah – 100,836 – 100,836 Mexican Peso – 616,885 – 616,885 Polish Zloty 7,632 142,293 – 149,925 Pound Sterling – 81,262 – 81,262 South African Rand (276) 628,274 276 628,274 South Korean Won – 1,357,378 – 1,357,378 Taiwan Dollar 5,082 1,385,156 – 1,390,238 Thailand Baht – 69,408 – 69,408 Turkish Yeni 9,492 127,070 (9,492) 127,070 UAE Dirham – 48,229 – 48,229 U.S. Dollar 44,174 561,301 15,825 621,300 77,475 8,387,412 (47) 8,464,840 Japanese Equity Fund Foreign Currency Exposure Monetary Non-Monetary Forward FX Net Financial Assets Assets Contracts Assets USD USD USD USD Japanese Yen (17,368) 20,433,676 178,454 20,594,762 U.S. Dollar 2,321,285 – (178,205) 2,143,080 2,303,917 20,433,676 249 22,737,842 Preferred Securities Fund Foreign Currency Exposure Monetary Non-Monetary Forward FX Net Financial Assets Assets Contracts Assets USD USD USD USD Euro 239,188 6,713,567 221,972,442 228,925,197 Japanese Yen – – 171,518,225 171,518,225 Pound Sterling 969,834 30,464,884 (16,431,118) 15,003,600 Swiss Franc – – 1,555,904 1,555,904 U.S. Dollar 81,600,594 1,639,188,926 (377,515,670) 1,343,273,850 82,809,616 1,676,367,377 1,099,783 1,760,276,776 U.S. Equity Fund Foreign Currency Exposure Monetary Non-Monetary Forward FX Net Financial Assets Assets Contracts Assets USD USD USD USD Pound Sterling 1,743 – (1,743) – U.S. Dollar 1,547,402 133,897,903 1,738 135,447,043 1,549,145 133,897,903 (5) 135,447,043
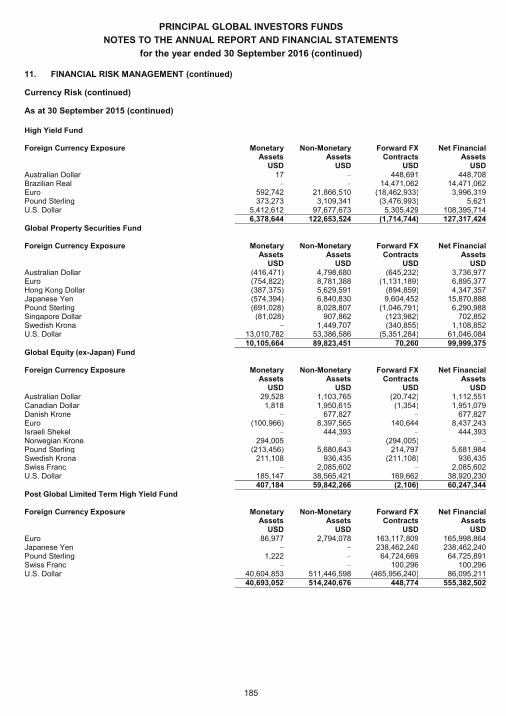
PRINCIPAL GLOBAL INVESTORS FUNDS
NOTES TO THE ANNUAL REPORT AND FINANCIAL STATEMENTS
for the year ended 30 September 2016 (continued)
185
11. FINANCIAL RISK MANAGEMENT (continued)
Currency Risk (continued)
As at 30 September 2015 (continued)
High Yield Fund Foreign Currency Exposure Monetary Non-Monetary Forward FX Net Financial Assets Assets Contracts Assets USD USD USD USD Australian Dollar 17 – 448,691 448,708 Brazilian Real – – 14,471,062 14,471,062 Euro 592,742 21,866,510 (18,462,933) 3,996,319 Pound Sterling 373,273 3,109,341 (3,476,993) 5,621 U.S. Dollar 5,412,612 97,677,673 5,305,429 108,395,714 6,378,644 122,653,524 (1,714,744) 127,317,424 Global Property Securities Fund Foreign Currency Exposure Monetary Non-Monetary Forward FX Net Financial Assets Assets Contracts Assets USD USD USD USD Australian Dollar (416,471) 4,798,680 (645,232) 3,736,977 Euro (754,822) 8,781,388 (1,131,189) 6,895,377 Hong Kong Dollar (387,375) 5,629,591 (894,859) 4,347,357 Japanese Yen (574,394) 6,840,830 9,604,452 15,870,888 Pound Sterling (691,028) 8,028,807 (1,046,791) 6,290,988 Singapore Dollar (81,028) 907,862 (123,982) 702,852 Swedish Krona – 1,449,707 (340,855) 1,108,852 U.S. Dollar 13,010,782 53,386,586 (5,351,284) 61,046,084 10,105,664 89,823,451 70,260 99,999,375 Global Equity (ex-Japan) Fund Foreign Currency Exposure Monetary Non-Monetary Forward FX Net Financial Assets Assets Contracts Assets USD USD USD USD Australian Dollar 29,528 1,103,765 (20,742) 1,112,551 Canadian Dollar 1,818 1,950,615 (1,354) 1,951,079 Danish Krone – 677,827 – 677,827 Euro (100,966) 8,397,565 140,644 8,437,243 Israeli Shekel – 444,393 – 444,393 Norwegian Krone 294,005 – (294,005) – Pound Sterling (213,456) 5,680,643 214,797 5,681,984 Swedish Krona 211,108 936,435 (211,108) 936,435 Swiss Franc – 2,085,602 – 2,085,602 U.S. Dollar 185,147 38,565,421 169,662 38,920,230 407,184 59,842,266 (2,106) 60,247,344 Post Global Limited Term High Yield Fund Foreign Currency Exposure Monetary Non-Monetary Forward FX Net Financial Assets Assets Contracts Assets USD USD USD USD Euro 86,977 2,794,078 163,117,809 165,998,864 Japanese Yen – – 238,462,240 238,462,240 Pound Sterling 1,222 – 64,724,669 64,725,891 Swiss Franc – – 100,296 100,296 U.S. Dollar 40,604,853 511,446,598 (465,956,240) 86,095,211 40,693,052 514,240,676 448,774 555,382,502
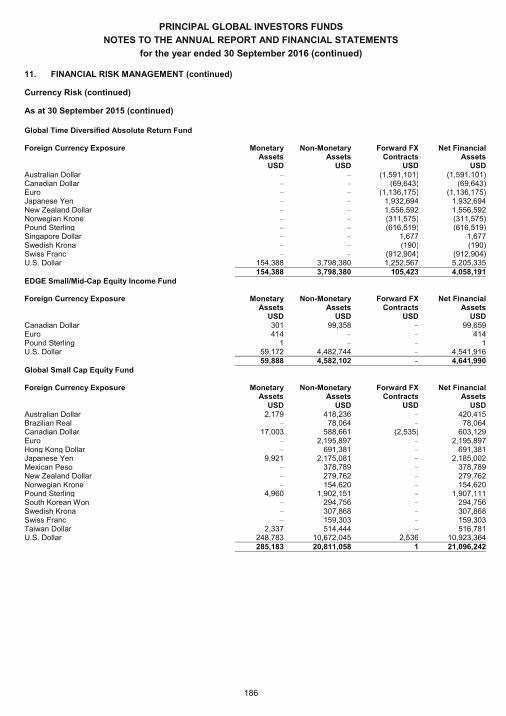
PRINCIPAL GLOBAL INVESTORS FUNDS
NOTES TO THE ANNUAL REPORT AND FINANCIAL STATEMENTS
for the year ended 30 September 2016 (continued)
186
11. FINANCIAL RISK MANAGEMENT (continued)
Currency Risk (continued)
As at 30 September 2015 (continued)
Global Time Diversified Absolute Return Fund Foreign Currency Exposure Monetary Non-Monetary Forward FX Net Financial Assets Assets Contracts Assets USD USD USD USD Australian Dollar – – (1,591,101) (1,591,101) Canadian Dollar – – (69,643) (69,643) Euro – – (1,136,175) (1,136,175) Japanese Yen – – 1,932,694 1,932,694 New Zealand Dollar – – 1,556,592 1,556,592 Norwegian Krone – – (311,575) (311,575) Pound Sterling – – (616,519) (616,519) Singapore Dollar – – 1,677 1,677 Swedish Krona – – (190) (190) Swiss Franc – – (912,904) (912,904) U.S. Dollar 154,388 3,798,380 1,252,567 5,205,335 154,388 3,798,380 105,423 4,058,191 EDGE Small/Mid-Cap Equity Income Fund Foreign Currency Exposure Monetary Non-Monetary Forward FX Net Financial Assets Assets Contracts Assets USD USD USD USD Canadian Dollar 301 99,358 – 99,659 Euro 414 – – 414 Pound Sterling 1 – – 1 U.S. Dollar 59,172 4,482,744 – 4,541,916 59,888 4,582,102 – 4,641,990 Global Small Cap Equity Fund Foreign Currency Exposure Monetary Non-Monetary Forward FX Net Financial Assets Assets Contracts Assets USD USD USD USD Australian Dollar 2,179 418,236 – 420,415 Brazilian Real – 78,064 – 78,064 Canadian Dollar 17,003 588,661 (2,535) 603,129 Euro – 2,195,897 – 2,195,897 Hong Kong Dollar – 691,381 – 691,381 Japanese Yen 9,921 2,175,081 – 2,185,002 Mexican Peso – 378,789 – 378,789 New Zealand Dollar – 279,762 – 279,762 Norwegian Krone – 154,620 – 154,620 Pound Sterling 4,960 1,902,151 – 1,907,111 South Korean Won – 294,756 – 294,756 Swedish Krona – 307,868 – 307,868 Swiss Franc – 159,303 – 159,303 Taiwan Dollar 2,337 514,444 – 516,781 U.S. Dollar 248,783 10,672,045 2,536 10,923,364 285,183 20,811,058 1 21,096,242
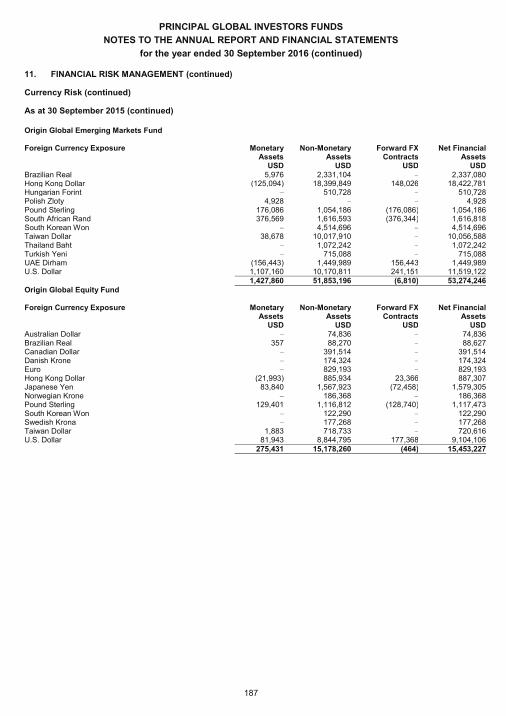
PRINCIPAL GLOBAL INVESTORS FUNDS
NOTES TO THE ANNUAL REPORT AND FINANCIAL STATEMENTS
for the year ended 30 September 2016 (continued)
187
11. FINANCIAL RISK MANAGEMENT (continued)
Currency Risk (continued)
As at 30 September 2015 (continued)
Origin Global Emerging Markets Fund Foreign Currency Exposure Monetary Non-Monetary Forward FX Net Financial Assets Assets Contracts Assets USD USD USD USD Brazilian Real 5,976 2,331,104 – 2,337,080 Hong Kong Dollar (125,094) 18,399,849 148,026 18,422,781 Hungarian Forint – 510,728 – 510,728 Polish Zloty 4,928 – – 4,928 Pound Sterling 176,086 1,054,186 (176,086) 1,054,186 South African Rand 376,569 1,616,593 (376,344) 1,616,818 South Korean Won – 4,514,696 – 4,514,696 Taiwan Dollar 38,678 10,017,910 – 10,056,588 Thailand Baht – 1,072,242 – 1,072,242 Turkish Yeni – 715,088 – 715,088 UAE Dirham (156,443) 1,449,989 156,443 1,449,989 U.S. Dollar 1,107,160 10,170,811 241,151 11,519,122 1,427,860 51,853,196 (6,810) 53,274,246 Origin Global Equity Fund Foreign Currency Exposure Monetary Non-Monetary Forward FX Net Financial Assets Assets Contracts Assets USD USD USD USD Australian Dollar – 74,836 – 74,836 Brazilian Real 357 88,270 – 88,627 Canadian Dollar – 391,514 – 391,514 Danish Krone – 174,324 – 174,324 Euro – 829,193 – 829,193 Hong Kong Dollar (21,993) 885,934 23,366 887,307 Japanese Yen 83,840 1,567,923 (72,458) 1,579,305 Norwegian Krone – 186,368 – 186,368 Pound Sterling 129,401 1,116,812 (128,740) 1,117,473 South Korean Won – 122,290 – 122,290 Swedish Krona – 177,268 – 177,268 Taiwan Dollar 1,883 718,733 – 720,616 U.S. Dollar 81,943 8,844,795 177,368 9,104,106 275,431 15,178,260 (464) 15,453,227
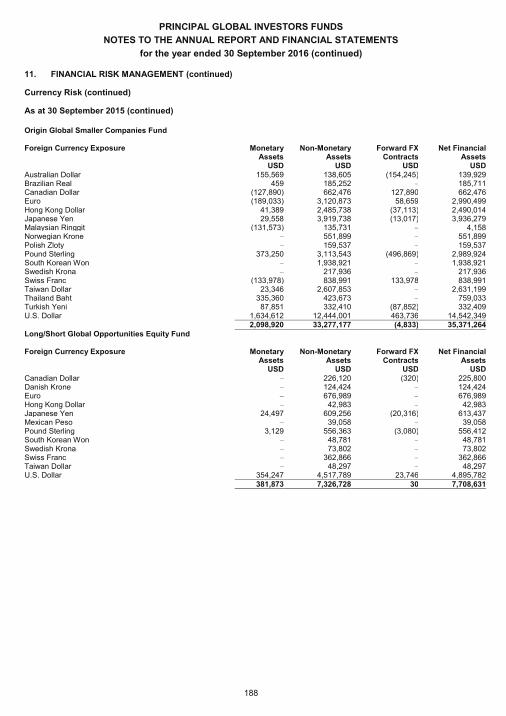
PRINCIPAL GLOBAL INVESTORS FUNDS
NOTES TO THE ANNUAL REPORT AND FINANCIAL STATEMENTS
for the year ended 30 September 2016 (continued)
188
11. FINANCIAL RISK MANAGEMENT (continued)
Currency Risk (continued)
As at 30 September 2015 (continued)
Origin Global Smaller Companies Fund Foreign Currency Exposure Monetary Non-Monetary Forward FX Net Financial Assets Assets Contracts Assets USD USD USD USD Australian Dollar 155,569 138,605 (154,245) 139,929 Brazilian Real 459 185,252 – 185,711 Canadian Dollar (127,890) 662,476 127,890 662,476 Euro (189,033) 3,120,873 58,659 2,990,499 Hong Kong Dollar 41,389 2,485,738 (37,113) 2,490,014 Japanese Yen 29,558 3,919,738 (13,017) 3,936,279 Malaysian Ringgit (131,573) 135,731 – 4,158 Norwegian Krone – 551,899 – 551,899 Polish Zloty – 159,537 – 159,537 Pound Sterling 373,250 3,113,543 (496,869) 2,989,924 South Korean Won – 1,938,921 – 1,938,921 Swedish Krona – 217,936 – 217,936 Swiss Franc (133,978) 838,991 133,978 838,991 Taiwan Dollar 23,346 2,607,853 – 2,631,199 Thailand Baht 335,360 423,673 – 759,033 Turkish Yeni 87,851 332,410 (87,852) 332,409 U.S. Dollar 1,634,612 12,444,001 463,736 14,542,349 2,098,920 33,277,177 (4,833) 35,371,264 Long/Short Global Opportunities Equity Fund Foreign Currency Exposure Monetary Non-Monetary Forward FX Net Financial Assets Assets Contracts Assets USD USD USD USD Canadian Dollar – 226,120 (320) 225,800 Danish Krone – 124,424 – 124,424 Euro – 676,989 – 676,989 Hong Kong Dollar – 42,983 – 42,983 Japanese Yen 24,497 609,256 (20,316) 613,437 Mexican Peso – 39,058 – 39,058 Pound Sterling 3,129 556,363 (3,080) 556,412 South Korean Won – 48,781 – 48,781 Swedish Krona – 73,802 – 73,802 Swiss Franc – 362,866 – 362,866 Taiwan Dollar – 48,297 – 48,297 U.S. Dollar 354,247 4,517,789 23,746 4,895,782 381,873 7,326,728 30 7,708,631
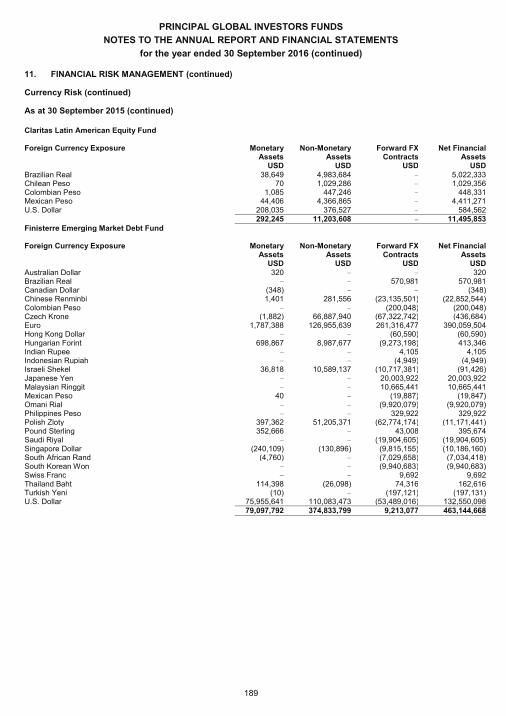
PRINCIPAL GLOBAL INVESTORS FUNDS
NOTES TO THE ANNUAL REPORT AND FINANCIAL STATEMENTS
for the year ended 30 September 2016 (continued)
189
11. FINANCIAL RISK MANAGEMENT (continued)
Currency Risk (continued)
As at 30 September 2015 (continued)
Claritas Latin American Equity Fund Foreign Currency Exposure Monetary Non-Monetary Forward FX Net Financial Assets Assets Contracts Assets USD USD USD USD Brazilian Real 38,649 4,983,684 – 5,022,333 Chilean Peso 70 1,029,286 – 1,029,356 Colombian Peso 1,085 447,246 – 448,331 Mexican Peso 44,406 4,366,865 – 4,411,271 U.S. Dollar 208,035 376,527 – 584,562 292,245 11,203,608 – 11,495,853 Finisterre Emerging Market Debt Fund Foreign Currency Exposure Monetary Non-Monetary Forward FX Net Financial Assets Assets Contracts Assets USD USD USD USD Australian Dollar 320 – – 320 Brazilian Real – – 570,981 570,981 Canadian Dollar (348) – – (348) Chinese Renminbi 1,401 281,556 (23,135,501) (22,852,544) Colombian Peso – – (200,048) (200,048) Czech Krone (1,882) 66,887,940 (67,322,742) (436,684) Euro 1,787,388 126,955,639 261,316,477 390,059,504 Hong Kong Dollar – – (60,590) (60,590) Hungarian Forint 698,867 8,987,677 (9,273,198) 413,346 Indian Rupee – – 4,105 4,105 Indonesian Rupiah – – (4,949) (4,949) Israeli Shekel 36,818 10,589,137 (10,717,381) (91,426) Japanese Yen – – 20,003,922 20,003,922 Malaysian Ringgit – – 10,665,441 10,665,441 Mexican Peso 40 – (19,887) (19,847) Omani Rial – – (9,920,079) (9,920,079) Philippines Peso – – 329,922 329,922 Polish Zloty 397,362 51,205,371 (62,774,174) (11,171,441) Pound Sterling 352,666 – 43,008 395,674 Saudi Riyal – – (19,904,605) (19,904,605) Singapore Dollar (240,109) (130,896) (9,815,155) (10,186,160) South African Rand (4,760) – (7,029,658) (7,034,418) South Korean Won – – (9,940,683) (9,940,683) Swiss Franc – – 9,692 9,692 Thailand Baht 114,398 (26,098) 74,316 162,616 Turkish Yeni (10) – (197,121) (197,131) U.S. Dollar 75,955,641 110,083,473 (53,489,016) 132,550,098 79,097,792 374,833,799 9,213,077 463,144,668
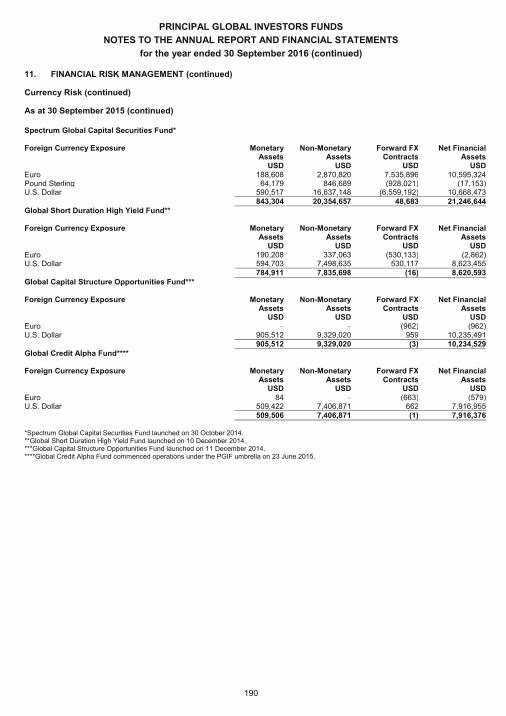
PRINCIPAL GLOBAL INVESTORS FUNDS
NOTES TO THE ANNUAL REPORT AND FINANCIAL STATEMENTS
for the year ended 30 September 2016 (continued)
190
11. FINANCIAL RISK MANAGEMENT (continued)
Currency Risk (continued)
As at 30 September 2015 (continued)
Spectrum Global Capital Securities Fund* Foreign Currency Exposure Monetary Non-Monetary Forward FX Net Financial Assets Assets Contracts Assets USD USD USD USD Euro 188,608 2,870,820 7,535,896 10,595,324 Pound Sterling 64,179 846,689 (928,021) (17,153) U.S. Dollar 590,517 16,637,148 (6,559,192) 10,668,473 843,304 20,354,657 48,683 21,246,644 Global Short Duration High Yield Fund** Foreign Currency Exposure Monetary Non-Monetary Forward FX Net Financial Assets Assets Contracts Assets USD USD USD USD Euro 190,208 337,063 (530,133) (2,862) U.S. Dollar 594,703 7,498,635 530,117 8,623,455 784,911 7,835,698 (16) 8,620,593 Global Capital Structure Opportunities Fund*** Foreign Currency Exposure Monetary Non-Monetary Forward FX Net Financial Assets Assets Contracts Assets USD USD USD USD Euro – – (962) (962) U.S. Dollar 905,512 9,329,020 959 10,235,491 905,512 9,329,020 (3) 10,234,529 Global Credit Alpha Fund**** Foreign Currency Exposure Monetary Non-Monetary Forward FX Net Financial Assets Assets Contracts Assets USD USD USD USD Euro 84 – (663) (579) U.S. Dollar 509,422 7,406,871 662 7,916,955 509,506 7,406,871 (1) 7,916,376
*Spectrum Global Capital Securities Fund launched on 30 October 2014. **Global Short Duration High Yield Fund launched on 10 December 2014. ***Global Capital Structure Opportunities Fund launched on 11 December 2014. ****Global Credit Alpha Fund commenced operations under the PGIF umbrella on 23 June 2015.
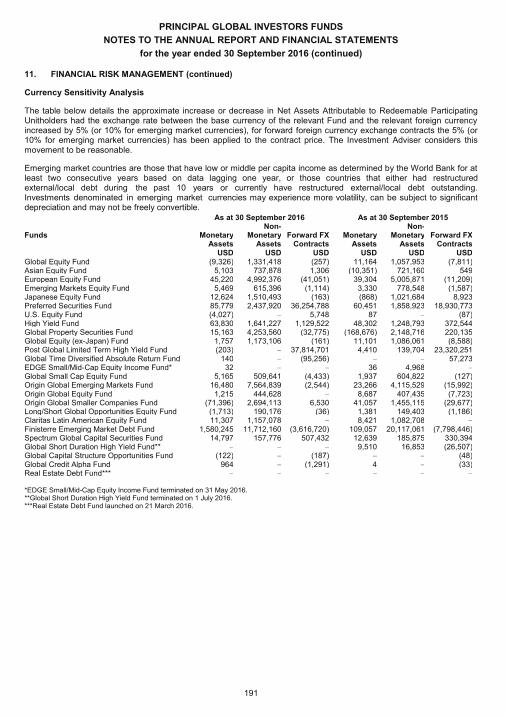
PRINCIPAL GLOBAL INVESTORS FUNDS
NOTES TO THE ANNUAL REPORT AND FINANCIAL STATEMENTS
for the year ended 30 September 2016 (continued)
191
11. FINANCIAL RISK MANAGEMENT (continued)
Currency Sensitivity Analysis
The table below details the approximate increase or decrease in Net Assets Attributable to Redeemable Participating Unitholders had the exchange rate between the base currency of the relevant Fund and the relevant foreign currency increased by 5% (or 10% for emerging market currencies), for forward foreign currency exchange contracts the 5% (or 10% for emerging market currencies) has been applied to the contract price. The Investment Adviser considers this movement to be reasonable.
Emerging market countries are those that have low or middle per capita income as determined by the World Bank for at least two consecutive years based on data lagging one year, or those countries that either had restructured external/local debt during the past 10 years or currently have restructured external/local debt outstanding. Investments denominated in emerging market currencies may experience more volatility, can be subject to significant depreciation and may not be freely convertible.
As at 30 September 2016 As at 30 September 2015
Funds Monetary Non-
Monetary Forward FX Monetary Non-
Monetary Forward FX Assets Assets Contracts Assets Assets Contracts USD USD USD USD USD USD Global Equity Fund (9,326) 1,331,418 (257) 11,164 1,057,953 (7,811) Asian Equity Fund 5,103 737,878 1,306 (10,351) 721,160 549 European Equity Fund 45,220 4,992,376 (41,051) 39,304 5,005,871 (11,209) Emerging Markets Equity Fund 5,469 615,396 (1,114) 3,330 778,548 (1,587) Japanese Equity Fund 12,624 1,510,493 (163) (868) 1,021,684 8,923 Preferred Securities Fund 85,779 2,437,920 36,254,788 60,451 1,858,923 18,930,773 U.S. Equity Fund (4,027) – 5,748 87 – (87) High Yield Fund 63,830 1,641,227 1,129,522 48,302 1,248,793 372,544 Global Property Securities Fund 15,163 4,253,560 (32,775) (168,676) 2,148,716 220,135 Global Equity (ex-Japan) Fund 1,757 1,173,106 (161) 11,101 1,086,061 (8,588) Post Global Limited Term High Yield Fund (203) – 37,814,701 4,410 139,704 23,320,251 Global Time Diversified Absolute Return Fund 140 – (95,256) – – 57,273 EDGE Small/Mid-Cap Equity Income Fund* 32 – – 36 4,968 – Global Small Cap Equity Fund 5,165 509,641 (4,433) 1,937 604,822 (127) Origin Global Emerging Markets Fund 16,480 7,564,839 (2,544) 23,266 4,115,529 (15,992) Origin Global Equity Fund 1,215 444,628 – 8,687 407,435 (7,723) Origin Global Smaller Companies Fund (71,396) 2,694,113 6,530 41,057 1,455,115 (29,677) Long/Short Global Opportunities Equity Fund (1,713) 190,176 (36) 1,381 149,403 (1,186) Claritas Latin American Equity Fund 11,307 1,157,078 – 8,421 1,082,708 – Finisterre Emerging Market Debt Fund 1,580,245 11,712,160 (3,616,720) 109,057 20,117,061 (7,798,446) Spectrum Global Capital Securities Fund 14,797 157,776 507,432 12,639 185,875 330,394 Global Short Duration High Yield Fund** – – – 9,510 16,853 (26,507) Global Capital Structure Opportunities Fund (122) – (187) – – (48) Global Credit Alpha Fund 964 – (1,291) 4 – (33) Real Estate Debt Fund*** – – – – – –
*EDGE Small/Mid-Cap Equity Income Fund terminated on 31 May 2016. **Global Short Duration High Yield Fund terminated on 1 July 2016. ***Real Estate Debt Fund launched on 21 March 2016.

PRINCIPAL GLOBAL INVESTORS FUNDS
NOTES TO THE ANNUAL REPORT AND FINANCIAL STATEMENTS
for the year ended 30 September 2016 (continued)
192
11. FINANCIAL RISK MANAGEMENT (continued)
Depositary Risk
The Trust’s Depositary is the Bank of New York Mellon Trust Company (Ireland) Limited (“the Depositary”). Substantially all of the Cash at Bank and investments in debt securities of the Trust are held by the Depositary. The Trust is exposed to credit risk through the use of the Depositary for their cash and investments. Bankruptcy or insolvency of the Depositary may cause the Trust’s rights with respect to its cash and investments in debt securities held by the Depositary to be delayed or limited. The maximum exposure to this risk at 30 September 2016 and 30 September 2015 is the amount of Cash at Bank disclosed in Note 4 and the investments in securities, liquidity instruments and forward foreign currency exchange contracts disclosed in the relevant Funds’ Portfolio of Investments.
To mitigate the risks the Trust is exposed to from the use of the Depositary, the Manager employs appropriate procedures to ensure that the counterparties are reputable institutions and that the credit risk is acceptable to the Trust. The Trust only transacts with Depositary’s that are regulated entities subject to prudential supervision, or with high credit-ratings assigned by international credit-rating agencies. In addition, the Trust’s non-cash assets are maintained by the Depositary in segregated accounts. Thus in the event of insolvency or bankruptcy of the Depositary the Trust’s non-cash assets are segregated and protected and this further reduces counterparty risk. The Trust will, however, be exposed to the credit risk of the Depositary or counterparty/Sub-Custodian used by the Depositary, in relation to the Trust's Cash at Bank held by the Depositary. In the event of the insolvency or bankruptcy of the Depositary, the Trust will be treated as a general creditor of the Depositary in relation to cash holdings of the Trust. To mitigate these risks the Investment Adviser ensures that the Trust transacts only with Depositary’s that are regulated entities subject to prudential supervision or with high credit-ratings assigned by international credit-rating agencies.
Credit Risk
The Funds will be exposed to credit risk, which is the risk that a counterparty or issuer will be unable to pay amounts in full when due. Impairment provisions are provided for losses that have been incurred by the Statement of Financial Position date, if any. The carrying amount of financial assets best represents its maximum exposure to credit risk at the reporting date.
The Funds’ main credit risk concentrations arise from trading equity and debt securities and FDIs in addition to Cash at Bank balances held at the Depositary, Trustee and other counterparties. The Funds’ Prospectus lists various investment restrictions with regard to issuer and counterparty concentration limits.
All transactions in listed securities are settled/paid for upon delivery using approved brokers. The risk of default is considered minimal, as delivery of securities sold is only made once the broker has received payment. Payment is made on a purchase once the securities have been received by the broker. The trade will fail if either party fails to meet their obligation.
Interest Rate Swaps may be traded bilaterally between a Fund and a counterparty or centrally cleared through a central counterparty clearing house ("CCP"). The Funds that engage in swaps trading bilaterally restrict their exposure to credit losses on the trading of derivative instruments held by entering into master netting arrangements with counterparties. Netting arrangements do not result in an offset of Statement of Financial Position assets and liabilities, as transactions are usually disclosed on a gross basis and settled on a net basis. However, the credit risk associated with favourable contracts is reduced by a netting arrangement to the extent that if an event of default occurs, all amounts with the counterparty are terminated and settled on a net basis. The Funds that engage in swaps trading through a CCP restrict their exposure to credit losses on the trading of derivative instruments held by entering into master netting arrangements with the CCP. The CCPs at the 30 September 2016 are Barclays, Citigroup, Goldman Sachs and HSBC.
The Investment Adviser may utilise over-the-counter and exchange traded derivatives. Derivatives traded on exchanges will usually be supported by daily margin calls and therefore not carry the same degree of counterparty risk.
The Investment Adviser may use Futures and Options as part of its investment strategy. The Funds’ ability to use these strategies may be limited by market conditions, regulatory requirements and tax considerations.
As part of its investing in derivatives the Funds may pledge or receive collateral. This collateral can be pledged or received either in the form of cash and cash equivalents or securities. There is a risk that the value of such collateral may fall below the value of the underlying derivatives. In addition, as the Funds may invest in Cash Collateral received, subject to conditions, the Funds may be exposed to the risk associated with such investments, such as failure or default of the issuer of the relevant security.
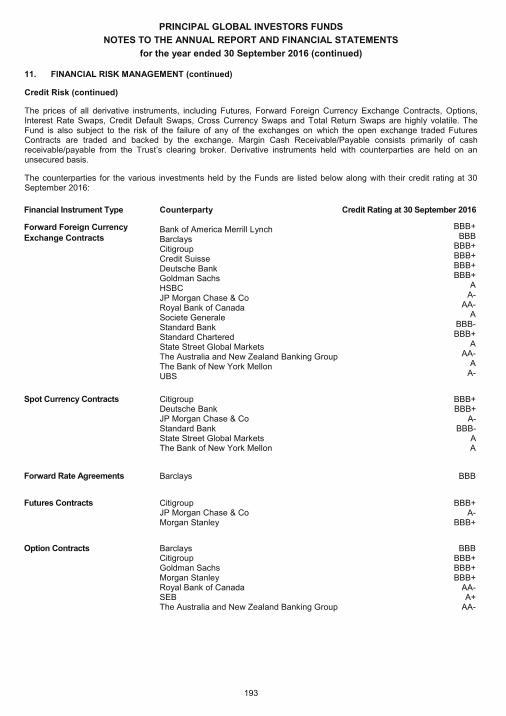
PRINCIPAL GLOBAL INVESTORS FUNDS
NOTES TO THE ANNUAL REPORT AND FINANCIAL STATEMENTS
for the year ended 30 September 2016 (continued)
193
11. FINANCIAL RISK MANAGEMENT (continued)
Credit Risk (continued)
The prices of all derivative instruments, including Futures, Forward Foreign Currency Exchange Contracts, Options, Interest Rate Swaps, Credit Default Swaps, Cross Currency Swaps and Total Return Swaps are highly volatile. The Fund is also subject to the risk of the failure of any of the exchanges on which the open exchange traded Futures Contracts are traded and backed by the exchange. Margin Cash Receivable/Payable consists primarily of cash receivable/payable from the Trust’s clearing broker. Derivative instruments held with counterparties are held on an unsecured basis.
The counterparties for the various investments held by the Funds are listed below along with their credit rating at 30 September 2016:
Financial Instrument Type
Forward Foreign Currency
Exchange Contracts
Counterparty Bank of America Merrill Lynch Barclays Citigroup Credit Suisse Deutsche Bank Goldman Sachs HSBC JP Morgan Chase & Co Royal Bank of Canada Societe Generale Standard Bank Standard Chartered State Street Global Markets The Australia and New Zealand Banking Group The Bank of New York Mellon UBS
Credit Rating at 30 September 2016
BBB+ BBB
BBB+ BBB+ BBB+ BBB+
A A-
AA- A
BBB- BBB+
A AA-
A A-
Spot Currency Contracts Citigroup Deutsche Bank JP Morgan Chase & Co Standard Bank State Street Global Markets The Bank of New York Mellon
BBB+ BBB+
A- BBB-
A A
Forward Rate Agreements Barclays
BBB
Futures Contracts Citigroup JP Morgan Chase & Co Morgan Stanley
BBB+ A-
BBB+
Option Contracts Barclays Citigroup Goldman Sachs Morgan Stanley Royal Bank of Canada SEB The Australia and New Zealand Banking Group
BBB BBB+ BBB+ BBB+
AA- A+
AA-
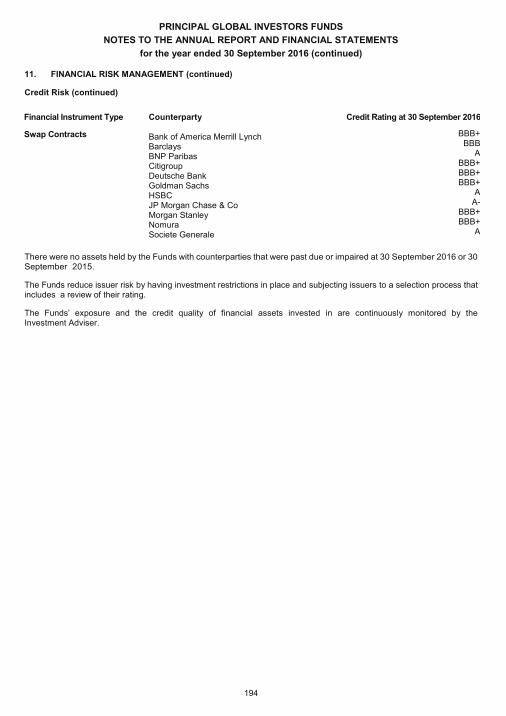
PRINCIPAL GLOBAL INVESTORS FUNDS
NOTES TO THE ANNUAL REPORT AND FINANCIAL STATEMENTS
for the year ended 30 September 2016 (continued)
194
11. FINANCIAL RISK MANAGEMENT (continued)
Credit Risk (continued)
Financial Instrument Type
Swap Contracts
Counterparty Bank of America Merrill Lynch Barclays BNP Paribas Citigroup Deutsche Bank Goldman Sachs HSBC JP Morgan Chase & Co Morgan Stanley Nomura Societe Generale
Credit Rating at 30 September 2016
BBB+ BBB
A BBB+ BBB+ BBB+
A A-
BBB+ BBB+
A
There were no assets held by the Funds with counterparties that were past due or impaired at 30 September 2016 or 30 September 2015.
The Funds reduce issuer risk by having investment restrictions in place and subjecting issuers to a selection process that includes a review of their rating.
The Funds’ exposure and the credit quality of financial assets invested in are continuously monitored by the Investment Adviser.
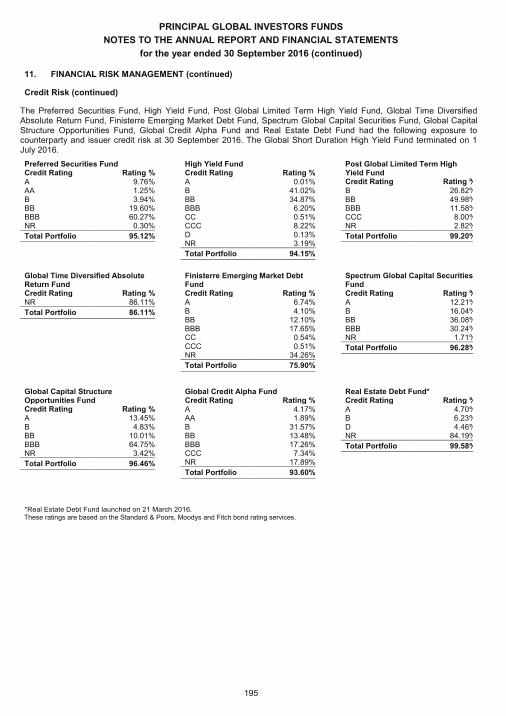
PRINCIPAL GLOBAL INVESTORS FUNDS
NOTES TO THE ANNUAL REPORT AND FINANCIAL STATEMENTS
for the year ended 30 September 2016 (continued)
195
11. FINANCIAL RISK MANAGEMENT (continued)
Credit Risk (continued)
The Preferred Securities Fund, High Yield Fund, Post Global Limited Term High Yield Fund, Global Time Diversified Absolute Return Fund, Finisterre Emerging Market Debt Fund, Spectrum Global Capital Securities Fund, Global Capital Structure Opportunities Fund, Global Credit Alpha Fund and Real Estate Debt Fund had the following exposure to counterparty and issuer credit risk at 30 September 2016. The Global Short Duration High Yield Fund terminated on 1 July 2016.
Preferred Securities Fund Credit Rating Rating % A 9.76% AA 1.25% B 3.94% BB 19.60% BBB 60.27% NR 0.30%
Total Portfolio 95.12%
High Yield Fund Credit Rating Rating % A 0.01% B 41.02% BB 34.87% BBB 6.20% CC 0.51% CCC 8.22% D 0.13% NR 3.19%
Total Portfolio 94.15%
Post Global Limited Term High Yield Fund Credit Rating Rating % B 26.82% BB 49.98% BBB 11.58% CCC 8.00% NR 2.82%
Total Portfolio 99.20%
Global Time Diversified Absolute Return Fund Credit Rating Rating % NR 86.11%
Total Portfolio 86.11%
Finisterre Emerging Market Debt Fund Credit Rating Rating % A 6.74% B 4.10% BB 12.10% BBB 17.65% CC 0.54% CCC 0.51% NR 34.26%
Total Portfolio 75.90%
Spectrum Global Capital Securities Fund Credit Rating Rating % A 12.21% B 16.04% BB 36.08% BBB 30.24% NR 1.71%
Total Portfolio 96.28%
Global Capital Structure Opportunities Fund Credit Rating Rating % A 13.45% B 4.83% BB 10.01% BBB 64.75% NR 3.42%
Total Portfolio 96.46%
Global Credit Alpha Fund Credit Rating Rating % A 4.17% AA 1.89% B 31.57% BB 13.48% BBB 17.26% CCC 7.34% NR 17.89%
Total Portfolio 93.60%
Real Estate Debt Fund* Credit Rating Rating % A 4.70% B 6.23% D 4.46% NR 84.19%
Total Portfolio 99.58%
*Real Estate Debt Fund launched on 21 March 2016. These ratings are based on the Standard & Poors, Moodys and Fitch bond rating services.
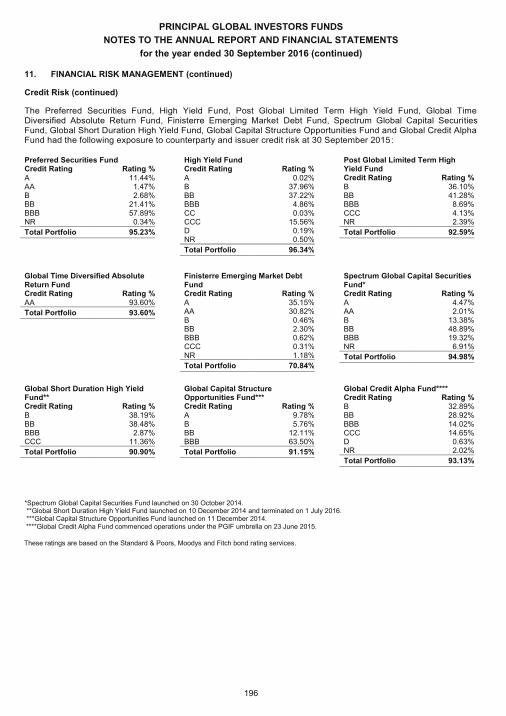
PRINCIPAL GLOBAL INVESTORS FUNDS
NOTES TO THE ANNUAL REPORT AND FINANCIAL STATEMENTS
for the year ended 30 September 2016 (continued)
196
11. FINANCIAL RISK MANAGEMENT (continued)
Credit Risk (continued)
The Preferred Securities Fund, High Yield Fund, Post Global Limited Term High Yield Fund, Global Time Diversified Absolute Return Fund, Finisterre Emerging Market Debt Fund, Spectrum Global Capital Securities Fund, Global Short Duration High Yield Fund, Global Capital Structure Opportunities Fund and Global Credit Alpha Fund had the following exposure to counterparty and issuer credit risk at 30 September 2015:
Preferred Securities Fund Credit Rating Rating % A 11.44% AA 1.47% B 2.68% BB 21.41% BBB 57.89% NR 0.34%
Total Portfolio 95.23%
High Yield Fund Credit Rating Rating % A 0.02% B 37.96% BB 37.22% BBB 4.86% CC 0.03% CCC 15.56% D 0.19% NR 0.50%
Total Portfolio 96.34%
Post Global Limited Term High Yield Fund Credit Rating Rating % B 36.10% BB 41.28% BBB 8.69% CCC 4.13% NR 2.39%
Total Portfolio 92.59%
Global Time Diversified Absolute Return Fund Credit Rating Rating % AA 93.60%
Total Portfolio 93.60%
Finisterre Emerging Market Debt Fund Credit Rating Rating % A 35.15% AA 30.82% B 0.46% BB 2.30% BBB 0.62% CCC 0.31% NR 1.18%
Total Portfolio 70.84%
Spectrum Global Capital Securities Fund* Credit Rating Rating % A 4.47% AA 2.01% B 13.38% BB 48.89% BBB 19.32% NR 6.91%
Total Portfolio 94.98%
Global Short Duration High Yield Fund** Credit Rating Rating % B 38.19% BB 38.48% BBB 2.87% CCC 11.36%
Total Portfolio 90.90%
Global Capital Structure Opportunities Fund*** Credit Rating Rating % A 9.78% B 5.76% BB 12.11% BBB 63.50%
Total Portfolio 91.15%
Global Credit Alpha Fund**** Credit Rating Rating % B 32.89% BB 28.92% BBB 14.02% CCC 14.65% D 0.63% NR 2.02%
Total Portfolio 93.13%
*Spectrum Global Capital Securities Fund launched on 30 October 2014. **Global Short Duration High Yield Fund launched on 10 December 2014 and terminated on 1 July 2016. ***Global Capital Structure Opportunities Fund launched on 11 December 2014. ****Global Credit Alpha Fund commenced operations under the PGIF umbrella on 23 June 2015. These ratings are based on the Standard & Poors, Moodys and Fitch bond rating services.
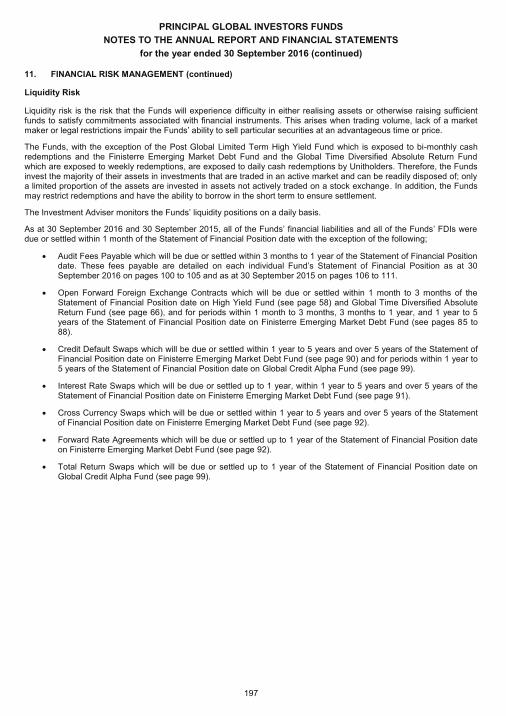
PRINCIPAL GLOBAL INVESTORS FUNDS
NOTES TO THE ANNUAL REPORT AND FINANCIAL STATEMENTS
for the year ended 30 September 2016 (continued)
197
11. FINANCIAL RISK MANAGEMENT (continued)
Liquidity Risk
Liquidity risk is the risk that the Funds will experience difficulty in either realising assets or otherwise raising sufficient funds to satisfy commitments associated with financial instruments. This arises when trading volume, lack of a market maker or legal restrictions impair the Funds’ ability to sell particular securities at an advantageous time or price.
The Funds, with the exception of the Post Global Limited Term High Yield Fund which is exposed to bi-monthly cash redemptions and the Finisterre Emerging Market Debt Fund and the Global Time Diversified Absolute Return Fund which are exposed to weekly redemptions, are exposed to daily cash redemptions by Unitholders. Therefore, the Funds invest the majority of their assets in investments that are traded in an active market and can be readily disposed of; only a limited proportion of the assets are invested in assets not actively traded on a stock exchange. In addition, the Funds may restrict redemptions and have the ability to borrow in the short term to ensure settlement.
The Investment Adviser monitors the Funds’ liquidity positions on a daily basis.
As at 30 September 2016 and 30 September 2015, all of the Funds’ financial liabilities and all of the Funds’ FDIs were due or settled within 1 month of the Statement of Financial Position date with the exception of the following;
· Audit Fees Payable which will be due or settled within 3 months to 1 year of the Statement of Financial Position date. These fees payable are detailed on each individual Fund’s Statement of Financial Position as at 30 September 2016 on pages 100 to 105 and as at 30 September 2015 on pages 106 to 111.
· Open Forward Foreign Exchange Contracts which will be due or settled within 1 month to 3 months of the Statement of Financial Position date on High Yield Fund (see page 58) and Global Time Diversified Absolute Return Fund (see page 66), and for periods within 1 month to 3 months, 3 months to 1 year, and 1 year to 5 years of the Statement of Financial Position date on Finisterre Emerging Market Debt Fund (see pages 85 to 88).
· Credit Default Swaps which will be due or settled within 1 year to 5 years and over 5 years of the Statement of Financial Position date on Finisterre Emerging Market Debt Fund (see page 90) and for periods within 1 year to 5 years of the Statement of Financial Position date on Global Credit Alpha Fund (see page 99).
· Interest Rate Swaps which will be due or settled up to 1 year, within 1 year to 5 years and over 5 years of the Statement of Financial Position date on Finisterre Emerging Market Debt Fund (see page 91).
· Cross Currency Swaps which will be due or settled within 1 year to 5 years and over 5 years of the Statement of Financial Position date on Finisterre Emerging Market Debt Fund (see page 92).
· Forward Rate Agreements which will be due or settled up to 1 year of the Statement of Financial Position date on Finisterre Emerging Market Debt Fund (see page 92).
· Total Return Swaps which will be due or settled up to 1 year of the Statement of Financial Position date on Global Credit Alpha Fund (see page 99).
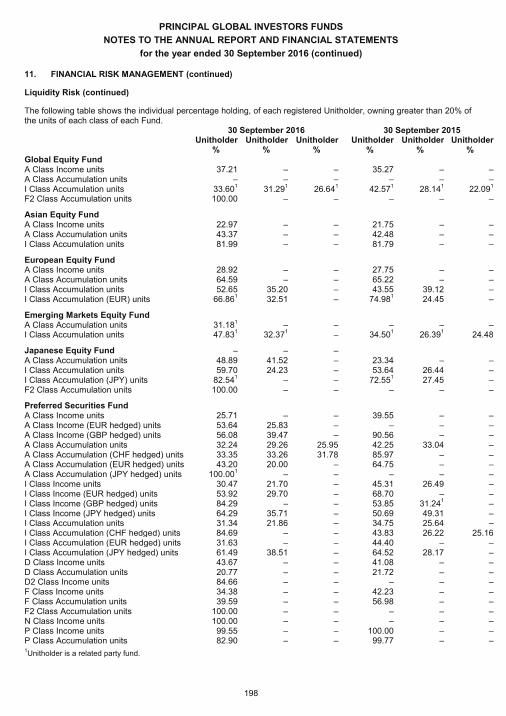
PRINCIPAL GLOBAL INVESTORS FUNDS
NOTES TO THE ANNUAL REPORT AND FINANCIAL STATEMENTS
for the year ended 30 September 2016 (continued)
198
11. FINANCIAL RISK MANAGEMENT (continued)
Liquidity Risk (continued)
The following table shows the individual percentage holding, of each registered Unitholder, owning greater than 20% of the units of each class of each Fund.
30 September 2016 30 September 2015 Unitholder
1 Unitholder
2 Unitholder
3 Unitholder
1 Unitholder
2 Unitholder
3 % % % % % %
Global Equity Fund A Class Income units 37.21 – – 35.27 – – A Class Accumulation units – – – – – – I Class Accumulation units 33.60
1 31.291 26.64
1 42.571 28.14
1 22.09
1
F2 Class Accumulation units 100.00 – – – – –
Asian Equity Fund A Class Income units 22.97 – – 21.75 – – A Class Accumulation units 43.37 – – 42.48 – – I Class Accumulation units 81.99 – – 81.79 – –
European Equity Fund A Class Income units 28.92 – – 27.75 – – A Class Accumulation units 64.59 – – 65.22 – – I Class Accumulation units 52.65 35.20 – 43.55 39.12 – I Class Accumulation (EUR) units 66.86
1 32.51 – 74.981 24.45 –
Emerging Markets Equity Fund A Class Accumulation units 31.18
1 – – – – – I Class Accumulation units 47.83
1 32.371 – 34.50
1 26.39
1 24.48
Japanese Equity Fund – – – A Class Accumulation units 48.89 41.52 – 23.34 – – I Class Accumulation units 59.70 24.23 – 53.64 26.44 – I Class Accumulation (JPY) units 82.54
1 – – 72.551 27.45 –
F2 Class Accumulation units 100.00 – – – – –
Preferred Securities Fund A Class Income units 25.71 – – 39.55 – – A Class Income (EUR hedged) units 53.64 25.83 – – – – A Class Income (GBP hedged) units 56.08 39.47 – 90.56 – – A Class Accumulation units 32.24 29.26 25.95 42.25 33.04 –
- A Class Accumulation (CHF hedged) units 33.35 33.26 31.78 85.97 – – A Class Accumulation (EUR hedged) units unitsunits
43.20 20.00 – 64.75 – – A Class Accumulation (JPY hedged) units 100.00
1 – – – – – I Class Income units 30.47 21.70 – 45.31 26.49 –
- I Class Income (EUR hedged) units 53.92 29.70 – 68.70 – – I Class Income (GBP hedged) units 84.29 – – 53.85 31.24
1 –
I Class Income (JPY hedged) units 64.29 35.71 – 50.69 49.31 – I Class Accumulation units 31.34 21.86 – 34.75 25.64 – I Class Accumulation (CHF hedged) units 84.69 – – 43.83 26.22 25.16 I Class Accumulation (EUR hedged) units 31.63 – – 44.40 – – I Class Accumulation (JPY hedged) units 61.49 38.51 – 64.52 28.17 –
- D Class Income units 43.67 – – 41.08 – – D Class Accumulation units 20.77 – – 21.72 – – D2 Class Income units 84.66 – – – – – F Class Income units 34.38 – – 42.23 – – F Class Accumulation units 39.59 – – 56.98 – – F2 Class Accumulation units 100.00 – – – – – N Class Income units 100.00 – – – – – P Class Income units 99.55 – – 100.00 – – P Class Accumulation units 82.90 – – 99.77 – – 1Unitholder is a related party fund.

PRINCIPAL GLOBAL INVESTORS FUNDS
NOTES TO THE ANNUAL REPORT AND FINANCIAL STATEMENTS
for the year ended 30 September 2016 (continued)
199
11. FINANCIAL RISK MANAGEMENT (continued)
Liquidity Risk (continued)
30 September 2016 30 September 2015 Unitholder
1 Unitholder
2 Unitholder
3 Unitholder
1 Unitholder
2 Unitholder
3 % % % % % %
U.S. Equity Fund A Class Accumulation units 79.23 – – 62.21 – – I Class Accumulation units 53.59 32.07 – 44.41 31.75 –
- I Class Accumulation (GBP) units 100.00 – – 100.00 – – High Yield Fund A Class Income units 63.55 – – 99.71 – – A Class Income (AUD hedged) units 85.09 – – 87.43 – – A Class Accumulation units – – – 23.11 – – I Class Accumulation units 60.32
1 – – 49.56 – – I Class Accumulation (BRL hedged) units 100.00
1 – – 100.00 – – I Class Accumulation (EUR hedged) units 67.47 27.51 – 61.66 26.02 – D Class Accumulation units 56.89 – – 31.82 – – F Class Accumulation units 93.54 – – – – –
Global Property Securities Fund I Class Income (JPY hedged) units 100.00 – – 100.00 – – I Class Accumulation units 35.44 24.28 – 48.78
1 43.90 –
I Class Accumulation (USD hedged) units 60.661 – – 56.39
1 22.49
1 –
I2 Class Income units 100.00 – – 100.00 – – F Class Accumulation units 100.00 – – – – –
Global Equity (ex-Japan) Fund I Class Accumulation units 100.00 – – 100.00 – – I Class Accumulation (JPY) units 100.00
1 – – 100.001 – –
Post Global Limited Term High Yield Fund A Class Income units 100.00 – – – – – A Class Accumulation units 100.00 – – – – – I Class Income (EUR hedged) units 100.00 – – – – – I Class Income (GBP hedged) units 74.61 25.39 – – – – I Class Accumulation units 43.49 24.16 21.07 69.26 – – I Class Accumulation (CHF hedged) units 53.62 46.38 – 100.00 – – I Class Accumulation (EUR hedged) units 43.09 25.70 – 33.46 22.45 20.65 I Class Accumulation (GBP hedged) units 95.47 – – 42.58 40.09 – I Class Accumulation (JPY hedged) units 45.81 41.32 – 44.66 42.78 – I Class Accumulation (SGD hedged) units 75.05 24.95 – – – – I2 Class Accumulation units 33.48 24.17 – – – – I2 Class Accumulation (EUR hedged) units 57.61 26.05 – – – – I2 Class Accumulation (GBP hedged) units 34.62 27.25 – – – –
Global Time Diversified Absolute Return Fund
I Class Accumulation units 82.14 – – 84.041 – –
EDGE Small/Mid-Cap Equity Income Fund* A Class Accumulation units – – – 100.00
1 – – I Class Accumulation units – – – 100.00
1 – –
Global Small Cap Equity Fund A Class Accumulation units 99.95
1 – – 100.001 – –
I Class Accumulation units 67.881 28.58
1 – 76.221 20.36
1 –
1Unitholder is a related party fund.
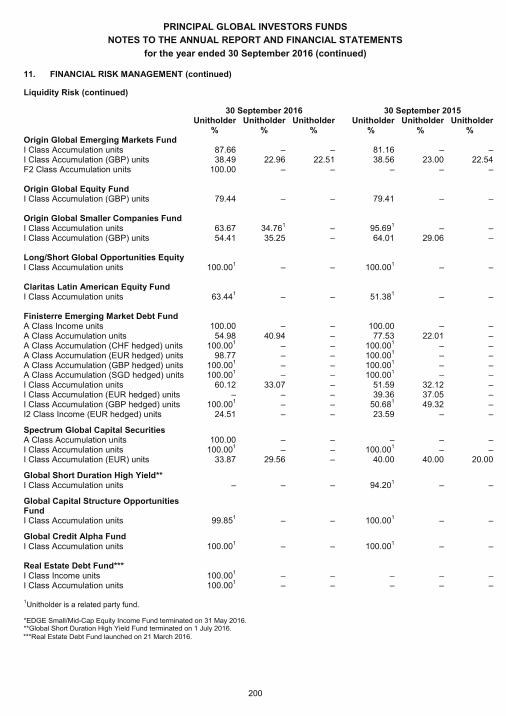
PRINCIPAL GLOBAL INVESTORS FUNDS
NOTES TO THE ANNUAL REPORT AND FINANCIAL STATEMENTS
for the year ended 30 September 2016 (continued)
200
11. FINANCIAL RISK MANAGEMENT (continued)
Liquidity Risk (continued)
30 September 2016 30 September 2015 Unitholder
1 Unitholder
2 Unitholder
3 Unitholder
1 Unitholder
2 Unitholder
3 % % % % % %
Origin Global Emerging Markets Fund I Class Accumulation units 87.66 – – 81.16 – – I Class Accumulation (GBP) units 38.49 22.96 22.51 38.56 23.00 22.54 F2 Class Accumulation units 100.00 – – – – – Origin Global Equity Fund I Class Accumulation (GBP) units 79.44 – – 79.41 – – Origin Global Smaller Companies Fund I Class Accumulation units 63.67 34.76
1 – 95.691 – –
I Class Accumulation (GBP) units 54.41 35.25 – 64.01 29.06 –
Long/Short Global Opportunities Equity Fund
I Class Accumulation units 100.00
1 – – 100.001 – –
Claritas Latin American Equity Fund I Class Accumulation units 63.44
1 – – 51.381 – –
Finisterre Emerging Market Debt Fund A Class Income units –
100.00 – – 100.00 – – A Class Accumulation units –
54.98 40.94 – 77.53 22.01 – A Class Accumulation (CHF hedged) units 100.00
1 – – 100.00
1 – –
A Class Accumulation (EUR hedged) units 98.77 – – 100.001 – –
A Class Accumulation (GBP hedged) units 100.001
– – 100.001 – –
A Class Accumulation (SGD hedged) units 100.001
– – 100.001 – –
I Class Accumulation units 60.12 33.07 – 51.59 32.12 – I Class Accumulation (EUR hedged) units – – – 39.36 37.05 – I Class Accumulation (GBP hedged) units 100.00
1 – – 50.68
1 49.32 – I2 Class Income (EUR hedged) units 24.51 – – 23.59 – –
Spectrum Global Capital Securities Fund*
A Class Accumulation units –
100.00 – – – – – I Class Accumulation units 100.00
1 – – 100.001 – –
I Class Accumulation (EUR) units 33.87 29.56 – 40.00 40.00 20.00
Global Short Duration High Yield** Fund**
I Class Accumulation units – – – 94.20
1 – –
Global Capital Structure Opportunities Fund
I Class Accumulation units 99.851 – – 100.00
1 – – Global Credit Alpha Fund I Class Accumulation units 100.00
1 – – 100.001 – –
Real Estate Debt Fund*** I Class Income units 100.00
1 – – – – – I Class Accumulation units 100.00
1 – – – – – 1Unitholder is a related party fund.
*EDGE Small/Mid-Cap Equity Income Fund terminated on 31 May 2016. **Global Short Duration High Yield Fund terminated on 1 July 2016.
***Real Estate Debt Fund launched on 21 March 2016.
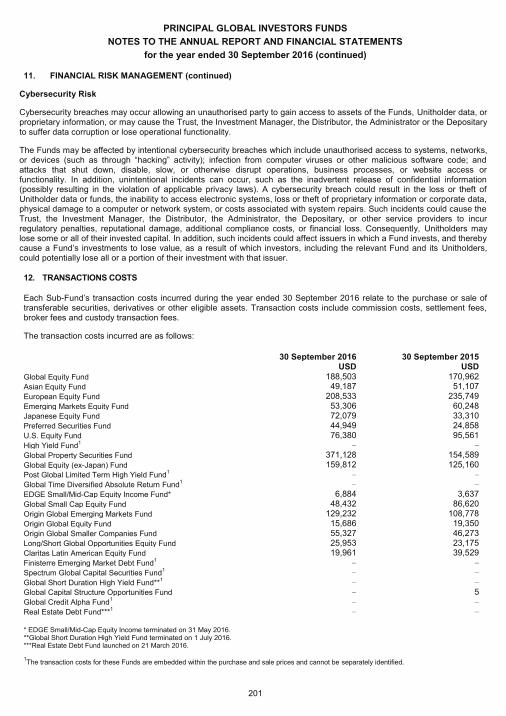
PRINCIPAL GLOBAL INVESTORS FUNDS
NOTES TO THE ANNUAL REPORT AND FINANCIAL STATEMENTS
for the year ended 30 September 2016 (continued)
201
11. FINANCIAL RISK MANAGEMENT (continued)
Cybersecurity Risk
Cybersecurity breaches may occur allowing an unauthorised party to gain access to assets of the Funds, Unitholder data, or proprietary information, or may cause the Trust, the Investment Manager, the Distributor, the Administrator or the Depositary to suffer data corruption or lose operational functionality.
The Funds may be affected by intentional cybersecurity breaches which include unauthorised access to systems, networks, or devices (such as through “hacking” activity); infection from computer viruses or other malicious software code; and attacks that shut down, disable, slow, or otherwise disrupt operations, business processes, or website access or functionality. In addition, unintentional incidents can occur, such as the inadvertent release of confidential information (possibly resulting in the violation of applicable privacy laws). A cybersecurity breach could result in the loss or theft of Unitholder data or funds, the inability to access electronic systems, loss or theft of proprietary information or corporate data, physical damage to a computer or network system, or costs associated with system repairs. Such incidents could cause the Trust, the Investment Manager, the Distributor, the Administrator, the Depositary, or other service providers to incur regulatory penalties, reputational damage, additional compliance costs, or financial loss. Consequently, Unitholders may lose some or all of their invested capital. In addition, such incidents could affect issuers in which a Fund invests, and thereby cause a Fund’s investments to lose value, as a result of which investors, including the relevant Fund and its Unitholders, could potentially lose all or a portion of their investment with that issuer. 12. TRANSACTIONS COSTS
Each Sub-Fund’s transaction costs incurred during the year ended 30 September 2016 relate to the purchase or sale of transferable securities, derivatives or other eligible assets. Transaction costs include commission costs, settlement fees, broker fees and custody transaction fees.
The transaction costs incurred are as follows:
30 September 2016 30 September 2015 USD USD Global Equity Fund 188,503 170,962 Asian Equity Fund 49,187 51,107 European Equity Fund 208,533 235,749 Emerging Markets Equity Fund 53,306 60,248 Japanese Equity Fund 72,079 33,310 Preferred Securities Fund 44,949 24,858 U.S. Equity Fund 76,380 95,561 High Yield Fund
1 – –
Global Property Securities Fund 371,128 154,589 Global Equity (ex-Japan) Fund 159,812 125,160 Post Global Limited Term High Yield Fund
1 – –
Global Time Diversified Absolute Return Fund1
– – EDGE Small/Mid-Cap Equity Income Fund* 6,884 3,637 Global Small Cap Equity Fund 48,432 86,620 Origin Global Emerging Markets Fund 129,232 108,778 Origin Global Equity Fund 15,686 19,350 Origin Global Smaller Companies Fund 55,327 46,273 Long/Short Global Opportunities Equity Fund 25,953 23,175 Claritas Latin American Equity Fund 19,961 39,529 Finisterre Emerging Market Debt Fund
1 – –
Spectrum Global Capital Securities Fund1
– – Global Short Duration High Yield Fund**
1 – –
Global Capital Structure Opportunities Fund – 5 Global Credit Alpha Fund
1 – –
Real Estate Debt Fund***1
– –
* EDGE Small/Mid-Cap Equity Income terminated on 31 May 2016. **Global Short Duration High Yield Fund terminated on 1 July 2016. ***Real Estate Debt Fund launched on 21 March 2016.
1The transaction costs for these Funds are embedded within the purchase and sale prices and cannot be separately identified.
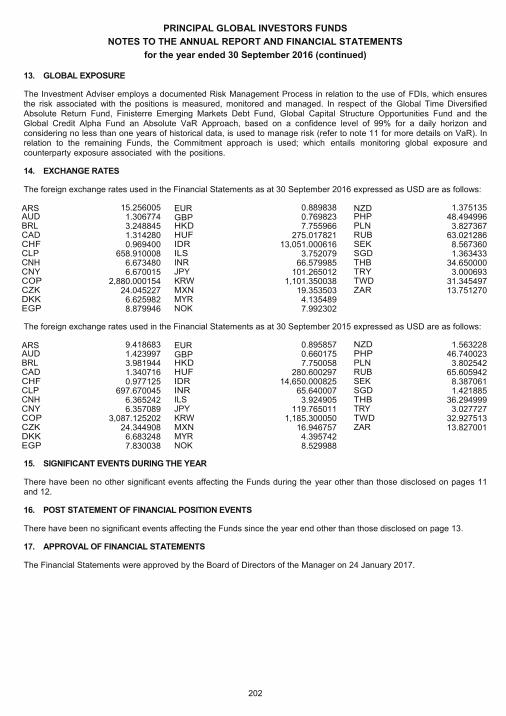
PRINCIPAL GLOBAL INVESTORS FUNDS
NOTES TO THE ANNUAL REPORT AND FINANCIAL STATEMENTS
for the year ended 30 September 2016 (continued)
202
13. GLOBAL EXPOSURE
The Investment Adviser employs a documented Risk Management Process in relation to the use of FDIs, which ensures the risk associated with the positions is measured, monitored and managed. In respect of the Global Time Diversified Absolute Return Fund, Finisterre Emerging Markets Debt Fund, Global Capital Structure Opportunities Fund and the Global Credit Alpha Fund an Absolute VaR Approach, based on a confidence level of 99% for a daily horizon and considering no less than one years of historical data, is used to manage risk (refer to note 11 for more details on VaR). In relation to the remaining Funds, the Commitment approach is used; which entails monitoring global exposure and counterparty exposure associated with the positions.
14. EXCHANGE RATES
The foreign exchange rates used in the Financial Statements as at 30 September 2016 expressed as USD are as follows:
ARS 15.256005 EUR 0.889838 NZD 1.375135 AUD 1.306774 GBP 0.769823 PHP 48.494996 BRL 3.248845 HKD 7.755966 PLN 3.827367 CAD 1.314280 HUF 275.017821 RUB 63.021286 CHF 0.969400 IDR 13,051.000616 SEK 8.567360 CLP 658.910008 ILS 3.752079 SGD 1.363433 CNH 6.673480 INR 66.579985 THB 34.650000 CNY 6.670015 JPY 101.265012 TRY 3.000693 COP 2,880.000154 KRW 1,101.350038 TWD 31.345497 CZK 24.045227 MXN 19.353503 ZAR 13.751270 DKK 6.625982 MYR 4.135489 EGP 8.879946 NOK 7.992302
The foreign exchange rates used in the Financial Statements as at 30 September 2015 expressed as USD are as follows:
ARS 9.418683 EUR 0.895857 NZD 1.563228 AUD 1.423997 GBP 0.660175 PHP 46.740023 BRL 3.981944 HKD 7.750058 PLN 3.802542 CAD 1.340716 HUF 280.600297 RUB 65.605942 CHF 0.977125 IDR 14,650.000825 SEK 8.387061 CLP 697.670045 INR 65.640007 SGD 1.421885 CNH 6.365242 ILS 3.924905 THB 36.294999 CNY 6.357089 JPY 119.765011 TRY 3.027727 COP 3,087.125202 KRW 1,185.300050 TWD 32.927513 CZK 24.344908 MXN 16.946757 ZAR 13.827001 DKK 6.683248 MYR 4.395742 EGP 7.830038 NOK 8.529988
15. SIGNIFICANT EVENTS DURING THE YEAR
There have been no other significant events affecting the Funds during the year other than those disclosed on pages 11 and 12.
16. POST STATEMENT OF FINANCIAL POSITION EVENTS
There have been no significant events affecting the Funds since the year end other than those disclosed on page 13.
17. APPROVAL OF FINANCIAL STATEMENTS
The Financial Statements were approved by the Board of Directors of the Manager on 24 January 2017.
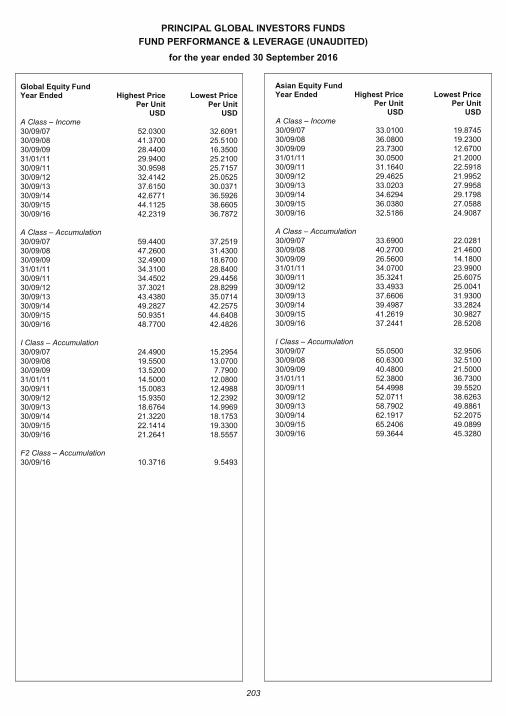
PRINCIPAL GLOBAL INVESTORS FUNDS
FUND PERFORMANCE & LEVERAGE (UNAUDITED)
for the year ended 30 September 2016
203
Global Equity Fund Year Ended Highest Price
Per Unit USD
Lowest Price Per Unit
USD A Class – Income 30/09/07 52.0300 32.6091 30/09/08 41.3700 25.5100 30/09/09 28.4400 16.3500 31/01/11 29.9400 25.2100 30/09/11 30.9598 25.7157 30/09/12 32.4142 25.0525 30/09/13 37.6150 30.0371 30/09/14 42.6771 36.5926 30/09/15 44.1125 38.6605 30/09/16 42.2319 36.7872 A Class – Accumulation
30/09/07 59.4400 37.2519 30/09/08 47.2600 31.4300 30/09/09 32.4900 18.6700 31/01/11 34.3100 28.8400 30/09/11 34.4502 29.4456 30/09/12 37.3021 28.8299 30/09/13 43.4380 35.0714 30/09/14 49.2827 42.2575 30/09/15 50.9351 44.6408 30/09/16 48.7700 42.4826 I Class – Accumulation 30/09/07 24.4900 15.2954 30/09/08 19.5500 13.0700 30/09/09 13.5200 7.7900 31/01/11 14.5000 12.0800 30/09/11 15.0083 12.4988 30/09/12 15.9350 12.2392 30/09/13 18.6764 14.9969 30/09/14 21.3220 18.1753 30/09/15 22.1414 19.3300 30/09/16 21.2641 18.5557 F2 Class – Accumulation 30/09/16 10.3716 9.5493
Asian Equity Fund Year Ended Highest Price
Per Unit USD
Lowest Price Per Unit
USD A Class – Income
30/09/07 33.0100 19.8745 30/09/08 36.0800 19.2300 30/09/09 23.7300 12.6700 31/01/11 30.0500 21.2000 30/09/11 31.1640 22.5918 30/09/12 29.4625 21.9952 30/09/13 33.0203 27.9958 30/09/14 34.6294 29.1798 30/09/15 36.0380 27.0588 30/09/16 32.5186 24.9087
A Class – Accumulation 30/09/07 33.6900 22.0281 30/09/08 40.2700 21.4600 30/09/09 26.5600 14.1800 31/01/11 34.0700 23.9900 30/09/11 35.3241 25.6075 30/09/12 33.4933 25.0041 30/09/13 37.6606 31.9300 30/09/14 39.4987 33.2824 30/09/15 41.2619 30.9827 30/09/16 37.2441 28.5208 I Class – Accumulation 30/09/07 55.0500 32.9506 30/09/08 60.6300 32.5100 30/09/09 40.4800 21.5000 31/01/11 52.3800 36.7300 30/09/11 54.4998 39.5520 30/09/12 52.0711 38.6263 30/09/13 58.7902 49.8861 30/09/14 62.1917 52.2075 30/09/15 65.2406 49.0899 30/09/16 59.3644 45.3280
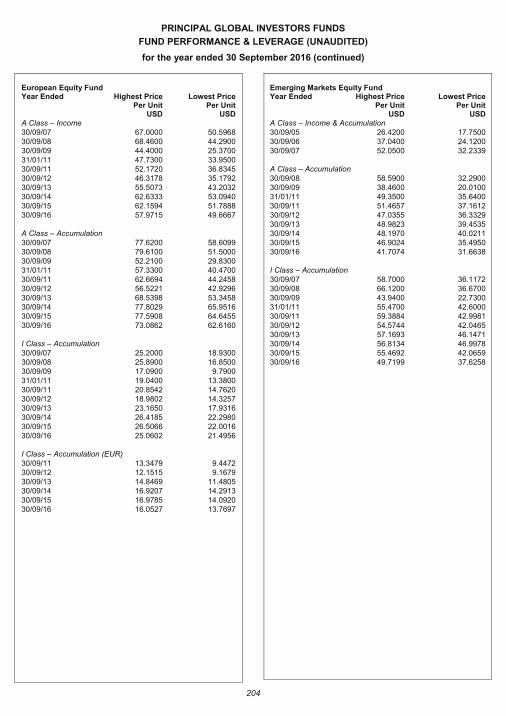
PRINCIPAL GLOBAL INVESTORS FUNDS
FUND PERFORMANCE & LEVERAGE (UNAUDITED)
for the year ended 30 September 2016 (continued)
204
European Equity Fund Year Ended Highest Price
Per Unit USD
Lowest Price Per Unit
USD A Class – Income 30/09/07 67.0000 50.5968 30/09/08 68.4600 44.2900 30/09/09 44.4000 25.3700 31/01/11 47.7300 33.9500 30/09/11 52.1720 36.8345 30/09/12 46.3178 35.1792 30/09/13 55.5073 43.2032 30/09/14 62.6333 53.0940 30/09/15 62.1594 51.7888 30/09/16 57.9715 49.6667 A Class – Accumulation 30/09/07 77.6200 58.6099 30/09/08 79.6100 51.5000 30/09/09 52.2100 29.8300 31/01/11 57.3300 40.4700 30/09/11 62.6694 44.2458 30/09/12 56.5221 42.9296 30/09/13 68.5398 53.3458 30/09/14 77.8029 65.9516 30/09/15 77.5908 64.6455 30/09/16 73.0862 62.6160
I Class – Accumulation
30/09/07 25.2000 18.9300 30/09/08 25.8900 16.8500 30/09/09 17.0900 9.7900 31/01/11 19.0400 13.3800 30/09/11 20.8542 14.7620 30/09/12 18.9802 14.3257 30/09/13 23.1650 17.9316 30/09/14 26.4185 22.2980 30/09/15 26.5066 22.0016 30/09/16 25.0602 21.4956
I Class – Accumulation (EUR)
30/09/11 13.3479 9.4472 30/09/12 12.1515 9.1679 30/09/13 14.8469 11.4805 30/09/14 16.9207 14.2913 30/09/15 16.9785 14.0920 30/09/16 16.0527 13.7697
Emerging Markets Equity Fund Year Ended Highest Price
Per Unit USD
Lowest Price Per Unit
USD A Class – Income & Accumulation 30/09/05 26.4200 17.7500 30/09/06 37.0400 24.1200 30/09/07 52.0500 32.2339 A Class – Accumulation 30/09/08 58.5900 32.2900 30/09/09 38.4600 20.0100 31/01/11 49.3500
49.3500 35.6400
30/09/11 51.4657 37.1612 30/09/12 47.0355 36.3329 30/09/13 48.9823 39.4535 30/09/14 48.1970 40.0211 30/09/15 46.9024 35.4950 30/09/16 41.7074 31.6638
I Class – Accumulation
30/09/07 58.7000 36.1172 30/09/08 66.1200 36.6700 30/09/09 43.9400 22.7300 31/01/11 55.4700 42.6000 30/09/11 59.3884 42.9981 30/09/12 54.5744 42.0465 30/09/13 57.1693 46.1471 30/09/14 56.8134 46.9978 30/09/15 55.4692 42.0659 30/09/16 49.7199 37.6258
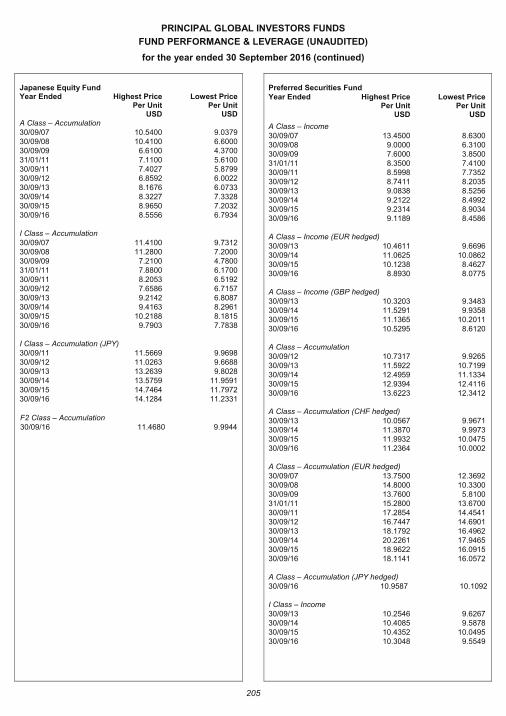
PRINCIPAL GLOBAL INVESTORS FUNDS
FUND PERFORMANCE & LEVERAGE (UNAUDITED)
for the year ended 30 September 2016 (continued)
205
Japanese Equity Fund Year Ended Highest Price
Per Unit USD
Lowest Price Per Unit
USD A Class – Accumulation 30/09/07 10.5400 9.0379 30/09/08 10.4100 6.6000 30/09/09 6.6100 4.3700 31/01/11 7.1100 5.6100 30/09/11 7.4027 5.8799 30/09/12 6.8592 6.0022 30/09/13 8.1676 6.0733 30/09/14 8.3227 7.3328 30/09/15 8.9650 7.2032 30/09/16 8.5556 6.7934
I Class – Accumulation 30/09/07 11.4100 9.7312 30/09/08 11.2800 7.2000 30/09/09 7.2100 4.7800 31/01/11 7.8800 6.1700 30/09/11 8.2053 6.5192 30/09/12 7.6586 6.7157 30/09/13 9.2142 6.8087 30/09/14 9.4163 8.2961 30/09/15 10.2188 8.1815 30/09/16 9.7903 7.7838
I Class – Accumulation (JPY)
30/09/11 11.5669 9.9698 30/09/12 11.0263 9.6688 30/09/13 13.2639 9.8028 30/09/14 13.5759 11.9591 30/09/15 14.7464 11.7972 30/09/16 14.1284 11.2331
F2 Class – Accumulation 30/09/16 11.4680 9.9944
Preferred Securities Fund Year Ended Highest Price
Per Unit USD
Lowest Price Per Unit
USD
A Class – Income
30/09/07 13.4500 8.6300 30/09/08 9.0000 6.3100 30/09/09 7.6000 3.8500 31/01/11 8.3500 7.4100 30/09/11 8.5998 7.7352 30/09/12 8.7411 8.2035 30/09/13 9.0838 8.5256 30/09/14 9.2122 8.4992 30/09/15 9.2314 8.9034 30/09/16 9.1189 8.4586
A Class – Income (EUR hedged) 30/09/13 10.4611 9.6696 30/09/14 11.0625 10.0862 30/09/15 10.1238 8.4627 30/09/16 8.8930 8.0775 A Class – Income (GBP hedged) 30/09/13 10.3203 9.3483 30/09/14 11.5291 9.9358 30/09/15 11.1365 10.2011 30/09/16 10.5295 8.6120 A Class – Accumulation 30/09/12 10.7317 9.9265 30/09/13 11.5922 10.7199 30/09/14 12.4959 11.1334 30/09/15 12.9394 12.4116 30/09/16 13.6223 12.3412
A Class – Accumulation (CHF hedged) 30/09/13 10.0567 9.9671 30/09/14 11.3870 9.9973 30/09/15 11.9932 10.0475 30/09/16 11.2364 10.0002 A Class – Accumulation (EUR hedged) 30/09/07 13.7500 12.3692 30/09/08 14.8000 10.3300 30/09/09 13.7600 5.8100 31/01/11 15.2800 13.6700 30/09/11 17.2854 14.4541 30/09/12 16.7447 14.6901 30/09/13 18.1792 16.4962 30/09/14 20.2261 17.9465 30/09/15 18.9622 16.0915 30/09/16 18.1141 16.0572 A Class – Accumulation (JPY hedged) 30/09/16 10.9587 10.1092
I Class – Income
30/09/13 10.2546 9.6267 30/09/14 10.4085 9.5878 30/09/15 10.4352 10.0495 30/09/16 10.3048 9.5549
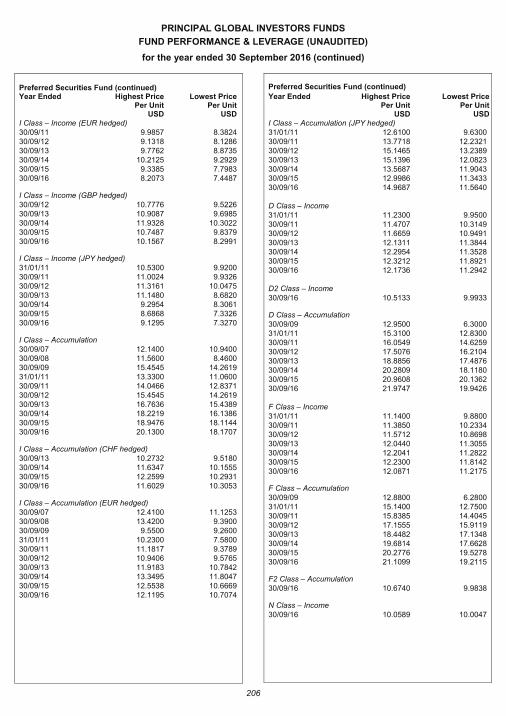
PRINCIPAL GLOBAL INVESTORS FUNDS
FUND PERFORMANCE & LEVERAGE (UNAUDITED)
for the year ended 30 September 2016 (continued)
206
Preferred Securities Fund (continued) Year Ended Highest Price
Per Unit USD
Lowest Price Per Unit
USD I Class – Income (EUR hedged) 30/09/11 9.9857 8.3824 30/09/12 9.1318 8.1286 30/09/13 9.7762 8.8735 30/09/14 10.2125 9.2929 30/09/15 9.3385 7.7983 30/09/16 8.2073 7.4487 I Class – Income (GBP hedged) 30/09/12 10.7776 9.5226 30/09/13 10.9087 9.6985 30/09/14 11.9328 10.3022 30/09/15 10.7487 9.8379 30/09/16 10.1567 8.2991 I Class – Income (JPY hedged) 31/01/11 10.5300 9.9200 30/09/11 11.0024 9.9326 30/09/12 11.3161 10.0475 30/09/13 11.1480 8.6820 30/09/14 9.2954 8.3061 30/09/15 8.6868 7.3326 30/09/16 9.1295 7.3270 I Class – Accumulation 30/09/07 12.1400 10.9400 30/09/08 11.5600 8.4600 30/09/09 15.4545 14.2619 31/01/11 13.3300 11.0600 30/09/11 14.0466 12.8371 30/09/12 15.4545 14.2619 30/09/13 16.7636 15.4389 30/09/14 18.2219 16.1386 30/09/15 18.9476 18.1144 30/09/16 20.1300 18.1707 I Class – Accumulation (CHF hedged)
30/09/13 10.2732 9.5180 30/09/14 11.6347 10.1555 30/09/15 12.2599 10.2931 30/09/16 11.6029 10.3053 I Class – Accumulation (EUR hedged) 30/09/07 12.4100 11.1253 30/09/08 13.4200 9.3900 30/09/09 9.5500 9.2600 31/01/11 10.2300 7.5800 30/09/11 11.1817 9.3789 30/09/12 10.9406 9.5765 30/09/13 11.9183 10.7842 30/09/14 13.3495 11.8047 30/09/15 12.5538 10.6669 30/09/16 12.1195 10.7074
Preferred Securities Fund (continued)
Year Ended Highest Price Per Unit
USD
Lowest Price Per Unit
USD I Class – Accumulation (JPY hedged) 31/01/11 12.6100 9.6300 30/09/11 13.7718 12.2321 30/09/12 15.1465 13.2389 30/09/13 15.1396 12.0823 30/09/14 13.5687 11.9043 30/09/15 12.9986 11.3433 30/09/16 14.9687 11.5640 D Class – Income 31/01/11 11.2300 9.9500 30/09/11 11.4707 10.3149 30/09/12 11.6659 10.9491 30/09/13 12.1311 11.3844 30/09/14 12.2954 11.3528 30/09/15 12.3212 11.8921 30/09/16 12.1736 11.2942 D2 Class – Income
30/09/16 10.5133 9.9933 D Class – Accumulation 30/09/09 12.9500 6.3000 31/01/11 15.3100 12.8300 30/09/11 16.0549 14.6259 30/09/12 17.5076 16.2104 30/09/13 18.8856 17.4876 30/09/14 20.2809 18.1180 30/09/15 20.9608 20.1362 30/09/16 21.9747 19.9426 F Class – Income 31/01/11 11.1400 9.8800 30/09/11 11.3850 10.2334 30/09/12 11.5712 10.8698 30/09/13 12.0440 11.3055 30/09/14 12.2041 11.2822 30/09/15 12.2300 11.8142 30/09/16 12.0871 11.2175 F Class – Accumulation 30/09/09 12.8800 6.2800 31/01/11 15.1400 12.7500 30/09/11 15.8385 14.4045 30/09/12 17.1555 15.9119 30/09/13 18.4482 17.1348 30/09/14 19.6814 17.6628 30/09/15 20.2776 19.5278 30/09/16 21.1099 19.2115 F2 Class – Accumulation 30/09/16 10.6740 9.9838 N Class – Income 30/09/16 10.0589 10.0047
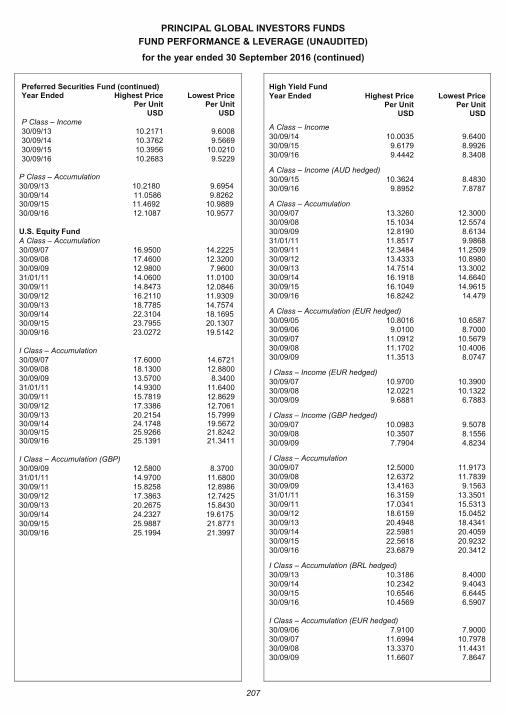
PRINCIPAL GLOBAL INVESTORS FUNDS
FUND PERFORMANCE & LEVERAGE (UNAUDITED)
for the year ended 30 September 2016 (continued)
207
Preferred Securities Fund (continued) Year Ended Highest Price
Per Unit USD
Lowest Price Per Unit
USD P Class – Income 30/09/13 10.2171 9.6008 30/09/14 10.3762 9.5669 30/09/15 10.3956 10.0210 30/09/16 10.2683 9.5229
P Class – Accumulation 30/09/13 10.2180 9.6954 30/09/14 11.0586 9.8262 30/09/15 11.4692 10.9889 3 30/09/16 12.1087 10.9577 U.S. Equity Fund A Class – Accumulation 30/09/07 16.9500 14.2225 30/09/08 17.4600 12.3200 30/09/09 12.9800 7.9600 31/01/11 14.0600 11.0100 30/09/11 14.8473 12.0846 30/09/12 16.2110 11.9309 30/09/13 18.7785 14.7574 30/09/14 22.3104 18.1695 30/09/15 23.7955 20.1307 30/09/16 23.0272 19.5142 I Class – Accumulation 30/09/07 17.6000 14.6721 30/09/08 18.1300 12.8800 30/09/09 13.5700 8.3400 31/01/11 14.9300 11.6400 30/09/11 15.7819 12.8629 30/09/12 17.3386 12.7061 30/09/13 20.2154 15.7999 30/09/14 24.1748 19.5672 30/09/15 25.9266 21.8242 30/09/16 25.1391 21.3411 I Class – Accumulation (GBP) 30/09/09 12.5800 8.3700 31/01/11 14.9700 11.6800 30/09/11 15.8258 12.8986 30/09/12 17.3863 12.7425 30/09/13 20.2675 15.8430 30/09/14 24.2327 19.6175 30/09/15 25.9887 21.8771 30/09/16 25.1994 21.3997
High Yield Fund Year Ended Highest Price
Per Unit USD
Lowest Price Per Unit
USD
A Class – Income 30/09/14 10.0035 9.6400 30/09/15 9.6179 8.9926 30/09/16 9.4442 8.3408
A Class – Income (AUD hedged)
30/09/15 10.3624 8.4830 30/09/16 9.8952 7.8787
A Class – Accumulation
30/09/07 13.3260 12.3000 30/09/08 15.1034 12.5574 30/09/09 12.8190 8.6134 31/01/11 11.8517 9.9868 30/09/11 12.3484 11.2509 30/09/12 13.4333 10.8980 30/09/13 14.7514 13.3002 30/09/14 16.1918 14.6640 30/09/15 16.1049 14.9615 30/09/16 16.8242 14.479 A Class – Accumulation (EUR hedged)
30/09/05 10.8016 10.6587 30/09/06 9.0100 8.7000 30/09/07 11.0912 10.5679 30/09/08 11.1702 10.4006 30/09/09 11.3513 8.0747
I Class – Income (EUR hedged)
30/09/07 10.9700 10.3900 30/09/08 12.0221 10.1322 30/09/09 9.6881 6.7883
I Class – Income (GBP hedged)
30/09/07 10.0983 9.5078 30/09/08 10.3507 8.1556 30/09/09 7.7904 4.8234
I Class – Accumulation
30/09/07 12.5000 11.9173 30/09/08 12.6372 11.7839 30/09/09 13.4163 9.1563 31/01/11 16.3159 13.3501 30/09/11 17.0341 15.5313 30/09/12 18.6159 15.0452 30/09/13 20.4948 18.4341 30/09/14 22.5981 20.4059 30/09/15 22.5618 20.9232 30/09/16 23.6879 20.3412
I Class – Accumulation (BRL hedged)
30/09/13 10.3186 8.4000 30/09/14 10.2342 9.4043 30/09/15 10.6546 6.6445 30/09/16 10.4569 6.5907
I Class – Accumulation (EUR hedged) 30/09/06 7.9100 7.9000 30/09/07 11.6994 10.7978 30/09/08 13.3370 11.4431 30/09/09 11.6607 7.8647
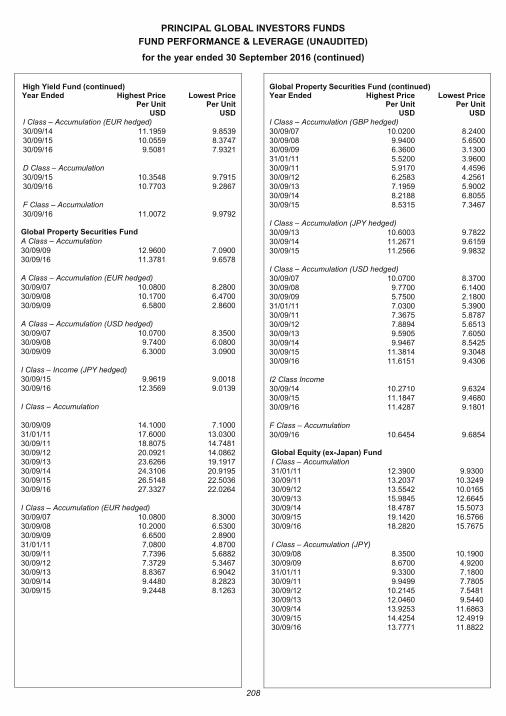
PRINCIPAL GLOBAL INVESTORS FUNDS
FUND PERFORMANCE & LEVERAGE (UNAUDITED)
for the year ended 30 September 2016 (continued)
208
High Yield Fund (continued) Year Ended Highest Price
Per Unit USD
Lowest Price Per Unit
USD I Class – Accumulation (EUR hedged)
30/09/14 11.1959 9.8539 30/09/15 10.0559 8.3747 30/09/16 9.5081 7.9321 D Class – Accumulation 30/09/15 10.3548 9.7915 30/09/16 10.7703 9.2867 F Class – Accumulation 30/09/16 11.0072 9.9792
Global Property Securities Fund A Class – Accumulation 30/09/09 12.9600 7.0900 30/09/16 11.3781 9.6578
A Class – Accumulation (EUR hedged) 30/09/07 10.0800 8.2800 30/09/08 10.1700 6.4700 30/09/09 6.5800 2.8600 A Class – Accumulation (USD hedged) 30/09/07 10.0700 8.3500 30/09/08 9.7400 6.0800 30/09/09 6.3000 3.0900 I Class – Income (JPY hedged) 30/09/15 9.9619 9.0018 30/09/16 12.3569 9.0139 I Class – Accumulation 30/09/09 14.1000 7.1000 31/01/11 17.6000 13.0300 30/09/11 18.8075 14.7481 30/09/12 20.0921 14.0862 30/09/13 23.6266 19.1917 30/09/14 24.3106 20.9195 30/09/15 26.5148 22.5036 30/09/16 27.3327 22.0264 I Class – Accumulation (EUR hedged) 30/09/07 10.0800 8.3000 30/09/08 10.2000 6.5300 30/09/09 6.6500 2.8900 31/01/11 7.0800 4.8700 30/09/11 7.7396 5.6882 30/09/12 7.3729 5.3467 30/09/13 8.8367 6.9042 30/09/14 9.4480 8.2823 30/09/15 9.2448 8.1263
Global Property Securities Fund (continued) Year Ended Highest Price
Per Unit USD
Lowest Price Per Unit
USD I Class – Accumulation (GBP hedged)
30/09/07 10.0200 8.2400 30/09/08 9.9400 5.6500 30/09/09 6.3600 3.1300 31/01/11 5.5200 3.9600 30/09/11 5.9170 4.4596 30/09/12 6.2583 4.2561 30/09/13 7.1959 5.9002 30/09/14 8.2188 6.8055 30/09/15 8.5315 7.3467
I Class – Accumulation (JPY hedged) 30/09/13 10.6003 9.7822 30/09/14 11.2671 9.6159 30/09/15 11.2566 9.9832
I Class – Accumulation (USD hedged) 30/09/07 10.0700 8.3700 30/09/08 9.7700 6.1400 30/09/09 5.7500 2.1800 31/01/11 7.0300 5.3900 30/09/11 7.3675 5.8787 30/09/12 7.8894 5.6513 30/09/13 9.5905 7.6050 30/09/14 9.9467 8.5425 30/09/15 11.3814 9.3048 30/09/16 11.6151 9.4306 I2 Class Income 30/09/14 10.2710 9.6324 30/09/15 11.1847 9.4680 30/09/16 11.4287 9.1801 F Class – Accumulation 30/09/16 10.6454 9.6854
Global Equity (ex-Japan) Fund I Class – Accumulation 31/01/11 12.3900 9.9300 30/09/11 13.2037 10.3249 30/09/12 13.5542 10.0165 30/09/13 15.9845 12.6645 30/09/14 18.4787 15.5073 30/09/15 19.1420 16.5766 30/09/16 18.2820 15.7675 I Class – Accumulation (JPY) 30/09/08 8.3500 10.1900 30/09/09 8.6700 4.9200 31/01/11 9.3300 7.1800 30/09/11 9.9499 7.7805 30/09/12 10.2145 7.5481 30/09/13 12.0460 9.5440 30/09/14 13.9253 11.6863 30/09/15 14.4254 12.4919 30/09/16 13.7771 11.8822
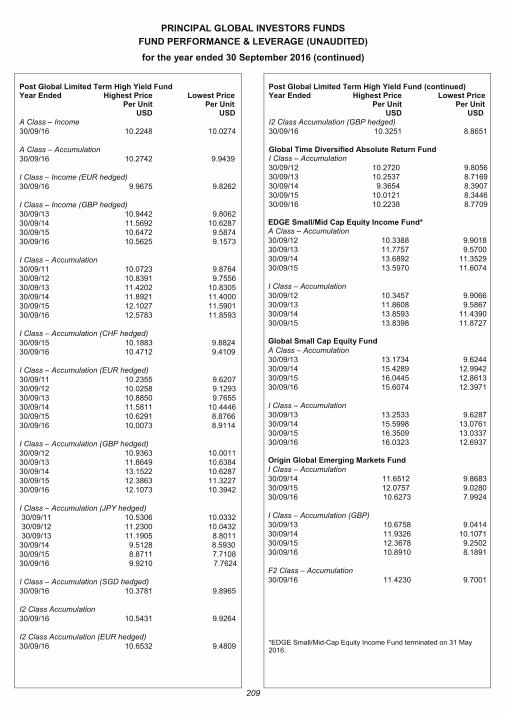
PRINCIPAL GLOBAL INVESTORS FUNDS
FUND PERFORMANCE & LEVERAGE (UNAUDITED)
for the year ended 30 September 2016 (continued)
209
Post Global Limited Term High Yield Fund Year Ended Highest Price
Per Unit USD
Lowest Price Per Unit USD
A Class – Income 30/09/16 10.2248 10.0274 A Class – Accumulation 30/09/16 10.2742 9.9439 I Class – Income (EUR hedged) 30/09/16 9.9675 9.8262 I Class – Income (GBP hedged) 30/09/13 10.9442 9.8062 30/09/14 11.5692 10.6287 30/09/15 10.6472 9.5874 30/09/16 10.5625 9.1573 I Class – Accumulation 30/09/11 10.0723 9.8764 30/09/12 10.8391 9.7556 30/09/13 11.4202 10.8305 30/09/14 11.8921 11.4000 30/09/15 12.1027 11.5901 30/09/16 12.5783 11.8593 I Class – Accumulation (CHF hedged)
30/09/15 10.1883 9.8824
30/09/16 10.4712 9.4109 I Class – Accumulation (EUR hedged) 30/09/11 10.2355 9.6207 30/09/12 10.0258 9.1293 30/09/13 10.8850 9.7655 30/09/14 11.5811 10.4446 30/09/15 10.6291 8.8766 30/09/16 10.0073 8.9114 I Class – Accumulation (GBP hedged) 30/09/12 10.9363 10.0011 30/09/13 11.8649 10.6384 30/09/14 13.1522 10.6287 30/09/15 12.3863 11.3227 30/09/16 12.1073 10.3942
I Class – Accumulation (JPY hedged) 30/09/11 10.5306 10.0332 30/09/12 11.2300 10.0432 30/09/13 11.1905 8.8011 30/09/14 9.5128 8.5930 30/09/15 8.8711 7.7108 30/09/16 9.9210 7.7624 I Class – Accumulation (SGD hedged) 30/09/16 10.3781 9.8965 I2 Class Accumulation 30/09/16 10.5431 9.9264 I2 Class Accumulation (EUR hedged) 30/09/16 10.6532 9.4809
Post Global Limited Term High Yield Fund (continued) Year Ended Highest Price
Per Unit USD
Lowest Price Per Unit USD
I2 Class Accumulation (GBP hedged) 30/09/16 10.3251 8.8651 Global Time Diversified Absolute Return Fund I Class – Accumulation 30/09/12 10.2720 9.8056 30/09/13 10.2537 8.7169 30/09/14 9.3654 8.3907 30/09/15 10.0121 8.3446 30/09/16 10.2238 8.7709
EDGE Small/Mid Cap Equity Income Fund* A Class – Accumulation 30/09/12 10.3388 9.9018 30/09/13 11.7757 9.5700 30/09/14 13.6892 11.3529 30/09/15 13.5970 11.6074 I Class – Accumulation 30/09/12 10.3457 9.9066 30/09/13 11.8608 9.5867 30/09/14 13.8593 11.4390 30/09/15 13.8398 11.8727 Global Small Cap Equity Fund A Class – Accumulation 30/09/13 13.1734 9.6244 30/09/14 15.4289 12.9942 30/09/15 16.0445 12.8613 30/09/16 15.6074 12.3971
I Class – Accumulation
30/09/13 13.2533 9.6287 30/09/14 15.5998 13.0761 30/09/15 16.3509 13.0337 30/09/16 16.0323 12.6937 Origin Global Emerging Markets Fund I Class – Accumulation 30/09/14 11.6512 9.8683 30/09/15 12.0757 9.0280 30/09/16 10.6273 7.9924
I Class – Accumulation (GBP)
30/09/13 10.6758 9.0414 30/09/14 11.9326 10.1071 30/09/15 12.3678 9.2502 30/09/16 10.8910 8.1891 F2 Class – Accumulation 30/09/16 11.4230 9.7001 *EDGE Small/Mid-Cap Equity Income Fund terminated on 31 May 2016.
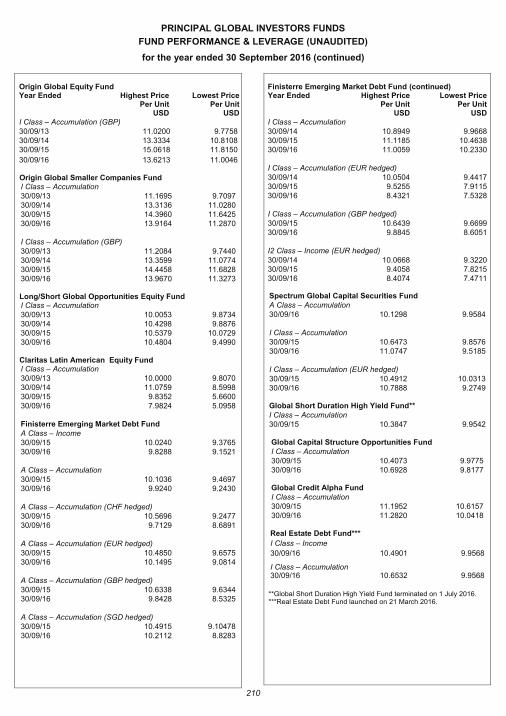
PRINCIPAL GLOBAL INVESTORS FUNDS
FUND PERFORMANCE & LEVERAGE (UNAUDITED)
for the year ended 30 September 2016 (continued)
210
Origin Global Equity Fund Year Ended Highest Price
Per Unit USD
Lowest Price Per Unit
USD I Class – Accumulation (GBP)
30/09/13 11.0200 9.7758 30/09/14 13.3334 10.8108 30/09/15 15.0618 11.8150
30/09/16 13.6213 11.0046 Origin Global Smaller Companies Fund I Class – Accumulation 30/09/13 11.1695 9.7097 30/09/14 13.3136 11.0280 30/09/15 14.3960 11.6425 30/09/16 13.9164 11.2870 I Class – Accumulation (GBP)
30/09/13 11.2084 9.7440 30/09/14 13.3599 11.0774 30/09/15 14.4458 11.6828 30/09/16 13.9670 11.3273 Long/Short Global Opportunities Equity Fund I Class – Accumulation 30/09/13 10.0053 9.8734 30/09/14 10.4298 9.8876 30/09/15 10.5379 10.0729 30/09/16 10.4804 9.4990 Claritas Latin American Equity Fund I Class – Accumulation 30/09/13 10.0000 9.8070 30/09/14 11.0759 8.5998 30/09/15 9.8352 5.6600 30/09/16 7.9824 5.0958 Finisterre Emerging Market Debt Fund A Class – Income
30/09/15 10.0240 9.3765 30/09/16 9.8288 9.1521 A Class – Accumulation 30/09/15 10.1036 9.4697 30/09/16 9.9240 9.2430 A Class – Accumulation (CHF hedged) 30/09/15 10.5696 9.2477 30/09/16 9.7129 8.6891 A Class – Accumulation (EUR hedged) 30/09/15 10.4850 9.6575 30/09/16 10.1495 9.0814 A Class – Accumulation (GBP hedged) 30/09/15 10.6338 9.6344 30/09/16 9.8428 8.5325 A Class – Accumulation (SGD hedged) 30/09/15 10.4915 9.10478 30/09/16 10.2112 8.8283
Finisterre Emerging Market Debt Fund (continued) Year Ended Highest Price
Per Unit USD
Lowest Price Per Unit
USD I Class – Accumulation 30/09/14 10.8949 9.9668 30/09/15 11.1185 10.4638 30/09/16 11.0059 10.2330
I Class – Accumulation (EUR hedged)
30/09/14 10.0504 9.4417 30/09/15 9.5255 7.9115 30/09/16 8.4321 7.5328 I Class – Accumulation (GBP hedged)
30/09/15 10.6439 9.6699 30/09/16 9.8845 8.6051 I2 Class – Income (EUR hedged) 30/09/14 10.0668 9.3220 30/09/15 9.4058 7.8215 30/09/16 8.4074 7.4711 Spectrum Global Capital Securities Fund A Class – Accumulation 30/09/16 10.1298 9.9584 I Class – Accumulation 30/09/15 10.6473 9.8576 30/09/16 11.0747 9.5185 I Class – Accumulation (EUR hedged) 30/09/15 10.4912 10.0313 30/09/16 10.7888 9.2749
Global Short Duration High Yield Fund** I Class – Accumulation 30/09/15 10.3847 9.9542 Global Capital Structure Opportunities Fund I Class – Accumulation 30/09/15 10.4073 9.9775 30/09/16 10.6928 9.8177 Global Credit Alpha Fund I Class – Accumulation 30/09/15 11.1952 10.6157 30/09/16 11.2820 10.0418
Real Estate Debt Fund***
I Class – Income
30/09/16 10.4901 9.9568
I Class – Accumulation 30/09/16
10.6532 9.9568
**Global Short Duration High Yield Fund terminated on 1 July 2016. ***Real Estate Debt Fund launched on 21 March 2016.
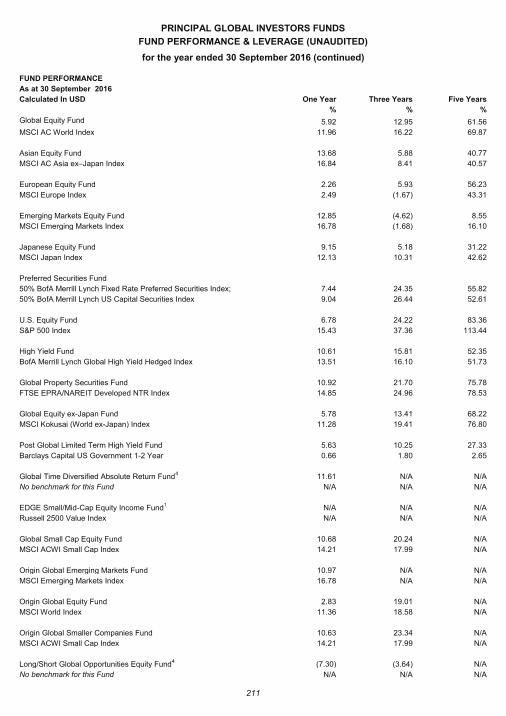
PRINCIPAL GLOBAL INVESTORS FUNDS
FUND PERFORMANCE & LEVERAGE (UNAUDITED)
for the year ended 30 September 2016 (continued)
211
FUND PERFORMANCE
As at 30 September 2016
Calculated In USD One Year Three Years Five Years
%
% %
Global Equity Fund
5.92 12.95 61.56
MSCI AC World Index 11.96 16.22 69.87
Asian Equity Fund 13.68 5.88 40.77
MSCI AC Asia ex–Japan Index 16.84 8.41 40.57
European Equity Fund 2.26 5.93 56.23
MSCI Europe Index 2.49 (1.67) 43.31
Emerging Markets Equity Fund 12.85 (4.62) 8.55
MSCI Emerging Markets Index 16.78 (1.68) 16.10
Japanese Equity Fund 9.15 5.18 31.22
MSCI Japan Index 12.13 10.31 42.62
Preferred Securities Fund
50% BofA Merrill Lynch Fixed Rate Preferred Securities Index; 7.44 24.35 55.82
50% BofA Merrill Lynch US Capital Securities Index 9.04 26.44 52.61
U.S. Equity Fund 6.78 24.22 83.36
S&P 500 Index 15.43 37.36 113.44
High Yield Fund 10.61 15.81 52.35
BofA Merrill Lynch Global High Yield Hedged Index 13.51 16.10 51.73
Global Property Securities Fund 10.92 21.70 75.78
FTSE EPRA/NAREIT Developed NTR Index 14.85 24.96 78.53
Global Equity ex-Japan Fund 5.78 13.41 68.22
MSCI Kokusai (World ex-Japan) Index 11.28 19.41 76.80
Post Global Limited Term High Yield Fund 5.63 10.25 27.33
Barclays Capital US Government 1-2 Year 0.66 1.80 2.65
Global Time Diversified Absolute Return Fund4 11.61 N/A N/A
No benchmark for this Fund N/A N/A N/A
EDGE Small/Mid-Cap Equity Income Fund1 N/A N/A N/A
Russell 2500 Value Index N/A N/A N/A
Global Small Cap Equity Fund 10.68 20.24 N/A
MSCI ACWI Small Cap Index 14.21 17.99 N/A
Origin Global Emerging Markets Fund 10.97 N/A N/A
MSCI Emerging Markets Index 16.78 N/A N/A
Origin Global Equity Fund 2.83 19.01 N/A
MSCI World Index 11.36 18.58 N/A
Origin Global Smaller Companies Fund 10.63 23.34 N/A
MSCI ACWI Small Cap Index 14.21 17.99 N/A
Long/Short Global Opportunities Equity Fund4 (7.30) (3.64) N/A
No benchmark for this Fund N/A N/A N/A
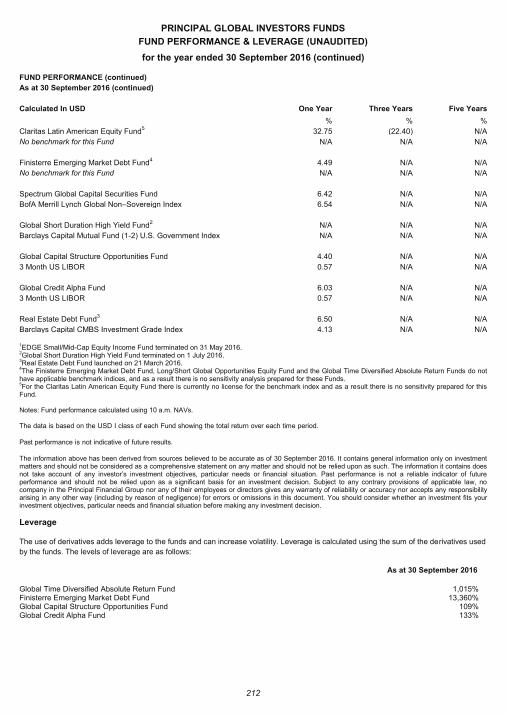
PRINCIPAL GLOBAL INVESTORS FUNDS
FUND PERFORMANCE & LEVERAGE (UNAUDITED)
for the year ended 30 September 2016 (continued)
212
FUND PERFORMANCE (continued)
As at 30 September 2016 (continued)
Calculated In USD One Year Three Years Five Years
% % %
Claritas Latin American Equity Fund5 32.75 (22.40) N/A
No benchmark for this Fund N/A N/A N/A
Finisterre Emerging Market Debt Fund4 4.49 N/A N/A
No benchmark for this Fund N/A N/A N/A
Spectrum Global Capital Securities Fund 6.42 N/A N/A
BofA Merrill Lynch Global Non–Sovereign Index 6.54 N/A N/A
Global Short Duration High Yield Fund2 N/A N/A N/A
Barclays Capital Mutual Fund (1-2) U.S. Government Index N/A N/A N/A
Global Capital Structure Opportunities Fund 4.40 N/A N/A
3 Month US LIBOR 0.57 N/A N/A
Global Credit Alpha Fund 6.03 N/A N/A
3 Month US LIBOR 0.57 N/A N/A
Real Estate Debt Fund3 6.50 N/A N/A
Barclays Capital CMBS Investment Grade Index 4.13 N/A N/A
1EDGE Small/Mid-Cap Equity Income Fund terminated on 31 May 2016.
2Global Short Duration High Yield Fund terminated on 1 July 2016. 3Real Estate Debt Fund launched on 21 March 2016. 4The Finisterre Emerging Market Debt Fund, Long/Short Global Opportunities Equity Fund and the Global Time Diversified Absolute Return Funds do not have applicable benchmark indices, and as a result there is no sensitivity analysis prepared for these Funds. 5For the Claritas Latin American Equity Fund there is currently no license for the benchmark index and as a result there is no sensitivity prepared for this Fund. Notes: Fund performance calculated using 10 a.m. NAVs. The data is based on the USD I class of each Fund showing the total return over each time period.
Past performance is not indicative of future results.
The information above has been derived from sources believed to be accurate as of 30 September 2016. It contains general information only on investment matters and should not be considered as a comprehensive statement on any matter and should not be relied upon as such. The information it contains does not take account of any investor’s investment objectives, particular needs or financial situation. Past performance is not a reliable indicator of future performance and should not be relied upon as a significant basis for an investment decision. Subject to any contrary provisions of applicable law, no company in the Principal Financial Group nor any of their employees or directors gives any warranty of reliability or accuracy nor accepts any responsibility arising in any other way (including by reason of negligence) for errors or omissions in this document. You should consider whether an investment fits your investment objectives, particular needs and financial situation before making any investment decision.
Leverage
The use of derivatives adds leverage to the funds and can increase volatility. Leverage is calculated using the sum of the derivatives used
by the funds. The levels of leverage are as follows:
As at 30 September 2016
Global Time Diversified Absolute Return Fund 1,015% Finisterre Emerging Market Debt Fund 13,360% Global Capital Structure Opportunities Fund 109% Global Credit Alpha Fund 133%
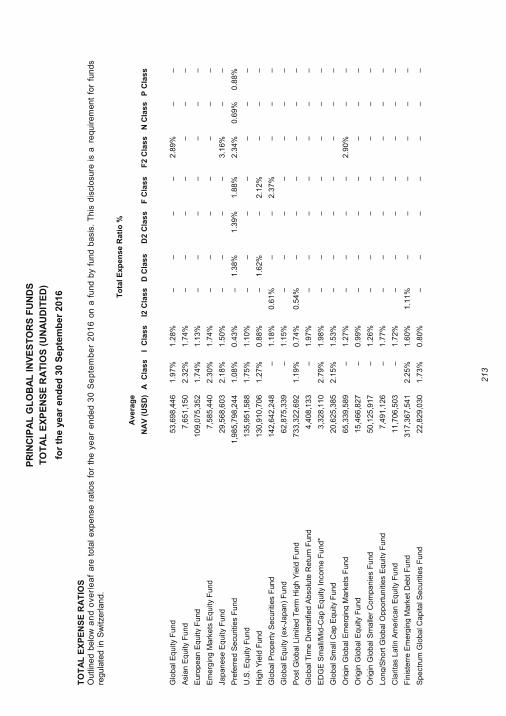
PR
INC
IPA
L G
LO
BA
L IN
VE
ST
OR
S F
UN
DS
TO
TA
L E
XP
EN
SE
RA
TIO
S (
UN
AU
DIT
ED
)
for
the y
ear
en
ded
30 S
ep
tem
ber
201
6
213
TO
TA
L E
XP
EN
SE
RA
TIO
S
Ou
tlined b
elo
w a
nd
ove
rle
af
are
to
tal
exp
en
se
ra
tio
s f
or
the y
ea
r e
nd
ed
30
Se
pte
mb
er
20
16
on a
fu
nd
by
fund
basis
. T
his
dis
clo
sure
is a
re
qu
irem
ent
for
fun
ds
regu
late
d i
n S
witze
rlan
d.
T
ota
l E
xp
en
se
Ra
tio
%
Ave
rag
e
NA
V (
US
D)
A
Cla
ss
I
Cla
ss
I2 C
las
s
D C
las
s
D2 C
las
s
F C
las
s
F2
Cla
ss
N C
las
s
P C
las
s
Glo
ba
l E
qu
ity
Fu
nd
5
3,6
98
,44
6
1.9
7%
1
.28
%
–
–
–
–
2.8
9%
–
–
Asia
n E
qu
ity F
un
d
7
,65
1,1
50
2.3
2%
1
.74
%
–
–
–
–
–
–
–
Eu
rop
ean
Eq
uity
Fu
nd
1
09
,07
5,3
52
1.7
4%
1
.13
%
–
–
–
–
–
–
–
Em
erg
ing
Ma
rke
ts E
qu
ity F
und
7
,58
5,4
40
2.3
0%
1
.74
%
–
–
–
–
–
–
–
Ja
pan
ese
Eq
uity
Fu
nd
29
,56
8,6
03
2.1
8%
1
.50
%
–
–
–
–
3.1
6%
–
–
Pre
ferr
ed S
ecu
ritie
s F
un
d
1
,98
5,7
98
,24
4
1.0
8%
0
.43
%
–
1.3
8%
1
.39
%
1.8
8%
2
.34
%
0.6
9%
0
.88
%
U.S
. E
qu
ity
Fun
d
1
35
,95
1,5
88
1.7
5%
1
.10
%
–
–
–
–
–
–
–
Hig
h Y
ield
Fu
nd
13
0,9
10
,70
6
1.2
7%
0
.88
%
–
1.6
2%
–
2
.12
%
–
–
–
Glo
ba
l P
rop
ert
y S
ecu
rities F
und
14
2,6
42
,24
8
–
1.1
8%
0
.61
%
–
–
2.3
7%
–
–
–
Glo
ba
l E
qu
ity
(ex-
Ja
pan
) F
und
6
2,8
75
,339
–
1.1
5%
–
–
–
–
–
–
–
Po
st
Glo
ba
l Lim
ited
Te
rm H
igh Y
ield
Fu
nd
73
3,3
22
,69
2
1.1
9%
0
.74
%
0.5
4%
–
–
–
–
–
–
Glo
ba
l T
ime
Div
ers
ifie
d A
bso
lute
Re
turn
Fun
d
4,4
08
,13
3
–
1.9
7%
–
–
–
–
–
–
–
ED
GE
Sm
all/
Mid
-Cap
Eq
uity
Incom
e F
un
d*
3
,32
8,1
10
2.7
9%
1
.98
%
–
–
–
–
–
–
–
Glo
ba
l S
ma
ll C
ap E
qu
ity F
un
d
2
0,6
25
,385
2.1
5%
1
.53
%
–
–
–
–
–
–
–
Ori
gin
Glo
ba
l E
me
rgin
g M
ark
ets
Fun
d
6
5,3
39
,589
–
1.2
7%
–
–
–
–
2
.90
%
–
–
Ori
gin
Glo
ba
l E
qu
ity
Fu
nd
15
,466
,827
–
0.9
9%
–
–
–
–
–
–
–
Ori
gin
Glo
ba
l S
malle
r C
om
pa
nie
s F
un
d
5
0,1
25
,917
–
1.2
6%
–
–
–
–
–
–
–
Lo
ng
/Sh
ort
Glo
ba
l Opp
ort
un
itie
s E
quity
Fu
nd
7
,49
1,1
26
–
1.7
7%
–
–
–
–
–
–
–
Cla
rita
s L
atin
Am
erican
Eq
uity
Fu
nd
11
,706
,503
–
1.7
2%
–
–
–
–
–
–
–
Fin
iste
rre E
me
rgin
g M
ark
et
Deb
t F
und
31
7,3
67
,54
1
2.2
5%
1
.60
%
1.1
1%
–
–
–
–
–
–
Sp
ectr
um
Glo
ba
l Ca
pita
l S
ecuri
ties F
un
d
2
2,8
29
,030
1.7
3%
0
.80
%
–
–
–
–
–
–
–
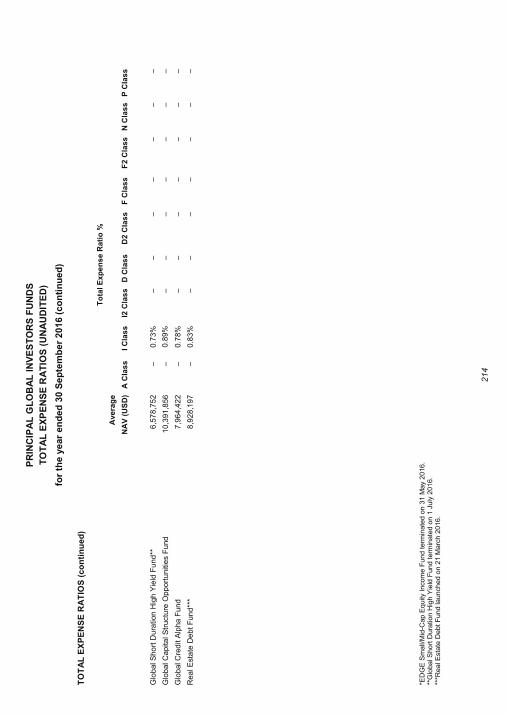
PR
INC
IPA
L G
LO
BA
L IN
VE
ST
OR
S F
UN
DS
TO
TA
L E
XP
EN
SE
RA
TIO
S (
UN
AU
DIT
ED
)
for
the y
ear
en
ded
30 S
ep
tem
ber
201
6 (
co
nti
nu
ed
)
214
TO
TA
L E
XP
EN
SE
RA
TIO
S (
co
nti
nu
ed
)
To
tal
Ex
pe
ns
e R
ati
o %
Ave
rag
e
NA
V (
US
D)
AC
las
sI
Cla
ss
I2 C
las
sD
Cla
ss
D2 C
las
sF
Cla
ss
F2
Cla
ss
NC
las
sP
Cla
ss
Glo
ba
l S
ho
rt D
ura
tion
Hig
h Y
ield
Fu
nd
**6
,57
8,7
52
–0
.73
%–
––
––
––
Glo
ba
l C
ap
ital S
tructu
re O
pp
ort
un
itie
s F
und
10
,391
,856
––
––
––
––
Glo
ba
l C
red
it A
lpha
Fun
d7
,96
4,4
22
–0
.78
%–
––
––
––
Rea
l E
sta
te D
eb
t F
un
d**
*8
,92
8,1
97
–0
.83
%–
––
––
––
*ED
GE
Sm
all/
Mid
-Cap E
quity
Inco
me F
und term
inate
d o
n 3
1 M
ay 2
016.
**G
lobal S
hort
Dura
tion H
igh Y
ield
Fund term
inate
d o
n 1
July
2016.
***R
eal E
sta
te D
ebt F
und launched o
n 2
1 M
arc
h 2
016.
PRINCIPAL GLOBAL INVESTORS FUNDS
UCITS V Remuneration Policy (UNAUDITED)
for the year ended 30 September 2016 (continued)
215
UCITS V Remuneration Policy (Unaudited) 1 INTRODUCTION The Company has been authorised by the Central Bank as a UCITS management company pursuant to the UCITS Regulations. Regulation 24A of the UCITS Regulations requires UCITS management companies, such as the Company to, "establish and apply remuneration policies and practices that (a) are consistent with and promote sound and effective risk management, (b) do not encourage risk taking that is inconsistent with the risk profiles, rules or instruments of incorporation of the UCITS that the management company manages, and (c) do not impair compliance with the management company's duty to act in the best interest of the UCITS that it manages." The Company has prepared this remuneration policy (the "Remuneration Policy") to outline how it adheres to the remuneration requirements set out in the UCITS Regulations. The purpose of this Remuneration Policy is to provide a clear direction and policy regarding the Company's remuneration policies and practices consistent with the principles in the UCITS Regulations. This document forms the written element of the remuneration policy for the Company. This supplements and should be read in conjunction with, the Company's regulatory framework documentation, in particular its UCITS business plan. The board of directors of the Company (the “Board”) recognises the important role played by sound risk management in protecting its stakeholders. Moreover, the Board acknowledges that inappropriate remuneration structures could, in certain circumstances; result in situations whereby individuals assume more risk on the relevant institution’s behalf than they would have done had they not been remunerated in this way. In addition to ensuring that this Remuneration Policy aligns the risk taking behaviour of staff with the Company’s risk appetite, the remuneration policy is designed to ensure that the Company is able to attract, retain and motivate highly qualified staff in order to produce long term value creation for shareholders. In preparing this Remuneration Policy, the Company has taken into account the nature, scale and complexity of its business. In determining the range of activities to be undertaken by the Company, the Company has given due consideration to the number of funds it acts as UCITS management company for, the type of investments of such funds, the investment strategies of such funds, the investment location, the distribution model and the investor base of such funds. Due consideration has also been given to the resources available to the Company and the resources and expertise of the various third parties engaged to support the Company and carry out certain functions on its behalf. The Company is also authorised by the Central Bank as an alternative investment fund manager ("AIFM") under the Part 2 of the AIFM Regulations and applies a separate remuneration policy in accordance with the AIFM Regulations in respect of the funds it acts as AIFM for. 2 APPLICABLE REGULATIONS AND INTERPRETATION For the purposes of this Remuneration Policy, the following defined terms and legislative/regulatory references are of particular note:
"AIFM Regulations" means the European Union (Alternative Investment Fund Managers Directive) Regulations (S.I. No. 257 of 2013), as amended;
"AIFMD" means the Alternative Investment Fund Managers Directive (Directive 2011/61/EU); "Applicable UCITS Regulation"
means collectively the UCITS Directive, the UCITS Regulations, and the Central Bank UCITS Regulations, as appropriate;
"Central Bank" means the Central Bank of Ireland; "Central Bank UCITS Regulations"
means the Central Bank (Supervision and Enforcement) Act 2013 (Section 48(1)) (Undertakings for Collective Investment in Transferable Securities) Regulations 2015 as amended, consolidated or substituted from time to time;
"ESMA" means the European Securities and Market Authority; "ESMA UCITS Q&A" means ESMA's Questions and Answers on the Application of the UCITS Directive
(ESMA/2016/569); "Fund"
means Principal Global Investors Funds, or any other fund pursuant to which the Company acts as a UCITS management company;
PRINCIPAL GLOBAL INVESTORS FUNDS
UCITS V Remuneration Policy (UNAUDITED)
for the year ended 30 September 2016 (continued)
216
UCITS V Remuneration Policy (Unaudited) (continued) 2 APPLICABLE REGULATIONS AND INTERPRETATION (continued)
"Guidelines"
means ESMA's Guidelines on sound remuneration policies under the UCITS Directive, applicable from 1 January 2017 (ESMA/2016/575);
“UCITS Regulations”
means the European Communities (Undertakings for Collective Investment in Transferable Securities) Regulations, 2011 (S.I. No. 352 of 2011), as amended, consolidated or substituted from time to time.
All other stated defined terms used in this Remuneration Policy shall have the same meaning as in the Company's UCITS business plan. In relation to various aspects of this Remuneration Policy where there is any perceived ambiguity or lack of clarity in the Applicable UCITS Regulation and/or the Guidelines, the Company will have regard to any published guidance on the relevant point by the Central Bank or ESMA or in the absence of any such published guidance that of any other EU national competent authority, if appropriate. In the absence of such additional supporting guidance in relevant instances regard may also be had to any guidance published by any of the relevant regulatory bodies in the context of AIFMD remuneration requirements, to the extent it provides guidance on corresponding elements to the UCITS requirements being considered. The Company has reviewed and understands all regulatory requirements applicable to its Remuneration Policy set out in the Applicable UCITS Regulation and has addressed these requirements in this Remuneration Policy and/or materials referenced herein. 3 SCOPE OF REMUNERATION Remuneration consists of all forms of payments or benefits made directly by, or indirectly, but on behalf of the Company, in exchange for professional services rendered by staff. This shall include where appropriate: (i) all forms of payments or benefits paid by the Company; (ii) any amount paid by the Funds, including any portion of performance fees; and/or (iii) any transfer of units or shares of any Funds; in exchange for professional services rendered by the Identified Staff (as defined in section 4 below). For the purpose of item (ii) above, whenever payments, excluding reimbursements of costs and expenses, are made directly by the Funds to the Company for the benefit of the relevant categories of Identified Staff, for professional services rendered, which may otherwise result in a circumvention of the relevant remuneration rules, they shall be considered remuneration for the purpose of this Remuneration Policy. Fixed remuneration means payments or benefits without consideration of any performance criteria. Variable remuneration means additional payments or benefits depending on performance or, in certain cases, other contractual criteria
4 IDENTIFIED STAFF The provisions of this Remuneration Policy only apply only to “Identified Staff”. Pursuant to the term as defined in the Guidelines, Identified Staff are staff members who have a material impact on the Company’s risk profile, as follows: "categories of staff, including senior management, risk takers, Control Functions and any employee receiving total remuneration that falls into the remuneration bracket of senior management and risk takers, whose professional activities have a material impact on the management company’s risk profile or the risk profiles of the UCITS that it manages and categories of staff of the entity(ies) to which investment management activities have been delegated by the management company, whose professional activities have a material impact on the risk profiles of the UCITS that the management company manages" For the above purposes, "Control Functions" means:
PRINCIPAL GLOBAL INVESTORS FUNDS
UCITS V Remuneration Policy (UNAUDITED)
for the year ended 30 September 2016 (continued)
217
UCITS V Remuneration Policy (Unaudited) (continued) 4 IDENTIFIED STAFF (continued) "staff (other than senior management) responsible for risk management, compliance, internal audit and similar functions within a management company (e.g. the CFO to the extent that he/she is responsible for the preparation of the financial statements)." For the above purposes, "remuneration bracket" means: "the range of the total remuneration of each of the staff members in the senior manager and risk taker categories – from the highest paid to the lowest paid in these categories." The following categories of staff, unless it is demonstrated that they have no material impact on the Company’s risk profile or on a UCITS it manages, should be included as the Identified Staff:
· directors;
· senior management;
· staff responsible for Control Functions;
· staff responsible for heading the investment management, administration, marketing, human resources;
· other risk takers – such as staff members who acting individually or as part of a group can exert material influence on the Company’s risk profile or on a UCITS it manages;
Additionally, staff whose remuneration takes them into the same bracket as senior managers and risk takers but who don’t fall into one of the categories above must be assessed to determine whether they have a material impact on the risk profile of the Company or of a UCITS it manages and should be included as Identified Staff. A list of the Company’s Identified Staff is appended herewith (at Schedule 1). It should be noted that the inclusions of persons in Schedule 1 shall relate specifically to their role within the Company and their remuneration (if any) received directly by the Company and shall not affect any other role or remuneration such persons may otherwise receive from entities connected with the Company, delegates of the Company or otherwise. Any new staff will be considered for inclusion on this list when they are hired or if their role changes. It will be the responsibility of the Chairman of the Board in consultation with the Compliance Officer to make recommendations to the Board to include staff on this list. The list will be reviewed by the Board on an annual basis. 5 REMUNERATION PROCESS AND PRINCIPLES 5.1 Variable remuneration Variable remuneration is an important tool to incentivise staff. It also gives the Company flexibility such that, in years where the Company performs poorly, variable remuneration may be reduced or eliminated and the capital of the Company can be preserved. In some circumstances, however, variable remuneration, if inappropriately structured, can lead to excessive risk taking as employees may be incentivised to keep taking risk to maintain or increase their variable remuneration. In deciding the mix between fixed and variable remuneration of Identified Staff, the Company is mindful of the need to ensure that the basic pay of staff is adequate to remunerate the professional services rendered taking into account, inter alia, the level of education, the degree of seniority, the level and expertise and skills required. Because the Company is a trading business its revenues may be more volatile than non-trading businesses. Variable remuneration allows the Company to reduce the risk that its capital base is eroded due to the need to pay fixed remuneration cost should trading revenues decline. For these reasons, the Company’s ratio of variable pay to fixed pay may be higher than other businesses with more steady income streams. 5.2 Remuneration process Following the finalisation of the annual financial statements and during the first quarter of each financial year in respect of the Company, the Company shall decide what, if any, variable compensation to award staff.

PRINCIPAL GLOBAL INVESTORS FUNDS
UCITS V Remuneration Policy (UNAUDITED)
for the year ended 30 September 2016 (continued)
218
UCITS V Remuneration Policy (Unaudited) (continued) 5 REMUNERATION PROCESS AND PRINCIPLES (continued) 5.2 Remuneration process (continued) The factors that are taken into account in deciding the quantum of the variable remuneration are as follows:
· the profit that the Company made during the previous year;
· for revenue producing roles, the risk and resource adjusted profit or loss in comparison to the expected profit or loss in addition to the achievement of any specific objectives;
· the resources that were consumed (for example IT, capital, legal and compliance resources);
· for non-revenue producing roles, achievement against objectives and whether the individual exceeded what was expected of them during the year;
· for all roles, compliance by the individual with all relevant compliance and risk requirements and other firm policies and procedures;
· for all roles, the achievement of objectives which are set during the annual review process and updated during the year;
· whether the individual helped to develop new businesses, improved processes, worked in a collegial way and assisted in the training, education and mentoring of other employees;
· other factors as may be determined from time to time by the Board. 5.3 Remuneration principles – in compliance with UCITS requirements It is primarily the responsibility of the Company to assess its own characteristics and to develop and implement remuneration policies and practices which appropriately align the risks faced and provide adequate and effective incentives to its Identified Staff. When establishing and applying the total remuneration, inclusive of salaries and discretionary pension benefits for Identified Staff, the Company shall comply with the following general principles in a way and to the extent that is appropriate taking into account its size, internal organisation and the nature, scope and complexity of its activities:
a) Identified Staff engaged in Control Functions are compensated in accordance with the achievement of the objectives linked to their functions, independently of the performance of the business areas that they control in order to avoid any conflict of interest;
b) where remuneration is performance related, the total amount of remuneration is based on a combination of the assessment as to the performance of the individual and of the business unit or Fund concerned and as to their risks and of the overall results of the Company when assessing individual performance, taking into account financial and non-financial criteria;
c) the assessment of performance is set in a multi-year framework appropriate to the holding period recommended to the investors of the Fund managed by the Company in order to ensure that the assessment process is based on the longer-term performance of the Fund and its investment risks and that the actual payment of performance-based components of remuneration is spread over the same period;
d) guaranteed variable remuneration is exceptional, occurs only in the context of hiring new staff and is limited to the first year of engagement;
e) fixed and variable components of total remuneration are appropriately balanced and the fixed component represents a sufficiently high proportion of the total remuneration to allow the operation of a fully flexible policy on variable remuneration components, including the possibility to pay no variable remuneration component;
f) payments relating to the early termination of a contract reflect performance achieved over time and are designed in a way that does not reward failure;
g) the measurement of performance used to calculate variable remuneration components or pools of variable remuneration components includes a comprehensive adjustment mechanism to integrate all relevant types of current and future risks;
PRINCIPAL GLOBAL INVESTORS FUNDS
UCITS V Remuneration Policy (UNAUDITED)
for the year ended 30 September 2016 (continued)
219
UCITS V Remuneration Policy (Unaudited) (continued) 5 REMUNERATION PROCESS AND PRINCIPLES (continued) 5.3 Remuneration principles – in compliance with UCITS requirements (continued)
h) subject to the legal structure of the Funds and its rules or instruments of incorporation, a substantial portion, and in any event at least 50 %, of any variable remuneration component consists of units or shares of the Funds concerned, equivalent ownership interests, or share-linked instruments or equivalent non-cash instruments with equally effective incentives as any of the instruments referred to in this point (h), unless the management of the Funds accounts for less than 50 % of the total portfolio managed by the Company, in which case the minimum of 50 % does not apply;
i) a substantial portion, and in any event at least 40 %, of the variable remuneration component, is deferred over a period which is appropriate in view of the holding period recommended to the investors of the Funds concerned and is correctly aligned with the nature of the risks of the Funds in question. The period referred to in this point shall be at least three years; remuneration payable under deferral arrangements vests no faster than on a pro-rata basis; in the case of a variable remuneration component of a particularly high amount, at least 60 % of the amount shall be deferred;
j) the variable remuneration, including the deferred portion, is paid or vests only if it is sustainable according to the financial situation of the Company as a whole, and justified according to the performance of the business unit, the Funds and the individual concerned. The total variable remuneration shall generally be considerably contracted where subdued or negative financial performance of the Company or of the Funds concerned occurs, taking into account both current compensation and reductions in payouts of amounts previously earned, including through malus or clawback arrangements;
k) any pension policy (if such policy is put in place in the future) is in line with the business strategy, objectives, values and long-term interests of the Company and the Funds that it manages. If the employee leaves the Company before retirement, discretionary pension benefits, if any, shall be held by the Company for a period of five years in the form of instruments defined in point (h) above. In the case of an employee reaching retirement, discretionary pension benefits shall be paid to the employee in the form of instruments defined in point (h) above, subject to a five-year retention period;
l) Identified Staff are required to undertake not to use personal hedging strategies or remuneration- and liability-
related insurance to undermine the risk alignment effects embedded in their remuneration arrangements; and
m) variable remuneration may not be paid through vehicles or methods that facilitate the avoidance of the requirements of the UCITS Regulations.
6 SCOPE OF THE REMUNERATION POLICY AND APPLICATION OF THE PRINCIPLES 6.1 Delegates The Company has the facility to appoint delegates to carry out investment management functions (including risk management) on its behalf. In accordance with the Guidelines, where the UCITS remuneration rules would otherwise be circumvented, the Company will seek to ensure that affected delegates (i.e. those entities to which investment activities have been delegated) are subject to regulatory requirements on remuneration that are "equally as effective" as those applicable under the Guidelines or that appropriate contractual agreements are in place to ensure that the delegation arrangements do not circumvent the remuneration requirements contained in the Guidelines. [It is noted that in certain confined circumstances it may be determined that the scope of the mandate granted to a particular delegate is such that no staff of the delegate will constitute Identified Staff for the purposes of this Remuneration Policy, i.e. have the capacity to carry out their professional activities under the delegation arrangement in a manner which could have a material impact on the risk profile of the relevant UCITS. This could be the case where the Company retains a sufficient degree of control and supervision over the activities of the delegate and restricts the discretionary nature of their activities (for example, through the application of detailed contractual restrictions set by the Company which tightly constrain how the delegate may discharge its delegated functions).] 6.2 Proportionality Regulation 24B(1) of the UCITS Regulations states that UCITS management companies shall comply with the UCITS
PRINCIPAL GLOBAL INVESTORS FUNDS
UCITS V Remuneration Policy (UNAUDITED)
for the year ended 30 September 2016 (continued)
220
UCITS V Remuneration Policy (Unaudited) (continued) 6 SCOPE OF THE REMUNERATION POLICY AND APPLICATION OF THE PRINCIPLES (continued) 6.2 Proportionality (continued) remuneration principles "in a manner and to the extent that is appropriate to their size, internal organisation and the nature, scope and complexity of their activities." While it is noted that the Guidelines do not expressly provide for the disapplication of certain UCITS remuneration principles on the grounds of proportionality, this is not expressly prohibited either. Indeed, ESMA indicated, in a letter to the European Commission on this issue1, that "there might be cases where the application of the payout process rules to the staff of the delegate would not be proportionate and would not achieve the outcome of aligning the delegates’ staff interests with those of the investors in the UCITS." In the absence of further guidance or legal clarification from the European Commission, ESMA or the Central Bank, it is noted by the Company that an applicable delegate may determine to disapply the principles outlined in sections 5.3(h) and (i) respectively on the grounds of proportionality - based on the proportionality criteria outlined in the Guidelines on (i) size, (ii) internal organisation and (iii) nature, scope and complexity of the relevant delegate's business. Factors that the relevant delegate may consider in arriving at such a conclusion may include the size of the delegate's balance sheet, the proportionate value of UCITS assets managed relative to non-UCITS assets managed (and resultant UCITS/non-UCITS revenue generated) and therefore whether the UCITS assets managed by the relevant delegate are not "potentially systemically important (e.g. in terms of total assets under management)"2. This approach will be reviewed and reassessed, as necessary for subsequent financial periods following the issuance of any further regulatory guidance or legal clarification that conflicts with this current position. In respect of the Company itself, the Board finds that it is not necessary to consider further the proportionality provisions as it will not wish to disapply the principles outlined in section 5.3(h) and (i) to the Company's Identified Staff. 6.3 "Equally as Effective" Regimes Pursuant to the Guidelines, the UCITS remuneration principles are not required to be applied to delegates performing investment management functions when such delegates are subject to regulatory requirements on remuneration that are "equally as effective" as the UCITS remuneration principles. It is noted that the Guidelines provide that entities that are subject to the remuneration rules under AIFMD or CRD IV (Directive 2013/36/EU) can be considered to meet this condition. Based on prior guidance issued by the Central Bank on the corresponding and identical requirement in the context of the AIFMD remuneration principles and in the absence of further specific guidance or legal clarification from the European Commission, ESMA or the Central Bank in the context of the UCITS remuneration requirements, the Company considers that the following categories of delegate entities also meet this condition:
i. CRD/MiFID firms (including firms still subject to CRD III and which have availed of the CRD IV exemptions); and
ii. non-EU firms which are subject to group remuneration policies that are equally as effective as MiFID or CRD. This approach will be reviewed and reassessed, as necessary for subsequent financial periods following the issuance of any further regulatory guidance or legal clarification that conflicts with this current position. 7 ABSENCE OF A REMUNERATION COMMITTEE It is noted that the requirement for a UCITS management company to establish a remuneration committee (pursuant to Regulation 24B(3) of the UCITS Regulations) applies to a management company "that is significant in terms of its size or the size of the UCITS that it manages, its internal organisation and the nature, scope and complexity of its activities." This criteria is to be assessed in accordance with the Guidelines. The Guidelines (paragraph 55) provide that:
PRINCIPAL GLOBAL INVESTORS FUNDS
UCITS V Remuneration Policy (UNAUDITED)
for the year ended 30 September 2016 (continued)
221
UCITS V Remuneration Policy (Unaudited) (continued) 7 ABSENCE OF A REMUNERATION COMMITTEE (continued) "When assessing whether or not a management company is significant, a management company should consider the cumulative presence of all the three factors (i.e. its size or the size of the UCITS it manages, its internal organisation and the nature, scope and complexity of its activities). A management company which is significant only with respect to one or two of the three above factors should not be required to set up a remuneration committee." In terms of what "internal organisation" means, the Guidelines elsewhere state as follows: "Internal organization: this can relate to the legal structure of the management company or the UCITS it manages, the complexity of the internal governance structure of the management company, the listing on regulated markets of the management company or the UCITS it manages. This criterion should be assessed having regard to the entire organisation of the management company including all the UCITS it manages, meaning that for instance the listing of one UCITS should not by itself be sufficient for considering the management company as having a complex internal organisation" Having assessed this, the Company has determined that it is not "significant" with respect to its internal organisation and therefore shall not be required to establish a remuneration committee. 8 BOARD OVERSIGHT AND UPDATES TO THIS REMUNERATION POLICY The Board will be responsible for the oversight of compliance with this Remuneration Policy. It will review the appropriateness of this Remuneration Policy annually and will ensure that it is operating as intended. It will also review this Remuneration Policy to ensure that it continues to be compliant with applicable national and international regulations, principles and standards. This Remuneration Policy shall be reviewed and updated as necessary on at least an annual basis or as and when is required or deemed necessary by the Company. Material changes to this Remuneration Policy will be approved by the Board. 9 FIRST ANNUAL PERFORMANCE PERIOD Pursuant to paragraph 5 of the Guidelines, the variable remuneration rules contained in the Guidelines should first apply for the calculation of payments relating to new awards of variable remuneration to Identified Staff for the first full performance period commencing after 1 January 2017. Pursuant to the ESMA UCITS Q&A, for any intervening periods, the Company shall include the remuneration related information in the Funds' annual report on a best efforts basis and to the extent possible, explaining the basis for any omission. 1https://www.esma.europa.eu/sites/default/files/library/2016412_letter_to_european_commission_european_council_and_european_parliament_on_the_proportionality_principle_and_remuneration_rules_in_the_financial_sector.pdf 2 Paragraph 25 of the Guidelines; guidance on the "size" criteria for proportionality purposes.
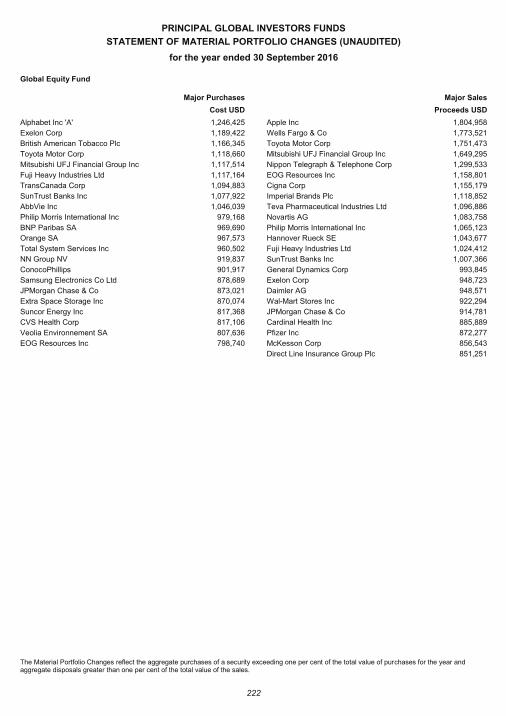
PRINCIPAL GLOBAL INVESTORS FUNDS
STATEMENT OF MATERIAL PORTFOLIO CHANGES (UNAUDITED)
for the year ended 30 September 2016
222
Global Equity Fund
Major Purchases Major Sales
Cost USD Proceeds USD
Alphabet Inc 'A' 1,246,425 Apple Inc 1,804,958
Exelon Corp 1,189,422 Wells Fargo & Co 1,773,521
British American Tobacco Plc 1,166,345 Toyota Motor Corp 1,751,473
Toyota Motor Corp 1,118,660 Mitsubishi UFJ Financial Group Inc 1,649,295
Mitsubishi UFJ Financial Group Inc 1,117,514 Nippon Telegraph & Telephone Corp 1,299,533
Fuji Heavy Industries Ltd 1,117,164 EOG Resources Inc 1,158,801
TransCanada Corp 1,094,883 Cigna Corp 1,155,179
SunTrust Banks Inc 1,077,922 Imperial Brands Plc 1,118,852
AbbVie Inc 1,046,039 Teva Pharmaceutical Industries Ltd 1,096,886
Philip Morris International Inc 979,168 Novartis AG 1,083,758
BNP Paribas SA 969,690 Philip Morris International Inc 1,065,123
Orange SA 967,573 Hannover Rueck SE 1,043,677
Total System Services Inc 960,502 Fuji Heavy Industries Ltd 1,024,412
NN Group NV 919,837 SunTrust Banks Inc 1,007,366
ConocoPhillips 901,917 General Dynamics Corp 993,845
Samsung Electronics Co Ltd 878,689 Exelon Corp 948,723
JPMorgan Chase & Co 873,021 Daimler AG 948,571
Extra Space Storage Inc 870,074 Wal-Mart Stores Inc 922,294
Suncor Energy Inc 817,368 JPMorgan Chase & Co 914,781
CVS Health Corp 817,106 Cardinal Health Inc 885,889
Veolia Environnement SA 807,636 Pfizer Inc 872,277
EOG Resources Inc 798,740 McKesson Corp 856,543
Direct Line Insurance Group Plc 851,251
The Material Portfolio Changes reflect the aggregate purchases of a security exceeding one per cent of the total value of purchases for the year and aggregate disposals greater than one per cent of the total value of the sales.
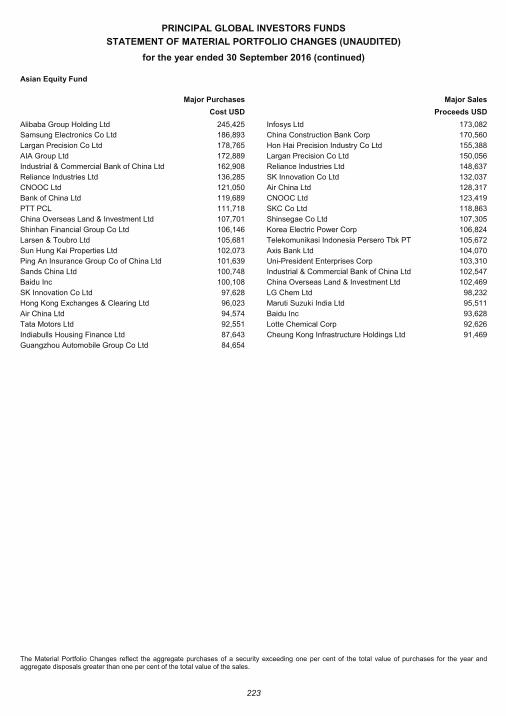
PRINCIPAL GLOBAL INVESTORS FUNDS
STATEMENT OF MATERIAL PORTFOLIO CHANGES (UNAUDITED)
for the year ended 30 September 2016 (continued)
223
Asian Equity Fund
Major Purchases Major Sales
Cost USD Proceeds USD
Alibaba Group Holding Ltd 245,425 Infosys Ltd 173,082
Samsung Electronics Co Ltd 186,893 China Construction Bank Corp 170,560
Largan Precision Co Ltd 178,765 Hon Hai Precision Industry Co Ltd 155,388
AIA Group Ltd 172,889 Largan Precision Co Ltd 150,056
Industrial & Commercial Bank of China Ltd 162,908 Reliance Industries Ltd 148,637
Reliance Industries Ltd 136,285 SK Innovation Co Ltd 132,037
CNOOC Ltd 121,050 Air China Ltd 128,317
Bank of China Ltd 119,689 CNOOC Ltd 123,419
PTT PCL 111,718 SKC Co Ltd 118,863
China Overseas Land & Investment Ltd 107,701 Shinsegae Co Ltd 107,305
Shinhan Financial Group Co Ltd 106,146 Korea Electric Power Corp 106,824
Larsen & Toubro Ltd 105,681 Telekomunikasi Indonesia Persero Tbk PT 105,672
Sun Hung Kai Properties Ltd 102,073 Axis Bank Ltd 104,070
Ping An Insurance Group Co of China Ltd 101,639 Uni-President Enterprises Corp 103,310
Sands China Ltd 100,748 Industrial & Commercial Bank of China Ltd 102,547
Baidu Inc 100,108 China Overseas Land & Investment Ltd 102,469
SK Innovation Co Ltd 97,628 LG Chem Ltd 98,232
Hong Kong Exchanges & Clearing Ltd 96,023 Maruti Suzuki India Ltd 95,511
Air China Ltd 94,574 Baidu Inc 93,628
Tata Motors Ltd 92,551 Lotte Chemical Corp 92,626
Indiabulls Housing Finance Ltd 87,643 Cheung Kong Infrastructure Holdings Ltd 91,469
Guangzhou Automobile Group Co Ltd 84,654
The Material Portfolio Changes reflect the aggregate purchases of a security exceeding one per cent of the total value of purchases for the year and aggregate disposals greater than one per cent of the total value of the sales.
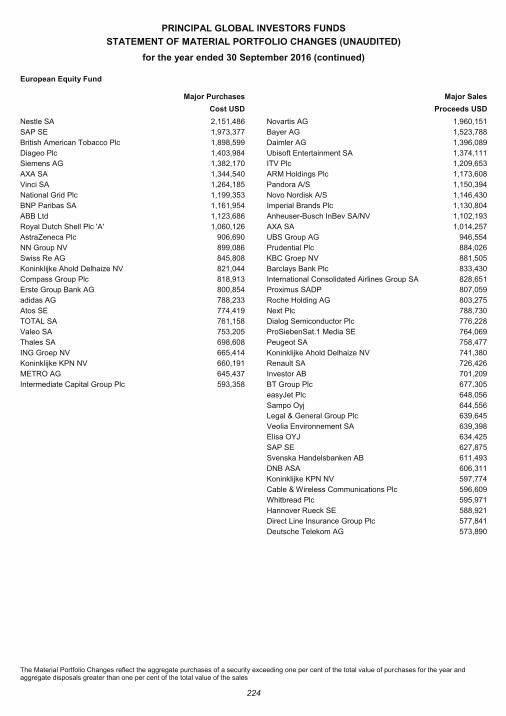
PRINCIPAL GLOBAL INVESTORS FUNDS
STATEMENT OF MATERIAL PORTFOLIO CHANGES (UNAUDITED)
for the year ended 30 September 2016 (continued)
224
European Equity Fund
Major Purchases Major Sales
Cost USD Proceeds USD
Nestle SA 2,151,486 Novartis AG 1,960,151
SAP SE 1,973,377 Bayer AG 1,523,788
British American Tobacco Plc 1,898,599 Daimler AG 1,396,089
Diageo Plc 1,403,984 Ubisoft Entertainment SA 1,374,111
Siemens AG 1,382,170 ITV Plc 1,209,653
AXA SA 1,344,540 ARM Holdings Plc 1,173,608
Vinci SA 1,264,185 Pandora A/S 1,150,394
National Grid Plc 1,199,353 Novo Nordisk A/S 1,146,430
BNP Paribas SA 1,161,954 Imperial Brands Plc 1,130,804
ABB Ltd 1,123,686 Anheuser-Busch InBev SA/NV 1,102,193
Royal Dutch Shell Plc 'A' 1,060,126 AXA SA 1,014,257
AstraZeneca Plc 906,690 UBS Group AG 946,554
NN Group NV 899,086 Prudential Plc 884,026
Swiss Re AG 845,808 KBC Groep NV 881,505
Koninklijke Ahold Delhaize NV 821,044 Barclays Bank Plc 833,430
Compass Group Plc 818,913 International Consolidated Airlines Group SA 828,651
Erste Group Bank AG 800,854 Proximus SADP 807,059
adidas AG 788,233 Roche Holding AG 803,275
Atos SE 774,419 Next Plc 788,730
TOTAL SA 761,158 Dialog Semiconductor Plc 776,228
Valeo SA 753,205 ProSiebenSat.1 Media SE 764,069
Thales SA 698,608 Peugeot SA 758,477
ING Groep NV 665,414 Koninklijke Ahold Delhaize NV 741,380
Koninklijke KPN NV 660,191 Renault SA 726,426
METRO AG 645,437 Investor AB 701,209
Intermediate Capital Group Plc 593,358 BT Group Plc 677,305
easyJet Plc 648,056
Sampo Oyj 644,556
Legal & General Group Plc 639,645
Veolia Environnement SA 639,398
Elisa OYJ 634,425
SAP SE 627,875
Svenska Handelsbanken AB 611,493
DNB ASA 606,311
Koninklijke KPN NV 597,774
Cable & Wireless Communications Plc 596,609
Whitbread Plc 595,971
Hannover Rueck SE 588,921
Direct Line Insurance Group Plc 577,841
Deutsche Telekom AG 573,890
The Material Portfolio Changes reflect the aggregate purchases of a security exceeding one per cent of the total value of purchases for the year and aggregate disposals greater than one per cent of the total value of the sales
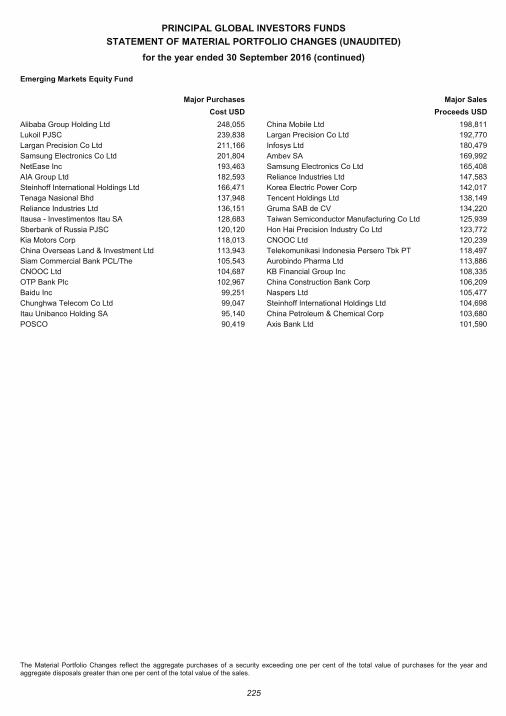
PRINCIPAL GLOBAL INVESTORS FUNDS
STATEMENT OF MATERIAL PORTFOLIO CHANGES (UNAUDITED)
for the year ended 30 September 2016 (continued)
225
Emerging Markets Equity Fund
Major Purchases Major Sales
Cost USD Proceeds USD
Alibaba Group Holding Ltd 248,055 China Mobile Ltd 198,811
Lukoil PJSC 239,838 Largan Precision Co Ltd 192,770
Largan Precision Co Ltd 211,166 Infosys Ltd 180,479
Samsung Electronics Co Ltd 201,804 Ambev SA 169,992
NetEase Inc 193,463 Samsung Electronics Co Ltd 165,408
AIA Group Ltd 182,593 Reliance Industries Ltd 147,583
Steinhoff International Holdings Ltd 166,471 Korea Electric Power Corp 142,017
Tenaga Nasional Bhd 137,948 Tencent Holdings Ltd 138,149
Reliance Industries Ltd 136,151 Gruma SAB de CV 134,220
Itausa - Investimentos Itau SA 128,683 Taiwan Semiconductor Manufacturing Co Ltd 125,939
Sberbank of Russia PJSC 120,120 Hon Hai Precision Industry Co Ltd 123,772
Kia Motors Corp 118,013 CNOOC Ltd 120,239
China Overseas Land & Investment Ltd 113,943 Telekomunikasi Indonesia Persero Tbk PT 118,497
Siam Commercial Bank PCL/The 105,543 Aurobindo Pharma Ltd 113,886
CNOOC Ltd 104,687 KB Financial Group Inc 108,335
OTP Bank Plc 102,967 China Construction Bank Corp 106,209
Baidu Inc 99,251 Naspers Ltd 105,477
Chunghwa Telecom Co Ltd 99,047 Steinhoff International Holdings Ltd 104,698
Itau Unibanco Holding SA 95,140 China Petroleum & Chemical Corp 103,680
POSCO 90,419 Axis Bank Ltd 101,590
The Material Portfolio Changes reflect the aggregate purchases of a security exceeding one per cent of the total value of purchases for the year and aggregate disposals greater than one per cent of the total value of the sales.
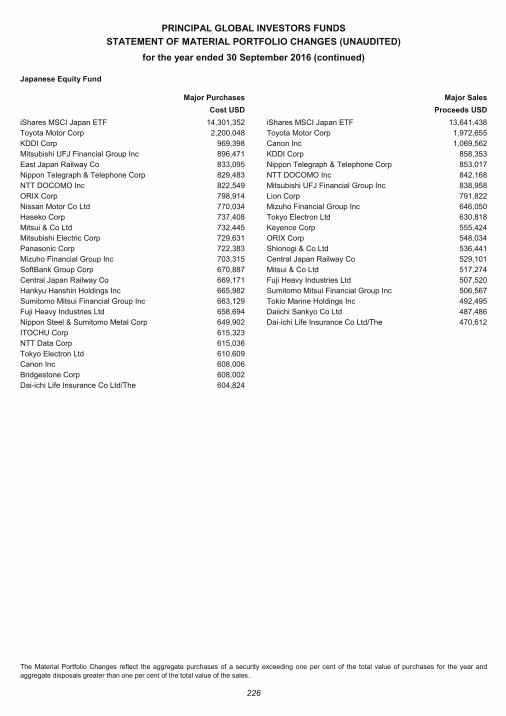
PRINCIPAL GLOBAL INVESTORS FUNDS
STATEMENT OF MATERIAL PORTFOLIO CHANGES (UNAUDITED)
for the year ended 30 September 2016 (continued)
226
Japanese Equity Fund
Major Purchases Major Sales
Cost USD Proceeds USD
iShares MSCI Japan ETF 14,301,352 iShares MSCI Japan ETF 13,641,438
Toyota Motor Corp 2,200,048 Toyota Motor Corp 1,972,655
KDDI Corp 969,398 Canon Inc 1,069,562
Mitsubishi UFJ Financial Group Inc 896,471 KDDI Corp 858,353
East Japan Railway Co 833,095 Nippon Telegraph & Telephone Corp 853,017
Nippon Telegraph & Telephone Corp 829,483 NTT DOCOMO Inc 842,168
NTT DOCOMO Inc 822,549 Mitsubishi UFJ Financial Group Inc 838,958
ORIX Corp 798,914 Lion Corp 791,822
Nissan Motor Co Ltd 770,034 Mizuho Financial Group Inc 646,050
Haseko Corp 737,408 Tokyo Electron Ltd 630,818
Mitsui & Co Ltd 732,445 Keyence Corp 555,424
Mitsubishi Electric Corp 729,631 ORIX Corp 548,034
Panasonic Corp 722,383 Shionogi & Co Ltd 536,441
Mizuho Financial Group Inc 703,315 Central Japan Railway Co 529,101
SoftBank Group Corp 670,887 Mitsui & Co Ltd 517,274
Central Japan Railway Co 669,171 Fuji Heavy Industries Ltd 507,520
Hankyu Hanshin Holdings Inc 665,982 Sumitomo Mitsui Financial Group Inc 506,567
Sumitomo Mitsui Financial Group Inc 663,129 Tokio Marine Holdings Inc 492,495
Fuji Heavy Industries Ltd 658,694 Daiichi Sankyo Co Ltd 487,486
Nippon Steel & Sumitomo Metal Corp 649,902 Dai-ichi Life Insurance Co Ltd/The 470,612
ITOCHU Corp 615,323
NTT Data Corp 615,036
Tokyo Electron Ltd 610,609
Canon Inc 608,006
Bridgestone Corp 608,002
Dai-ichi Life Insurance Co Ltd/The 604,824
The Material Portfolio Changes reflect the aggregate purchases of a security exceeding one per cent of the total value of purchases for the year and
aggregate disposals greater than one per cent of the total value of the sales.

PRINCIPAL GLOBAL INVESTORS FUNDS
STATEMENT OF MATERIAL PORTFOLIO CHANGES (UNAUDITED)
for the year ended 30 September 2016 (continued)
227
Preferred Securities Fund
Major Purchases Major Sales
Cost USD Proceeds USD
HSBC Capital Funding Dollar1 LP 45,157,638 Electricite de France SA 37,321,875
Nordea Bank AB 34,425,917 RWE AG 27,934,875
Enterprise Products Operating LLC 33,691,844 General Electric Capital Corp 26,776,733
BNP Paribas* 33,032,250 Credit Suisse AG 26,435,000
Svenska Handelsbanken AB 27,636,965 UBS AG/Jersey 26,312,500
Credit Agricole SA 25,000,000 QBE Capital Funding III Ltd 18,377,120
Transcanada Trust 22,000,000 Bellsouth Capital Funding Corp 13,625,000
Friends Life Holdings Plc 21,925,000 Hongkong & Shanghai Banking Corp Ltd/The 12,821,625
Voya Financial Inc 21,576,781 HSBC Holdings Plc 10,477,500
Credit Suisse Group AG 19,785,000 Royal Bank of Scotland Group Plc 10,211,250
Lloyds Banking Group Plc* 18,017,271 PartnerRe Ltd 9,428,427
Emera Inc 18,000,000 UBS AG/Stamford CT 8,835,000
UBS Group AG 17,947,480 Swiss Re Capital I LP 8,662,500
Royal Bank of Scotland Group Plc 17,450,250 PartnerRe Ltd 7,442,083
Reinsurance Group of America Inc 17,114,465 Qwest Corp 7,369,975
BNP Paribas* 16,970,080 BNP Paribas SA 6,777,500
Chubb Corp/The 15,618,350 Dominion Resources Inc/VA 6,399,000
Lloyds Banking Group Plc* 14,748,750 Sinochem Global Capital Co Ltd 6,195,000
Royal Bank of Scotland Group Plc 14,500,000 Credit Suisse Group Guernsey I Ltd 6,157,500
Banco Bilbao Vizcaya Argentaria SA* 14,171,000 Telephone & Data Systems Inc 5,597,324
Banco Bilbao Vizcaya Argentaria SA* 13,881,563 Morgan Stanley Capital Trust III 5,553,675
Credit Suisse AG 13,652,500 Barclays Bank Plc 5,341,483
QBE Insurance Group Ltd 13,500,000 GE Capital Trust I 4,899,683
Barclays Bank Plc 13,168,680 Credit Suisse Group AG 4,712,500
Australia & New Zealand Banking Group Ltd 12,993,760 Lloyds Bank Plc 4,550,000
MetLife Inc 12,790,800 Goldman Sachs Group Inc/The 4,456,425
HSBC Holdings Plc 12,738,750 State Street Capital Trust I 4,379,000
SunTrust Capital I 12,150,000 Integrys Holding Inc 4,225,000
Allstate Corp/The 11,634,250 Credit Suisse Group AG 4,163,250
Demeter Investments BV for Swiss Re Ltd 11,500,000 Societe Generale SA 4,080,000
Royal Bank of Scotland Group Plc 10,455,000
Bellsouth Capital Funding Corp 10,423,800
Meiji Yasuda Life Insurance Co 10,000,000
Royal Bank of Scotland Group Plc* 9,924,680
BNSF Funding Trust I 9,678,248
Hongkong & Shanghai Banking Corp Ltd/The 9,545,250
*Maturity date is different for these securities.
The Material Portfolio Changes reflect the aggregate purchases of a security exceeding one per cent of the total value of purchases for the year and
aggregate disposals greater than one per cent of the total value of the sales.
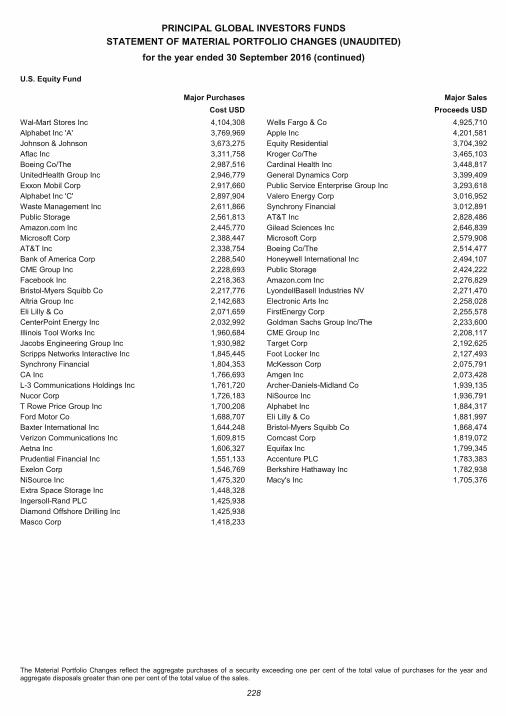
PRINCIPAL GLOBAL INVESTORS FUNDS
STATEMENT OF MATERIAL PORTFOLIO CHANGES (UNAUDITED)
for the year ended 30 September 2016 (continued)
228
U.S. Equity Fund
Major Purchases Major Sales
Cost USD Proceeds USD
Wal-Mart Stores Inc 4,104,308 Wells Fargo & Co 4,925,710
Alphabet Inc 'A' 3,769,969 Apple Inc 4,201,581
Johnson & Johnson 3,673,275 Equity Residential 3,704,392
Aflac Inc 3,311,758 Kroger Co/The 3,465,103
Boeing Co/The 2,987,516 Cardinal Health Inc 3,448,817
UnitedHealth Group Inc 2,946,779 General Dynamics Corp 3,399,409
Exxon Mobil Corp 2,917,660 Public Service Enterprise Group Inc 3,293,618
Alphabet Inc 'C' 2,897,904 Valero Energy Corp 3,016,952
Waste Management Inc 2,611,866 Synchrony Financial 3,012,891
Public Storage 2,561,813 AT&T Inc 2,828,486
Amazon.com Inc 2,445,770 Gilead Sciences Inc 2,646,839
Microsoft Corp 2,388,447 Microsoft Corp 2,579,908
AT&T Inc 2,338,754 Boeing Co/The 2,514,477
Bank of America Corp 2,288,540 Honeywell International Inc 2,494,107
CME Group Inc 2,228,693 Public Storage 2,424,222
Facebook Inc 2,218,363 Amazon.com Inc 2,276,829
Bristol-Myers Squibb Co 2,217,776 LyondellBasell Industries NV 2,271,470
Altria Group Inc 2,142,683 Electronic Arts Inc 2,258,028
Eli Lilly & Co 2,071,659 FirstEnergy Corp 2,255,578
CenterPoint Energy Inc 2,032,992 Goldman Sachs Group Inc/The 2,233,600
Illinois Tool Works Inc 1,960,684 CME Group Inc 2,208,117
Jacobs Engineering Group Inc 1,930,982 Target Corp 2,192,625
Scripps Networks Interactive Inc 1,845,445 Foot Locker Inc 2,127,493
Synchrony Financial 1,804,353 McKesson Corp 2,075,791
CA Inc 1,766,693 Amgen Inc 2,073,428
L-3 Communications Holdings Inc 1,761,720 Archer-Daniels-Midland Co 1,939,135
Nucor Corp 1,726,183 NiSource Inc 1,936,791
T Rowe Price Group Inc 1,700,208 Alphabet Inc 1,884,317
Ford Motor Co 1,688,707 Eli Lilly & Co 1,881,997
Baxter International Inc 1,644,248 Bristol-Myers Squibb Co 1,868,474
Verizon Communications Inc 1,609,815 Comcast Corp 1,819,072
Aetna Inc 1,606,327 Equifax Inc 1,799,345
Prudential Financial Inc 1,551,133 Accenture PLC 1,783,383
Exelon Corp 1,546,769 Berkshire Hathaway Inc 1,782,938
NiSource Inc 1,475,320 Macy's Inc 1,705,376
Extra Space Storage Inc 1,448,328
Ingersoll-Rand PLC 1,425,938
Diamond Offshore Drilling Inc 1,425,938
Masco Corp 1,418,233
The Material Portfolio Changes reflect the aggregate purchases of a security exceeding one per cent of the total value of purchases for the year and aggregate disposals greater than one per cent of the total value of the sales.
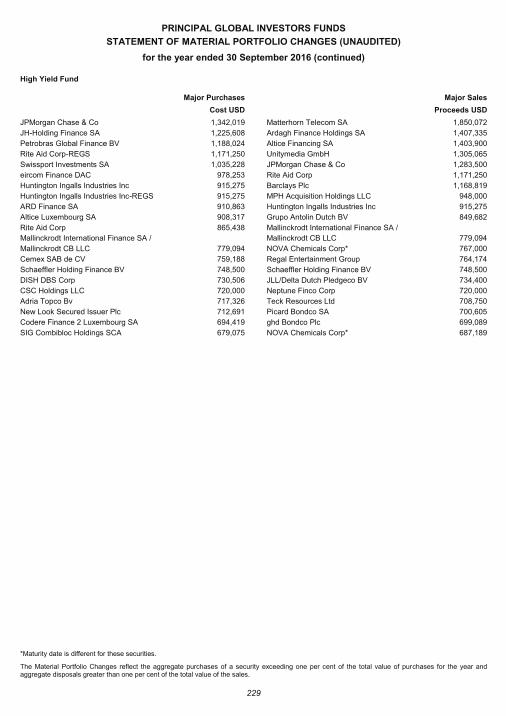
PRINCIPAL GLOBAL INVESTORS FUNDS
STATEMENT OF MATERIAL PORTFOLIO CHANGES (UNAUDITED)
for the year ended 30 September 2016 (continued)
229
High Yield Fund
Major Purchases Major Sales
Cost USD Proceeds USD
JPMorgan Chase & Co 1,342,019 Matterhorn Telecom SA 1,850,072
JH-Holding Finance SA 1,225,608 Ardagh Finance Holdings SA 1,407,335
Petrobras Global Finance BV 1,188,024 Altice Financing SA 1,403,900
Rite Aid Corp-REGS 1,171,250 Unitymedia GmbH 1,305,065
Swissport Investments SA 1,035,228 JPMorgan Chase & Co 1,283,500
eircom Finance DAC 978,253 Rite Aid Corp 1,171,250
Huntington Ingalls Industries Inc 915,275 Barclays Plc 1,168,819
Huntington Ingalls Industries Inc-REGS 915,275 MPH Acquisition Holdings LLC 948,000
ARD Finance SA 910,863 Huntington Ingalls Industries Inc 915,275
Altice Luxembourg SA 908,317 Grupo Antolin Dutch BV 849,682
Rite Aid Corp 865,438 Mallinckrodt International Finance SA /
Mallinckrodt International Finance SA / Mallinckrodt CB LLC 779,094
Mallinckrodt CB LLC 779,094 NOVA Chemicals Corp* 767,000
Cemex SAB de CV 759,188 Regal Entertainment Group 764,174
Schaeffler Holding Finance BV 748,500 Schaeffler Holding Finance BV 748,500
DISH DBS Corp 730,506 JLL/Delta Dutch Pledgeco BV 734,400
CSC Holdings LLC 720,000 Neptune Finco Corp 720,000
Adria Topco Bv 717,326 Teck Resources Ltd 708,750
New Look Secured Issuer Plc 712,691 Picard Bondco SA 700,605
Codere Finance 2 Luxembourg SA 694,419 ghd Bondco Plc 699,089
SIG Combibloc Holdings SCA 679,075 NOVA Chemicals Corp* 687,189
*Maturity date is different for these securities.
The Material Portfolio Changes reflect the aggregate purchases of a security exceeding one per cent of the total value of purchases for the year and aggregate disposals greater than one per cent of the total value of the sales.
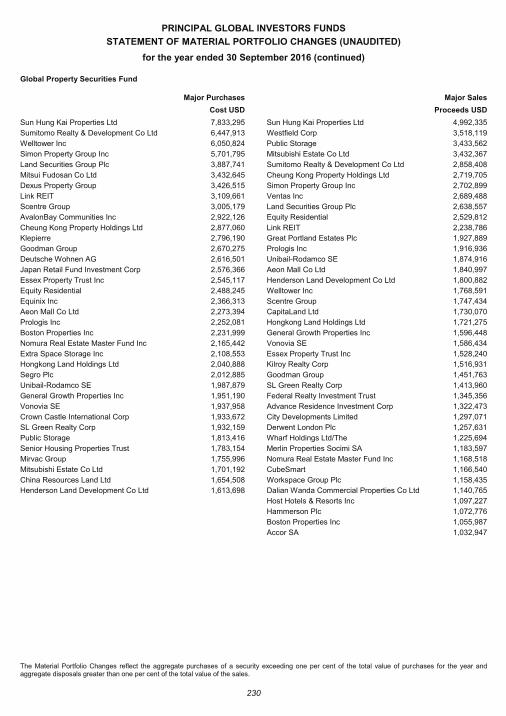
PRINCIPAL GLOBAL INVESTORS FUNDS
STATEMENT OF MATERIAL PORTFOLIO CHANGES (UNAUDITED)
for the year ended 30 September 2016 (continued)
230
Global Property Securities Fund
Major Purchases Major Sales
Cost USD Proceeds USD
Sun Hung Kai Properties Ltd 7,833,295 Sun Hung Kai Properties Ltd 4,992,335
Sumitomo Realty & Development Co Ltd 6,447,913 Westfield Corp 3,518,119
Welltower Inc 6,050,824 Public Storage 3,433,562
Simon Property Group Inc 5,701,795 Mitsubishi Estate Co Ltd 3,432,367
Land Securities Group Plc 3,887,741 Sumitomo Realty & Development Co Ltd 2,858,408
Mitsui Fudosan Co Ltd 3,432,645 Cheung Kong Property Holdings Ltd 2,719,705
Dexus Property Group 3,426,515 Simon Property Group Inc 2,702,899
Link REIT 3,109,661 Ventas Inc 2,689,488
Scentre Group 3,005,179 Land Securities Group Plc 2,638,557
AvalonBay Communities Inc 2,922,126 Equity Residential 2,529,812
Cheung Kong Property Holdings Ltd 2,877,060 Link REIT 2,238,786
Klepierre 2,796,190 Great Portland Estates Plc 1,927,889
Goodman Group 2,670,275 Prologis Inc 1,916,936
Deutsche Wohnen AG 2,616,501 Unibail-Rodamco SE 1,874,916
Japan Retail Fund Investment Corp 2,576,366 Aeon Mall Co Ltd 1,840,997
Essex Property Trust Inc 2,545,117 Henderson Land Development Co Ltd 1,800,882
Equity Residential 2,488,245 Welltower Inc 1,768,591
Equinix Inc 2,366,313 Scentre Group 1,747,434
Aeon Mall Co Ltd 2,273,394 CapitaLand Ltd 1,730,070
Prologis Inc 2,252,081 Hongkong Land Holdings Ltd 1,721,275
Boston Properties Inc 2,231,999 General Growth Properties Inc 1,596,448
Nomura Real Estate Master Fund Inc 2,165,442 Vonovia SE 1,586,434
Extra Space Storage Inc 2,108,553 Essex Property Trust Inc 1,528,240
Hongkong Land Holdings Ltd 2,040,888 Kilroy Realty Corp 1,516,931
Segro Plc 2,012,885 Goodman Group 1,451,763
Unibail-Rodamco SE 1,987,879 SL Green Realty Corp 1,413,960
General Growth Properties Inc 1,951,190 Federal Realty Investment Trust 1,345,356
Vonovia SE 1,937,958 Advance Residence Investment Corp 1,322,473
Crown Castle International Corp 1,933,672 City Developments Limited 1,297,071
SL Green Realty Corp 1,932,159 Derwent London Plc 1,257,631
Public Storage 1,813,416 Wharf Holdings Ltd/The 1,225,694
Senior Housing Properties Trust 1,783,154 Merlin Properties Socimi SA 1,183,597
Mirvac Group 1,755,996 Nomura Real Estate Master Fund Inc 1,168,518
Mitsubishi Estate Co Ltd 1,701,192 CubeSmart 1,166,540
China Resources Land Ltd 1,654,508 Workspace Group Plc 1,158,435
Henderson Land Development Co Ltd 1,613,698 Dalian Wanda Commercial Properties Co Ltd 1,140,765
Host Hotels & Resorts Inc 1,097,227
Hammerson Plc 1,072,776
Boston Properties Inc 1,055,987
Accor SA 1,032,947
The Material Portfolio Changes reflect the aggregate purchases of a security exceeding one per cent of the total value of purchases for the year and aggregate disposals greater than one per cent of the total value of the sales.
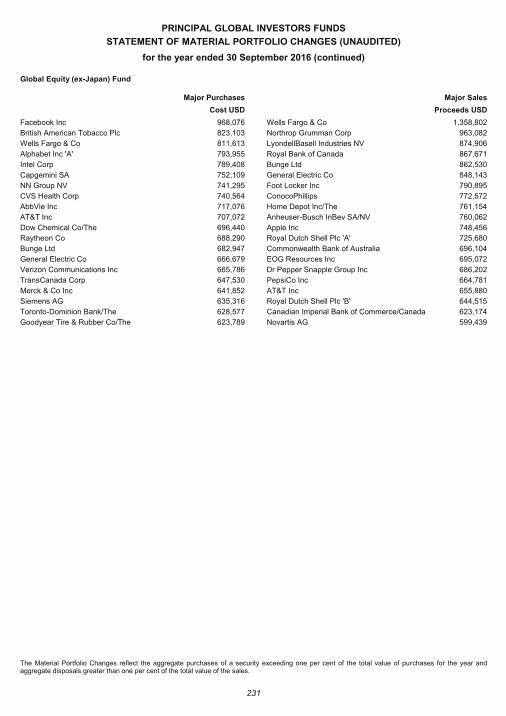
PRINCIPAL GLOBAL INVESTORS FUNDS
STATEMENT OF MATERIAL PORTFOLIO CHANGES (UNAUDITED)
for the year ended 30 September 2016 (continued)
231
Global Equity (ex-Japan) Fund
Major Purchases Major Sales
Cost USD Proceeds USD
Facebook Inc 968,076 Wells Fargo & Co 1,358,802
British American Tobacco Plc 823,103 Northrop Grumman Corp 963,082
Wells Fargo & Co 811,613 LyondellBasell Industries NV 874,906
Alphabet Inc 'A' 793,955 Royal Bank of Canada 867,671
Intel Corp 789,408 Bunge Ltd 862,530
Capgemini SA 752,109 General Electric Co 848,143
NN Group NV 741,295 Foot Locker Inc 790,895
CVS Health Corp 740,564 ConocoPhillips 772,572
AbbVie Inc 717,076 Home Depot Inc/The 761,154
AT&T Inc 707,072 Anheuser-Busch InBev SA/NV 760,062
Dow Chemical Co/The 696,440 Apple Inc 748,456
Raytheon Co 688,290 Royal Dutch Shell Plc 'A' 725,680
Bunge Ltd 682,947 Commonwealth Bank of Australia 696,104
General Electric Co 666,679 EOG Resources Inc 695,072
Verizon Communications Inc 665,786 Dr Pepper Snapple Group Inc 686,202
TransCanada Corp 647,530 PepsiCo Inc 664,781
Merck & Co Inc 641,852 AT&T Inc 655,880
Siemens AG 635,316 Royal Dutch Shell Plc 'B' 644,515
Toronto-Dominion Bank/The 628,577 Canadian Imperial Bank of Commerce/Canada 623,174
Goodyear Tire & Rubber Co/The 623,789 Novartis AG 599,439
The Material Portfolio Changes reflect the aggregate purchases of a security exceeding one per cent of the total value of purchases for the year and aggregate disposals greater than one per cent of the total value of the sales.
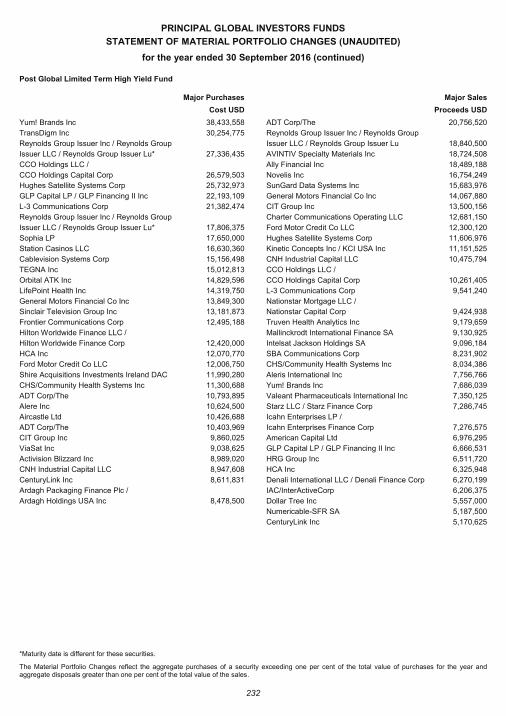
PRINCIPAL GLOBAL INVESTORS FUNDS
STATEMENT OF MATERIAL PORTFOLIO CHANGES (UNAUDITED)
for the year ended 30 September 2016 (continued)
232
Post Global Limited Term High Yield Fund
Major Purchases Major Sales
Cost USD Proceeds USD
Yum! Brands Inc 38,433,558 ADT Corp/The 20,756,520
TransDigm Inc 30,254,775 Reynolds Group Issuer Inc / Reynolds Group
Reynolds Group Issuer Inc / Reynolds Group Issuer LLC / Reynolds Group Issuer Lu 18,840,500
Issuer LLC / Reynolds Group Issuer Lu* 27,336,435 AVINTIV Specialty Materials Inc 18,724,508
CCO Holdings LLC / Ally Financial Inc 18,489,188
CCO Holdings Capital Corp 26,579,503 Novelis Inc 16,754,249
Hughes Satellite Systems Corp 25,732,973 SunGard Data Systems Inc 15,683,976
GLP Capital LP / GLP Financing II Inc 22,193,109 General Motors Financial Co Inc 14,067,880
L-3 Communications Corp 21,382,474 CIT Group Inc 13,500,156
Reynolds Group Issuer Inc / Reynolds Group Charter Communications Operating LLC 12,681,150
Issuer LLC / Reynolds Group Issuer Lu* 17,806,375 Ford Motor Credit Co LLC 12,300,120
Sophia LP 17,650,000 Hughes Satellite Systems Corp 11,606,976
Station Casinos LLC 16,630,360 Kinetic Concepts Inc / KCI USA Inc 11,151,525
Cablevision Systems Corp 15,156,498 CNH Industrial Capital LLC 10,475,794
TEGNA Inc 15,012,813 CCO Holdings LLC /
Orbital ATK Inc 14,829,596 CCO Holdings Capital Corp 10,261,405
LifePoint Health Inc 14,319,750 L-3 Communications Corp 9,541,240
General Motors Financial Co Inc 13,849,300 Nationstar Mortgage LLC /
Sinclair Television Group Inc 13,181,873 Nationstar Capital Corp 9,424,938
Frontier Communications Corp 12,495,188 Truven Health Analytics Inc 9,179,659
Hilton Worldwide Finance LLC / Mallinckrodt International Finance SA 9,130,925
Hilton Worldwide Finance Corp 12,420,000 Intelsat Jackson Holdings SA 9,096,184
HCA Inc 12,070,770 SBA Communications Corp 8,231,902
Ford Motor Credit Co LLC 12,006,750 CHS/Community Health Systems Inc 8,034,386
Shire Acquisitions Investments Ireland DAC 11,990,280 Aleris International Inc 7,756,766
CHS/Community Health Systems Inc 11,300,688 Yum! Brands Inc 7,686,039
ADT Corp/The 10,793,895 Valeant Pharmaceuticals International Inc 7,350,125
Alere Inc 10,624,500 Starz LLC / Starz Finance Corp 7,286,745
Aircastle Ltd 10,426,688 Icahn Enterprises LP /
ADT Corp/The 10,403,969 Icahn Enterprises Finance Corp 7,276,575
CIT Group Inc 9,860,025 American Capital Ltd 6,976,295
ViaSat Inc 9,038,625 GLP Capital LP / GLP Financing II Inc 6,666,531
Activision Blizzard Inc 8,989,020 HRG Group Inc 6,511,720
CNH Industrial Capital LLC 8,947,608 HCA Inc 6,325,948
CenturyLink Inc 8,611,831 Denali International LLC / Denali Finance Corp 6,270,199
Ardagh Packaging Finance Plc / IAC/InterActiveCorp 6,206,375
Ardagh Holdings USA Inc 8,478,500 Dollar Tree Inc 5,557,000
Numericable-SFR SA 5,187,500
CenturyLink Inc 5,170,625
*Maturity date is different for these securities.
The Material Portfolio Changes reflect the aggregate purchases of a security exceeding one per cent of the total value of purchases for the year and aggregate disposals greater than one per cent of the total value of the sales.
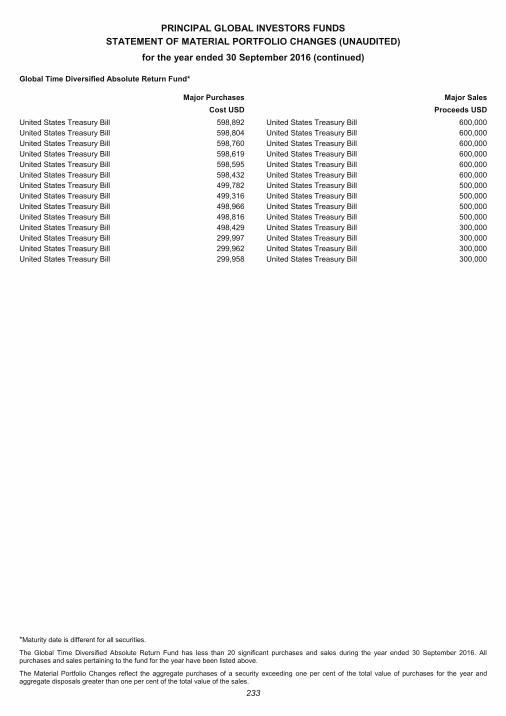
PRINCIPAL GLOBAL INVESTORS FUNDS
STATEMENT OF MATERIAL PORTFOLIO CHANGES (UNAUDITED)
for the year ended 30 September 2016 (continued)
233
Global Time Diversified Absolute Return Fund*
Major Purchases Major Sales
Cost USD Proceeds USD
United States Treasury Bill 598,892 United States Treasury Bill 600,000
United States Treasury Bill 598,804 United States Treasury Bill 600,000
United States Treasury Bill 598,760 United States Treasury Bill 600,000
United States Treasury Bill 598,619 United States Treasury Bill 600,000
United States Treasury Bill 598,595 United States Treasury Bill 600,000
United States Treasury Bill 598,432 United States Treasury Bill 600,000
United States Treasury Bill 499,782 United States Treasury Bill 500,000
United States Treasury Bill 499,316 United States Treasury Bill 500,000
United States Treasury Bill 498,966 United States Treasury Bill 500,000
United States Treasury Bill 498,816 United States Treasury Bill 500,000
United States Treasury Bill 498,429 United States Treasury Bill 300,000
United States Treasury Bill 299,997 United States Treasury Bill 300,000
United States Treasury Bill 299,962 United States Treasury Bill 300,000
United States Treasury Bill 299,958 United States Treasury Bill 300,000
*Maturity date is different for all securities.
The Global Time Diversified Absolute Return Fund has less than 20 significant purchases and sales during the year ended 30 September 2016. All purchases and sales pertaining to the fund for the year have been listed above.
The Material Portfolio Changes reflect the aggregate purchases of a security exceeding one per cent of the total value of purchases for the year and aggregate disposals greater than one per cent of the total value of the sales.
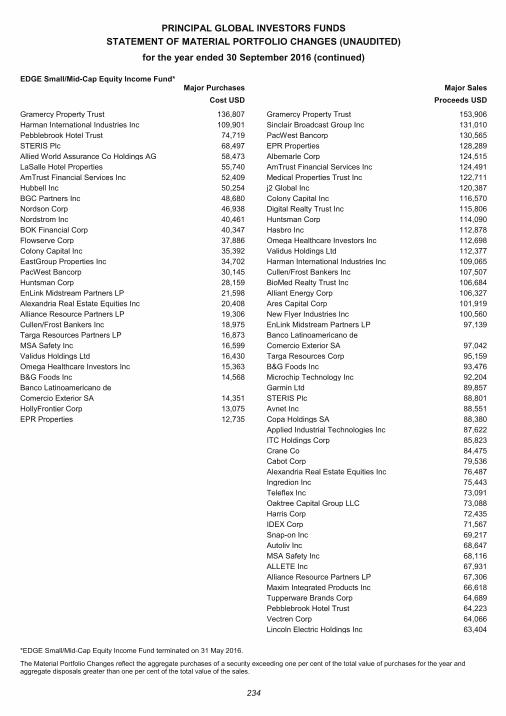
PRINCIPAL GLOBAL INVESTORS FUNDS
STATEMENT OF MATERIAL PORTFOLIO CHANGES (UNAUDITED)
for the year ended 30 September 2016 (continued)
234
EDGE Small/Mid-Cap Equity Income Fund* Major Purchases Major Sales
Cost USD Proceeds USD
Gramercy Property Trust 136,807 Gramercy Property Trust 153,906
Harman International Industries Inc 109,901 Sinclair Broadcast Group Inc 131,010
Pebblebrook Hotel Trust 74,719 PacWest Bancorp 130,565
STERIS Plc 68,497 EPR Properties 128,289
Allied World Assurance Co Holdings AG 58,473 Albemarle Corp 124,515
LaSalle Hotel Properties 55,740 AmTrust Financial Services Inc 124,491
AmTrust Financial Services Inc 52,409 Medical Properties Trust Inc 122,711
Hubbell Inc 50,254 j2 Global Inc 120,387
BGC Partners Inc 48,680 Colony Capital Inc 116,570
Nordson Corp 46,938 Digital Realty Trust Inc 115,806
Nordstrom Inc 40,461 Huntsman Corp 114,090
BOK Financial Corp 40,347 Hasbro Inc 112,878
Flowserve Corp 37,886 Omega Healthcare Investors Inc 112,698
Colony Capital Inc 35,392 Validus Holdings Ltd 112,377
EastGroup Properties Inc 34,702 Harman International Industries Inc 109,065
PacWest Bancorp 30,145 Cullen/Frost Bankers Inc 107,507
Huntsman Corp 28,159 BioMed Realty Trust Inc 106,684
EnLink Midstream Partners LP 21,598 Alliant Energy Corp 106,327
Alexandria Real Estate Equities Inc 20,408 Ares Capital Corp 101,919
Alliance Resource Partners LP 19,306 New Flyer Industries Inc 100,560
Cullen/Frost Bankers Inc 18,975 EnLink Midstream Partners LP 97,139
Targa Resources Partners LP 16,873 Banco Latinoamericano de
MSA Safety Inc 16,599 Comercio Exterior SA 97,042
Validus Holdings Ltd 16,430 Targa Resources Corp 95,159
Omega Healthcare Investors Inc 15,363 B&G Foods Inc 93,476
B&G Foods Inc 14,568 Microchip Technology Inc 92,204
Banco Latinoamericano de Garmin Ltd 89,857
Comercio Exterior SA 14,351 STERIS Plc 88,801
HollyFrontier Corp 13,075 Avnet Inc 88,551
EPR Properties 12,735 Copa Holdings SA 88,380 Applied Industrial Technologies Inc 87,622 ITC Holdings Corp 85,823 Crane Co 84,475 Cabot Corp 79,536 Alexandria Real Estate Equities Inc 76,487 Ingredion Inc 75,443 Teleflex Inc 73,091 Oaktree Capital Group LLC 73,088 Harris Corp 72,435 IDEX Corp 71,567 Snap-on Inc 69,217 Autoliv Inc 68,647 MSA Safety Inc 68,116 ALLETE Inc 67,931 Alliance Resource Partners LP 67,306 Maxim Integrated Products Inc 66,618 Tupperware Brands Corp 64,689 Pebblebrook Hotel Trust 64,223 Vectren Corp 64,066 Lincoln Electric Holdings Inc 63,404
*EDGE Small/Mid-Cap Equity Income Fund terminated on 31 May 2016.
The Material Portfolio Changes reflect the aggregate purchases of a security exceeding one per cent of the total value of purchases for the year and aggregate disposals greater than one per cent of the total value of the sales.
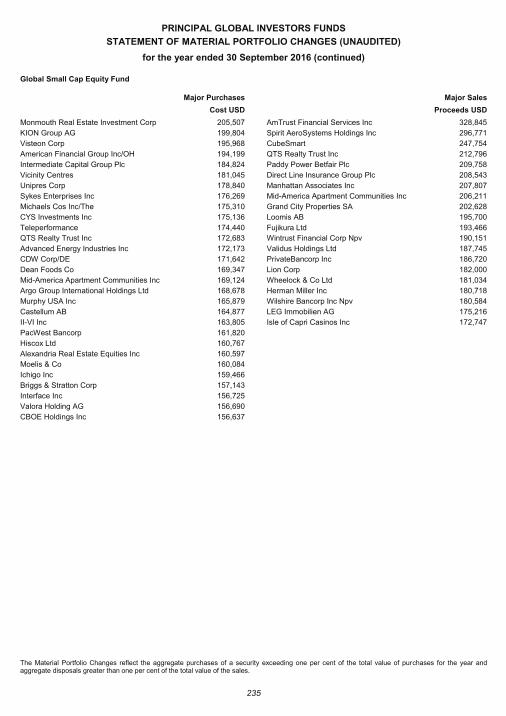
PRINCIPAL GLOBAL INVESTORS FUNDS
STATEMENT OF MATERIAL PORTFOLIO CHANGES (UNAUDITED)
for the year ended 30 September 2016 (continued)
235
Global Small Cap Equity Fund
Major Purchases Major Sales
Cost USD Proceeds USD
Monmouth Real Estate Investment Corp 205,507 AmTrust Financial Services Inc 328,845
KION Group AG 199,804 Spirit AeroSystems Holdings Inc 296,771
Visteon Corp 195,968 CubeSmart 247,754
American Financial Group Inc/OH 194,199 QTS Realty Trust Inc 212,796
Intermediate Capital Group Plc 184,824 Paddy Power Betfair Plc 209,758
Vicinity Centres 181,045 Direct Line Insurance Group Plc 208,543
Unipres Corp 178,840 Manhattan Associates Inc 207,807
Sykes Enterprises Inc 176,269 Mid-America Apartment Communities Inc 206,211
Michaels Cos Inc/The 175,310 Grand City Properties SA 202,628
CYS Investments Inc 175,136 Loomis AB 195,700
Teleperformance 174,440 Fujikura Ltd 193,466
QTS Realty Trust Inc 172,683 Wintrust Financial Corp Npv 190,151
Advanced Energy Industries Inc 172,173 Validus Holdings Ltd 187,745
CDW Corp/DE 171,642 PrivateBancorp Inc 186,720
Dean Foods Co 169,347 Lion Corp 182,000
Mid-America Apartment Communities Inc 169,124 Wheelock & Co Ltd 181,034
Argo Group International Holdings Ltd 168,678 Herman Miller Inc 180,718
Murphy USA Inc 165,879 Wilshire Bancorp Inc Npv 180,584
Castellum AB 164,877 LEG Immobilien AG 175,216
II-VI Inc 163,805 Isle of Capri Casinos Inc 172,747
PacWest Bancorp 161,820
Hiscox Ltd 160,767
Alexandria Real Estate Equities Inc 160,597
Moelis & Co 160,084
Ichigo Inc 159,466
Briggs & Stratton Corp 157,143
Interface Inc 156,725
Valora Holding AG 156,690
CBOE Holdings Inc 156,637
The Material Portfolio Changes reflect the aggregate purchases of a security exceeding one per cent of the total value of purchases for the year and aggregate disposals greater than one per cent of the total value of the sales.
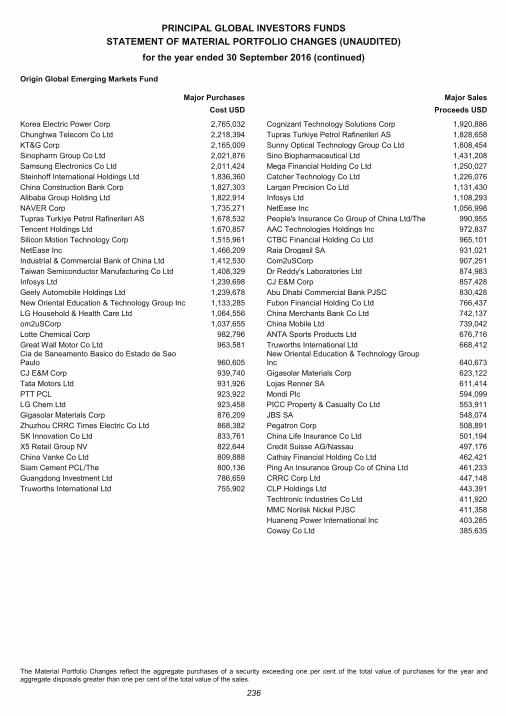
PRINCIPAL GLOBAL INVESTORS FUNDS
STATEMENT OF MATERIAL PORTFOLIO CHANGES (UNAUDITED)
for the year ended 30 September 2016 (continued)
236
Origin Global Emerging Markets Fund
Major Purchases Major Sales
Cost USD Proceeds USD
Korea Electric Power Corp 2,765,032 Cognizant Technology Solutions Corp 1,920,886
Chunghwa Telecom Co Ltd 2,218,394 Tupras Turkiye Petrol Rafinerileri AS 1,828,658
KT&G Corp 2,165,009 Sunny Optical Technology Group Co Ltd 1,608,454
Sinopharm Group Co Ltd 2,021,876 Sino Biopharmaceutical Ltd 1,431,208
Samsung Electronics Co Ltd 2,011,424 Mega Financial Holding Co Ltd 1,250,027
Steinhoff International Holdings Ltd 1,836,360 Catcher Technology Co Ltd 1,226,076
China Construction Bank Corp 1,827,303 Largan Precision Co Ltd 1,131,430
Alibaba Group Holding Ltd 1,822,914 Infosys Ltd 1,108,293
NAVER Corp 1,735,271 NetEase Inc 1,056,998
Tupras Turkiye Petrol Rafinerileri AS 1,678,532 People's Insurance Co Group of China Ltd/The 990,955
Tencent Holdings Ltd 1,670,857 AAC Technologies Holdings Inc 972,837
Silicon Motion Technology Corp 1,515,961 CTBC Financial Holding Co Ltd 965,101
NetEase Inc 1,466,209 Raia Drogasil SA 931,021
Industrial & Commercial Bank of China Ltd 1,412,530 Com2uSCorp 907,251
Taiwan Semiconductor Manufacturing Co Ltd 1,408,329 Dr Reddy's Laboratories Ltd 874,983
Infosys Ltd 1,239,698 CJ E&M Corp 857,428
Geely Automobile Holdings Ltd 1,239,678 Abu Dhabi Commercial Bank PJSC 830,428
New Oriental Education & Technology Group Inc 1,133,285 Fubon Financial Holding Co Ltd 766,437
LG Household & Health Care Ltd 1,064,556 China Merchants Bank Co Ltd 742,137
om2uSCorp 1,037,655 China Mobile Ltd 739,042
Lotte Chemical Corp 982,796 ANTA Sports Products Ltd 676,716
Great Wall Motor Co Ltd 963,581 Truworths International Ltd 668,412 Cia de Saneamento Basico do Estado de Sao Paulo 960,605
New Oriental Education & Technology Group Inc 640,673
CJ E&M Corp 939,740 Gigasolar Materials Corp 623,122
Tata Motors Ltd 931,926 Lojas Renner SA 611,414
PTT PCL 923,922 Mondi Plc 594,099
LG Chem Ltd 923,458 PICC Property & Casualty Co Ltd 553,911
Gigasolar Materials Corp 876,209 JBS SA 548,074
Zhuzhou CRRC Times Electric Co Ltd 868,382 Pegatron Corp 508,891
SK Innovation Co Ltd 833,761 China Life Insurance Co Ltd 501,194
X5 Retail Group NV 822,644 Credit Suisse AG/Nassau 497,176
China Vanke Co Ltd 809,888 Cathay Financial Holding Co Ltd 462,421
Siam Cement PCL/The 800,136 Ping An Insurance Group Co of China Ltd 461,233
Guangdong Investment Ltd 786,659 CRRC Corp Ltd 447,148
Truworths International Ltd 755,902 CLP Holdings Ltd 443,391 Techtronic Industries Co Ltd 411,920 MMC Norilsk Nickel PJSC 411,358 Huaneng Power International Inc 403,285 Coway Co Ltd 385,635
The Material Portfolio Changes reflect the aggregate purchases of a security exceeding one per cent of the total value of purchases for the year and aggregate disposals greater than one per cent of the total value of the sales.
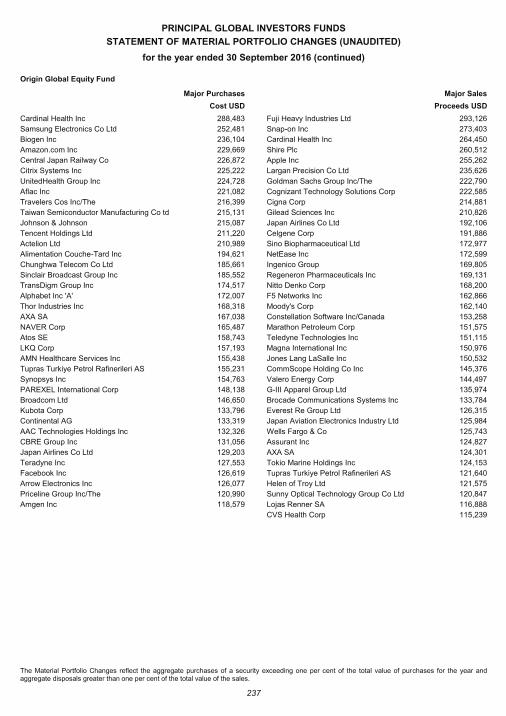
PRINCIPAL GLOBAL INVESTORS FUNDS
STATEMENT OF MATERIAL PORTFOLIO CHANGES (UNAUDITED)
for the year ended 30 September 2016 (continued)
237
Origin Global Equity Fund
Major Purchases Major Sales
Cost USD Proceeds USD
Cardinal Health Inc 288,483 Fuji Heavy Industries Ltd 293,126
Samsung Electronics Co Ltd 252,481 Snap-on Inc 273,403
Biogen Inc 236,104 Cardinal Health Inc 264,450
Amazon.com Inc 229,669 Shire Plc 260,512
Central Japan Railway Co 226,872 Apple Inc 255,262
Citrix Systems Inc 225,222 Largan Precision Co Ltd 235,626
UnitedHealth Group Inc 224,728 Goldman Sachs Group Inc/The 222,790
Aflac Inc 221,082 Cognizant Technology Solutions Corp 222,585
Travelers Cos Inc/The 216,399 Cigna Corp 214,881
Taiwan Semiconductor Manufacturing Co td 215,131 Gilead Sciences Inc 210,826
Johnson & Johnson 215,087 Japan Airlines Co Ltd 192,106
Tencent Holdings Ltd 211,220 Celgene Corp 191,886
Actelion Ltd 210,989 Sino Biopharmaceutical Ltd 172,977
Alimentation Couche-Tard Inc 194,621 NetEase Inc 172,599
Chunghwa Telecom Co Ltd 185,661 Ingenico Group 169,805
Sinclair Broadcast Group Inc 185,552 Regeneron Pharmaceuticals Inc 169,131
TransDigm Group Inc 174,517 Nitto Denko Corp 168,200
Alphabet Inc 'A' 172,007 F5 Networks Inc 162,866
Thor Industries Inc 168,318 Moody's Corp 162,140
AXA SA 167,038 Constellation Software Inc/Canada 153,258
NAVER Corp 165,487 Marathon Petroleum Corp 151,575
Atos SE 158,743 Teledyne Technologies Inc 151,115
LKQ Corp 157,193 Magna International Inc 150,976
AMN Healthcare Services Inc 155,438 Jones Lang LaSalle Inc 150,532
Tupras Turkiye Petrol Rafinerileri AS 155,231 CommScope Holding Co Inc 145,376
Synopsys Inc 154,763 Valero Energy Corp 144,497
PAREXEL International Corp 148,138 G-III Apparel Group Ltd 135,974
Broadcom Ltd 146,650 Brocade Communications Systems Inc 133,784
Kubota Corp 133,796 Everest Re Group Ltd 126,315
Continental AG 133,319 Japan Aviation Electronics Industry Ltd 125,984
AAC Technologies Holdings Inc 132,326 Wells Fargo & Co 125,743
CBRE Group Inc 131,056 Assurant Inc 124,827
Japan Airlines Co Ltd 129,203 AXA SA 124,301
Teradyne Inc 127,553 Tokio Marine Holdings Inc 124,153
Facebook Inc 126,619 Tupras Turkiye Petrol Rafinerileri AS 121,640
Arrow Electronics Inc 126,077 Helen of Troy Ltd 121,575
Priceline Group Inc/The 120,990 Sunny Optical Technology Group Co Ltd 120,847
Amgen Inc 118,579 Lojas Renner SA 116,888
CVS Health Corp 115,239
The Material Portfolio Changes reflect the aggregate purchases of a security exceeding one per cent of the total value of purchases for the year and aggregate disposals greater than one per cent of the total value of the sales.
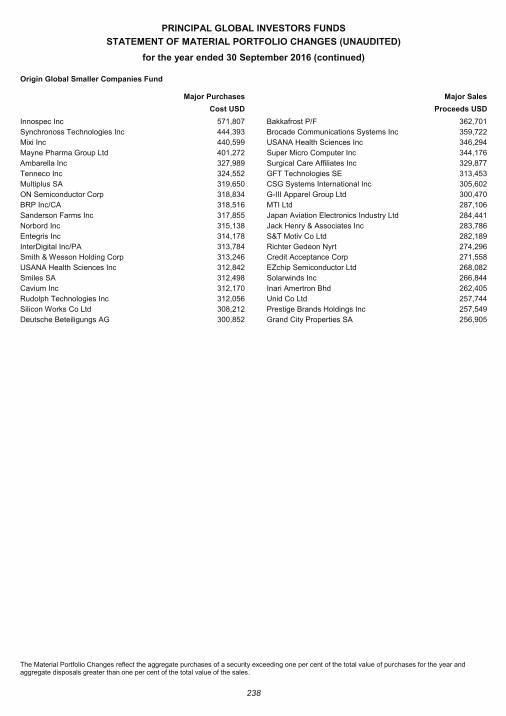
PRINCIPAL GLOBAL INVESTORS FUNDS
STATEMENT OF MATERIAL PORTFOLIO CHANGES (UNAUDITED)
for the year ended 30 September 2016 (continued)
238
Origin Global Smaller Companies Fund
Major Purchases Major Sales
Cost USD Proceeds USD
Innospec Inc 571,807 Bakkafrost P/F 362,701
Synchronoss Technologies Inc 444,393 Brocade Communications Systems Inc 359,722
Mixi Inc 440,599 USANA Health Sciences Inc 346,294
Mayne Pharma Group Ltd 401,272 Super Micro Computer Inc 344,176
Ambarella Inc 327,989 Surgical Care Affiliates Inc 329,877
Tenneco Inc 324,552 GFT Technologies SE 313,453
Multiplus SA 319,650 CSG Systems International Inc 305,602
ON Semiconductor Corp 318,834 G-III Apparel Group Ltd 300,470
BRP Inc/CA 318,516 MTI Ltd 287,106
Sanderson Farms Inc 317,855 Japan Aviation Electronics Industry Ltd 284,441
Norbord Inc 315,138 Jack Henry & Associates Inc 283,786
Entegris Inc 314,178 S&T Motiv Co Ltd 282,189
InterDigital Inc/PA 313,784 Richter Gedeon Nyrt 274,296
Smith & Wesson Holding Corp 313,246 Credit Acceptance Corp 271,558
USANA Health Sciences Inc 312,842 EZchip Semiconductor Ltd 268,082
Smiles SA 312,498 Solarwinds Inc 266,844
Cavium Inc 312,170 Inari Amertron Bhd 262,405
Rudolph Technologies Inc 312,056 Unid Co Ltd 257,744
Silicon Works Co Ltd 308,212 Prestige Brands Holdings Inc 257,549
Deutsche Beteiligungs AG 300,852 Grand City Properties SA 256,905
The Material Portfolio Changes reflect the aggregate purchases of a security exceeding one per cent of the total value of purchases for the year and aggregate disposals greater than one per cent of the total value of the sales.
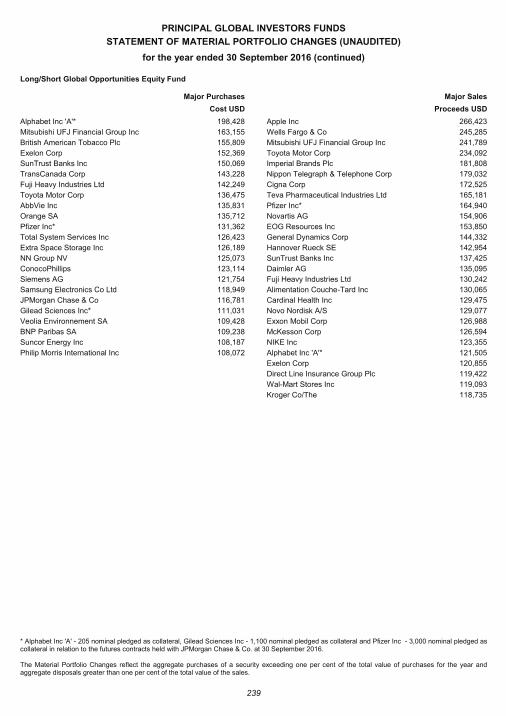
PRINCIPAL GLOBAL INVESTORS FUNDS
STATEMENT OF MATERIAL PORTFOLIO CHANGES (UNAUDITED)
for the year ended 30 September 2016 (continued)
239
Long/Short Global Opportunities Equity Fund
Major Purchases Major Sales
Cost USD Proceeds USD
Alphabet Inc 'A'* 198,428 Apple Inc 266,423
Mitsubishi UFJ Financial Group Inc 163,155 Wells Fargo & Co 245,285
British American Tobacco Plc 155,809 Mitsubishi UFJ Financial Group Inc 241,789
Exelon Corp 152,369 Toyota Motor Corp 234,092
SunTrust Banks Inc 150,069 Imperial Brands Plc 181,808
TransCanada Corp 143,228 Nippon Telegraph & Telephone Corp 179,032
Fuji Heavy Industries Ltd 142,249 Cigna Corp 172,525
Toyota Motor Corp 136,475 Teva Pharmaceutical Industries Ltd 165,181
AbbVie Inc 135,831 Pfizer Inc* 164,940
Orange SA 135,712 Novartis AG 154,906
Pfizer Inc* 131,362 EOG Resources Inc 153,850
Total System Services Inc 126,423 General Dynamics Corp 144,332
Extra Space Storage Inc 126,189 Hannover Rueck SE 142,954
NN Group NV 125,073 SunTrust Banks Inc 137,425
ConocoPhillips 123,114 Daimler AG 135,095
Siemens AG 121,754 Fuji Heavy Industries Ltd 130,242
Samsung Electronics Co Ltd 118,949 Alimentation Couche-Tard Inc 130,065
JPMorgan Chase & Co 116,781 Cardinal Health Inc 129,475
Gilead Sciences Inc* 111,031 Novo Nordisk A/S 129,077
Veolia Environnement SA 109,428 Exxon Mobil Corp 126,988
BNP Paribas SA 109,238 McKesson Corp 126,594
Suncor Energy Inc 108,187 NIKE Inc 123,355
Philip Morris International Inc 108,072 Alphabet Inc 'A'* 121,505
Exelon Corp 120,855
Direct Line Insurance Group Plc 119,422
Wal-Mart Stores Inc 119,093
Kroger Co/The 118,735
* Alphabet Inc 'A' - 205 nominal pledged as collateral, Gilead Sciences Inc - 1,100 nominal pledged as collateral and Pfizer Inc - 3,000 nominal pledged as collateral in relation to the futures contracts held with JPMorgan Chase & Co. at 30 September 2016. The Material Portfolio Changes reflect the aggregate purchases of a security exceeding one per cent of the total value of purchases for the year and aggregate disposals greater than one per cent of the total value of the sales.
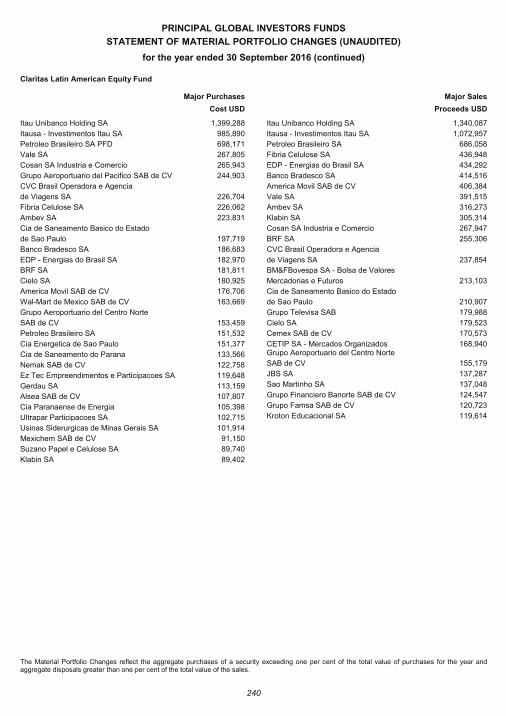
PRINCIPAL GLOBAL INVESTORS FUNDS
STATEMENT OF MATERIAL PORTFOLIO CHANGES (UNAUDITED)
for the year ended 30 September 2016 (continued)
240
Claritas Latin American Equity Fund
Major Purchases Major Sales
Cost USD Proceeds USD
Itau Unibanco Holding SA 1,399,288 Itau Unibanco Holding SA 1,340,087
Itausa - Investimentos Itau SA 985,890 Itausa - Investimentos Itau SA 1,072,957
Petroleo Brasileiro SA PFD 698,171 Petroleo Brasileiro SA 686,058
Vale SA 267,805 Fibria Celulose SA 436,948
Cosan SA Industria e Comercio 265,943 EDP - Energias do Brasil SA 434,292
Grupo Aeroportuario del Pacifico SAB de CV 244,903 Banco Bradesco SA 414,516
CVC Brasil Operadora e Agencia America Movil SAB de CV 406,384
de Viagens SA 226,704 Vale SA 391,515
Fibria Celulose SA 226,062 Ambev SA 316,273
Ambev SA 223,831 Klabin SA 305,314
Cia de Saneamento Basico do Estado Cosan SA Industria e Comercio 267,947
de Sao Paulo 197,719 BRF SA 255,306
Banco Bradesco SA 186,683 CVC Brasil Operadora e Agencia
EDP - Energias do Brasil SA 182,970 de Viagens SA 237,854
BRF SA 181,811 BM&FBovespa SA - Bolsa de Valores
Cielo SA 180,925 Mercadorias e Futuros 213,103
America Movil SAB de CV 176,706 Cia de Saneamento Basico do Estado
Wal-Mart de Mexico SAB de CV 163,669 de Sao Paulo 210,907
Grupo Aeroportuario del Centro Norte Grupo Televisa SAB 179,988
SAB de CV 153,459 Cielo SA 179,523
Petroleo Brasileiro SA 151,532 Cemex SAB de CV 170,573
Cia Energetica de Sao Paulo 151,377 CETIP SA - Mercados Organizados 168,940
Cia de Saneamento do Parana 133,566 Grupo Aeroportuario del Centro Norte
Nemak SAB de CV 122,758 SAB de CV 155,179
Ez Tec Empreendimentos e Participacoes SA 119,648 JBS SA 137,287
Gerdau SA 113,159 Sao Martinho SA 137,048
Alsea SAB de CV 107,807 Grupo Financiero Banorte SAB de CV 124,547
Cia Paranaense de Energia 105,398 Grupo Famsa SAB de CV 120,723
Ultrapar Participacoes SA 102,715 Kroton Educacional SA 119,614
Usinas Siderurgicas de Minas Gerais SA 101,914
Mexichem SAB de CV 91,150
Suzano Papel e Celulose SA 89,740
Klabin SA 89,402
The Material Portfolio Changes reflect the aggregate purchases of a security exceeding one per cent of the total value of purchases for the year and aggregate disposals greater than one per cent of the total value of the sales.
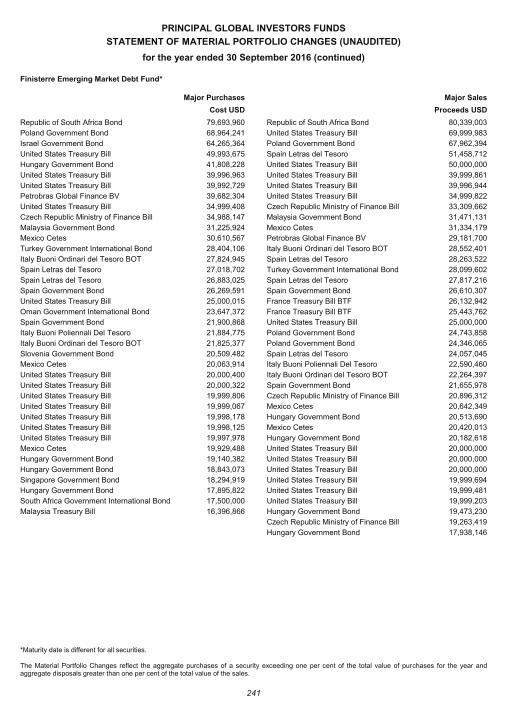
PRINCIPAL GLOBAL INVESTORS FUNDS
STATEMENT OF MATERIAL PORTFOLIO CHANGES (UNAUDITED)
for the year ended 30 September 2016 (continued)
241
Finisterre Emerging Market Debt Fund*
Major Purchases Major Sales
Cost USD Proceeds USD
Republic of South Africa Bond 79,693,960 Republic of South Africa Bond 80,339,003
Poland Government Bond 68,964,241 United States Treasury Bill 69,999,983
Israel Government Bond 64,265,364 Poland Government Bond 67,962,394
United States Treasury Bill 49,993,675 Spain Letras del Tesoro 51,458,712
Hungary Government Bond 41,808,228 United States Treasury Bill 50,000,000
United States Treasury Bill 39,996,963 United States Treasury Bill 39,999,861
United States Treasury Bill 39,992,729 United States Treasury Bill 39,996,944
Petrobras Global Finance BV 39,682,304 United States Treasury Bill 34,999,822
United States Treasury Bill 34,999,408 Czech Republic Ministry of Finance Bill 33,309,662
Czech Republic Ministry of Finance Bill 34,988,147 Malaysia Government Bond 31,471,131
Malaysia Government Bond 31,225,924 Mexico Cetes 31,334,179
Mexico Cetes 30,610,567 Petrobras Global Finance BV 29,181,700
Turkey Government International Bond 28,404,106 Italy Buoni Ordinari del Tesoro BOT 28,552,401
Italy Buoni Ordinari del Tesoro BOT 27,824,945 Spain Letras del Tesoro 28,263,522
Spain Letras del Tesoro 27,018,702 Turkey Government International Bond 28,099,602
Spain Letras del Tesoro 26,883,025 Spain Letras del Tesoro 27,817,216
Spain Government Bond 26,269,591 Spain Government Bond 26,610,307
United States Treasury Bill 25,000,015 France Treasury Bill BTF 26,132,942
Oman Government International Bond 23,647,372 France Treasury Bill BTF 25,443,762
Spain Government Bond 21,900,868 United States Treasury Bill 25,000,000
Italy Buoni Poliennali Del Tesoro 21,884,775 Poland Government Bond 24,743,858
Italy Buoni Ordinari del Tesoro BOT 21,825,377 Poland Government Bond 24,346,065
Slovenia Government Bond 20,509,482 Spain Letras del Tesoro 24,057,045
Mexico Cetes 20,063,914 Italy Buoni Poliennali Del Tesoro 22,590,460
United States Treasury Bill 20,000,400 Italy Buoni Ordinari del Tesoro BOT 22,264,397
United States Treasury Bill 20,000,322 Spain Government Bond 21,655,978
United States Treasury Bill 19,999,806 Czech Republic Ministry of Finance Bill 20,896,312
United States Treasury Bill 19,999,067 Mexico Cetes 20,642,349
United States Treasury Bill 19,998,178 Hungary Government Bond 20,513,690
United States Treasury Bill 19,998,125 Mexico Cetes 20,420,013
United States Treasury Bill 19,997,978 Hungary Government Bond 20,182,618
Mexico Cetes 19,929,488 United States Treasury Bill 20,000,000
Hungary Government Bond 19,140,382 United States Treasury Bill 20,000,000
Hungary Government Bond 18,843,073 United States Treasury Bill 20,000,000
Singapore Government Bond 18,294,919 United States Treasury Bill 19,999,694
Hungary Government Bond 17,895,822 United States Treasury Bill 19,999,481
South Africa Government International Bond 17,500,000 United States Treasury Bill 19,999,203
Malaysia Treasury Bill 16,396,866 Hungary Government Bond 19,473,230
Czech Republic Ministry of Finance Bill 19,263,419
Hungary Government Bond 17,938,146
*Maturity date is different for all securities.
The Material Portfolio Changes reflect the aggregate purchases of a security exceeding one per cent of the total value of purchases for the year and aggregate disposals greater than one per cent of the total value of the sales.
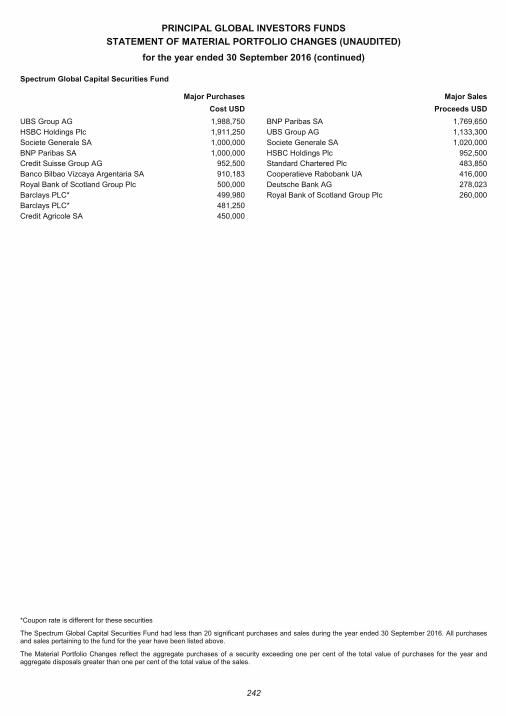
PRINCIPAL GLOBAL INVESTORS FUNDS
STATEMENT OF MATERIAL PORTFOLIO CHANGES (UNAUDITED)
for the year ended 30 September 2016 (continued)
242
Spectrum Global Capital Securities Fund
Major Purchases Major Sales
Cost USD Proceeds USD
UBS Group AG 1,988,750 BNP Paribas SA 1,769,650
HSBC Holdings Plc 1,911,250 UBS Group AG 1,133,300
Societe Generale SA 1,000,000 Societe Generale SA 1,020,000
BNP Paribas SA 1,000,000 HSBC Holdings Plc 952,500
Credit Suisse Group AG 952,500 Standard Chartered Plc 483,850
Banco Bilbao Vizcaya Argentaria SA 910,183 Cooperatieve Rabobank UA 416,000
Royal Bank of Scotland Group Plc 500,000 Deutsche Bank AG 278,023
Barclays PLC* 499,980 Royal Bank of Scotland Group Plc 260,000
Barclays PLC* 481,250
Credit Agricole SA 450,000
*Coupon rate is different for these securities
The Spectrum Global Capital Securities Fund had less than 20 significant purchases and sales during the year ended 30 September 2016. All purchases and sales pertaining to the fund for the year have been listed above.
The Material Portfolio Changes reflect the aggregate purchases of a security exceeding one per cent of the total value of purchases for the year and aggregate disposals greater than one per cent of the total value of the sales.
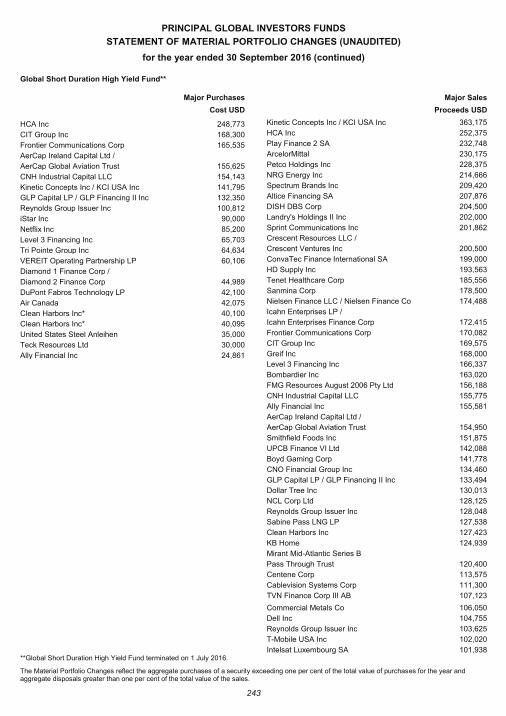
PRINCIPAL GLOBAL INVESTORS FUNDS
STATEMENT OF MATERIAL PORTFOLIO CHANGES (UNAUDITED)
for the year ended 30 September 2016 (continued)
243
Global Short Duration High Yield Fund**
Major Purchases Major Sales
Cost USD Proceeds USD
HCA Inc 248,773 Kinetic Concepts Inc / KCI USA Inc 363,175
CIT Group Inc 168,300 HCA Inc 252,375
Frontier Communications Corp 165,535 Play Finance 2 SA 232,748
AerCap Ireland Capital Ltd / ArcelorMittal 230,175
AerCap Global Aviation Trust 155,625 Petco Holdings Inc 228,375
CNH Industrial Capital LLC 154,143 NRG Energy Inc 214,666
Kinetic Concepts Inc / KCI USA Inc 141,795 Spectrum Brands Inc 209,420
GLP Capital LP / GLP Financing II Inc 132,350 Altice Financing SA 207,876
Reynolds Group Issuer Inc 100,812 DISH DBS Corp 204,500
iStar Inc 90,000 Landry's Holdings II Inc 202,000
Netflix Inc 85,200 Sprint Communications Inc 201,862
Level 3 Financing Inc 65,703 Crescent Resources LLC /
Tri Pointe Group Inc 64,634 Crescent Ventures Inc 200,500
VEREIT Operating Partnership LP 60,106 ConvaTec Finance International SA 199,000
Diamond 1 Finance Corp / HD Supply Inc 193,563
Diamond 2 Finance Corp 44,989 Tenet Healthcare Corp 185,556
DuPont Fabros Technology LP 42,100 Sanmina Corp 178,500
Air Canada 42,075 Nielsen Finance LLC / Nielsen Finance Co 174,488
Clean Harbors Inc* 40,100 Icahn Enterprises LP /
Clean Harbors Inc* 40,095 Icahn Enterprises Finance Corp 172,415
United States Steel Anleihen 35,000 Frontier Communications Corp 170,082
Teck Resources Ltd 30,000 CIT Group Inc 169,575
Ally Financial Inc 24,861 Greif Inc 168,000
Level 3 Financing Inc 166,337
Bombardier Inc 163,020
FMG Resources August 2006 Pty Ltd 156,188
CNH Industrial Capital LLC 155,775
Ally Financial Inc 155,581
AerCap Ireland Capital Ltd /
AerCap Global Aviation Trust 154,950
Smithfield Foods Inc 151,875
UPCB Finance VI Ltd 142,088
Boyd Gaming Corp 141,778
CNO Financial Group Inc 134,460
GLP Capital LP / GLP Financing II Inc 133,494
Dollar Tree Inc 130,013
NCL Corp Ltd 128,125
Reynolds Group Issuer Inc 128,048
Sabine Pass LNG LP 127,538
Clean Harbors Inc 127,423
KB Home 124,939
Mirant Mid-Atlantic Series B
Pass Through Trust 120,400
Centene Corp 113,575
Cablevision Systems Corp 111,300
TVN Finance Corp III AB 107,123
Commercial Metals Co 106,050 Dell Inc 104,755 Reynolds Group Issuer Inc 103,625 T-Mobile USA Inc 102,020 Intelsat Luxembourg SA 101,938 **Global Short Duration High Yield Fund terminated on 1 July 2016.
The Material Portfolio Changes reflect the aggregate purchases of a security exceeding one per cent of the total value of purchases for the year and aggregate disposals greater than one per cent of the total value of the sales.
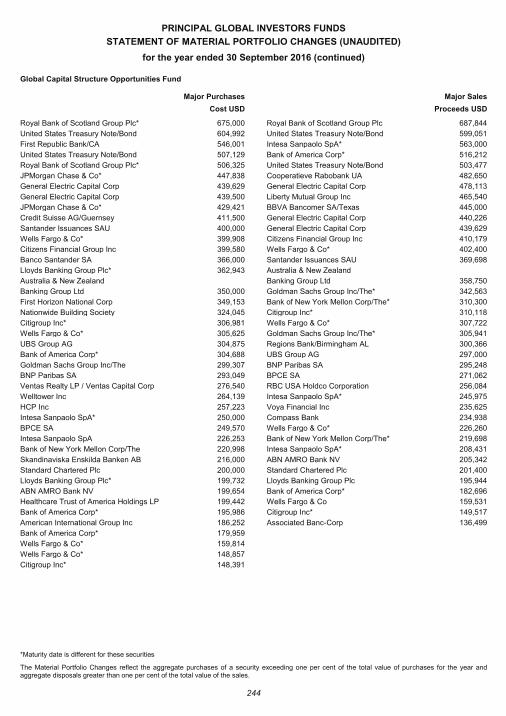
PRINCIPAL GLOBAL INVESTORS FUNDS
STATEMENT OF MATERIAL PORTFOLIO CHANGES (UNAUDITED)
for the year ended 30 September 2016 (continued)
244
Global Capital Structure Opportunities Fund
Major Purchases Major Sales
Cost USD Proceeds USD
Royal Bank of Scotland Group Plc* 675,000 Royal Bank of Scotland Group Plc 687,844
United States Treasury Note/Bond 604,992 United States Treasury Note/Bond 599,051
First Republic Bank/CA 546,001 Intesa Sanpaolo SpA* 563,000
United States Treasury Note/Bond 507,129 Bank of America Corp* 516,212
Royal Bank of Scotland Group Plc* 506,325 United States Treasury Note/Bond 503,477
JPMorgan Chase & Co* 447,838 Cooperatieve Rabobank UA 482,650
General Electric Capital Corp 439,629 General Electric Capital Corp 478,113
General Electric Capital Corp 439,500 Liberty Mutual Group Inc 465,540
JPMorgan Chase & Co* 429,421 BBVA Bancomer SA/Texas 445,000
Credit Suisse AG/Guernsey 411,500 General Electric Capital Corp 440,226
Santander Issuances SAU 400,000 General Electric Capital Corp 439,629
Wells Fargo & Co* 399,908 Citizens Financial Group Inc 410,179
Citizens Financial Group Inc 399,580 Wells Fargo & Co* 402,400
Banco Santander SA 366,000 Santander Issuances SAU 369,698
Lloyds Banking Group Plc* 362,943 Australia & New Zealand
Australia & New Zealand Banking Group Ltd 358,750
Banking Group Ltd 350,000 Goldman Sachs Group Inc/The* 342,563
First Horizon National Corp 349,153 Bank of New York Mellon Corp/The* 310,300
Nationwide Building Society 324,045 Citigroup Inc* 310,118
Citigroup Inc* 306,981 Wells Fargo & Co* 307,722
Wells Fargo & Co* 305,625 Goldman Sachs Group Inc/The* 305,941
UBS Group AG 304,875 Regions Bank/Birmingham AL 300,366
Bank of America Corp* 304,688 UBS Group AG 297,000
Goldman Sachs Group Inc/The 299,307 BNP Paribas SA 295,248
BNP Paribas SA 293,049 BPCE SA 271,062
Ventas Realty LP / Ventas Capital Corp 276,540 RBC USA Holdco Corporation 256,084
Welltower Inc 264,139 Intesa Sanpaolo SpA* 245,975
HCP Inc 257,223 Voya Financial Inc 235,625
Intesa Sanpaolo SpA* 250,000 Compass Bank 234,938
BPCE SA 249,570 Wells Fargo & Co* 226,260
Intesa Sanpaolo SpA 226,253 Bank of New York Mellon Corp/The* 219,698
Bank of New York Mellon Corp/The 220,998 Intesa Sanpaolo SpA* 208,431
Skandinaviska Enskilda Banken AB 216,000 ABN AMRO Bank NV 205,342
Standard Chartered Plc 200,000 Standard Chartered Plc 201,400
Lloyds Banking Group Plc* 199,732 Lloyds Banking Group Plc 195,944
ABN AMRO Bank NV 199,654 Bank of America Corp* 182,696
Healthcare Trust of America Holdings LP 199,442 Wells Fargo & Co 159,531
Bank of America Corp* 195,986 Citigroup Inc* 149,517
American International Group Inc 186,252 Associated Banc-Corp 136,499
Bank of America Corp* 179,959
Wells Fargo & Co* 159,814
Wells Fargo & Co* 148,857
Citigroup Inc* 148,391
*Maturity date is different for these securities
The Material Portfolio Changes reflect the aggregate purchases of a security exceeding one per cent of the total value of purchases for the year and aggregate disposals greater than one per cent of the total value of the sales.
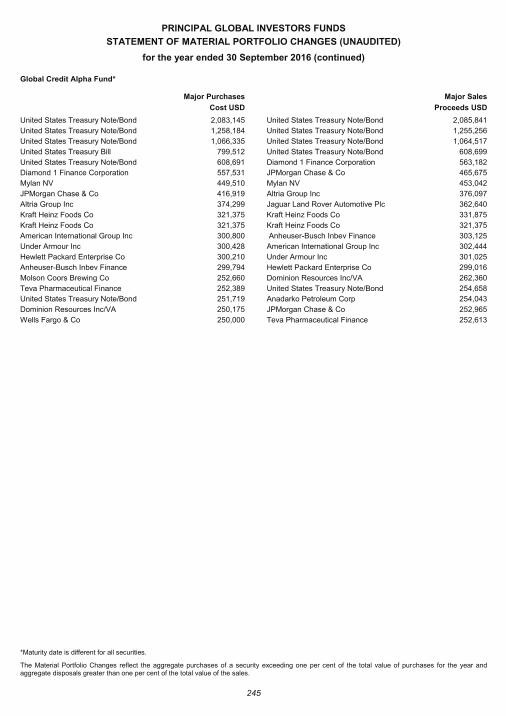
PRINCIPAL GLOBAL INVESTORS FUNDS
STATEMENT OF MATERIAL PORTFOLIO CHANGES (UNAUDITED)
for the year ended 30 September 2016 (continued)
245
Global Credit Alpha Fund*
Major Purchases Major Sales
Cost USD Proceeds USD
United States Treasury Note/Bond 2,083,145 United States Treasury Note/Bond 2,085,841
United States Treasury Note/Bond 1,258,184 United States Treasury Note/Bond 1,255,256
United States Treasury Note/Bond 1,066,335 United States Treasury Note/Bond 1,064,517
United States Treasury Bill 799,512 United States Treasury Note/Bond 608,699
United States Treasury Note/Bond 608,691 Diamond 1 Finance Corporation 563,182
Diamond 1 Finance Corporation 557,531 JPMorgan Chase & Co 465,675
Mylan NV 449,510 Mylan NV 453,042
JPMorgan Chase & Co 416,919 Altria Group Inc 376,097
Altria Group Inc 374,299 Jaguar Land Rover Automotive Plc 362,640
Kraft Heinz Foods Co 321,375 Kraft Heinz Foods Co 331,875
Kraft Heinz Foods Co 321,375 Kraft Heinz Foods Co 321,375
American International Group Inc 300,800 Anheuser-Busch Inbev Finance 303,125
Under Armour Inc 300,428 American International Group Inc 302,444
Hewlett Packard Enterprise Co 300,210 Under Armour Inc 301,025
Anheuser-Busch Inbev Finance 299,794 Hewlett Packard Enterprise Co 299,016
Molson Coors Brewing Co 252,660 Dominion Resources Inc/VA 262,360
Teva Pharmaceutical Finance 252,389 United States Treasury Note/Bond 254,658
United States Treasury Note/Bond 251,719 Anadarko Petroleum Corp 254,043
Dominion Resources Inc/VA 250,175 JPMorgan Chase & Co 252,965
Wells Fargo & Co 250,000 Teva Pharmaceutical Finance 252,613
*Maturity date is different for all securities.
The Material Portfolio Changes reflect the aggregate purchases of a security exceeding one per cent of the total value of purchases for the year and aggregate disposals greater than one per cent of the total value of the sales.
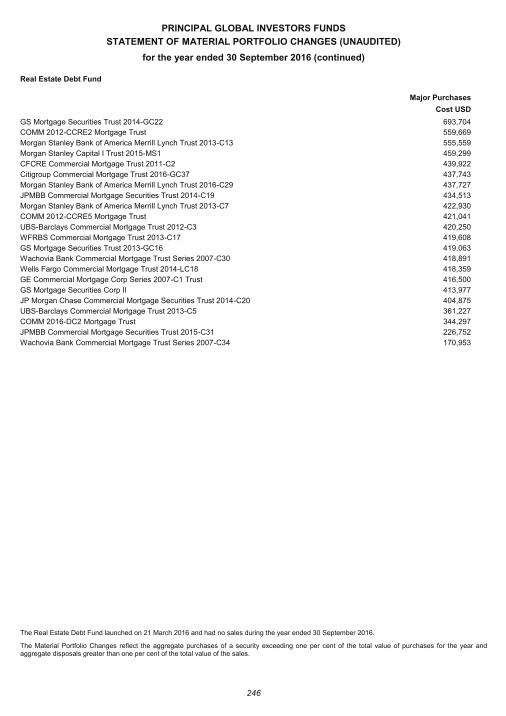
PRINCIPAL GLOBAL INVESTORS FUNDS
STATEMENT OF MATERIAL PORTFOLIO CHANGES (UNAUDITED)
for the year ended 30 September 2016 (continued)
246
Real Estate Debt Fund
Major Purchases
Cost USD
GS Mortgage Securities Trust 2014-GC22 693,704
COMM 2012-CCRE2 Mortgage Trust 559,669
Morgan Stanley Bank of America Merrill Lynch Trust 2013-C13 555,559
Morgan Stanley Capital I Trust 2015-MS1 459,299
CFCRE Commercial Mortgage Trust 2011-C2 439,922
Citigroup Commercial Mortgage Trust 2016-GC37 437,743
Morgan Stanley Bank of America Merrill Lynch Trust 2016-C29 437,727
JPMBB Commercial Mortgage Securities Trust 2014-C19 434,513
Morgan Stanley Bank of America Merrill Lynch Trust 2013-C7 422,930
COMM 2012-CCRE5 Mortgage Trust 421,041
UBS-Barclays Commercial Mortgage Trust 2012-C3 420,250
WFRBS Commercial Mortgage Trust 2013-C17 419,608
GS Mortgage Securities Trust 2013-GC16 419,063
Wachovia Bank Commercial Mortgage Trust Series 2007-C30 418,891
Wells Fargo Commercial Mortgage Trust 2014-LC18 418,359
GE Commercial Mortgage Corp Series 2007-C1 Trust 416,500
GS Mortgage Securities Corp II 413,977
JP Morgan Chase Commercial Mortgage Securities Trust 2014-C20 404,875
UBS-Barclays Commercial Mortgage Trust 2013-C5 361,227
COMM 2016-DC2 Mortgage Trust 344,297
JPMBB Commercial Mortgage Securities Trust 2015-C31 226,752
Wachovia Bank Commercial Mortgage Trust Series 2007-C34 170,953
The Real Estate Debt Fund launched on 21 March 2016 and had no sales during the year ended 30 September 2016.
The Material Portfolio Changes reflect the aggregate purchases of a security exceeding one per cent of the total value of purchases for the year and aggregate disposals greater than one per cent of the total value of the sales.
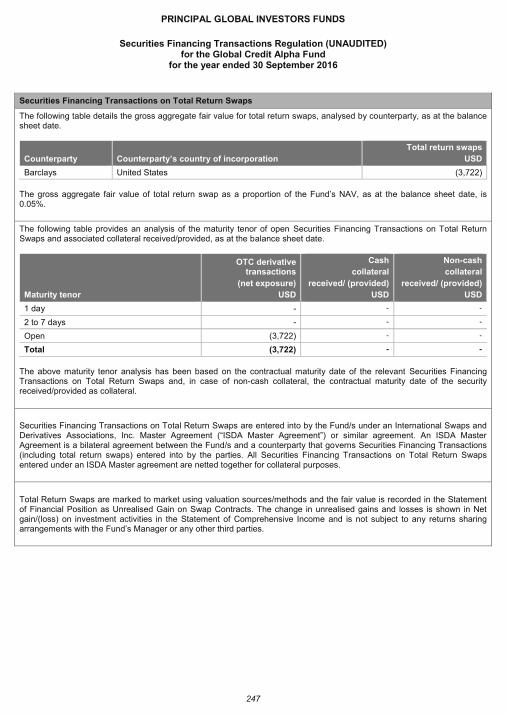
PRINCIPAL GLOBAL INVESTORS FUNDS
Securities Financing Transactions Regulation (UNAUDITED)
for the Global Credit Alpha Fund for the year ended 30 September 2016
247
Securities Financing Transactions on Total Return Swaps
The following table details the gross aggregate fair value for total return swaps, analysed by counterparty, as at the balance sheet date.
Counterparty Counterparty’s country of incorporation
Total return swaps
USD
Barclays United States (3,722)
The gross aggregate fair value of total return swap as a proportion of the Fund’s NAV, as at the balance sheet date, is 0.05%.
The following table provides an analysis of the maturity tenor of open Securities Financing Transactions on Total Return Swaps and associated collateral received/provided, as at the balance sheet date.
Maturity tenor
OTC derivative transactions
(net exposure)
USD
Cash
collateral
received/ (provided)
USD
Non-cash
collateral
received/ (provided)
USD
1 day - - -
2 to 7 days - - -
Open (3,722) - -
Total (3,722) - -
The above maturity tenor analysis has been based on the contractual maturity date of the relevant Securities Financing Transactions on Total Return Swaps and, in case of non-cash collateral, the contractual maturity date of the security received/provided as collateral.
Securities Financing Transactions on Total Return Swaps are entered into by the Fund/s under an International Swaps and Derivatives Associations, Inc. Master Agreement (“ISDA Master Agreement”) or similar agreement. An ISDA Master Agreement is a bilateral agreement between the Fund/s and a counterparty that governs Securities Financing Transactions (including total return swaps) entered into by the parties. All Securities Financing Transactions on Total Return Swaps entered under an ISDA Master agreement are netted together for collateral purposes.
Total Return Swaps are marked to market using valuation sources/methods and the fair value is recorded in the Statement of Financial Position as Unrealised Gain on Swap Contracts. The change in unrealised gains and losses is shown in Net gain/(loss) on investment activities in the Statement of Comprehensive Income and is not subject to any returns sharing arrangements with the Fund’s Manager or any other third parties.
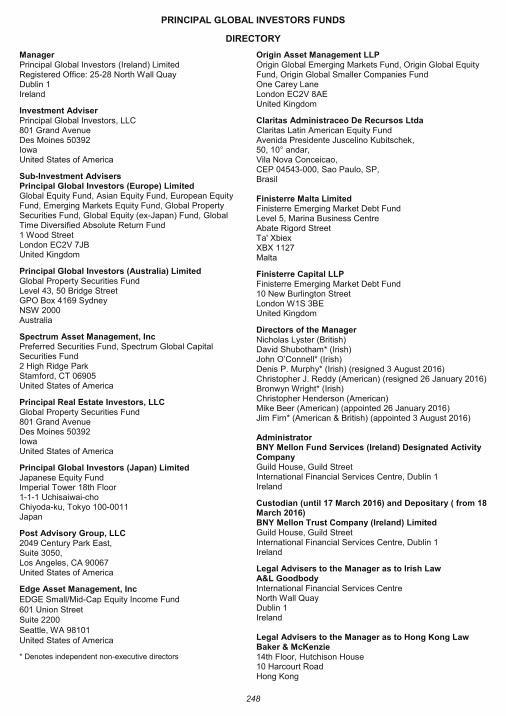
248
PRINCIPAL GLOBAL INVESTORS FUNDS
DIRECTORY
Manager Principal Global Investors (Ireland) Limited Registered Office: 25-28 North Wall Quay Dublin 1 Ireland
Investment Adviser Principal Global Investors, LLC 801 Grand Avenue Des Moines 50392 Iowa United States of America
Sub-Investment Advisers Principal Global Investors (Europe) Limited Global Equity Fund, Asian Equity Fund, European Equity Fund, Emerging Markets Equity Fund, Global Property Securities Fund, Global Equity (ex-Japan) Fund, Global Time Diversified Absolute Return Fund 1 Wood Street London EC2V 7JB United Kingdom
Principal Global Investors (Australia) Limited Global Property Securities Fund Level 43, 50 Bridge Street GPO Box 4169 Sydney NSW 2000 Australia
Spectrum Asset Management, Inc Preferred Securities Fund, Spectrum Global Capital Securities Fund 2 High Ridge Park Stamford, CT 06905 United States of America
Principal Real Estate Investors, LLC Global Property Securities Fund 801 Grand Avenue Des Moines 50392 Iowa United States of America
Principal Global Investors (Japan) Limited Japanese Equity Fund Imperial Tower 18th Floor 1-1-1 Uchisaiwai-cho Chiyoda-ku, Tokyo 100-0011 Japan
Post Advisory Group, LLC 2049 Century Park East, Suite 3050, Los Angeles, CA 90067 United States of America
Edge Asset Management, Inc
EDGE Small/Mid-Cap Equity Income Fund 601 Union Street Suite 2200 Seattle, WA 98101 United States of America
* Denotes independent non-executive directors
Origin Asset Management LLP Origin Global Emerging Markets Fund, Origin Global Equity Fund, Origin Global Smaller Companies Fund One Carey Lane London EC2V 8AE United Kingdom
Claritas Administraceo De Recursos Ltda Claritas Latin American Equity Fund Avenida Presidente Juscelino Kubitschek, 50, 10° andar, Vila Nova Conceicao, CEP 04543-000, Sao Paulo, SP, Brasil Finisterre Malta Limited Finisterre Emerging Market Debt Fund Level 5, Marina Business Centre Abate Rigord Street Ta' Xbiex XBX 1127 Malta
Finisterre Capital LLP Finisterre Emerging Market Debt Fund 10 New Burlington Street London W1S 3BE United Kingdom
Directors of the Manager Nicholas Lyster (British) David Shubotham* (Irish) John O’Connell* (Irish) Denis P. Murphy* (Irish) (resigned 3 August 2016) Christopher J. Reddy (American) (resigned 26 January 2016) Bronwyn Wright* (Irish) Christopher Henderson (American) Mike Beer (American) (appointed 26 January 2016) Jim Firn* (American & British) (appointed 3 August 2016) Administrator BNY Mellon Fund Services (Ireland) Designated Activity Company Guild House, Guild Street International Financial Services Centre, Dublin 1 Ireland
Custodian (until 17 March 2016) and Depositary ( from 18 March 2016) BNY Mellon Trust Company (Ireland) Limited Guild House, Guild Street International Financial Services Centre, Dublin 1 Ireland
Legal Advisers to the Manager as to Irish Law A&L Goodbody International Financial Services Centre North Wall Quay Dublin 1 Ireland Legal Advisers to the Manager as to Hong Kong Law Baker & McKenzie 14th Floor, Hutchison House 10 Harcourt Road Hong Kong
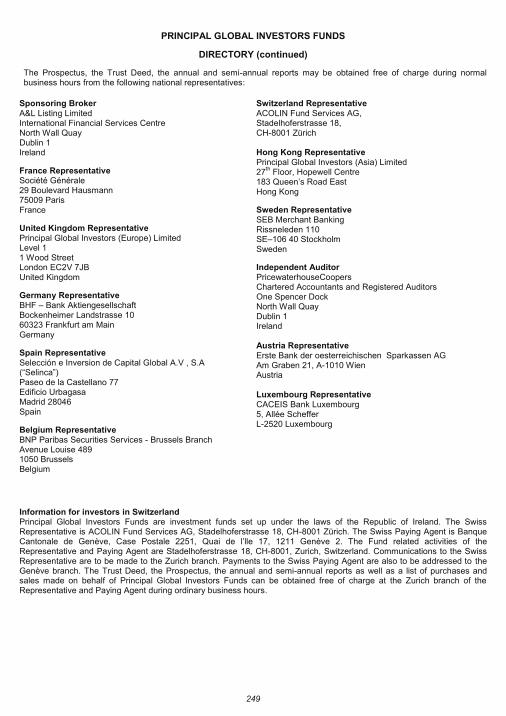
249
PRINCIPAL GLOBAL INVESTORS FUNDS
DIRECTORY (continued)
The Prospectus, the Trust Deed, the annual and semi-annual reports may be obtained free of charge during normal business hours from the following national representatives:
Sponsoring Broker A&L Listing Limited International Financial Services Centre North Wall Quay Dublin 1 Ireland
France Representative Société Générale 29 Boulevard Hausmann 75009 Paris France
United Kingdom Representative Principal Global Investors (Europe) Limited Level 1 1 Wood Street London EC2V 7JB United Kingdom
Germany Representative BHF – Bank Aktiengesellschaft Bockenheimer Landstrasse 10 60323 Frankfurt am Main Germany
Spain Representative Selección e Inversion de Capital Global A.V , S.A (“Selinca”) Paseo de la Castellano 77 Edificio Urbagasa Madrid 28046 Spain
Belgium Representative BNP Paribas Securities Services - Brussels Branch Avenue Louise 489 1050 Brussels Belgium
Switzerland Representative ACOLIN Fund Services AG, Stadelhoferstrasse 18, CH-8001 Zürich Hong Kong Representative Principal Global Investors (Asia) Limited 27
th Floor, Hopewell Centre
183 Queen’s Road East Hong Kong
Sweden Representative SEB Merchant Banking Rissneleden 110 SE–106 40 Stockholm Sweden
Independent Auditor PricewaterhouseCoopers Chartered Accountants and Registered Auditors One Spencer Dock North Wall Quay Dublin 1 Ireland Austria Representative Erste Bank der oesterreichischen Sparkassen AG Am Graben 21, A-1010 Wien Austria Luxembourg Representative CACEIS Bank Luxembourg 5, Allée Scheffer L-2520 Luxembourg
Information for investors in Switzerland Principal Global Investors Funds are investment funds set up under the laws of the Republic of Ireland. The Swiss Representative is ACOLIN Fund Services AG, Stadelhoferstrasse 18, CH-8001 Zürich. The Swiss Paying Agent is Banque Cantonale de Genève, Case Postale 2251, Quai de l’lle 17, 1211 Genève 2. The Fund related activities of the Representative and Paying Agent are Stadelhoferstrasse 18, CH-8001, Zurich, Switzerland. Communications to the Swiss Representative are to be made to the Zurich branch. Payments to the Swiss Paying Agent are also to be addressed to the Genève branch. The Trust Deed, the Prospectus, the annual and semi-annual reports as well as a list of purchases and sales made on behalf of Principal Global Investors Funds can be obtained free of charge at the Zurich branch of the Representative and Paying Agent during ordinary business hours.
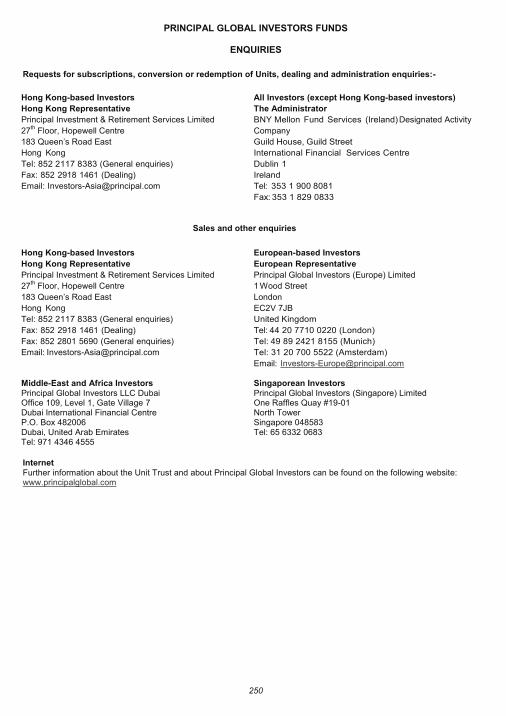
PRINCIPAL GLOBAL INVESTORS FUNDS
ENQUIRIES
250
Requests for subscriptions, conversion or redemption of Units, dealing and administration enquiries:-
Hong Kong-based Investors
Hong Kong Representative
Principal Investment & Retirement Services Limited
27th Floor, Hopewell Centre
183 Queen’s Road East
Hong Kong
Tel: 852 2117 8383 (General enquiries)
Fax: 852 2918 1461 (Dealing)
Email: [email protected]
All Investors (except Hong Kong-based investors)
The Administrator
BNY Mellon Fund Services (Ireland) Designated Activity
Company
Guild House, Guild Street
International Financial Services Centre
Dublin 1
Ireland
Tel: 353 1 900 8081
Fax: 353 1 829 0833
Sales and other enquiries
Hong Kong-based Investors
Hong Kong Representative
Principal Investment & Retirement Services Limited
27th Floor, Hopewell Centre
183 Queen’s Road East
Hong Kong
Tel: 852 2117 8383 (General enquiries)
Fax: 852 2918 1461 (Dealing)
Fax: 852 2801 5690 (General enquiries)
Email: [email protected]
European-based Investors
European Representative
Principal Global Investors (Europe) Limited
1 Wood Street
London
EC2V 7JB
United Kingdom
Tel: 44 20 7710 0220 (London)
Tel: 49 89 2421 8155 (Munich)
Tel: 31 20 700 5522 (Amsterdam)
Email: [email protected]
Middle-East and Africa Investors Principal Global Investors LLC Dubai Office 109, Level 1, Gate Village 7 Dubai International Financial Centre P.O. Box 482006 Dubai, United Arab Emirates Tel: 971 4346 4555
Singaporean Investors Principal Global Investors (Singapore) Limited One Raffles Quay #19-01 North Tower Singapore 048583 Tel: 65 6332 0683
Internet Further information about the Unit Trust and about Principal Global Investors can be found on the following website: www.principalglobal.com