pricewaterhousecoopers india pvt ltd moneytree … india pvt ltd moneytree tm ... bharti airtel. ......
TRANSCRIPT

www.pwc.com/globalmoneytree www.pwc.in
Technology Institute
This special report provides summary results of Q2 ’12, Q1 ’13 and Q2 ’13.
PricewaterhouseCoopers India Pvt Ltd
MoneyTreeTM India ReportQ2 2013Data provided by Venture Intelligence
Table of contents
1. Overview 2
2. Analysis of private equity investments 3
Investments by industry 4
Investments by stage of development 6
Investments by region 7
Top 20 PE deals 8
3. Analysis of PE exits 9
Exits by industry 10
Exits by type 11
Top five PE exits 12
4. Active PE firms 13
5. Sector focus: IT and ITeS 14
Investments by stage of development 16
Investments by region 17
Investments by subsegments 18
PE exits in the sector 19
Definitions 20
Contacts 21
1PwC MoneyTreeTM India Report–Q2 ’13

The momentum is back
After a disappointing first quarter, a few large deals inked during the second quarter of 2013 brought some cheer to the private equity markets. The aggregate deal value of 4.72 billion USD for the first half of 2013 now compares itself favourably with the first half of 2012, thereby indicating a 15% growth. These numbers include the 1.26 billion USD investment made by Qatar foundation into Bharti Airtel. Sectors such as manufacturing, information technology (IT) and IT-enabled services (ITeS) witnessed significant activity during the given quarter, with an inflow of investments to the tune of 796 million USD (across six deals) and 453 million USD (across 31 deals) respectively.
During this quarter, the falling rupee was the biggest concern for private equity funds, particularly as a couple of investors tried to exit from some of their investments. Even for those trying to raise funds, it has been an exigent quarter. Along with the challenges caused by the limited partners’ activism in recent months, the seemingly poor macro-economic environment within the country has also added to their worries. High levels of current and fiscal account deficits have been another serious concern for them, and while the Indian government has recently tried to relax the foreign direct investment norms in order to attract foreign capital, these measures are not expected to make any significant impact in the short term.
In the near future, it is expected that exits will continue to be the primary focus for private equity funds. Consumer focussed sectors will continue to have investors’ attention in terms of fresh investments. However, sharp valuations continue to challenge them and a cautious approach seems to be setting in. At the same time, core sector investments are attracting attention from private equity funds on a selective basis. The reversal in the interest rate cycle can create opportunities for the private equity funds as well, particularly in cases of well-run businesses, which may be suffering from over-levered balance sheets.
The rural market segment has been another area of focus for private equity investors. Such markets have seen a sharp pickup in demand recently, and some investors have been working on understanding this segment better, considering the fact that urban markets are over-served and have reached a saturation point.
Sanjeev KrishanExecutive DirectorLeader, Private Equity and Transaction ServicesPricewaterhouseCoopers India Pvt Ltd
1. Overview
PwC2

2. Analysis of private equity investments
Total equity investments in PE-backed companiesAfter a dismal first quarter, the PE investments in the second quarter of 2013 have bounced back with more than double the value of investments. PE firms have invested 2.33 billion USD across 82 deals in this quarter despite a 3.5% drop in the volume of deals.
In comparison with the same quarter last year, i.e., Q2 ’12, there has been an increase of 18% in value despite a 29% drop in the number of deals. In Q2 ’12, the value of investments were 1.98 billion USD from 115 deals.
With 31 deals worth 453 million USD in Q2 ’13, the information technology (IT) and IT-enabled services (ITeS) sector is the leader in terms of volume and ranks second in terms of value. This is a three-fold growth in value despite a 16% drop in volume, as compared to the previous quarter.
In terms of value, the manufacturing sector leads this quarter with investments worth 796 million USD from six deals. This is a significant leap from the 65 million USD
invested in Q1 ’13 and the 47 million USD in Q2 ’12. The increase is primarily driven by a couple of large deals, each worth over 250 million USD.
The healthcare and life sciences sector witnessed a 66% growth in the value of investments, seeing an increase from 130 million USD in Q1 ’13 to 215 million USD in Q2 ’13. Other key sectors, such as engineering and construction, media and entertainment, energy and fast-moving consumer goods (FMCG) have also had investment increases when compared to the prior quarter.
The banking, financial services and insurance (BFSI) sector, which led the previous quarter in terms of value, has shown a considerable drop in investments. The shipping, logistics and education sectors have also recorded declines in the value of deals this quarter as compared to the last quarter.
Note: This report does not include the Bharti Airtel–Qatar Foundation Endowment deal for analysis as Venture Intelligence, according to their definitions, does not consider any investments made by sovereign wealth funds into listed entities as private equity.
Data provided by Venture Intelligence
Q3
’04 ’13’05 ’06 ’07 ’08 ’09 ’10 ’11 ’12
In m
illio
n U
SD
Q4 Q1 Q3 Q4Q2 Q1 Q3 Q4Q2 Q1 Q3 Q4Q2 Q1 Q3 Q4Q2 Q1 Q3 Q4Q2 Q1 Q3 Q4Q2 Q1 Q3 Q4 Q1Q2
247
916
576
357
679848
1,375
1,663
1,973 1,945
2,800
4,455
5,278
2,620
1,186814
1,008
1,945
1,570
2,378
1,914
3,823
1,509
2,493
2,163
1,979
2,713
523
1,1341,054
3,904
1,9912,493
3,759
2,084
Q2(21) (36) (44) (42) (46) (63) (98) (82) (103) (98) (119) (93) (144) (177) (162) (111) (131) (81) (65) (50) (69) (101) (89) (80) (123) (102) (116) (129) (129) (121) (123) (115)
Quarter
Number of deals
0
1,000
2,000
3,000
4,000
5,000
6,000
Q4(101)
Q3(121)
Q1(85)
Q2(82)
2,330
3PwC MoneyTreeTM India Report–Q2 ’13

Investments by industry Q2 ’12, Q1 ’13 and Q2 ’13
The manufacturing sector received the highest level of PE investments this quarter, attracting 796 million USD from six deals and constituting 34% of the total investments. A couple of large deals have contributed to investment growth in this sector, however,the sector has seen a drop in volume of 25% and 14% as compared to Q1 ’13 and Q2 ’12 respectively.
While deals in the manufacturing sector have picked up traction in the past few months, two large deals namely, KKR’s acquisition of a controlling stake in Alliance Tire from a Warburg Pincus affiliate and Baring Asia’s investment in Lafarge, have led the private equity activity within the sector. Stressed balance sheets have been a major contributing factor for driving manufacturing companies towards private equity funding.
Bimal Tanna, Leader, Manufacturing, PwC India
The IT and ITeS sector, yet again has emerged as the leader in terms of volume with 31 deals worth 453 million USD in Q2 ’13. In terms of value, the sector ranks second (manufacturing stands first). The value of investments has shown a three-fold growth despite a 16% drop in volume as compared to the previous quarter. And, when analysed for the same period last year, the sector has shown a growth of 12% in value, while the number of deals has declined by 34%.
During the quarter, the information technology (IT) sector witnessed a large spurt in the overall value of PE deals. Traditionally, the IT and ITeS sectors have been extremely lucrative for private equity investments. The sector has remained fragmented over the last few years, and so has the inflow of investments. Hence, consolidation may be in the offing in the near future. New destinations, such as Chennai and the NCR region, are becoming attractive propositions for private equity investors. While the Indian rupee depreciation is likely to have a favourable impact on the IT and the ITeS segments, the sudden and large spurt in deals will only add a fillip to the otherwise gloomy global market.
Sandeep Ladda, Leader, Technology, PwC India
The BFSI sector had the highest value of investments in the previous quarter. However, in this quarter, there has been a considerable drop in investments—from 264 million USD across 10 deals in the preceding quarter to 138 million USD from five in this quarter. It declined 47% in value and 50% in volume. Even when compared to the same quarter last year, i.e., Q2 ’12, there has been a drop of 60% in the value of investments and 60% in the number of deals.
The energy sector witnessed the third highest investment in terms of value, with investments worth 235 million USD from four deals as compared to 159 million USD from two deals in the previous quarter and 299 million USD from six deals in Q2 ’12.
The healthcare and life sciences sector has shown a 66% growth in value quarter over quarter. It rose from 130 million USD across 12 deals to 215 million USD across 11 deals. However, when compared to Q2 ’12, the value and volume of deals have fallen by 12 and 15%, respectively.
We see a high level of interest amongst PE players in Indian medical technology companies, as they promise innovative low-cost products, which have the potential to be marketed in other emerging economies of the world. Currently, most of the companies are in their early stage, but given the overall growth of the healthcare sector, they can be ready for their next level of growth through PE investments in less than two years. The sector is expected to hit a market size of 14 billion USD by 2020.
Investments into the healthcare sector will continue to grow based on the robust performance of both the established as well as the newer players. Exits in the form of secondary sale have also brought in a slew of new PE investors into the sector.
Dr. Rana Mehta, Leader, Healthcare, PwC India
PwC4

The media and entertainment sector, which had negligible investments in previous quarters, has seen a spurt, garnering an investment of 180 million USD from four deals this quarter.
The engineering and construction and the FMCG sectors have also shown spurts in the value of investments. The engineering and construction sector recorded a single deal worth 84 million USD this quarter, a 47% increase in value vis-à-vis the preceding quarter. For the same period last year, the sector had not witnessed even a single deal. The FMCG sector saw a 50% jump in investments this quarter. It increased from 43 million USD (in a single deal) in Q1 ’13 to 65 million USD from two deals. As compared to Q2 ’12, the sector witnessed growth of 2.5 times in value with one additional deal.
Both the education and shipping and logistics sectors have reported significant declines in the values and volumes of deals in this quarter as compared to Q1 ’13 and Q2 ’12.
Note: ‘Others’ include other services, textiles and garments, travel and transport, hotels and resorts, sports and fitness, advertising and marketing, telecom, agri-business, food and beverages, retail, diversified businesses and mining and minerals.
Data provided by Venture Intelligence
Manufacturing
Education
Media and entertainment
Engineering and construction
Information technology (IT)and IT-enabled services
Banking, financial servicesand insurance
Others
Energy
Fast-moving consumergoods (FMCG)
Shipping and logistics
800 900500 700400 600300200100
Healthcare and life sciences
6
13
4
0
1
4
3
17
3747
2
12
4
1
33
2
5
31
4
1
2
1
14
5
13
1
6
4
11
10
87
0# of
deals (In million USD) All results rounded.
$143$403
$453
$299$159
$235
$244$130
$215
$5$2
$180
$344$264
$138
$0$57
$84
$25$43
$65
$130$93
$38
$68$22
$6
$414$77
$119
$796$65
$47
Q2 2012
Q1 2013
Q2 2013
5PwC MoneyTreeTM India Report–Q2 ’13

Investments by stage of development Q2 ’12, Q1 ’13 and Q2 ’13
In Q2 ’13, private equity investments in the buyout stage recorded the highest value, seeing 740 million USD from three deals, a significant rise compared with the previous quarter, which saw 64 million USD across three deals. Compared to the same period last year, there was an increase of 9% in investments despite a 57% drop in the number of deals.
The late-stage deals ranked second both in terms of value and volume of deals with an investment of 666 million USD from 20 deals, a two-fold growth in value and an 11% increase in the number of deals. As compared to Q2 ’12, there was a 15% increase in value despite a 26% drop in volume.
The growth-stage deals, with investments worth 510 million USD from 17 deals, stand third in terms of value. This represents an increase of more than 100% in value despite a 19% decrease in the number of deals as compared to the preceding quarter.
Private investment in public equity (PIPE) deals, with an investment valued at 311 million USD, have also shown an increase of 67% in value and 22% in volume this quarter. When compared to the same period last year, i.e., Q2 ’12, they show an increase of 24% in value with one less deal.
The early-stage category has the highest number of deals in this quarter (30 deals worth 102 million USD). The volume of deals in the early stage is over 36% of the total deal volume. A growth of about 17% in value with the same number of deals as compared to the previous quarter has been reported. Compared to Q2 ’12, there has been a decline of 4% in value and 39% in volume.
This quarter witnessed one deal in the pre-IPO stage worth one million USD.
# ofdeals
(In million USD) All results rounded.
Other
Pre-IPO
Early
PIPE
Growth
Late
Buyout
$223
$102
$0
$106
$30$1
$666
$510
$189
733
271820
192117
129
11
493030
121
020
800200 300 400 500 600 7001000
$274
$311
$250
$57
$64
Q2 2012
Q1 2013
Q2 2013
$677
$740
$0
$311
$578
$87
$186
Note: Definitions for the stage of development categories can be found in the ‘definitions’ section of this report. Growth stage in the above graph includes both growth and growth-PE stages.
Data provided by Venture Intelligence
PwC6

Investments by region Q2 ’12, Q1 ’13 and Q2 ’13
Mumbai is back at the top this quarter, recording the highest level of funding at 1.19 billion USD, more than 50% of the total PE investments. Even in terms of volume, Mumbai, with 20 deals, has the majority share at 24%. As compared to Q1 ’13, the investments have shown nearly a 10-fold increase and one additional deal. Even when compared to the same period last year, the investments have doubled despite a 13% drop in the number of deals.
Even though the National Capital Region (NCR) has retained its place in the top three regions on the basis of the number of deals (16 deals), the volume has fallen by 6% and 24% as compared to Q1 ’13 and Q2 ’12 respectively. However, the value of investments has shown a 95% growth this quarter as compared to the preceding one.
Chennai received the third highest value in funding, seeing 333 million USD from six deals as compared to 186 million USD from 11 deals in Q1 ’13, an 80% increase. As compared to investments in the same quarter last year (i.e, 76 million USD from eight deals), the investments in this quarter have shown a four-fold growth in value, but a 25% drop in the volume of deals.
Private equity investments in Bangalore, too, have shown an increase of 36% in value and 17% in the volume of deals, as compared to the prior quarter. However, when compared to Q2 ’12, investments have shown a significant decline of 61% and 52% in value and volume, respectively.
Hyderabad, which emerged as the leader in the previous quarter, showed a drop of 25% in investments, going from 222 million USD across seven deals in the previous quarter to 166 million USD across six deals in the current quarter. However, compared to the same period last year, investments have shown a five-fold growth with double the number of deals.
Others
Pune
Bangalore
Hyderabad
Chennai
NCR
Mumbai
$26
$306
$1
$222
$641
$33
$88
$120
$359
$370
$166
$186
$2
$122
Q2 2012
Q1 2013
Q2 2013
# ofdeals
(In million USD) All results rounded.
23
19
20
21
17
16
8
11
6
3
7
6
29
12
14
3
3
3
28
16
17
0 200 400 600 800 1000 1200 1400
$1193
$124
$190
$76
$333
$563
$242
Note: National Capital Region (NCR) includes Delhi, Gurgaon and Noida.
Data provided by Venture Intelligence
7PwC MoneyTreeTM India Report–Q2 ’13

Top 20 PE deals Q2 ’13
The top 20 deals comprised 84% of the total deal value in Q2 ’13. The top three deals constituted over 50% of the total top 20 deal value. About 87% of the deals in this quarter are below the value of 50 million USD.
Company Industry Investor(s) Deal amount (In million USD)
Alliance Tire Group Manufacturing KKR 460
CSS Group IT and ITeS Partners Group, Others 270
Lafarge India Manufacturing Baring Asia 257
ReNew Wind Power Energy Goldman Sachs 135
Den Networks Media and entertainment Goldman Sachs 110
Fortis Healthcare Healthcare and life sciences IFC 100
JM Financial Products BFSI Old Lane 100
NSL Renewable Power Energy IFC, DEG, FE Clean Energy, ADB, Proparco, Asia Clean Energy, Others
90
TRIL Roads Engineering and construction Tata Capital 84
Snapdeal.com IT and ITeS Kalaari Capital, Intel Capital, Nexus Ventures, Bessemer, Samaa Capital, Ru-Net Holdings, Others
50
Tata Sky Media and entertainment Tata Capital 50
CavinKare FMCG ChrysCapital 45
Milltec Group Agri-business Multiples PE 43
Global Hospitals Healthcare and life sciences IFC, Sabre Capital 42
Fractal Analytics IT and ITeS TA Associates 25
TTK Prestige* Manufacturing Cartica Capital 22
Dabur India FMCG Baring India 21
BPL Medical Technologies Healthcare and life sciences Goldman Sachs 20
TTK Prestige* Manufacturing Cartica Capital 19
Parag Milk Agri-business IFC 17
*TTK Prestige received two separate rounds of financing from Cartica Capital this quarter.
Data provided by Venture Intelligence
PwC8

3. Analysis of PE exits
Total PE exitsThe exit activity in this quarter has doubled when compared to the previous one. In Q2 ’13, PE exits were worth 1.78 billion USD from 30 deals as compared to 884 million USD from 29 deals in Q1 ’13.
Compared to the same period last year, the exits have shown a more than five-fold growth in value and an increase of 15% in volume. In Q2 ’12, there were 26 exits worth 321 million USD.
The majority of the exits in this quarter came from the IT and ITeS and manufacturing sectors which together contributed around 57% of the total exit value and 53% of the total volume.
In this quarter, about 45% of the exits by value have been through secondary sale (798 million USD from six deals). Exits through public market sale reported the next highest share, with 28% of the exits valued at 498 million USD from nine deals.
Q3
’04 ’13’05 ’06 ’07 ’08 ’09 ’10 ’11 ’12
In m
illio
n U
SD
Q4 Q1 Q3 Q4Q2 Q1 Q3 Q4Q2 Q1 Q3 Q4Q2 Q1 Q3 Q4Q2 Q1 Q3 Q4Q2 Q1 Q3 Q4Q2 Q1 Q3 Q4 Q1Q2 Q2(5) (8) (9) (7) (12) (14) (10) (13) (11) (14) (23) (25) (31) (23) (23) (12) (11) (10) (13) (30) (30) (25) (42) (34) (41) (45) (26) (25) (30) (24) (40) (26)
Quarter
Number of deals
0
500
1,000
1,500
2,000
2,500
3,000
3,500
Q4(30)
Q3(30)
Q1(29)
Q2(30)
60 84
239
118265
616
424
523
665
483401
1,130
274 176260
399
600578
954
1,164
2,953
843
1,139
407
1,281
474
67
321
1,442
42
1,782
1,825
340
663
171
884
Data provided by Venture Intelligence
9PwC MoneyTreeTM India Report–Q2 ’13

Exits by industry Q2 ’12, Q1 ’13 and Q2 ’13
The IT and ITeS sector tops the list of PE exits, in terms of both value and volume, with ten deals worth 539 million USD. This constitutes 30% of the total deal exit value. Compared to the preceding quarter, the exits in this sector have jumped significantly from 25 million USD from four deals to 539 million USD from ten deals. The story remains the same even when compared against the same period last year. In Q2 ’12, the exits were worth 43 million USD from five deals.
In terms of exit value, the manufacturing sector ranks second with 472 million USD from six deals in this quarter. The exits in the previous quarter were a meagre 14 million USD from two deals. Compared to the same period last year, the exits have shown a more than four-fold growth despite a 25% decline in the volume of deals.
The energy, education, engineering and construction sectors also have witnessed a spurt in the exit value in the present quarter. The energy sector saw a single exit valued at 130 million USD resulting in a growth of 36% vis-à-vis Q1 ’13. The education, engineering and construction sectors, which did not see any exits in the previous quarter, had exits worth 120 million USD (one deal) and 96 million USD (two deals), respectively.
The BFSI sector witnessed an 18% drop in exit value along with a 50% drop in volume, from 391 million USD (six deals) in Q1 ’13 to 322 million USD (three deals) in this quarter.
The healthcare and life sciences sector saw a 86% drop in the exit value this quarter, from 193 million USD (two deals) in Q1 ’13 to 26 million USD (two deals) in Q2 ’13.
Notes: ‘Others’ include shipping and logistics, media and entertainment, textile and garments, agri-business, other services, retail and hotels and resorts.
NA indicates this information has not been publicly disclosed.
Data provided by Venture Intelligence
$130
$1
$28
$102
$39
$19
NA
$120
$96
$96
$0
$26
$166
# ofdeals
(In million USD) All results rounded.
5
4
10
8
2
6
1
6
3
2
5
1
2
1
1
2
0
2
1
2
2
5
9
5
Others
Healthcare andlife sciences
Engineering andconstruction
Education
Energy
Banking,financial services
and insurance
Manufacturing
Informationtechnology (IT) andIT-enabled services
0 100 200 300 400 500 600
$539
$25
$14
NA
$322
$43
$193
$391
$472
$88
$78
Q2 2012
Q1 2013
Q2 2013
PwC10

Exits by type Q2 ’12, Q1 ’13 and Q2 ’13
The preferred modes of exits in this quarter have been through public market sale (nine exits) and strategic sale (seven exits), constituting 53% of the total exit volume. The other modes were secondary sale (six exits), buyback (six exits) and two exits through IPO.
In Q2 ’13, secondary sale fetched the highest exit value, worth 798 million USD (about 45% of the total exit value). As compared to Q1 ’13, the exit value has grown more than ten-fold, with a 50% increase in the number of deals (from four deals in Q1 ’13 to six deals in this quarter).
Public market sale ranked second in terms of exit value, worth 498 million USD. It represents about 28% of the total exit value. However, as compared to the prior quarter, public market exit value has fallen by 19%, while the volume of deals remained the same (nine deals).
The exits through strategic sale, in this quarter, has shown a drop of 6% in value and 13% in volume as compared to Q1 ’13. However, as against the same period last year, the exits through strategic sale have grown by 28% in value with one additional deal this quarter.
There has been a spurt in both buyback and IPO exits. Buyback exits have gone up from 28 million USD in Q1 ’13 to 202 million USD this quarter. Similarly, the IPO exits have also shown an increase, from 28 million USD in the previous quarter to 151 million USD in Q2 ’13.
# ofdeals
(In million USD) All results rounded.
Strategic sale
IPO
Buyback
Public market sale
Secondary sale
$56
$133
$28
$105
$76
$104$612
$498
$202
$142
746
499
426
562
687
1,000
Q2 2012
Q1 2013
Q2 2013
800600400
$151
2000
$798
$13
$43
$28
Note: Definitions of the types of exit can be found in the ‘definitions’ section of this report.
Data provided by Venture Intelligence
11PwC MoneyTreeTM India Report–Q2 ’13

Top five PE exits Q2 ’13
The top two exits comprised 32% and the top five constituted close to 51% of the total exit value in Q2 ’13.
Company Industry PE firm(s)Deal amount
(In million USD)
Shriram Transport Finance
BFSI TPG Capital 301
CSS Group IT and ITeS SAIF, Goldman Sachs, Sierra Ventures 270
JustDial IT and ITeS Sequoia Capital India, SAIF, Tiger Global, SAP Ventures
130
Havells India Energy Warburg Pincus 130
TRIL Roads Engineering and construction
Actis 84
Data provided by Venture Intelligence
PwC12

4. Active PE firms
Based on the volume of deals, Nexus Ventures and the International Finance Corporation (IFC) have emerged as the most active investors for Q2 ’13.
The most active PE investors in the second quarter of 2013 include:
* Number of deals includes both single and co-investments by private equity firms. In cases where two or more firms have invested in a single deal, it is accounted as one deal for each of the firms.
Data provided by Venture Intelligence
Investors Numbers of deals*
Nexus Ventures 6
IFC 6
Kae Capital 4
Blume Ventures 4
Mayfield 3
Accel India 3
Goldman Sachs 3
SIDBI VC 3
German Investment and Development Corporation (DEG)
2
Omnivore Partners 2
Fidelity Growth Partners 2
Helion Ventures 2
Catamaran Ventures 2
Asian Healthcare Fund 2
NEA 2
Proparco 2
Norwest Venture Partners 2
Baring India 2
Cartica Capital 2
Tata Capital 2
SAIF 2
IndiaVenture 2
Intel Capital 2
Inventus Capital Partners 2
13PwC MoneyTreeTM India Report–Q2 ’13

5. Sector focus: IT and ITeS
Total PE investmentsThe IT and ITeS sector witnessed a radical increase in the investment value in Q2 ’13 despite a 16% drop in the volume of deals. In this quarter, the PE investments in the sector grew three-fold, from 143 million USD (37 deals) in Q1 ’13 to 453 million USD (31 deals).
As compared to the same period last year, the PE investments in this sector have gone up by 12% despite reporting a sizeable 34% decrease in the number of deals
(from 47 to 31). The investments in Q2 ’12 totalled 403 million USD from 47 deals.
As in the previous quarters, the IT and ITeS sector saw a lot of early-stage deals with smaller values. This pattern continued in Q2 ’13 as well. The average early-stage deal value for the last two quarters has been in the range of three to four million USD.
’04 ’13’05 ’06 ’07 ’08 ’09 ’10 ’11 ’12
Q3
Valu
e in
mill
ion
US
D
Q4 Q1 Q3 Q4Q2 Q1 Q3 Q4Q2 Q1 Q3 Q4Q2 Q1 Q3 Q4Q2 Q1 Q3 Q4Q2 Q1 Q3 Q4Q2 Q1 Q3 Q4 Q1Q2
95
537
24195
49 55 86212
850
364
181
646
362
431
164
625
327
504
235
390
106 145
261
659
346
514
403
2,404
173
453
302
346
311
67143107
Q2Quarter
0
700
1,400
2,100
2,800
3,500
Q1Q3 Q4 Q2
Data provided by Venture Intelligence
PwC14

Growth in IT and ITeS PE funding compared with growth in total PE fundingIn the last decade, a comparison between quarter-on-quarter growth rates of the IT and ITeS PE investments and the total PE investments reflects that the sector funding has outpaced growth of the total PE funding in most quarters. In this quarter, the investments at both the overall and the IT and ITeS sector level have improved significantly, with the IT and ITeS sector witnessing a much higher growth rate.
Per
cent
age
chan
ge (q
-o-q
)
-200
-100
0
100
200
300
400
500
600
Q2
2013
Q1
2013
Q4
2012
Q3
2012
Q2
2012
Q1
2012
Q4
2011
Q3
2011
Q2
2011
Q1
2011
Q4
2010
Q3
2010
Q2
2010
Q1
2010
Q4
2009
Q3
2009
Q2
2009
Q1
2009
Q4
2008
Q3
2008
Q2
2008
Q1
2008
Q4
2007
Q3
2007
Q2
2007
Q1
2007
Q4
2006
Q3
2006
Q2
2006
Q1
2006
Q4
2005
Q3
2005
Q2
2005
Q1
2005
Q4
2004
Q3
2004
IT and ITeS growth Total growth
Data provided by Venture Intelligence
Sector focus: IT and ITeS
15PwC MoneyTreeTM India Report–Q2 ’13

Investments by stage of development Q2 ’12, Q1 ’13 and Q2 ’13
The IT and ITeS sector, as usual, witnessed a large volume of deals, but with relatively low value. In most instances in the last decade, the average deal size for this sector has been in the range of 10 to 15 million USD.
As many of the IT and ITeS companies do not require a large amount of start-up money, we witness the majority of low-value deals occurring in the early stage. In this quarter, i.e., Q2 ’13, too, there are 25 deals worth 94 million USD in the early stage, with an average deal size of around 3.7 million USD. In the previous quarter, the sector had seen an investment of 80 million USD in the early stage from 25 deals.
The sector witnessed a large buyout deal worth 270 million USD, the highest investment for the sector in this quarter.
Growth-stage deals saw investments of 75 million USD from two deals in this quarter. This represents a 50% increase in value despite a 78% decline in volume as compared to the preceding quarter.
PIPE and late-stage deals saw investments of nine million USD (from two deals) and nine million USD (from a single deal) in this quarter, respectively
The sector did not witness any investment in the pre-IPO stage in this quarter.
Pre-IPO
Late
PIPE
Growth
Early
Buyout
$50
$0
$9
$117
$0
$71
$0$0
$14
$6
$94
$0
Q2 2012
Q1 2013
Q2 2013
# ofdeals
(In million USD) All results rounded.
1
0
1
32
25
25
8
9
2
0
0
2
6
3
1
0
0
0
0 50 100 150 200 250 300
$270
$0
$80
$123
$75
$93
Data provided by Venture Intelligence
Sector focus: IT and ITeS
PwC16
Investments by region Q2 ’12, Q1 ’13 and Q2 ’13
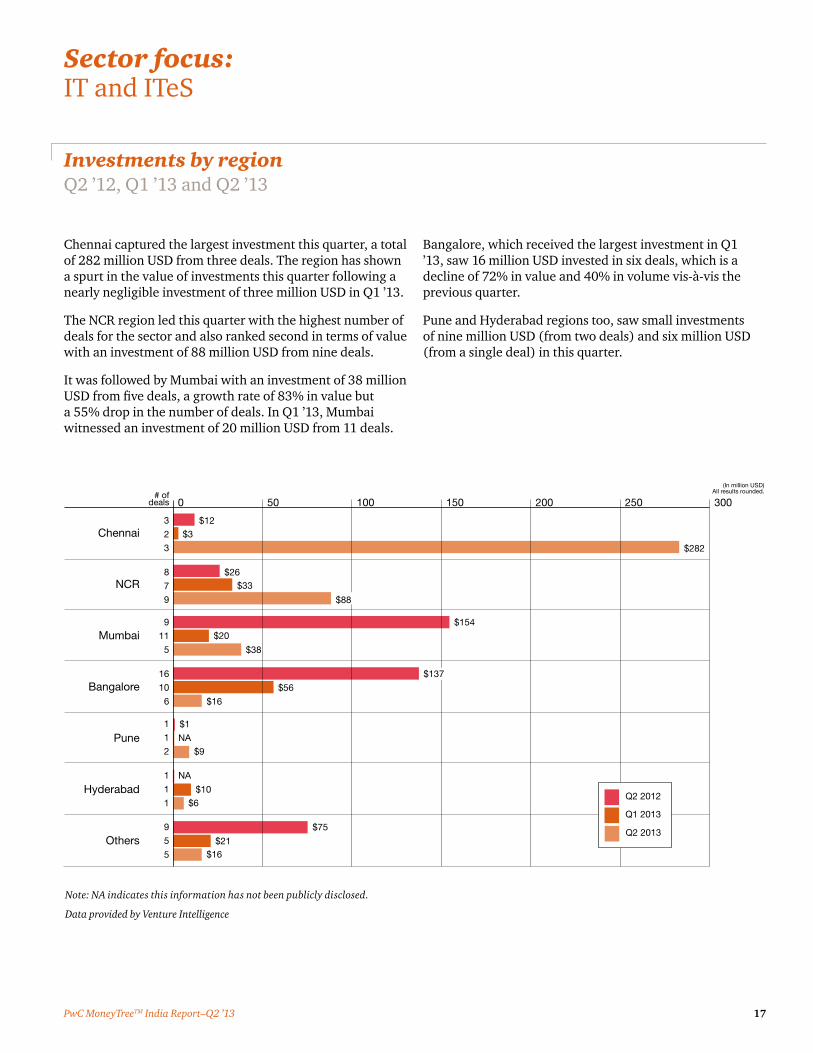
Chennai captured the largest investment this quarter, a total of 282 million USD from three deals. The region has shown a spurt in the value of investments this quarter following a nearly negligible investment of three million USD in Q1 ’13.
The NCR region led this quarter with the highest number of deals for the sector and also ranked second in terms of value with an investment of 88 million USD from nine deals.
It was followed by Mumbai with an investment of 38 million USD from five deals, a growth rate of 83% in value but a 55% drop in the number of deals. In Q1 ’13, Mumbai witnessed an investment of 20 million USD from 11 deals.
Bangalore, which received the largest investment in Q1 ’13, saw 16 million USD invested in six deals, which is a decline of 72% in value and 40% in volume vis-à-vis the previous quarter.
Pune and Hyderabad regions too, saw small investments of nine million USD (from two deals) and six million USD (from a single deal) in this quarter.
Others
Hyderabad
Pune
Bangalore
Mumbai
NCR
Chennai
$20
$6
$16
$1
NA
$26
$56
NA
$9
$137
$88
$10
$75
$21$16
Q2 2012
Q1 2013
Q2 2013
# ofdeals
(In million USD) All results rounded.
3
2
3
8
7
9
9
11
5
16
10
6
1
1
2
1
1
1
9
5
5
0 50 100 150 200 250 300
$282
$3
$33
$154
$38
$12
Note: NA indicates this information has not been publicly disclosed.
Data provided by Venture Intelligence
Sector focus: IT and ITeS
17PwC MoneyTreeTM India Report–Q2 ’13

Investments by subsegments Q2 ’12, Q1 ’13 and Q2 ’13
In this quarter, IT services recorded the highest investment amongst the subsegments, with a total of 284 million USD invested in four deals. In the preceding quarter, the IT services subsegment had received a meagre investment of three million USD from a single deal.
The online services segment received the second highest level of investment worth 115 million USD from 19 deals, the highest in terms of volume. The value of deals has shown a significant growth rate of 56% with just one additional deal this quarter vis-à-vis Q1 ’13.
The ITeS-BPO and the enterprise software subsegments received investments of 25 million USD (from a single deal) and 23 million USD (four deals), respectively. The enterprise software segment saw a drop of 34% in value and 60% in volume.
Investments in the mobile services subsegment fell by more than 89% in value and 60% in volume, from 19 million USD (five deals) in Q1 ’13 to two million USD (two deals) in this quarter. The other key subsegments, such as IT products and networking technology, have not seen any investment in the last two quarters.
$23
$7
$7
$249
$0
$15
$19
$2
$115
$2
$0
$34
$0
$0
$12
$8
$4
# ofdeals
(In million USD) All results rounded.
3
1
4
29
18
19
1
1
1
4
10
4
5
5
2
2
0
0
0
0
0
3
2
1
Others
Networkingtechnology
IT products
Mobile services
Enterprise software
ITeS - BPO
Online services
IT services
0 50 100 150 200 250 300
$284
$3
$74
$25
$25
$0
Q2 2012
Q1 2013
Q2 2013
$93
Data provided by Venture Intelligence
Sector focus: IT and ITeS
PwC18

PE exits in the sector Q2 ’12, Q1 ’13 and Q2 ’13
The IT and ITeS sector saw 10 exits worth 539 million USD in this quarter. The value of exits grew significantly from a total of 25 million USD across four deals in the prior quarter. For the same period last year, i.e., Q2 ’12, the sector had five exits worth 43 million USD.
The majority of exits in this sector and in this quarter are through strategic sale. Six out of the 10 exits were through strategic sale and valued at 121 million USD. The IPO
stage, too, witnessed a single exit worth 130 million USD. There were two exits for 18 million USD through public market sale.
The IT services subsegment witnessed three exits worth 287 million USD in this quarter, followed by online services with an exit value of 245 million USD from five deals.
’04 ’13’05 ’06 ’07 ’08 ’09 ’10 ’11 ’12
Q3
In m
illio
n U
SD
Q4 Q1 Q3 Q4Q2 Q1 Q3 Q4Q2 Q1 Q3 Q4Q2 Q1 Q3 Q4Q2 Q1 Q3 Q4Q2 Q1 Q3 Q4Q2 Q1 Q3 Q4 Q1Q2
18 40 26 3424
596
55
309
377
4462
177
646 12
52
224
1955
140
1810777
157
1,733
68
169
43 51 72
539
79
577
15 25
153
Q2(2) (6) (4) (3) (3) (6) (4) (4) (6) (4) (4) (11) (6) (6) (4) (4) (2) (3) (4) (2) (8) (4) (9) (5) (2) (9) (4) (6) (4) (4) (10) (5)
Quarter
Number of deals
0
1,000
2,000
Q1(4)
Q3(4)
Q4(4)
Q2(10)
Data provided by Venture Intelligence
Sector focus: IT and ITeS
19PwC MoneyTreeTM India Report–Q2 ’13

Definitions
Stages of development
Early stage: This refers to the first or second round of institutional investments in companies that adhere to the following:
• Less than five years old
• Not part of a larger business group
• Investment is less than 20 million USD
Growth stage: This refers to investments of less than 20 million USD. Also, investments meeting the following criteria are considered in the growth stage:
• Third or fourth round funding of institutional investments
• First or second round of institutional investments for companies that are more than five years old and less than 10 years old or spin-outs from larger businesses
Growth stage—PE: This includes the following:
• First or second round of investments worth 20 million USD or more
• Third or fourth round funding for companies that are more than five years old and less than 10 years old or subsidiaries or spin-outs of larger businesses
• Fifth or sixth rounds of institutional investments
Late stage: This comprises the following:
• Investment in companies that are a decade old
• Seventh or later rounds of institutional investments
PIPEs: The following constitute as PIPEs:
• PE investments in publicly listed companies via preferential allotments or private placements
• Acquisition of shares by PE firms via the secondary market
Buyout:
• This is an acquisition of controlling stake via purchase of stakes of existing shareholders.
Buyout—large:
• This includes buyout deals of 100 million USD or more in value.
Other:
• This includes PE investments in special purpose vehicle (SPV) or project-level investments.
Types of PE exits
Buyback:
• This includes purchase of the PE or VC investors’ equity stakes by either the investee company or its founders or promoters.
Strategic sale:
• This includes sale of the PE or VC investors’ equity stakes (or the entire investee company itself) to a third party company (which is typically a larger company in the same sector).
Secondary sale:
• Any purchase of the PE or VC investors’ equity stakes by another PE or VC investors constitutes secondary sale.
Public market sale:
• This includes the sale of the PE or VC investors’ equity stakes in a listed company through the public market.
Initial public offering (IPO):
• This includes the sale of PE or VC investors’ equity stake in an unlisted company through its first public offering of stock.
PwC20

Contacts
21PwC MoneyTreeTM India Report–Q2 ’13
www.pwc.com/globalmoneytreewww.pwc.in
Sandeep Ladda Leader, Technology [email protected]
Sanjeev Krishan Leader, Private Equity [email protected]
This report was researched and written by the following:
Pradyumna Sahu Director, Technology [email protected]
Rajendran C Knowledge Manager, Technology [email protected]
Sibi SathyanKnowledge Manager, Private Equity [email protected]

pwc.com ©2013 PwC. All rights reserved. PwC refers to the PwC network and/or one or more of its member firms, each of which is a separate legal entity. Please see pwc.com/structure for further details. This content is for general information purposes only, and should not be used as a substitute for consultation with professional advisors. BS-14-0021
About PwC’s Technology InstituteThe Technology Institute is PwC’s global research network that studies the business of technology and the technology of business with the purpose of creating thought leadership that offers both fact-based analysis and experience-based perspectives. Technology Institute insights and viewpoints originate from active collaboration between our professionals across the globe and their first-hand experiences working in and with the technology industry. For more information please contact Raman Chitkara, Global Technology Industry Leader at [email protected]
About PwCPwC firms help organisations and individuals create the value they are looking for. We are a network of firms in 158 countries with close to 180,000 people who are committed to delivering quality in assurance, tax and advisory services. Tell us what matters to you and find out more by visiting us at www.pwc.com.
PricewaterhouseCoopers and Venture Intelligence have taken responsible steps to ensure that the information contained in the MoneyTreeTM report has been obtained from reliable sources. However, neither of the parties can warrant the ultimate validity of the data obtained. Results are updated periodically. Therefore, all data is subject to change at any time. Before making any decision or taking any action, you should consult a competent professional adviser.