pricewaterhousecoopers india pvt ltd … india pvt ltd moneytreetm india report q2 2017 technology...
TRANSCRIPT

www.pwc.com/globalmoneytree www.pwc.in
PricewaterhouseCoopers India Pvt Ltd
MoneyTreeTM India Report Q2 2017
Technology Institute
This report provides summary results of Q2 ’16, Q1 ’17, and Q2 ’17.
Data provided by Venture Intelligence

PwC MoneyTree India – Q2 2017 2
Table of contents
1. Overview 3
2. Analysis of PE investments 5 Total equity investments in PE-backed companies 5 Investments by industry 6 Investments by stage of development 8 Investments by region 9 Top 20 PE deals 10
3. Analysis of PE exits 11 Total PE exits 11 Exits by industry 12 Exits by type 13 Top five PE exits 14
4. Active PE firms 15
5. Sector focus – IT & ITeS sector 16 Total PE investments 17 Investments by stage of development 18 Investments by region 19 Investments by subsector 20 PE exits in the sector 21
Definitions 22

PwC MoneyTree India – Q2 2017 3
1. Overview
Private equity (PE) funds continued to remain upbeat in the second quarter of 2017 despite a slight decline in activity as compared to the first quarter. This quarter witnessed PE investments worth 6.3 billion USD across 155 deals, a 13% decline in deal value as compared to the previous quarter. However, there was a 51% increase in deal value as compared to the same period last year.
Despite a decline in terms of volume as compared to the second quarter of 2016, PE funds demonstrated renewed confidence in the Technology space with investments worth 2.7 billion USD, a 93% increase over the same period last year. This sector accounted for over 40% of the total investment value this quarter, having recorded the largest deal—that is, Softbank Corporation’s 1.4-billion USD investment in One97 Communications. Technology was followed by the Banking & Financial services sector, which recorded investments worth 1.5 billion USD—a more than three-fold increase compared to the same period last year and an 18% increase over the previous quarter. Insurance accounted for a little under 40% of the investment value within the Financial services space, with non-banking financial companies (NBFCs)/microfinance institutions (MFIs) continuing to see significant activity.
Other sectors seeing increased investment activity were Energy, Logistics and Healthcare. Within the Energy space, renewables continued to attract investments, with 0.5 billion USD invested across six deals. The investment value in the Logistics space doubled over the last quarter, mainly on the back of Canada Pension Plan Investment Board’s 0.5 billion USD investment in Indospace Core. The Healthcare sector recorded a 67% increase in value as compared to the same period last year, with 0.4 billion USD invested across 10 deals.
In terms of stage of funding, late-stage funding continued to dominate investment activity with investments worth 3.6 billion USD, accounting for 57% of the total investment value this quarter. This was followed by buyout deals amounting to 0.9 billion USD, a 45% increase over the previous quarter. With valuations at an all-time high, PIPE deals witnessed a 76% decline in terms of value over the previous quarter.
This quarter also witnessed significant exit activity, recording 61 exits worth 2.8 billion USD—that is, double the exit value for the same period last year. Exits in the Technology space increased more than six-fold over the second quarter of 2016, amounting to 0.7 billion USD. This was closely followed by the Financial services and Healthcare sectors with exits worth 0.6 billion USD each.
PwC MoneyTree India – Q2 2017 4
The first half of 2017 witnessed the highest activity in over a decade, with investments worth 13.6 billion USD, emphasising continued investor confidence in India’s growth prospects. However, with the roll-out of the Goods and Services Tax (GST), the investment landscape may be impacted while investors assess the scenario and possibly proceed at a more cautious pace.
Overall, the PE investment scene remains intact, with both foreign as well as domestic players continuing to tap into opportunities in India.
Sanjeev Krishan Leader, Private Equity and Transaction Services PwC India
PwC MoneyTree India – Q2 2017 5
2. Analysis of PE investments
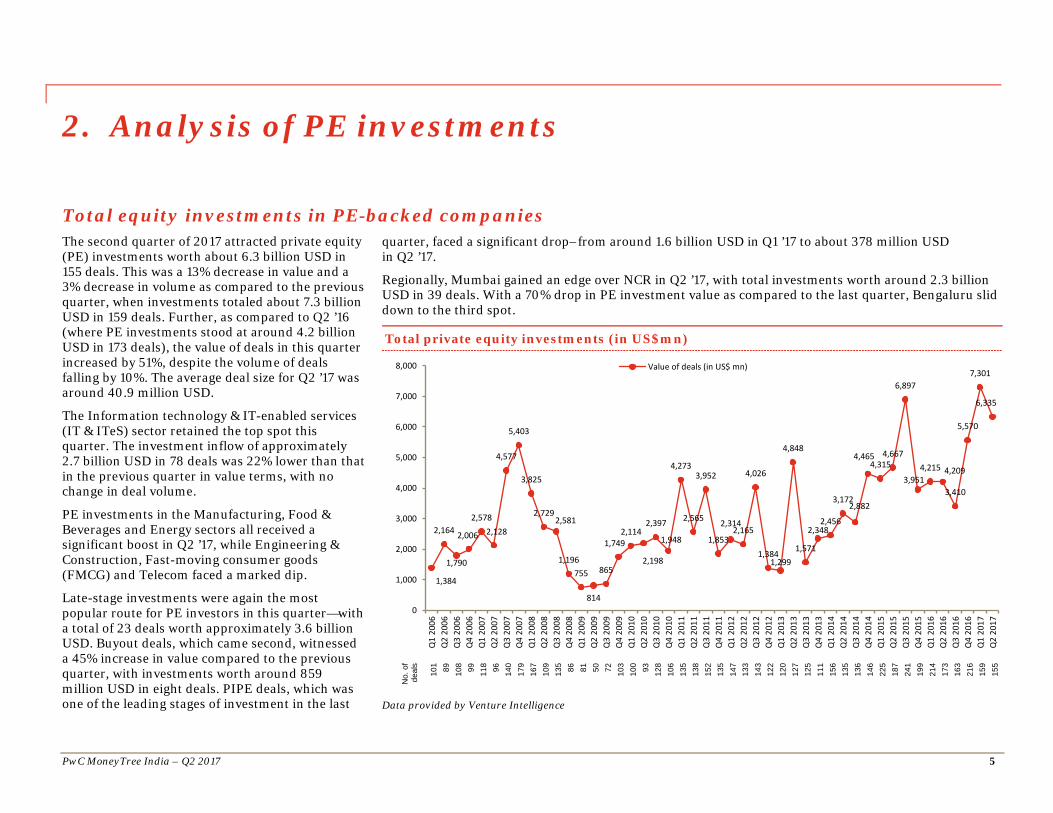
Total equity investments in PE-backed companies The second quarter of 2017 attracted private equity (PE) investments worth about 6.3 billion USD in 155 deals. This was a 13% decrease in value and a 3% decrease in volume as compared to the previous quarter, when investments totaled about 7.3 billion USD in 159 deals. Further, as compared to Q2 ’16 (where PE investments stood at around 4.2 billion USD in 173 deals), the value of deals in this quarter increased by 51%, despite the volume of deals falling by 10%. The average deal size for Q2 ’17 was around 40.9 million USD.
The Information technology & IT-enabled services (IT & ITeS) sector retained the top spot this quarter. The investment inflow of approximately 2.7 billion USD in 78 deals was 22% lower than that in the previous quarter in value terms, with no change in deal volume.
PE investments in the Manufacturing, Food & Beverages and Energy sectors all received a significant boost in Q2 ’17, while Engineering & Construction, Fast-moving consumer goods (FMCG) and Telecom faced a marked dip.
Late-stage investments were again the most popular route for PE investors in this quarter—with a total of 23 deals worth approximately 3.6 billion USD. Buyout deals, which came second, witnessed a 45% increase in value compared to the previous quarter, with investments worth around 859 million USD in eight deals. PIPE deals, which was one of the leading stages of investment in the last
quarter, faced a significant drop–from around 1.6 billion USD in Q1 ’17 to about 378 million USD in Q2 ’17.
Regionally, Mumbai gained an edge over NCR in Q2 ’17, with total investments worth around 2.3 billion USD in 39 deals. With a 70% drop in PE investment value as compared to the last quarter, Bengaluru slid down to the third spot.
Total private equity investments (in US$mn)
No.
of
deal
s
101 89
108 99
118 96
140
179
167
109
135 86
81
50
72
103
100 93
128
106
135
138
152
135
147
133
143
122
120
127
125
111
156
135
136
146
225
187
241
199
214
173
163
216
159
155
Data provided by Venture Intelligence
1,384
2,164
1,790
2,006
2,5782,128
4,577
5,403
3,825
2,7292,581
1,196755
814
865
1,7492,114
2,198
2,397
1,948
4,273
2,565
3,952
1,853
2,3142,165
4,026
1,3841,299
4,848
1,571
2,3482,456
3,1722,882
4,4654,315
4,667
6,897
3,9514,215 4,209
3,410
5,570
7,301
6,335
0
1,000
2,000
3,000
4,000
5,000
6,000
7,000
8,000
Q1
2006
Q2
2006
Q3
2006
Q4
2006
Q1
2007
Q2
2007
Q3
2007
Q4
2007
Q1
2008
Q2
2008
Q3
2008
Q4
2008
Q1
2009
Q2
2009
Q3
2009
Q4
2009
Q1
2010
Q2
2010
Q3
2010
Q4
2010
Q1
2011
Q2
2011
Q3
2011
Q4
2011
Q1
2012
Q2
2012
Q3
2012
Q4
2012
Q1
2013
Q2
2013
Q3
2013
Q4
2013
Q1
2014
Q2
2014
Q3
2014
Q4
2014
Q1
2015
Q2
2015
Q3
2015
Q4
2015
Q1
2016
Q2
2016
Q3
2016
Q4
2016
Q1
2017
Q2
2017
Value of deals (in US$ mn)
Analysis of PE investments
PwC MoneyTree India – Q2 2017 6
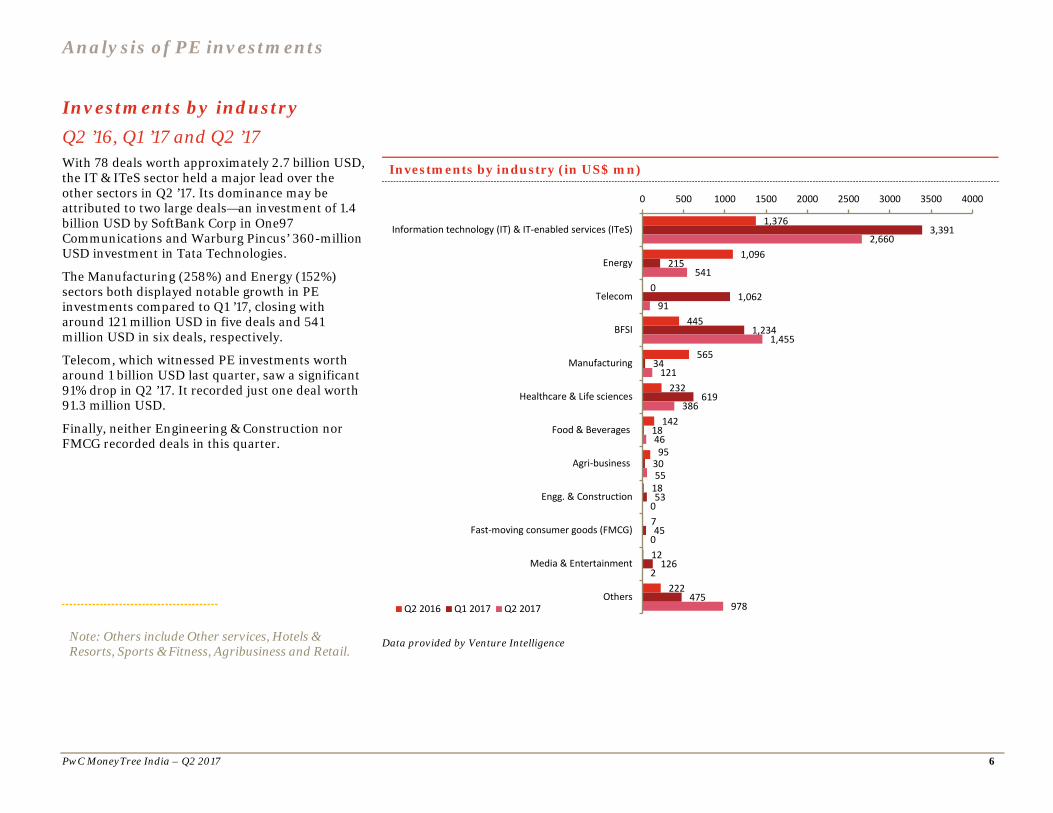
Investments by industry Q2 ’16, Q1 ’17 and Q2 ’17 With 78 deals worth approximately 2.7 billion USD, the IT & ITeS sector held a major lead over the other sectors in Q2 ’17. Its dominance may be attributed to two large deals—an investment of 1.4 billion USD by SoftBank Corp in One97 Communications and Warburg Pincus’ 360-million USD investment in Tata Technologies.
The Manufacturing (258%) and Energy (152%) sectors both displayed notable growth in PE investments compared to Q1 ’17, closing with around 121 million USD in five deals and 541 million USD in six deals, respectively.
Telecom, which witnessed PE investments worth around 1 billion USD last quarter, saw a significant 91% drop in Q2 ’17. It recorded just one deal worth 91.3 million USD.
Finally, neither Engineering & Construction nor FMCG recorded deals in this quarter.
Investments by industry (in US$ mn)
Data provided by Venture Intelligence
1,376
1,096
0
445
565
232
142
95
18
7
12
222
3,391
215
1,062
1,234
34
619
18
30
53
45
126
475
2,660
541
91
1,455
121
386
46
55
0
0
2
978
0 500 1000 1500 2000 2500 3000 3500 4000
Information technology (IT) & IT-enabled services (ITeS)
Energy
Telecom
BFSI
Manufacturing
Healthcare & Life sciences
Food & Beverages
Agri-business
Engg. & Construction
Fast-moving consumer goods (FMCG)
Media & Entertainment
OthersQ2 2016 Q1 2017 Q2 2017
Note: Others include Other services, Hotels & Resorts, Sports & Fitness, Agribusiness and Retail.

Analysis of PE investments
PwC MoneyTree India – Q2 2017 7
Despite the slowdown in growth in the Indian technology sector and in the midst of layoffs and US visa issues, technology continued to be a major investment theme in the second quarter, with IT & ITeS accounting for a large share of overall deal value despite growth in volumes remaining flat. This quarter witnessed significant developments around further consolidation in the e-tail segment, along with several new billion-dollar funds flowing into the technology sector. As transactions continue to move online, new areas such as FinTech and the hyperlocal and travel segments are set to benefit in the long term. As e-Commerce players strive to achieve profitability, the year could also see companies opting for an initial public offering (IPO) as a preferred exit route.
Sandeep Ladda Global TMT Tax Leader and India Technology Sector Leader PwC India
‘
‘
As per the fourth edition of the FICCI-PwC Strategy& India Manufacturing Barometer report, the Indian manufacturing industry is looking to focus on new products/services, R&D, IT and expanding its facilities in select sectors. Companies in the manufacturing space have shown resilience in the face of challenges and are confident about the sector’s growth prospects. While the number of PE deals in the manufacturing sector is limited compared to that in other sectors, we note that quite a few manufacturing companies are open to exploring the PE route to further expand their business operations.
Bimal Tanna Partner and Leader, Industrial Products PwC India
‘
‘

Analysis of PE investments
PwC MoneyTree India – Q2 2017 8
Investments by stage of development Q2 ’16, Q1 ’17 and Q2 ’17 In the second quarter of 2017, late-stage investments retained the top spot in terms of stage of development, seeing an inflow of approximately 3.6 billion USD across 23 deals. This was a 7% and 277% increase in deal value compared to the last quarter and year-ago period, respectively.
This quarter, buyout deals took up the second spot with a 45% rise from 591 million USD in Q1 ’17 to around 859 million USD across the same number of deals (i.e., eight). Growth-stage investments rounded off the top three, with 21 deals worth around 439 million USD.
PIPE deals, which was the second position last quarter, slipped to the fourth position in Q2 ’17. With investment of around 378 million USD made in nine deals, this development stage witnessed a 76% decline in terms of value compared to the previous quarter.
Investments by stage development (in US$ mn)
Data provided by Venture Intelligence
168
1,239
958
297
1,008
538
254
936
3,374
1,600
591
548
251
439
3,613
378
859
795
0 500 1000 1500 2000 2500 3000 3500 4000
Early
Growth
Late
Pre-IPO
PIPE
Buyout
Other
Q2 2016 Q1 2017 Q2 2017
Note: Definitions for the stage of development categories can be found in the ‘definitions’ section of this report.
Growth stage in the above graph includes both growth and growth-PE stages.
Analysis of PE investments
PwC MoneyTree India – Q2 2017 9
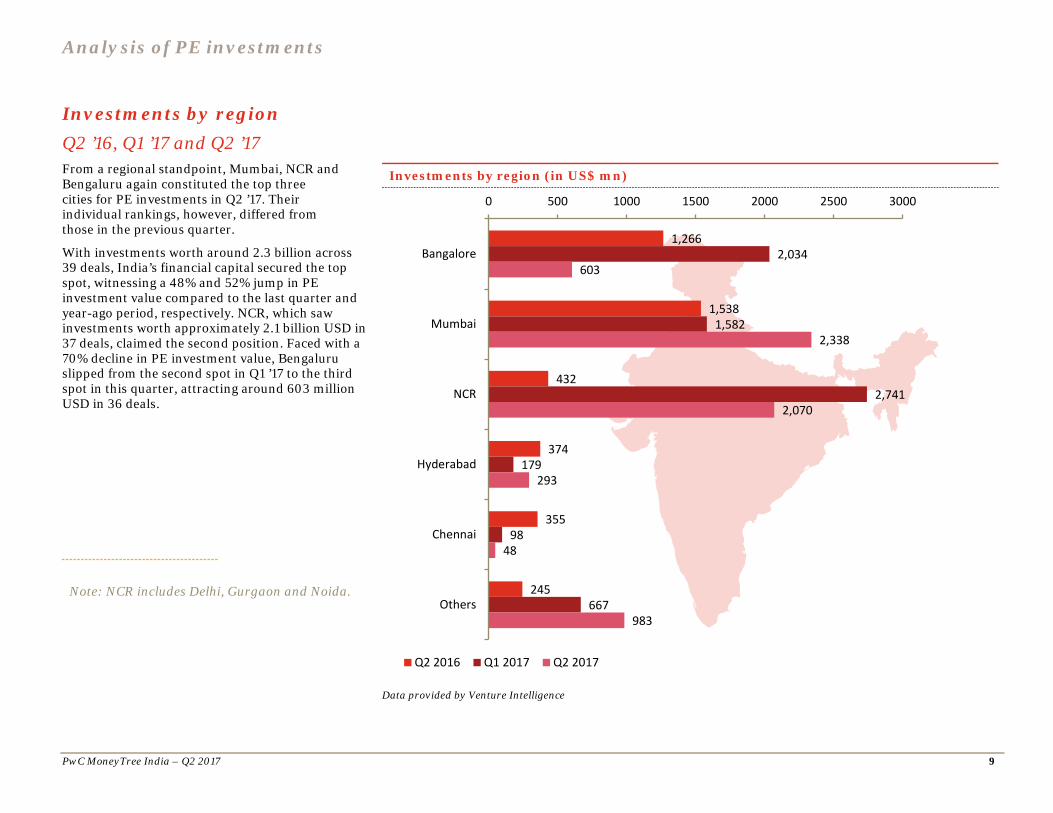
Investments by region Q2 ’16, Q1 ’17 and Q2 ’17 From a regional standpoint, Mumbai, NCR and Bengaluru again constituted the top three cities for PE investments in Q2 ’17. Their individual rankings, however, differed from those in the previous quarter.
With investments worth around 2.3 billion across 39 deals, India’s financial capital secured the top spot, witnessing a 48% and 52% jump in PE investment value compared to the last quarter and year-ago period, respectively. NCR, which saw investments worth approximately 2.1 billion USD in 37 deals, claimed the second position. Faced with a 70% decline in PE investment value, Bengaluru slipped from the second spot in Q1 ’17 to the third spot in this quarter, attracting around 603 million USD in 36 deals.
Investments by region (in US$ mn)
Data provided by Venture Intelligence
1,266
1,538
432
374
355
245
2,034
1,582
2,741
179
98
667
603
2,338
2,070
293
48
983
0 500 1000 1500 2000 2500 3000
Bangalore
Mumbai
NCR
Hyderabad
Chennai
Others
Q2 2016 Q1 2017 Q2 2017
Note: NCR includes Delhi, Gurgaon and Noida.
Analysis of PE investments
PwC MoneyTree India – Q2 2017 10
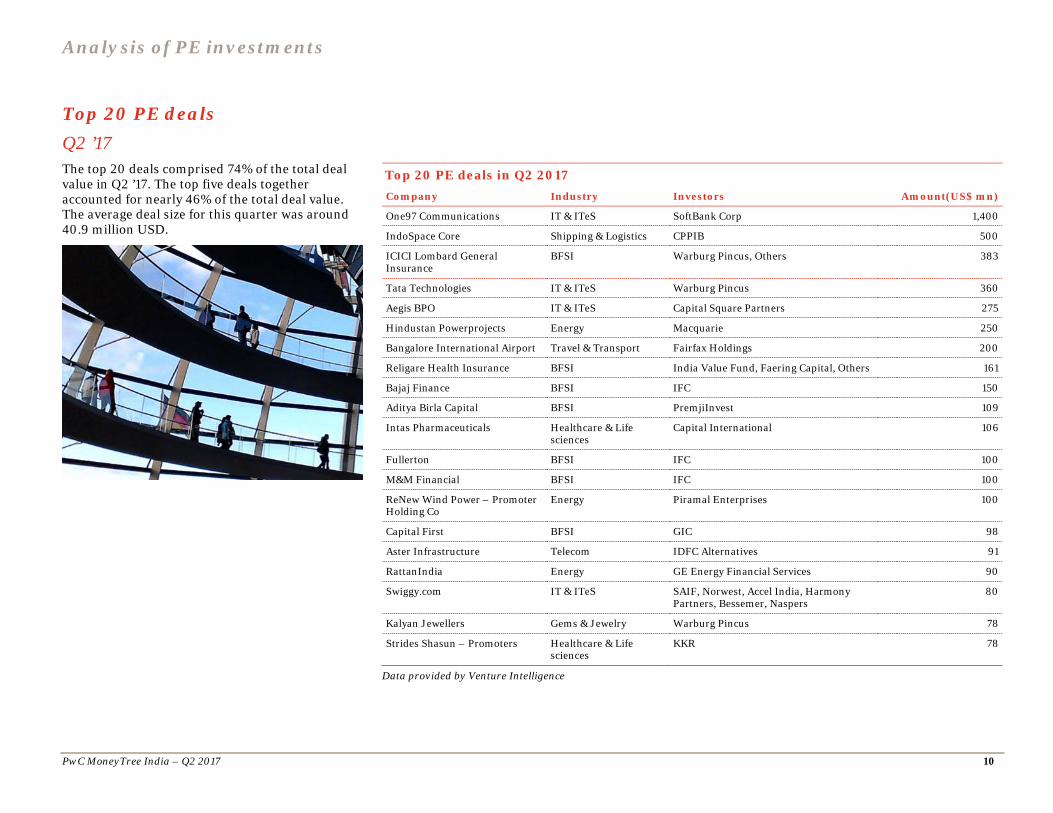
Top 20 PE deals Q2 ’17 The top 20 deals comprised 74% of the total deal value in Q2 ’17. The top five deals together accounted for nearly 46% of the total deal value. The average deal size for this quarter was around 40.9 million USD.
Top 20 PE deals in Q2 2017 Company Industry Investors Amount(US$ mn)
One97 Communications IT & ITeS SoftBank Corp 1,400
IndoSpace Core Shipping & Logistics CPPIB 500
ICICI Lombard General Insurance
BFSI Warburg Pincus, Others 383
Tata Technologies IT & ITeS Warburg Pincus 360
Aegis BPO IT & ITeS Capital Square Partners 275
Hindustan Powerprojects Energy Macquarie 250
Bangalore International Airport Travel & Transport Fairfax Holdings 200
Religare Health Insurance BFSI India Value Fund, Faering Capital, Others 161
Bajaj Finance BFSI IFC 150
Aditya Birla Capital BFSI PremjiInvest 109
Intas Pharmaceuticals Healthcare & Life sciences
Capital International 106
Fullerton BFSI IFC 100
M&M Financial BFSI IFC 100
ReNew Wind Power – Promoter Holding Co
Energy Piramal Enterprises 100
Capital First BFSI GIC 98
Aster Infrastructure Telecom IDFC Alternatives 91
RattanIndia Energy GE Energy Financial Services 90
Swiggy.com IT & ITeS SAIF, Norwest, Accel India, Harmony Partners, Bessemer, Naspers
80
Kalyan Jewellers Gems & Jewelry Warburg Pincus 78
Strides Shasun – Promoters Healthcare & Life sciences
KKR 78
Data provided by Venture Intelligence

PwC MoneyTree India – Q2 2017 11
3. Analysis of PE exits
Total PE exits Q2 ’17 Q2 ’17 saw a 13% decrease in the value of PE exits compared to the last quarter. In all, there were 61 deals worth around 2.8 billion USD in comparison to 58 deals worth around 3.2 billion USD in the previous quarter. In contrast, there was a staggering 101% rise in deal value compared to the year-ago period (approximately 1.4 billion USD in 53 deals).
IT & ITeS was the top sector in terms of PE exits in this quarter, with a total of 14 exits worth around 718 million USD. BFSI and Healthcare & Life sciences took up the second and third positions, with exits worth around 631 million USD in 12 deals and 556 million USD in 11 deals, respectively. The Manufacturing sector showed an upward trend in this quarter, enjoying a 237% and 775% increase in exit value in comparison to the previous quarter and year-ago period, respectively.
Public market sales emerged as the most preferred exit route, with a total value of around 1.5 billion USD in 35 deals. Secondary sales, which were the number one exit route in the previous quarter, witnessed a drop of 44% in exit value in this quarter, falling from around 1.3 billion USD to 750 million USD.
Total PE exits (in US$ mn)
No.
of
deal
s 21
18
23
32
35
39
38
33
34
15
21
11
17
42
32
31
48
37
44
61
34
33
31
31
46
35
34
37
37
41
22
34
27
61
49
54
73
73
55
69
43
53
75
73
58
61
Data provided by Venture Intelligence
554574607
948801
669
1,514
789948
308210268277
706604370
9731,0051,227
3,079
780
1,080
795
431
1,324
403
1,4761,597
1,122
1,913
448
1,216
470
1,2381,2891,331
1,978
3,977
1,8201,774
2,317
1,394
2,647
1,963
3,211
2,806
0
500
1,000
1,500
2,000
2,500
3,000
3,500
4,000
4,500
Q1
2006
Q2
2006
Q3
2006
Q4
2006
Q1
2007
Q2
2007
Q3
2007
Q4
2007
Q1
2008
Q2
2008
Q3
2008
Q4
2008
Q1
2009
Q2
2009
Q3
2009
Q4
2009
Q1
2010
Q2
2010
Q3
2010
Q4
2010
Q1
2011
Q2
2011
Q3
2011
Q4
2011
Q1
2012
Q2
2012
Q3
2012
Q4
2012
Q1
2013
Q2
2013
Q3
2013
Q4
2013
Q1
2014
Q2
2014
Q3
2014
Q4
2014
Q1
2015
Q2
2015
Q3
2015
Q4
2015
Q1
2016
Q2
2016
Q3
2016
Q4
2016
Q1
2017
Q2
2017
Total private equity exits Value of deals (in US$ mn)

Analysis of PE exits
PwC MoneyTree India – Q2 2017 12
Exits by industry Q2 ’16, Q1 ’17 and Q2 ’17With 14 deals worth about 718 million USD, the IT & ITeS sector led exits by industry in Q2 ’17. This was a 34% drop in exit value compared to the last quarter (where exits stood at around 1.1 billion in nine deals) but a whopping 634% increase in comparison to the year-ago period (around 98 million USD in 14 deals). The top exit in this quarter— that of SAIF and others from One97 Communications—was in the IT & ITeS sector.
BFSI, the second largest sector for exits, recorded 12 exits worth around 631 million USD. This represents a 9% decrease in value compared to the previous quarter, which saw exits of about 689 million USD in 12 deals.
The Healthcare & Life sciences sector rounded off the top three with 11 exits worth around 556 million USD. Manufacturing, which witnessed exits worth around 121 million USD in four deals in the last quarter, experienced a 237% increase in deal value, with seven exits worth around 407 million USD in Q2 ’17. This was a 775% increase in exit value compared to the year-ago period, which saw three deals worth about 47 million USD.
Data provided by Venture Intelligence
206
517
98
47
155
99
274
246
689
1,094
121
39
497
525
0
631
718
407
51
556
443
0 200 400 600 800 1000 1200
Telecom
BFSI
IT & ITeS
Manufacturing
Energy
Healthcare & Life sciences
Others
Q2 2016 Q1 2017 Q2 2017
Exits by industry (in US$ mn)
Note: Others include Shipping & Logistics, Other services, Retail, Food & Beverages and Hotels & Resorts.

Analysis of PE exits
PwC MoneyTree India – Q2 2017 13
Exits by type Q2 ’16, Q1 ’17 and Q2 ’17 Public market sales was the number one exit route for PE investors in this quarter, with a total exit value of around 1.5 billion USD in 35 deals. This was a 23% increase in exit value in comparison to Q1 ’17 (around 1.3 billion USD in 30 deals) and a 93% increase in comparison to Q2 ’16 (28 exits worth about 803 million USD). Further, secondary sale deals witnessed a 44% drop in value (around 750 million USD in 10 deals), whereas buyback experienced a 304% increase in value (around 367 million USD in five deals) in this quarter.
Data provided by Venture Intelligence
70
803
214
291
91
1,256
1,333
531
366
1,550
750
99
0 200 400 600 800 1000 1200 1400 1600 1800
Buyback
Public market sale
Secondary sale
Strategic sale
Q2 2016 Q1 2017 Q2 2017
Exits by type (in US$ mn)
Analysis of PE exits
PwC MoneyTree India – Q2 2017 14
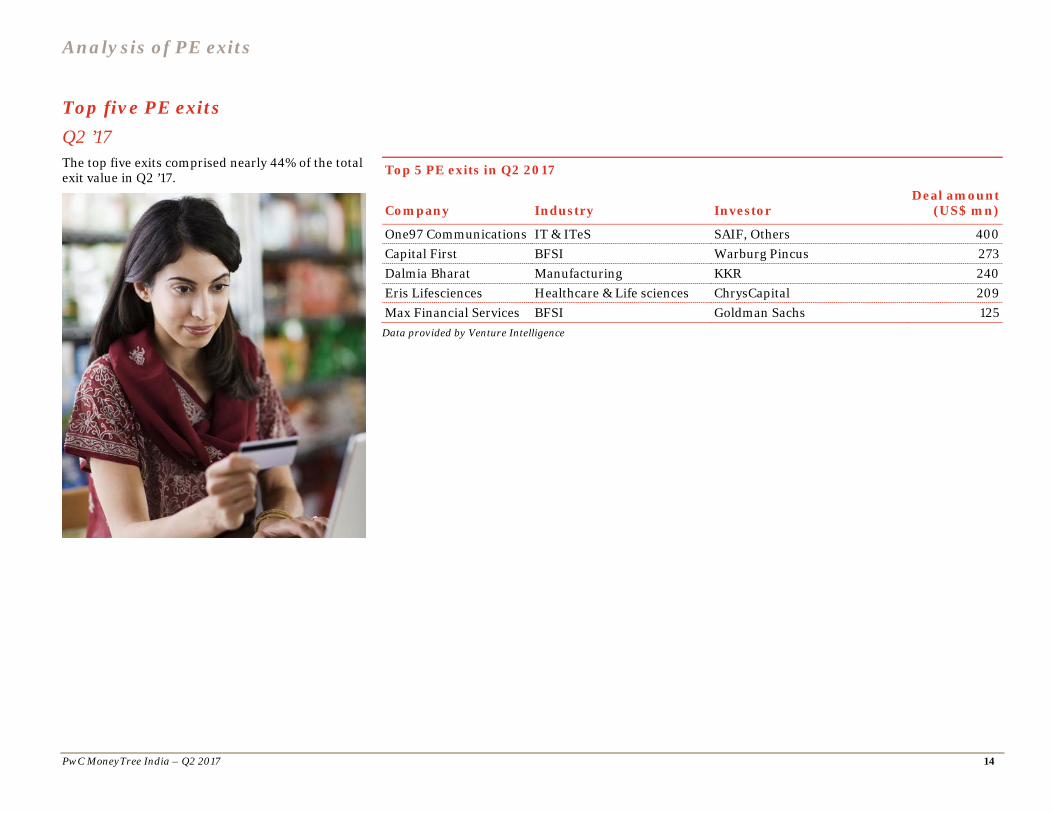
Top five PE exits Q2 ’17 The top five exits comprised nearly 44% of the total exit value in Q2 ’17.
Top 5 PE exits in Q2 2017
Company Industry Investor Deal amount
(US$ mn)
One97 Communications IT & ITeS SAIF, Others 400 Capital First BFSI Warburg Pincus 273 Dalmia Bharat Manufacturing KKR 240 Eris Lifesciences Healthcare & Life sciences ChrysCapital 209 Max Financial Services BFSI Goldman Sachs 125
Data provided by Venture Intelligence

PwC MoneyTree India – Q2 2017 15
4. Active PE firms
In Q2 ’17, Sequoia Capital India entered into seven deals; Accel India and GVFL followed with six and five deals, respectively. The other active PE investors this quarter are listed alongside.
Q2 2017
Investors
No. of deals
Sequoia Capital India 7
Accel India 6
GVFL 5
Blume Ventures 5
Warburg Pincus 4
Lightspeed Ventures 4
YouWeCan Ventures 3
Kalaari Capital 3
RB Investments 3
Nexus Venture Partners 3
Madison India 3
Unicorn India Ventures 3
SAIF 3
Data provided by Venture Intelligence
* Number of deals includes both single and co-investments by PE firms. Cases where two or more firms have invested in a single deal are accounted for as one deal for each firm.

PwC MoneyTree India – Q2 2017 16
5. Sector focus – IT & ITeS sector
Q2 2017 saw the beginning of a transitory phase, where a majority of the Indian IT industry was forced to move away from cost arbitrage and shift focus towards revenue and value of delivery. An increasing contribution from digital and revenue per employee are set to become key metrics for gauging business performance.
In a move to counter the effects of protectionist policies in key markets and the widespread adoption of automation, this quarter saw major IT players in India attempting to ‘right size’ their operations.
The recent ransomware attack that also hit several corporations in India exposed some vulnerabilities in the existing digital ecosystem. At a time when the government is pushing for digital governance and a cashless economy, companies need to ensure robust cyber security frameworks to manage such global threats.
The implementation of GST is expected to generate large opportunities for IT companies in areas such as point of sale (PoS) billing systems, ERP and digital payments. Cloud service providers (CSPs) are also expected to benefit from the data storage requirements arising out of this popular tax reform.
The domestic electronics and hardware manufacturing sector was given a boost by the Phased Manufacturing Programme (PMP) and subsequent levy of basic customs duty (BCD) of 10 %, which will help improve the local mobile manufacturing ecosystem in India.
Amid IT layoffs, EdTech start-ups and online learning platforms saw increasing demand as companies realised the importance of developing their credentials in new-age digital technologies. The Department of Industrial Policy and Promotion’s (DIPP’s) proposal to the Finance Ministry to release additional funds for start-ups (FFS) is also expected to further boost start-up funding activity in India.
As in 2016, the online retail market continued to deal with a slowdown. This has led major e-Commerce players to expand their presence in newer revenue streams such as offline partnerships and to launch their own integrated digital payment platforms.
As companies continue their efforts to move up the relationship value chain, maintaining profitability while embracing the changes brought in by digital disruptions will be a key factor in realising the industry’s future potential.
Sandeep Ladda
Global TMT Tax Leader and India Technology Sector Leader
PwC India

Sector focus – IT & ITeS sector
PwC MoneyTree India – Q2 2017 17
Total PE investments
The IT & ITeS sector saw PE investments worth around 2.7 billion USD in 78 deals in Q2 ’17. While this represented a decrease in investment value compared to the last quarter (around 3.4 billion USD in 78 deals), there was a 93% increase in deal value compared to the year-ago period (around 1.4 billion in 100 deals).
Late-stage deals were the most preferred choice for PE investments in the IT & ITeS sector in this quarter, with four deals totaling around 1.8 billion USD. Buyouts came in second, with around 357 million USD in three deals. Growth-stage deals rounded off the top three, with 10 deals worth around 243 million USD.
In terms of region, NCR acquired a major lead over the other cities, with investments worth around 1.5 billion USD in 23 deals. While Mumbai witnessed a 16% increase in investments (around 466 million USD in 19 deals), Bengaluru experienced an 86% drop (around 229 million USD in 21 deals) in investments when compared to the previous quarter.
Mobile value-added services (VAS) surpassed the other subsectors in terms of deal value, receiving almost 1.5 billion USD across 10 deals in Q2 ’17. In addition, BPO witnessed a staggering increase in investments—from 63.5 million USD in Q1 ’17 to 645 million USD in Q2 ’17.
The average deal size this quarter was around 34 million USD compared to about 43 million USD in the last quarter.
Funding for both the IT & ITeS sector and overall PE investments showed a downward trend in Q2 ’17. While tech funding saw a decline of about 22%, total PE funding dropped by 13% in comparison to the last quarter.
Data provided by Venture Intelligence
Value of PE investments in IT & ITeS sector (in US$ mn)
217
850
366
151
625 647
307233
555
353422
165 99 65
397
106273
111148
311
791
347515
443303
312
2,423
181150
481648
988 985
772
1,568
2,635
1,9921,893
3,846
1,247
1,4091,376
1,2511,130
3,391
2,660
0
500
1,000
1,500
2,000
2,500
3,000
3,500
4,000
4,500
Q1
2006
Q2
2006
Q3
2006
Q4
2006
Q1
2007
Q2
2007
Q3
2007
Q4
2007
Q1
2008
Q2
2008
Q3
2008
Q4
2008
Q1
2009
Q2
2009
Q3
2009
Q4
2009
Q1
2010
Q2
2010
Q3
2010
Q4
2010
Q1
2011
Q2
2011
Q3
2011
Q4
2011
Q1
2012
Q2
2012
Q3
2012
Q4
2012
Q1
2013
Q2
2013
Q3
2013
Q4
2013
Q1
2014
Q2
2014
Q3
2014
Q4
2014
Q1
2015
Q2
2015
Q3
2015
Q4
2015
Q1
2016
Q2
2016
Q3
2016
Q4
2016
Q1
2017
Q2
2017
Valu
e in
US$
Mn

Sector focus – IT & ITeS sector
PwC MoneyTree India – Q2 2017 18
Investments by stage of development Q2 ’16, Q1 ’17 and Q2 ’17Late-stage deals were the most preferred route for PE investments in the IT & ITeS sector in Q2 ’17. This quarter saw four deals worth around 1.8 billion USD. While this is a 25% dip compared to the last quarter (around 2.4 billion USD in seven deals), it is a huge increase compared to the year-ago period (around 155 million USD in six deals).
Buyouts followed with three deals worth around 357 million USD, representing a 98% increase compared to the previous quarter in terms of value. Growth-stage deals completed the top three, with investments worth around 243 million USD in 10 deals. However, this was a 59% drop in investment value from the last quarter, which saw investments worth about 589 million USD in 15 deals.
Finally, compared to Q1 ’17, the value of PIPE deals increased by 66% (36 million USD in one deal), while that of early-stage deals increased by 11% (about 175 million USD in 58 deals).
Investments by stage of development (in US$ mn)
Data provided by Venture Intelligence
825
138
238
155
17
180
158
589
2,442
22
357
175
243
1,841
36
0 500 1000 1500 2000 2500 3000
Buyout
Early
Growth
Late
PIPE
Q2 2016 Q1 2017 Q2 2017

Sector focus – IT & ITeS sector
PwC MoneyTree India – Q2 2017 19
Investments by region Q2 ’16, Q1 ’17 and Q2 ’17 From a geographic view, NCR overshadowed the other cities in Q2 ’17. Its IT & ITeS sector attracted investments worth around 1.5 billion USD in 23 deals, a 17% increase in deal value compared to the previous quarter (around 1.3 billion USD in 22 deals) and an 899% increase compared to the year-ago period (around 147 million USD in 24 deals).
Mumbai and Bengaluru finished second and third, with around 466 million USD in 19 deals and around 229 million USD in 21 deals, respectively.
Finally, with investments worth around 78 million across four deals in Q2 ’17, Hyderabad has shown enormous growth both over the previous quarter and the year-ago period.
Data provided by Venture Intelligence
Investments by region (in US$ mn)
935
178
147
2
1
112
1,634
400
1,254
9
5
87
229
466
1,472
8
78
408
0 200 400 600 800 1000 1200 1400 1600 1800
Bengaluru
Mumbai
NCR
Chennai
Hyderabad
Others
Q2 2016 Q1 2017 Q2 2017

Sector focus – IT & ITeS sector
PwC MoneyTree India – Q2 2017 20
Investments by subsector Q2 ’16, Q1 ’17 and Q2 ’17
Mobile VAS dominated investments by subsector, attracting around 1.5 billion USD in 10 deals. With investments worth 645 million USD in three deals, BPO services was second to mobile VAS. However, it showed remarkable growth over the last quarter (63.5 million USD in two deals).
Online services, which held the top spot in the last quarter, came in at number three in Q2 ’17, with investments worth around 413 million USD in 40 deals. This represented an 80% decline in deal value compared to the previous quarter.
Data provided by Venture Intelligence
227
100
70
81
828
71
2,034
65
426
101
739
26
414
645
1,514
68
22
0 500 1,000 1,500 2,000 2,500
Online services
BPO
Mobile VAS
Enterprise software
IT services
Others
Q2 2016 Q1 2017 Q2 2017
Investments by subsector (in US$ mn)
Sector focus – IT & ITeS sector
PwC MoneyTree India – Q2 2017 21
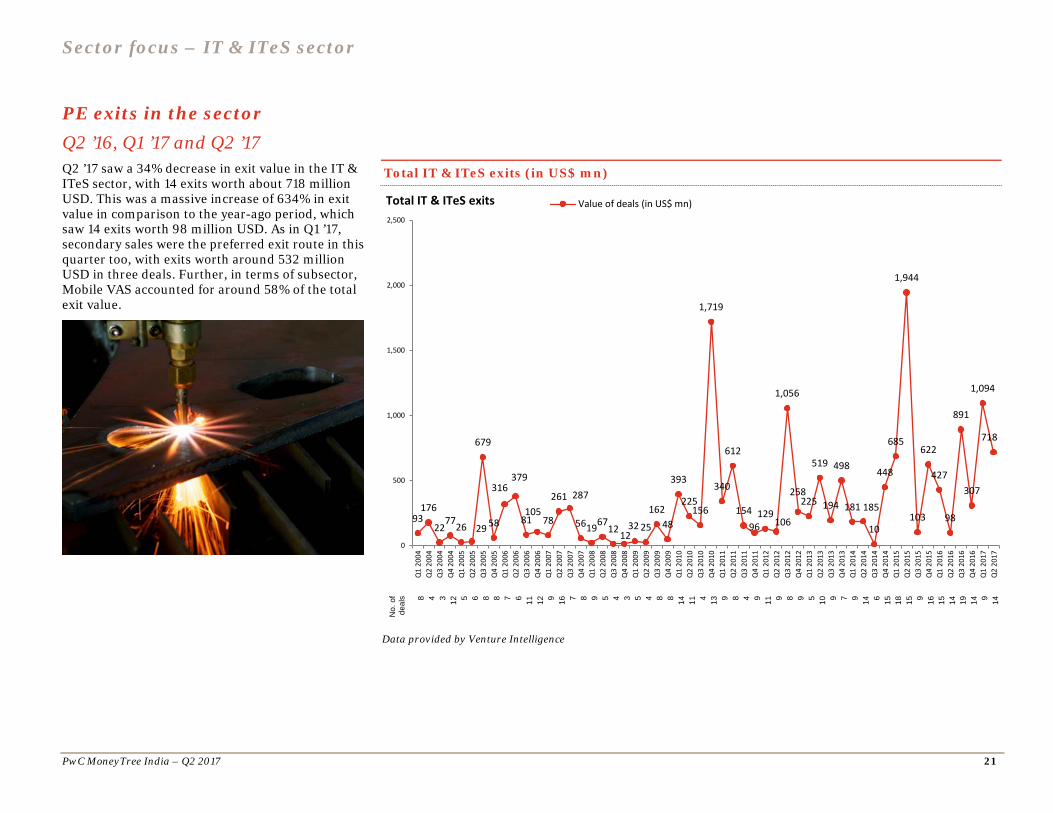
PE exits in the sector Q2 ’16, Q1 ’17 and Q2 ’17 Q2 ’17 saw a 34% decrease in exit value in the IT & ITeS sector, with 14 exits worth about 718 million USD. This was a massive increase of 634% in exit value in comparison to the year-ago period, which saw 14 exits worth 98 million USD. As in Q1 ’17, secondary sales were the preferred exit route in this quarter too, with exits worth around 532 million USD in three deals. Further, in terms of subsector, Mobile VAS accounted for around 58% of the total exit value.
No.
of
deal
s 8 4 3 12 5 6 8 8 7 6 11
12 9 16 7 8 9 5 4 3 5 4 8 8 14
11 4 13 9 8 4 9 11 9 8 9 5 10 9 7 9 14 6 15
18
15 9 16
15
14
19
14 9 14
Data provided by Venture Intelligence
93176
227726 29
679
58
316379
81105
78
261 287
5619671212
32 25
16248
393
225156
1,719
340
612
15496
129106
1,056
258225
519
194
498
181 185
10
448
685
1,944
103
622
427
98
891
307
1,094
718
0
500
1,000
1,500
2,000
2,500
Q1
2004
Q2
2004
Q3
2004
Q4
2004
Q1
2005
Q2
2005
Q3
2005
Q4
2005
Q1
2006
Q2
2006
Q3
2006
Q4
2006
Q1
2007
Q2
2007
Q3
2007
Q4
2007
Q1
2008
Q2
2008
Q3
2008
Q4
2008
Q1
2009
Q2
2009
Q3
2009
Q4
2009
Q1
2010
Q2
2010
Q3
2010
Q4
2010
Q1
2011
Q2
2011
Q3
2011
Q4
2011
Q1
2012
Q2
2012
Q3
2012
Q4
2012
Q1
2013
Q2
2013
Q3
2013
Q4
2013
Q1
2014
Q2
2014
Q3
2014
Q4
2014
Q1
2015
Q2
2015
Q3
2015
Q4
2015
Q1
2016
Q2
2016
Q3
2016
Q4
2016
Q1
2017
Q2
2017
Total IT & ITeS exits Value of deals (in US$ mn)
Total IT & ITeS exits (in US$ mn)

PwC MoneyTree India – Q2 2017 22
Definitions
Stages of development Early stage: This refers to the first or second round of institutional investments in companies that adhere to the following:
• Less than five years old • Not part of a larger business group • Investment is less than 20 million USD
Growth stage: This refers to investments of less than 20 million USD. Also, investments meeting the following criteria are considered to be in the growth stage:
• Third or fourth round funding of institutional investments
• First or second round of institutional investments in companies that are more than 5 years old and less than 10 years old or spin-outs from larger businesses
Growth stage PE: This includes the following:
• First or second round of investments worth 20 million USD or more
• Third or fourth round funding in companies that are more than 5 years old and less than 10 years old, or subsidiaries or spin-outs from larger businesses
• Fifth or sixth round of institutional investments
Late stage: This comprises the following:
• Investment in companies that are a decade old • Seventh or later round of institutional
investments
PIPEs: The following constitute PIPEs:
• PE investments in publicly listed companies via preferential allotments or private placements
• Acquisition of shares by PE firms via the secondary market
Buyout: This is an acquisition of controlling stake via purchase of stakes of existing shareholders.
Buyout – large: This includes buyout deals of 100 million USD or more in value.
Other: This includes PE investments in special purpose vehicle (SPV) or project-level investments.
Types of PE exits Buyback: This includes the purchase of PE or VC investors' equity stakes by either the investee company y or its founders or promoters.
Strategic sale: This includes the sale of PE or VC investors' equity stakes (or the entire investee company itself) to a third-party company (which is typically a larger company in the same sector).
Secondary sale: Any purchase of PE or VC investors' equity stakes by another PE or VC investors constitutes secondary sale.
Public market sale: This includes the sale of PE or VC investors' equity stakes in a listed company through the public market.
Initial public offering (IPO): This includes the sale of PE or VC investors' equity stake in an unlisted company through its first public offering of stock.
www.pwc.com/globalmoneytree www.pwc.in
Contacts Sandeep Ladda Global TMT Tax Leader and India Technology Sector Leader PwC India [email protected] Sanjeev Krishan Leader, Private Equity and Transaction Services PwC India [email protected]
This report was researched and written by the following:
Pradyumna Sahu Executive Director, Markets & Industries PwC India [email protected]
Dion D’Souza Manager, Markets & Industries PwC India [email protected]
Trishann Henriques Associate, Markets & Industries PwC India [email protected]
Suneet Mohan Knowledge Manager, Technology PwC India [email protected]
About PwC’s Technology Institute The Technology Institute is PwC’s global research network that studies the business of technology and the technology of business with the purpose of creating thought leadership that offers both fact-based analysis and experience-based perspectives. Technology Institute insights and viewpoints originate from active collaboration between our professionals across the globe and their first-hand experiences working in and with the technology industry. For more information, please contact Raman Chitkara, Global Technology Industry Leader, at [email protected]
About PwC At PwC, our purpose is to build trust in society and solve important problems. We’re a network of firms in 157 countries with more than 223,000 people who are committed to delivering quality in assurance, advisory and tax services. Find out more and tell us what matters to you by visiting us at www.pwc.com/in
In India, PwC has offices in these cities: Ahmedabad, Bengaluru, Chennai, Delhi NCR, Hyderabad, Kolkata, Mumbai and Pune. For more information about PwC India’s service offerings, visit www.pwc.com/in
PwC refers to the PwC International network and/or one or more of its member firms, each of which is a separate, independent and distinct legal entity. Please see www.pwc.com/structure for further details.
www.pwc.com
PricewaterhouseCoopers and Venture Intelligence have taken responsible steps to ensure that the information contained in the MoneyTreeTM report has been obtained from reliable sources. However, neither of the parties can warrant the ultimate validity of the data obtained. Results are updated periodically. Therefore, all data is subject to change at any time. Before making any decision or taking any action, you should consult a competent professional adviser.
©2017 PwC. All rights reserved.
PwC refers to the PwC network and/or one or more of its member firms, each of which is a separate legal entity. Please see pwc.com/structure for further details.
This content is for general information purposes only, and should not be used as a substitute for consultation with professional advisors