prevalence and prole of alcohol consumption among university students...
TRANSCRIPT

Gac Sanit. 2016;30(5):370–374
Brief original article
Prevalence and profile of alcohol consumptionamong university students in Ecuador
Pablo Ruisotoa,b,c,∗, Raúl Cachod, José J. López-Gonid, Silvia Vacab, Marco Jiménezb
a Departament of Basic Psychology, Psychobiology and Methodology of Behavioral Sciences, University of Salamanca, Salamanca, Spainb Departament of Psychology, Tecnic Particular University of Loja, Loja, Ecuadorc Departament of Psychology, European University of Madrid, Madrid, Spaind Departament of Psychology and Pedagogy, Public University of Navarra, Pamplona, Spain
a r t i c l e i n f o
Article history:
Received 13 November 2015
Accepted 19 February 2016
Available online 5 April 2016
Keywords:
Alcohol
Risk
Gender
Students
Ecuador
a b s t r a c t
Objective: Alcohol consumption is one of the main health and social problems in Ecuador. The aim of
this study was to explore gender differences in the prevalence and psychosocial profile of problematic
consumers among university students.
Method: We surveyed 3,232 students by using the AUDIT and psychosocial scales. To discriminate the
explanatory value of each variable, a CHAID segmentation analysis was used.
Results: The prevalence of alcohol consumption was 92.24% in men and 82.86% in women. In total, 49.73%
of men and 23.80% of women reported problematic consumption. In men, the profile of problematic
consumption was defined by higher scores in anxiety and depression, especially if they showed higher
levels of psychological stress and lower life engagement. In women, problematic consumption showed
a tendency towards psychological inflexibility, especially in those with lower life engagement.
Conclusion: There is a need to prioritise attention to alcohol consumption in university students and to
design different interventions for men and women.
© 2016 SESPAS. Published by Elsevier Espana, S.L.U. This is an open access article under the CC
BY-NC-ND license (http://creativecommons.org/licenses/by-nc-nd/4.0/).
Prevalencia y perfil de consumo de alcohol en estudiantes universitariosen Ecuador
Palabras clave:
Alcohol
Riesgo
Sexo
Estudiantes
Ecuador
r e s u m e n
Objetivo: El consumo de alcohol constituye un problema de salud pública en Ecuador. El objetivo de este
estudio es analizar la prevalencia y el perfil de consumo de alcohol en estudiantes universitarios.
Método: Se encuestó a 3232 estudiantes a través del AUDIT y escalas psicosociales. Para discriminar el
valor explicativo de estas sobre el consumo se utilizó un análisis CHAID.
Resultados: La prevalencia total de consumo fue del 92,24% en los hombres y del 82,86% en las mujeres.
En total, el 49,73% de los hombres y el 23,80% de las mujeres reportaron un consumo problemático. En
los hombres, el perfil de consumo problemático se caracterizó por síntomas de ansiedad y depresión,
especialmente si existía mayor nivel de estrés y menor compromiso vital. En las mujeres, el consumo
problemático se caracterizó por mayor inflexibilidad psicológica y menor compromiso vital.
Conclusión: El consumo de alcohol en estudiantes universitarios requiere atención y el diseno de inter-
venciones específicas según el sexo.
© 2016 SESPAS. Publicado por Elsevier Espana, S.L.U. Este es un artıculo Open Access bajo la licencia
CC BY-NC-ND (http://creativecommons.org/licenses/by-nc-nd/4.0/).
Introduction
Alcohol is the most widely consumed psychoactive drug in the
Western world.1 Among the main factors related to risky alcohol
consumption, age,2 gender,3 and coping mechanisms4 have drawn
special attention. However, the specific profile which discrimi-
nates problematic alcohol consumption −considered hazardous or
∗ Corresponding author.
E-mail address: [email protected] (P. Ruisoto).
harmful for your health or for psychosocial functioning according
to WHO guidelines5− remains unclear.
The aim of this study is to explore gender differences in the
prevalence and psychosocial profile of problematic consumers in
university students.
Method
Design and procedure
A descriptive and cross-sectional study was done under the
Helsinki Declaration ethical guidelines. Alcohol consumption and
http://dx.doi.org/10.1016/j.gaceta.2016.02.008
0213-9111/© 2016 SESPAS. Published by Elsevier Espana, S.L.U. This is an open access article under the CC BY-NC-ND license (http://creativecommons.org/licenses/by-nc-
nd/4.0/).
P. Ruisoto et al. / Gac Sanit. 2016;30(5):370–374 371
psychosocial variables were surveyed online using scales trans-
lated and/or adapted from the original versions to Ecuadorian
Spanish. Once the participant logged in as a student at the uni-
versity, a reminder to complete the survey was displayed for one
month. A consent form preceded the survey explicitly guarantying
anonymity and a brief results report was provided for their records
in order to enhance commitment with forthright answers.
Participants
The total sample consisted of 5,500 college students enrolled at a
university in the south of Ecuador. The final sample was composed
by 3,232 students who completed the survey (58.7% of the total
enrollment). A total of 1,522 were men (average age of 21.62 + 3.51)
and 1,710 women (average age of 20.85 +3.27).
Instruments
• Alcohol Use Disorders Identification Test (AUDIT, Self-report
version).5 This scale evaluates alcohol consumption. Scores range
from 0 to 40. Higher scores indicate higher risk of problematic
alcohol consumption.• Type A Behavior Scale.6 It measures competitive drive, intense
striving for achievement, hostility, aggressiveness, impatience
and exaggerated sense of time urgency, associated with cardio-
vascular disorders and premature death. Scores range from 0 to
10. Higher scores indicate higher tendency towards personality
type A.• UCLA Loneliness Scale Revised-Short.7 It evaluates the subjective
feeling of loneliness, lack of emotional support or significant rela-
tionships compared to the desired one. Scores range from 0 to 9.
Higher scores indicate a greater degree of loneliness.• Avoidance and Action Questionnaire (AAQ-7).8 It measures psycho-
logical flexibility/inflexibility. Scores range from 7 to 49. Higher
scores indicate greater psychological inflexibility.• Life Engagement Test (ELT)t.9 It measures vital commitment or
degree to which the person is engaged in activities that are mean-
ingful to them. Scores range from 6 to 30. Higher scores indicate
a greater value guided life (life engagement).• Perceived Stress Scale (PSS-14).10 It evaluates the degree to which
situations in a person’s life are considered stressful, in terms
of unpredictability, uncontrollability and overload. Scores range
from 0 to 64. A higher score indicates a greater stress level.• Patient Health Questionnaire of Depression and Anxiety
(PHQ-4).11 It assess depression and anxiety associated with
functional impairment and disability days. Scores range from
0 to 12. A higher score indicates a greater anxiety and depression
level.• Satisfaction Life Question (LSQ).12 “How satisfied are you with your
life as a whole nowadays?”. Scores range from 0 to 10. A higher
score indicates higher satisfaction.
Analysis
Participants were divided into three groups based on the
AUDIT’s cut-offs: non-consumers (AUDIT = 0); non-problematic
alcohol consumption (AUDIT ≤16); problematic alcohol consump-
tion −hazardous, harmful or dependent consumption− (AUDIT
>16). Chi-squared test and ANOVA were conducted with an
adjusted significance level of p 0.05 and 0.01.
In order to establish the discriminatory power of each of the
scales for non-problematic and problematic consumers, a CHAID
(Chi-squared Automatic Interaction Detection) analysis was con-
ducted. This test provides cut-offs for each scale defining the best-fit
profile for both groups. All the statistical analysis were made using
the statistical package SPSS (vs. 15.0).
Results
Prevalence of alcohol consumption in men and women
A total of 12.7% (n = 411) students did not consume alcohol, 7.7%
among men and 17.1% among women; 51.3% (n = 1,657) consumed
moderately (non-problematic), 42.5% among men and 59.1% among
women; and 36% (n = 1,164) reported problematic consumption:
27.4% hazardous consumption, 4.7% harmful consumption and 3.9%
dependent, based on AUDIT categories. In fact, 49.7% of men and
23.8% of women reported problematic alcohol consumption.
Table 1 shows the distinct profile of psychosocial variables for
men and women with no alcohol consumption, non-problematic
consumption, and problematic consumption.
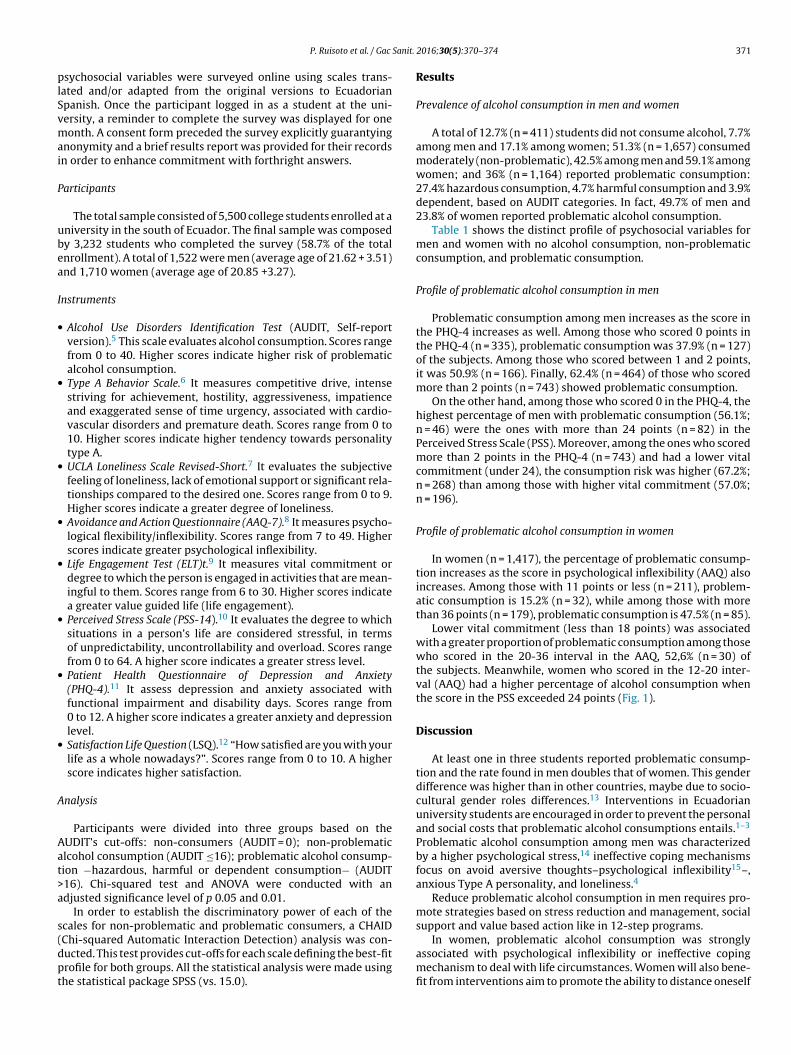
Profile of problematic alcohol consumption in men
Problematic consumption among men increases as the score in
the PHQ-4 increases as well. Among those who scored 0 points in
the PHQ-4 (n = 335), problematic consumption was 37.9% (n = 127)
of the subjects. Among those who scored between 1 and 2 points,
it was 50.9% (n = 166). Finally, 62.4% (n = 464) of those who scored
more than 2 points (n = 743) showed problematic consumption.
On the other hand, among those who scored 0 in the PHQ-4, the
highest percentage of men with problematic consumption (56.1%;
n = 46) were the ones with more than 24 points (n = 82) in the
Perceived Stress Scale (PSS). Moreover, among the ones who scored
more than 2 points in the PHQ-4 (n = 743) and had a lower vital
commitment (under 24), the consumption risk was higher (67.2%;
n = 268) than among those with higher vital commitment (57.0%;
n = 196).
Profile of problematic alcohol consumption in women
In women (n = 1,417), the percentage of problematic consump-
tion increases as the score in psychological inflexibility (AAQ) also
increases. Among those with 11 points or less (n = 211), problem-
atic consumption is 15.2% (n = 32), while among those with more
than 36 points (n = 179), problematic consumption is 47.5% (n = 85).
Lower vital commitment (less than 18 points) was associated
with a greater proportion of problematic consumption among those
who scored in the 20-36 interval in the AAQ, 52,6% (n = 30) of
the subjects. Meanwhile, women who scored in the 12-20 inter-
val (AAQ) had a higher percentage of alcohol consumption when
the score in the PSS exceeded 24 points (Fig. 1).
Discussion
At least one in three students reported problematic consump-
tion and the rate found in men doubles that of women. This gender
difference was higher than in other countries, maybe due to socio-
cultural gender roles differences.13 Interventions in Ecuadorian
university students are encouraged in order to prevent the personal
and social costs that problematic alcohol consumptions entails.1–3
Problematic alcohol consumption among men was characterized
by a higher psychological stress,14 ineffective coping mechanisms
focus on avoid aversive thoughts–psychological inflexibility15–,
anxious Type A personality, and loneliness.4
Reduce problematic alcohol consumption in men requires pro-
mote strategies based on stress reduction and management, social
support and value based action like in 12-step programs.
In women, problematic alcohol consumption was strongly
associated with psychological inflexibility or ineffective coping
mechanism to deal with life circumstances. Women will also bene-
fit from interventions aim to promote the ability to distance oneself

372 P. Ruisoto et al. / Gac Sanit. 2016;30(5):370–374
Figure 1. Decision tree CHAID algorithm and goodness of fit for alcohol consumption.
*Automated cut off.

P. Ruisoto et al. / Gac Sanit. 2016;30(5):370–374 373T
ab
le
1
Dif
fere
nce
s
in
psy
cho
soci
al
vari
ab
les
dep
en
din
g
on
gen
der
an
d
the
lev
el
of
alc
oh
ol
con
sum
pti
on
.
All
(N
=
3,2
32
)
Men
(N
=
1,5
22
)
Wo
men
(N
=
1,7
10
)
Lev
el
a
(n
=
11
8)
Lev
el
b
(n
=
64
7)
Lev
el
c
(n
=
75
7)
Lev
el
a
(n
=
11
8)
Lev
el
b
(n
=
64
7)
Lev
el
c
(n
=
75
7)
Lev
el
a
(n
=
29
3)
Lev
el
b
(n
=
1,0
10
)
Lev
el
c
(n
=
40
7)
M;
SD
M;
SD
M;
SD
M;
SD
F
M;
SD
M;
SD
M;
SD
F
M;
SD
M;
SD
M;
SD
F
Cop
ing
mec
han
ism
s
Ty
pe
A
pers
on
ali
ty
5.6
5;1
.69
4.8
6;2
.31
5.5
7;
1.6
1
5.8
3;
1.6
0
18
.0a
c
>
b
>
a
4.8
6;
2,3
1
5.5
7;
1,6
1
5.8
3;
1.6
0
18
.0a
c
>
b
>
a
5.2
3;
1.9
5
5.4
6;
1.5
5
5.7
6;
1.4
9
9.5
ac
>
b
>
a
Lo
neli
ness
Sca
le
6.3
5;
2.2
7
5.4
6;2
.72
6.0
6;
2.1
8
6.7
4;
2.1
9
26
.6a
c
>
b
>
a
5.4
6;
2,7
2
6.0
6;
2.1
8
6.7
4;
2.1
9
26
.6a
c
>
b
>
a
6.2
2;
2.5
1
6.7
2;
2.1
1
7.2
8;
2.1
7
20
.2a
c
>
b
>
a
Av
oid
an
ce
an
d
Act
ion
Qu
est
ion
nair
e
19
.77
;
9.8
4
16
.18
;11
.08
18
.30
;
9.0
5
21
.58
;
9.9
2
29
.0a
c
>
b
>
a
16
.18
;11
.08
18
.30
;
9.0
5
21
.58
;
9.9
2
29
.0-
c
>
b
>
a
20
.59
;
11
.56
21
.99
;
10
.01
26
.56
;
10
.58
36
.5a
c
>
b
>
a
Lif
e
En
gag
em
en
t
Test
24
.85
;
4.8
12
2.6
0;9
.35
25
.79
;
3.8
62
4.4
1;
4.3
02
9.4
a
b
>
c
>
a
22
.60
;
9.3
5
25
.79
;
3.8
6
24
.41
;
4.3
0
29
.4a
b
>
c
>
a
24
.24
;
6.8
9
25
.48
; 3
.79
23
.74
;
4.5
1
23
.4a
b
>
(a,c
)
Hea
lth
an
d
sub
ject
ive
wel
l-b
ein
g
Perc
eiv
ed
Str
ess
Sca
le
25
.21
;
6.4
82
1.8
4;8
.08
24
.23
;
6.3
8
26
.56
;
5.9
2
42
.0a
c
>
b
>
a
21
.84
;
8.0
8
24
.23
;
6.3
8
26
.56
;
5.9
2
42
.0a
c
>
b
>
a
25
.70
; 7
.15
26
.88
;
5.9
8
29
.25
;
6.1
4
31
.9a
c
>
b
>
a
Pati
en
t
Healt
h
Qu
est
ion
nair
e
3.0
8;
2.9
02
.03
;2.7
1
2.6
5;
2.8
43
.61
;
2.8
92
8.2
a
c
>
b
>
a
2.0
3;
2.7
12
.65
;
2.8
4
3.6
1;
2.8
9
28
.2a
c
>
b
>
a
3.1
2;
3.0
2
3.5
1;
2.8
5
4.6
0;
3.0
8
27
.0a
c
>
b
>
a
Lif
e
Sati
sfact
ion
Qu
est
ion
7.3
0;
2.2
2
6.8
1;3
.27
7.6
3;
2.0
7
7.1
1;
2.1
2
12
.9a
b
>
c
>
a
6.8
1;
3.2
7
7.6
3;
2.0
7
7.1
1;
2.1
2
12
.9a
b
>
c
>
a
7.1
9;
2.6
9
7.2
7;
2.0
7
6.6
3;
2.1
3
12
.7a
b
>
c
M:
med
ian
;
SD
:
stan
dard
dev
iati
on
.
Lev
el
a:
no
alc
oh
ol
con
sum
pti
on
;
lev
el
b:
no
n-p
rob
lem
ati
c
alc
oh
ol
con
sum
pti
on
;
lev
el
c:
pro
ble
mati
c
alc
oh
ol
con
sum
pti
on
.a
p
<0
.00
1.
from aversive thoughts and emotions, without avoiding the here
and now.
Preventive and treatment interventions would be justified both
in women and men in Ecuadorian university population. Baseline
seems especially severe in men although different cut-offs may be
necessary when establishing the problematic consumption level in
both sexes.
Given the cross sectional nature of the study, generalization of
findings must be viewed with caution. Future research should com-
plete these data with more universities in the country and data
collection methods.
What is known about the topic?
A growing number of research highlights the importance
of psychosocial variables in alcohol consumption. However,
designing and implementing interventions for the prevention
of alcohol consumption according to gender is an issue that is
being discussed.
What does this study add to the literature?
The results of this study support the need to create gen-
der differentiated programs. Problematic alcohol consumption
in men was associated with higher stress levels, anxiety
and depression symptoms, and lower vital commitment. In
women, associated with a tendency of avoiding emotions or
aversive thoughts, especially among those with lower vital
commitment.
Editor in charge
Napoleón Pérez-Farinós.
Transparency declaration
The corresponding author on behalf of the other authors guar-
antee the accuracy, transparency and honesty of the data and
information contained in the study, that no relevant information
has been omitted and that all discrepancies between authors have
been adequately resolved and described.
Authorship contributions
P. Ruisoto has contributed to the project conception, design
and data collection, as well as writing the article. R. Cacho has
contributed to the writing and critical review with important intel-
lectual contributions. J.J. López-Goni has led the result analysis and
interpretation, writing the article, critical review and approval of
the final version for publishing. S. Vaca and M. Jiménez have con-
tributed to the project conception and data collection.
Funding
This study was fully funded as a selected Program of Research
and Innovation by the Universidad Técnica Particular of Loja
(Ecuador).
Conflict of interest
None.

374 P. Ruisoto et al. / Gac Sanit. 2016;30(5):370–374
Acknowledgements
The authors wish to thank the National Secretariat of Higher
Education, Science, Technology and Innovation (SENESCYT) of the
Republic of Ecuador for their support through the Prometeo Project
References
1. Rehm J, Mathers C, Popova S, et al. Global burden of disease and injury andeconomic cost attributable to alcohol use and alcohol-use disorders. Lancet.2009;373:2223–33.
2. Hingson R, Heeren T, Zakocs R, et al. Age of first intoxication, heavy drink-ing, driving after drinking and risk of unintentional injury among US collegestudents. J Stud Alcohol. 2003;64:23–31.
3. Nolen-Hoeksema S. Gender differences in risk factors and consequences foralcohol use and problems. Clin Psychol Rev. 2004;24:981–1010.
4. Britton PC. The relation of coping strategies to alcohol consumption and alcohol-related consequences in a college sample. Addict Res & Theory. 2004;12:103–14.
5. Babor TF, Higgins-Biddle JC, Monteiro MG. AUDIT: The Alcohol Use DisordersIdentification Test. World Health Organization; 2001.
6. Haynes SG, Baker EE. Type A behavior and the ten year incidence of coronaryheart disease in the Framinhgam Heart Study. Activ Nerv Sup. 1982;3:57–77.
7. Hughes ME, Waite LJ, Hawkley LC, et al. A short scale for measuring lonelinessin large surveys. Res Aging. 2004;26:655–72.
8. Ruiz FJ, Langer AI, Luciano C, et al. Measuring experiential avoidance andpsychological inflexibility: the Spanish version of the Acceptance and ActionQuestionnaire-II. Psicothema. 2013;25:123–9.
9. Scheier MF, Wrosch C, Baum A, et al. The Life Engagement Test: assessing pur-pose in life. J Behavl Med. 2006;29:291–8.
10. Remor E. Psychometric properties of a European Spanish version of the PerceivedStress Scale (PSS). Span J Psychol. 2006;9:86–93.
11. Wingenfeld K, Schneider A, Brähler E. A 4-item measure of depression andanxiety: validation and standardization of the Patient Health Questionnaire-4(PHQ-4) in the general population. J Affect Disord. 2010;122:86–95.
12. Dolan P, Layard R, Metcalfe R. Measuring subjective well-being for pub-lic policy. Office for National Statistics. 2011. Available at: http://cep.lse.ac.uk/pubs/download/special/cepsp23.pdf.
13. Wilsnack RW, Wilsnack SC, Kristjanson AF, et al. Gender and alcohol con-sumption: patterns from the multinational GENACOES project. Addiction.2009;104:1487–500.
14. Anthenelli RM. Overview: stress and alcohol use disorders revisited. AlcoholResearch. 2012;34:386–90.
15. Luoma J, Drake CE, Kohlenberg BS, et al. Substance abuse and psychological flex-ibility: the development of a new measure. Addict Res Theory. 2011;19:3–13.