pre‐sidedress nitrate soil testing to manage nitrogen fertility in irrigated corn in a semi‐arid...
TRANSCRIPT
This article was downloaded by: [University of Cambridge]On: 20 December 2014, At: 20:02Publisher: Taylor & FrancisInforma Ltd Registered in England and Wales Registered Number:1072954 Registered office: Mortimer House, 37-41 Mortimer Street,London W1T 3JH, UK
Communications in SoilScience and Plant AnalysisPublication details, including instructions forauthors and subscription information:http://www.tandfonline.com/loi/lcss20
Pre‐sidedress nitrate soiltesting to manage nitrogenfertility in irrigated corn ina semi‐arid environmentD. E. Spellman a , A. Rongni a , D. G. Westfall a
, R. M. Waskom a & P. N. Soltanpour aa Soil and Crop Sciences Department , ColoradoState University , Fort Collins, CO, USAPublished online: 11 Nov 2008.
To cite this article: D. E. Spellman , A. Rongni , D. G. Westfall , R. M. Waskom& P. N. Soltanpour (1996) Pre‐sidedress nitrate soil testing to manage nitrogenfertility in irrigated corn in a semi‐arid environment, Communications in SoilScience and Plant Analysis, 27:3-4, 561-574, DOI: 10.1080/00103629609369577
To link to this article: http://dx.doi.org/10.1080/00103629609369577
PLEASE SCROLL DOWN FOR ARTICLE
Taylor & Francis makes every effort to ensure the accuracy of allthe information (the “Content”) contained in the publications on ourplatform. However, Taylor & Francis, our agents, and our licensorsmake no representations or warranties whatsoever as to the accuracy,completeness, or suitability for any purpose of the Content. Anyopinions and views expressed in this publication are the opinionsand views of the authors, and are not the views of or endorsed byTaylor & Francis. The accuracy of the Content should not be reliedupon and should be independently verified with primary sources ofinformation. Taylor and Francis shall not be liable for any losses, actions,

claims, proceedings, demands, costs, expenses, damages, and otherliabilities whatsoever or howsoever caused arising directly or indirectlyin connection with, in relation to or arising out of the use of the Content.
This article may be used for research, teaching, and private studypurposes. Any substantial or systematic reproduction, redistribution,reselling, loan, sub-licensing, systematic supply, or distribution in anyform to anyone is expressly forbidden. Terms & Conditions of accessand use can be found at http://www.tandfonline.com/page/terms-and-conditions
Dow
nloa
ded
by [
Uni
vers
ity o
f C
ambr
idge
] at
20:
02 2
0 D
ecem
ber
2014
COMMUN. SOIL SCI. PLANT ANAL., 27(3&4), 561-574 (1996)
PRE-SIDEDRESS NITRATE SOIL TESTING TO MANAGENITROGEN FERTILITY IN IRRIGATED CORN IN A SEMI-ARIDENVIRONMENT
D. E. Spellman, A. Rongni, D. G. Westfall, R. M. Waskom, and P.N. Soltanpour
Soil and Crop Sciences Department, Colorado State University, Fort Collins, COUSA
ABSTRACT: The Pre-sidedress Soil Nitrate Test (PSNT) has shown promise inthe humid eastern United States as an effective tool for predicting nitrogen (N)fertilizer needs of corn (Zea mays L.). The purpose of this three-year study was toevaluate the PSNT under irrigated conditions of the semi-arid western UnitedStates. The specific objectives were to determine the critical nitrate-nitrogen(NO3-N) concentration range at the 6-leaf (V6) growth stage of corn and the bestsoil sampling position and depth. Experiments were conducted in farmers' cornfields selected for low residual soil NO3-N levels. Four pre-plant main plot N rates(0, 47, 90, and 134 kg N/ha) and two subplot sidedress N rates (0 and 67 kg N/ha)were used. Soil was sampled at the V6 growth stage (PSNT) for NO3-N analysis.Soil samples were collected from 0-30 and 0-60 cm depths from three positionsrelative to the corn plants: in the row, on the shoulder of the row, and in the bottomof the furrow. There was a good correlation between PSNT soil NO3-N concen-trations and percent relative yield (r2 = 0.58). Composite soil samples from thefurow and shoulder positions resulted in a higher correlation between PSNTNO3-N and percent (%) relative yield. The results showed a critical PSNT NO3-Nconcentration range of 13-15 mg/kg for 0-30 cm sampling depth. This criticalPSNT concentration range is substantially lower than the 21 mg/kg suggested in thehumid region of the United States. The reason for the difference may be due to thehigher concentrations of subsoil (60-120 cm depth) N03-N found in many soilsunder irrigated conditions in the semi-arid west. Our soils are not tile drained orsubject to leaching during the winter or spring.
561
Copyright © 1996 by Marcel Dekker, Inc.
Dow
nloa
ded
by [
Uni
vers
ity o
f C
ambr
idge
] at
20:
02 2
0 D
ecem
ber
2014
562 SPELLMAN ET AL.
INTRODUCTIONCrop production has been linked with water quality problems in irrigated areas
due to leaching of NO3 into the groundwater. Muir et al. (1973) showed that NO3concentration in groundwater was positively correlated with irrigation well densityand N fertilizer use. Schepers et al. (1991) demonstrated that groundwater NO3levels were positively correlated with preplant residual N in the surface 90 cm ofsoil in the Platte River basin in Nebraska. They also reported that corn farmers inthat region were routinely over-applying fertilizer N to ensure maximum yield,indicating the need for new N fertilizer recommendation procedures.
Nitrogen fertilizer recommendations for irrigated com in Colorado are currentlybased on the farmer's yield goal, residual soil NO3-N level, soil organic matter,internal N requirements, N available from legumes or manure, and other parameters(Mortvedt et al., 1994). Samples for residual soil NO3-N are typically taken in thefall or early spring before planting. However, the majority of N uptake by the cornplant does not occur until mid-summer. Mineralization, denitrification, and NO3leaching all can significantly change soil N status between preplant soil testing andthe period of maximum uptake. Therefore, a more accurate and reliable techniquewould be helpful to assist producers in evaluating soil NO3-N availability at thetime of maximum N uptake when N availability is critically balanced betweenhaving enough to meet plant needs, yet not allowing excess soil NO3 that could beleached during irrigation.
Magdoff et al. (1984) first proposed a Pre-sidedress Soil Nitrate Test (PSNT)to improve N fertilizer recommendations in the eastern United States. The PSNThas also been shown to be an effective tool to improve the efficiency of N fertilizermanagement in the humid eastern United States by other researchers (Blackmer etal., 1989; Fox et al., 1989; Magdoff et al., 1984 and 1990). This in-season soilNO3 testing is based on determining the NO3-N concentration in the top 30 cm ofsoil when corn is approximately 15-30 cm tall (V4 to V6 growth stage). Samplingat this stage of growth is a compromise between being early enough to allowsidedress applications of N fertilizer before the com gets too tall to allow equipmententry, and late enough to evaluate the influence of spring weather conditions on Navailability for the remainder of the season. Yield goals may also be adjusted at thistime based on plant population, insect, weed, and/or disease problems, and climatefactors. Under irrigated conditions, N fertilizer application timing is more flexible
Dow
nloa
ded
by [
Uni
vers
ity o
f C
ambr
idge
] at
20:
02 2
0 D
ecem
ber
2014
PRE-SIDEDRESS NITRATE SOIL TESTING 563
since N can be injected into the irrigation water throughout the growing season.Fertigation is a common practice under center pivot irrigation and is often practicedunder furrow irrigated conditions as well. However, fertigation under frrrowirrigation should only be practiced when tail water does not leave the farm or enterother drainage ditches or streams.
An in-season soil test (PSNT) could guide producers in making N managementdecisions, thereby preventing application of unnecessary N fertilizer. In turn, thiswill reduce potential groundwater contamination due to NO3-N leaching whilemaximizing yields and profits. In addition to proper N management, irrigationefficiency must be improved to prevent leaching of NO3-N into our groundwater.
The original research in eastern United States (Magdoff et al., 1984) establisheda PSNT critical level of 36 kg N/ha in the top 30 cm of soil. Later, Magdoff et al.(1990) established a critical range of 20-30 mg/kg NO3-N. Blackmer et al. (1989)reported that 82% of corn yield variability could be explained by soil N03-N levelsusing PSNT and suggested a critical NO3-N level of 21 mg/kg. Fox et al. (1989)concluded the PSNT would accurately separate N-responsive from nonresponsivefields, but could not predict N fertilizer sidedress rates. The PSNT is beingpromoted for adoption by farmers in the humid eastern United States, but itsapplicability to irrigated agriculture in the semi-arid west has not been investigated.
The hypothesis we tested is that the use of PSNT will improve N fertilizerrequirement prediction accuracy, resulting in reduced NO3 leaching while sus-taining high yields and profitability. The specific objectives were to determine: (1)the critical soil NO3 range at the V6 growth stage, and (2) the best position anddepth for PSNT sampling under irrigated conditions.
MATERIALS AND METHODS
Experiments were conducted in 15 corn fields during 1992, 1993, and 1994
within farmers' fields and managed by farmers, except for N treatment establish-
ment and grain harvest. This resulted in a wide range of irrigation efficiencies,
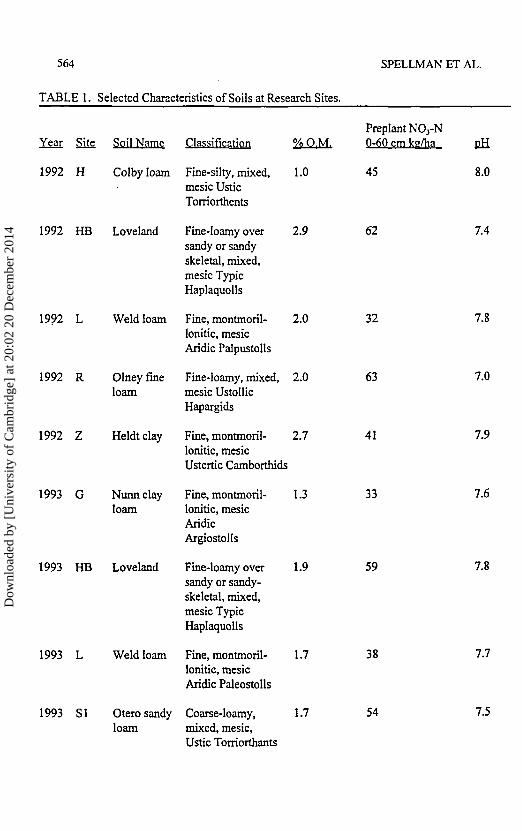
management, corn varieties, soil types, and other factors. Selected soil charac-
teristics are shown in Table 1. Fields were sampled to a depth of 3 m or to the depth
of a restrictive layer in late fall or early spring to determine the initial soil N03-N
concentration before corn planting. Fields that had relatively low residual soil
N03-N (less than 10 mg/kg) in the surface 30 cm were selected to enhance the
probability of a response to the N fertilizer treatments.
Dow
nloa
ded
by [
Uni
vers
ity o
f C
ambr
idge
] at
20:
02 2
0 D
ecem
ber
2014
564
TABLE 1.
Year
1992
1992
1992
1992
1992
1993
1993
1993
1993
Site
H
HB
L
R
Z
G
HB
L
SI
Selected Characteristics of Soils at Research Sites.
Soil Name
Colby loam
Loveland
Weld loam
Olney fineloam
Heldt clay
Nunn clayloam
Loveland
Weld loam
Otero sandyloam
Classification
Fine-silty, mixed,mesic UsticTorriorthents
Fine-loamy oversandy or sandyskeletal, mixed,mesic TypicHaplaquolls
Fine, montmoril-lonitic, mesicAridic Palpustolls
Fine-loamy, mixed,mesic UstollicHapargids
Fine, montmoril-lonitic, mesicUstertic Camborthid:
Fine, montmoril-lonitic, mesicAridicArgiostolls
Fine-loamy oversandy or sandy-skeletal, mixed,mesic TypicHaplaquolls
Fine, montmoril-lonitic, mesicAridic Paleostolls
Coarse-loamy,mixed, mesic,Ustic Torriorthants
% P.M.
1.0
2.9
2.0
2.0
2.7
1.3
1.9
1.7
1.7
SPELLMAN
Preplant NO3-N0-60 cm k?/ha
45
62
32
63
41
33
59
38
54
ETAL.
EH
8.0
7.4
7.8
7.0
7.9
7.6
7.8
7.7
7.5
Dow
nloa
ded
by [
Uni
vers
ity o
f C
ambr
idge
] at
20:
02 2
0 D
ecem
ber
2014
PRE-SIDEDRESS NITRATE SOIL TESTING
TABLE l.(Cont'd.)
565
Year Site Soil Name ClassificationPreplant NCyN
% P.M. 0-60 cm kg/ha
1993 S2 Olney loamy Fine-loamy, mixed 1.5sand mesic Ustollic
Haplargids
1994 AL Fort Collins Fine-loamy, mixed, 2.1loam mesic Ustollic
Haplargids
1994 AS Fort Collins Fine-loamy, mixed, 2.2loam mesic Ustollic
Haplargids
1994 HB Loveland Fine-loamy over 2.5sandy or sandyskeletal, mixed,mesic TypicHaplaquolls
1994 L Weld loam Fine, montmoril- 1.7lonitic, mesic AridicPaleostolls
1994 SI Otero sandy Coarse-loamy, 1.6loam mixed, mesic
Ustic Torriorthents
83
80
54
36
7.6
8.0
7.3
65
37
7.7
7.8
A randomized block design was used with a split-plot treatment arrangement.
The main plot was preplant N rate, and the subplot sidedress N application rate,
with the main plot replicated four times. Liquid fertilizer, urea ammonium nitrate
(UAN), was applied on the soil surface using a backpack sprayer and immediately
incorporated into the soil by a cultivation operation to minimize volatilization of
ammonia. The preplant main plot N rates were 0, 44, 90, and 134 kg/ha. The
sidedress subplot rates were 0 and 65 kg N/ha. The main plot was 8 corn rows
Dow
nloa
ded
by [
Uni
vers
ity o
f C
ambr
idge
] at
20:
02 2
0 D
ecem
ber
2014
566 SPELLMAN ET AL.
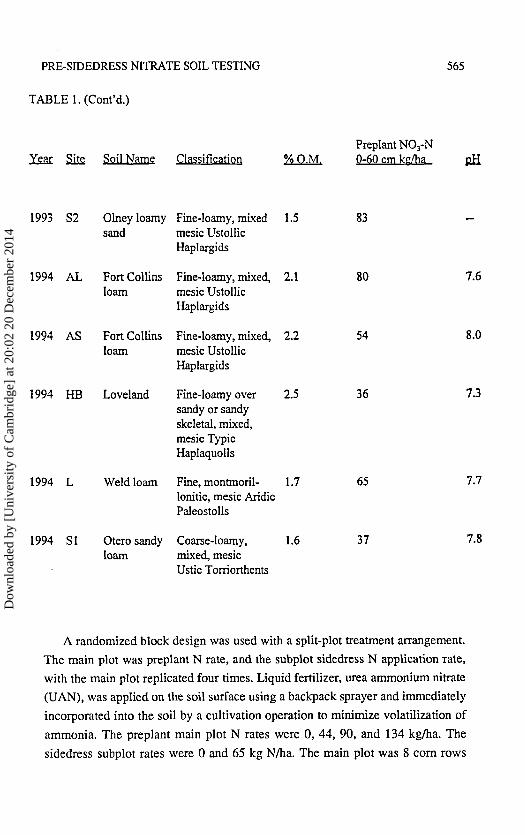
wide (6 m) and 15 m long. The subplot was four corn rows wide by 15 m long.Three soil cores to 60 cm depth, in 30 cm increments, were collected from threepositions from each main plot when the corn was approximately 30 cm high (V6growth stage). The three sampling positions were: (1) middle of the irrigationftrrrow, (2) shoulder of the furrow, and (3) top of the row between corn plants(Figure 1). No irrigation occurred prior to sampling. After soil sampling (at V6growth stage), the subplot N treatment was applied. The total fertilizer N ratesvaried from 0 to 201 kg N/ha.
Soil samples were air-dried immediately after collection, ground, and sievedthrough a 2-mm screen. Soil NO3 was extracted with 2M KC1 using a 5:1 solution/soil ratio and filtered through Whatman No. 5 paper. The NO3-N concentrationswere determined on a flow injection autoanalyzer. Grain yield was determined atmaturity on 12 m lengths of the two middle rows of each subplot. Total biomassproduction was determined before harvest using a subsample 1-m long from bothcenter rows of each subplot.
Data were analyzed for all locations using standard analysis of variancetechnique (SAS, 1987) to evaluate the effect of preplant N rates and sidedress Nrates on corn grain yield at a 0.10 significance level. A general linear model wasused to determine correlation between soil NO3-N concentrations at differentsampling positions and the percent relative grain yield. The preplant N rate yieldswere compared to the sidedressed yields using LSD.
The Cate-Nelson analysis of variance method (Nelson and Anderson, 1977)was used to divide the PSNT soil NO3-N concentrations into two or three classes,according to yield response to preplant N fertilizer in order to determine criticalNO3-N ranges for in-season soil sampling. These lines were developed by theCate-Nelson three-way analysis of variance. The vertical lines define the respon-sive, marginal, and non-responsive ranges of the 3-way analysis of variance andcritical level for the 2-way analysis of variance. The intersection of the vertical andhorizontal lines are placed to minimize the number of observations in the upper leftquadrant and the lower right quadrant. The observations in the upper left quadrantoverestimate the fertilizer N required while the observations in the lower rightquadrant underestimate the fertilizer requirement. Quadratic regressions were alsodeveloped between relative yield and PSNT NO3-N. Data from 14 sites were usedin the above analyses.
Dow
nloa
ded
by [
Uni
vers
ity o
f C
ambr
idge
] at
20:
02 2
0 D
ecem
ber
2014
PRE-SIDEDRESS NITRATE SOIL TESTING 567
FIGURE 1. PSNT Row, Shoulder, and Furrow Sampling Positions with Respect tothe Corn Row at 0-30 and 30-60 cm Depths.
RESULTS AND DISCUSSIONA direct relationship was observed between preplant N application rate and soil
NO3 levels at PSNT (Table 2). As N rate increased, soil NO3-N increased to amaximum of 22.3 mg/kg for the shoulder position at 0-30 cm depth. The maximumsoil N03-N level for the shoulder position at 0-60 cm depth was 14.9 mg/kgN03-N at the 134 kg N/ha fertilizer rate. This lower value was expected sincesurface soils are known to have higher residual NO3 and the preplant N fertilizerwas broadcast and incorporated to a maximum depth of 20 cm. The standarddeviation of soil NO3-N was relatively large at 0-30 cm depth, approaching 50% ofthe absolute value. Without any applied preplant N (0 N rate), the standarddeviation ranged between 4.5 to 5.8 mg/kg NO3-N, depending upon samplingposition. At an N rate of 134 kg/ha, the standard deviation ranged from 7.9 to 10.9mg/kg NO3-N. When sampling depth was increased to 60 cm, the standarddeviation decreased.
Dow
nloa
ded
by [
Uni
vers
ity o
f C
ambr
idge
] at
20:
02 2
0 D
ecem
ber
2014
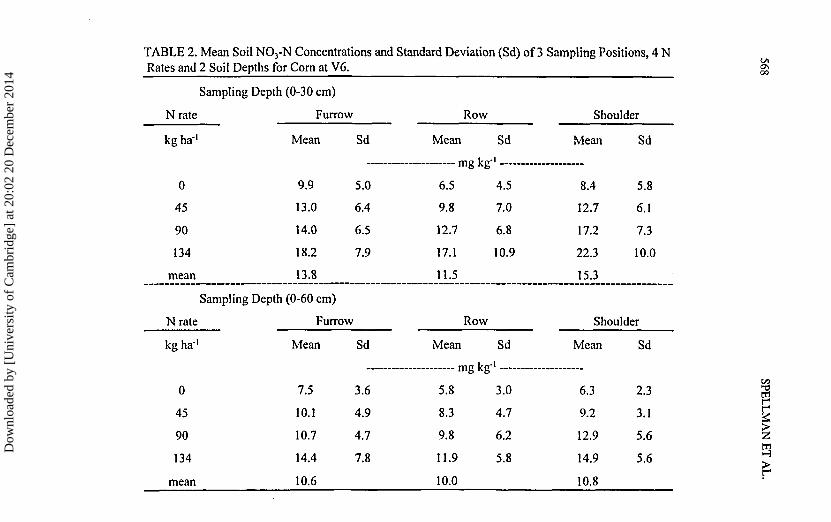
TABLE 2. Mean Soil NO3-N Concentrations and Standard Deviation (Sd) of 3 Sampling Positions, 4 NRates and 2 Soil Depths for Corn at V6.
N rate
kg ha"1
0
45
90
134
mean
Nrate
kg ha"1
0
45
90
134
mean
Sampling Depth (0-30 cm)
Furrow
Mean
9.9
13.0
14.0
18.2
13.8
Sampling Depth (0-60 cm)
Furrow
Mean
7.5
10.1
10.7
14.4
10.6
Sd
5.0
6.4
6.5
7.9
Sd
3.6
4.9
4.7
7.8
Row
Mean
mg Kg
6.5
9.8
12.7
17.1
11.5
Row
Mean
mg kg-
5.8
8.3
9.8
11.9
10.0
Sdi
4.5
7.0
6.8
10.9
Sd
3.0
4.7
6.2
5.8
Shoulder
Mean
8.4
12.7
17.2
22.3
15.3
Sd
5.8
6.1
7.3
10.0
Shoulder
Mean
6.3
9.2
12.9
14.9
10.8
Sd
2.3
3.1
5.6
5.6
>
iTA
L.
Dow
nloa
ded
by [
Uni
vers
ity o
f C
ambr
idge
] at
20:
02 2
0 D
ecem
ber
2014
PRE-SIDEDRESS NITRATE SOIL TESTING 569
A Cate-Nelson two-way analysis of variance (Nelson and Anderson, 1977)comparing relative grain yield and PSNT soil NO3-N revealed that the criticalconcentration level ranged from 6 to 15 mg/kg, depending on sampling position anddepth (Table 3). Only the 0-60 m depth soil NO3 measurements from 1993 and1994 were available for use in the Cate-Nelson analysis of variance. The criticalconcentrations for the 0-30 cm depth ranged from 9-15 mg/kg, depending onsampling position, and were higher and had more variability than the 0-60 cm (6-9mg/kg) samples. These lower values for the 0-60 cm samples are expected since thesurface 0-30 cm sampling depth has a higher residual NO3-N concentration andvariability and the preplant N fertilizer was broadcast and incorporated to amaximum depth of 20 cm. The r2 also varied depending on soil sampling positionand depth.
When considering only one sampling position and the 0-30 cm sampling depth,the highest correlation with relative corn yield occurred with the furrow samplingposition (r2 = 0.54). However, with the 0-60 cm sampling depth the shoulder pro-duced the highest correlation (r2 = 0.51). The reason for the lack of agreementbetween positions within depths is not known. The row sampling position cor-relation was lowest for both sampling depths.
When various sampling position combinations were compared (Table 3),combination of the furrow and shoulder position sampling appears to be the bestcompromise for both the 0-30 and 0-60 cm sampling depths with r2 values of 0.47and 0.56, respectively. The reason we come to this conclusion is that no irrigationhad occurred by PSNT sampling. In dry years, farmers may irrigate by this time,which could result in a redistribution of soil N03-N. Cultivation may also cause aredistribution of soil NO3-N. Our research sites included both fields that had andhad not been cultivated. It is felt that a combination sampling of the shoulder androw would be more reliable over the wide range of managements and environmentsunder which this test will be used. Consequently, all further discussion in thispaper uses a composite of the furrow and shoulder sampling positions.
The quadratic relationships between relative corn yield and soil NO3-N concen-tration (PSNT) at 0-30 cm and 0-60 cm for all sites and preplant N treatments areshown in Figure 2 and Figure 3 (r2 = 0.58 and 0.56, respectively). There is aconsiderable amount of variability associated with this relationship. Large vari-ability in soil NO3 in farmers' fields is not unexpected because these soils havebeen managed under intensive row crop production and represent a range of corn
Dow
nloa
ded
by [
Uni
vers
ity o
f C
ambr
idge
] at
20:
02 2
0 D
ecem
ber
2014
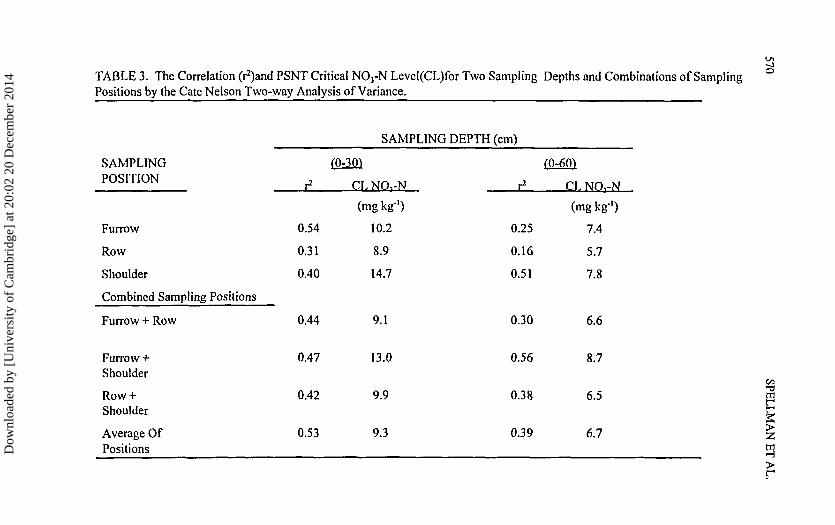
TABLE 3. The Correlation (r^and PSNT Critical NO3-N Level(CL)for Two Sampling Depths and Combinations of SamplingPositions by the Cate Nelson Two-way Analysis of Variance.
SAMPLINGPOSITION
Furrow
Row
Shoulder
Combined Sampling Positions
Furrow + Row
Furrow +Shoulder
Row +Shoulder
Average OfPositions
0.54
0.31
0.40
0.44
0.47
0.42
0.53
SAMPLING
0-301
CL NO rN
(mgkg-1)
10.2
8.9
14.7
9.1
13.0
9.9
9.3
DEPTH (cm)
r2
0.25
0.16
0.51
0.30
0.56
0.38
0.39
(0-60")
CL NO rN
(mg kg"1)
7.4
5.7
7.8
6.6
8.7
6.5
6.7
C/5PELLW1A
NE
T1Dow
nloa
ded
by [
Uni
vers
ity o
f C
ambr
idge
] at
20:
02 2
0 D
ecem
ber
2014

PRE-SIDEDRESS NITRATE SOIL TESTING 571
110
100
e 902o
5
a:
80
•S 70
60
50
Y = 51.1 + 3.9 x NO -N - 0.08 x NO-N '3 3
r =0.58
10 15 20 25PSNT Soil NO-N(mg kg"1)
30 35
FIGURE 2. Relationship Between 0-30 cm Soil NCyN Sampled at PSNT and Percent Grain Yield of Com with Cate-Nelson Three-way Analysis of Variance (r*=0.52). (PSNT NOj-N values are composites of the furrow and shoulder)
110
100
^ 90
>80
I 70
60
5010
Y = 50.7 + 4.9 x NO -N - 0.12 x NO -N 2
3 3
r2= 0.56
15 20 25 30PSNT Soil NO-N(mg kg\)
FIGURE 3. Relationship Between 0-60 cm Soil N0,-N Sampled at PSNT and Percent Grain Yield of Com with Cate-Nelson Three-way Analysis of Variance (^=0.58). (PSNT NOj-N values are composites of the furrow and shoulder)
Dow
nloa
ded
by [
Uni
vers
ity o
f C
ambr
idge
] at
20:
02 2
0 D
ecem
ber
2014
572 SPELLMAN ET AL.
hybrids, soil textures, irrigation efficiencies, and managements. The relationshipdoes show that soil NO3 at PSNT is a reasonable predictor of corn yield. In ourstudies, optimum N rate yields ranged from about 7,200 to 10,800 kg grain/ha.
The critical concentrations of 13-15 mg/kg for 0-30 cm and 9-15 mg/kg for0-60 cm at a relative yield of 90% (horizontal line) are shown in Figures 2 and 3.The three-way method revealed that 89% of the data points fall in the upper rightand lower left quandrants for 0-30 cm, 90% for 0-60 cm depth. This success rate issimilar to that reported by other researchers.
When using a quadratic model to estimate the critical level, 14 mg/kg and 11mg/kg were established for 0-30 cm and 0-60 cm sampling depths. Both of thesecritical levels fall within the Cate-Nelson three-way analysis of variance criticalN03-N ranges.
An LSD test was used to determine if the sidedress application of 67 kg/ha of Nfertilizer (subplot treatment) at the V6 stage affected corn grain yield. The criticalconcentration ranges for both 0-30 cm and 0-60 cm were used to determine ourability to predict the yield response to N fertilizer. There were a total of 56observations (individual treatments) that could be used to evaluate the 0-30 cmdepth. Of the 35 observations that were below 13 mg/kg, 19 (54%) responded toadditional fertilizer N (Table 4). There were 21 observations above 15 mg/kg andnone responded to additional fertilizer N.
When considering both responsive and non-responsive PSNT treatments, thedata in Table 4 demonstrate that our PSNT critical NO3-N range predicted theresponse to sidedress N 71% of the time for the 0-30 cm sampling depth and only44% of the time for the 0-60 cm sampling depth. Increasing the sampling depth to60 cm actually resulted in a large decrease in prediction accuracy and increased thecritical range. Thus, the reason we recommend a 0-30 cm sampling depth. Veryimportant to these findings is that our critical concentration ranges never predicted a"no response" when a response actually occurred. Consequently, under our semi-arid environment, producers will not suffer yield losses from following our side-dress suggestions based upon our PSNT critical NO3-N ranges. Also, excessivesidedress N applications to soils containing high PSNT NO3-N levels will beeliminated by following these guidelines.
CONCLUSIONS
The PSNT appears to be an excellent tool for managing N under irrigated corn
in Colorado and other semi-arid environments. The PSNT served as a good guide
Dow
nloa
ded
by [
Uni
vers
ity o
f C
ambr
idge
] at
20:
02 2
0 D
ecem
ber
2014
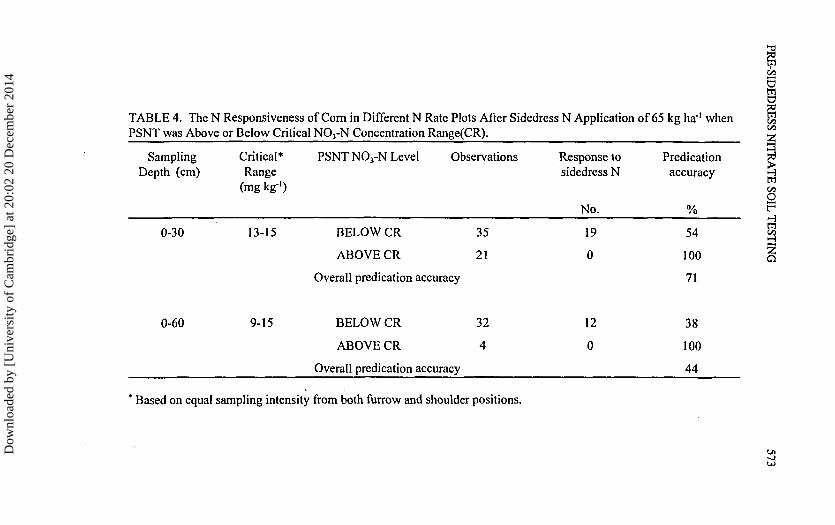
TABLE 4. The N Responsiveness of Corn in Different N Rate Plots After Sidedress N Application of 65 kg ha"1 whenPSNT was Above or Below Critical N03-N Concentration Range(CR).
' Based on equal sampling intensity from both furrow and shoulder positions.
o
50
g@
SamplingDepth (cm)
0-30
0-60
Critical*Range
(mg kg1)
13-15
9-15
PSNT N03-N Level Observations
BELOW CR
ABOVE CR
Overall predication accuracy
BELOW CR
ABOVE CR
Overall predication accuracy
35
21
32
4
Response tosidedress N
No.
19
0
12
0
Predicationaccuracy
%
54
100
71
38
100
44
coOIL
TE
ST
a
Dow
nloa
ded
by [
Uni
vers
ity o
f C
ambr
idge
] at
20:
02 2
0 D
ecem
ber
2014
574 SPELLMAN ET AL.
to determine the need for sidedress N. We found the critical PSNT soil test
concentration range to be from 13-15 mg NO3-N/kg for 0-30 cm sampling depth.
This range is lower than the critical concentrations identified by previous work in
the humid United States (20-30 mg/kg by Magdoff et al., 1990; 20-25 mg/kg by
Blackmer et al., 1992; Fox et al., 1992). One possible explanation for the our lower
critical range is the higher residual NO3-N at deeper soil depths. Also, none of our
fields are tile drained and subject to leaching during the winter/spring. We
recommend collecting equal numbers of soil samples from the furrow and shoulder
and a sampling depth of 0-30 cm.
REFERENCES:
Blackmer, A. M., D. Potter, M. E. Cerrato, and J. Webb. 1989. Correlationsbetween soil nitrate concentrations in late spring and corn yields in Iowa. J.Prod. Agric. 2:103-109.
Fox, R. H., G. W. Rother, K. V. Iversen, and W. P. Piekielek. 1989. Soil andtissue nitrate tests compared for predicting soil nitrogen availability to corn.Agron. J. 81:971-974.
Magdoff, F. R., W. E. Jokela, R. H. Fox, and G. F. Griffin. 1990. A soil test fornitrogen availability in the northeastern United States. Commun. Soil Sci. PlantAnal. 21:1103-1115.
Magdoff, F. R., D. Ross, and J. Amadon. 1984. A soil test for nitrogen avail-ability to corn. Soil Sci. Soc. Amer. J. 48:1301-1304.
Mortvedt, J. J., D. G. Westfall, and R.L. Croissant. 1994. Fertilizer suggestionsfor corn. Colorado State Coop. Ext. Sta. 0.538, Ft. Collins, CO.
Muir, J., E. C. Seim, and R. A. Olson. 1973. A study of factors influencing thenitrogen and phosphorus contents of Nebraska waters. J. Environ. Qual.2:466-470.
Nelson, L. A. and R. L. Anderson. 1977. Partitioning soil test-crop response pro-bability, pp. 19-39. IN: T.R. Peck (ed.) Soil Testing: Correlating and Inter-preting the Analytical Results. American Society of Agronomy, Madison, WI.
Ronaghi, A. 1993. Improving fertilizer N prediction and management for irrigatedcorn. Ph.D. diss. (Diss. Abstr. 93:3910). Colorado State University, FortCollins, CO.
SAS Institute. 1987. SAS User's Guide. SAS Institute, Inc., Cary, NC.
Schepers, J. S., M. G. Moravek, E. E. Alberts, and K. D. Frank. 1991. Maizeproduction impacts on groundwater quality. J. Environ. Qual. 20:12-16.
Dow
nloa
ded
by [
Uni
vers
ity o
f C
ambr
idge
] at
20:
02 2
0 D
ecem
ber
2014