presented by dr. paul cottrell company: reykjavik
TRANSCRIPT

Utilizing Topographic Finance to Understand Volatility
Presented ByDr. Paul CottrellCompany: Reykjavik

Introduction Topographic finance is the study
of surfaces to describe financial systems in multiple dimensions.
The problem with finance and economicsWhat is actually governing the
price dynamics?Price dynamics are behavioral
and do not exhibit a rational maximization of a utility function (Mandelbrot and Hudson, 2004)
How to understand the inherited uncertaintyVolatility dynamics
Literature ReviewReflexivity can be defined as a theory
describing a feedback mechanism on a particular system, whereby certain conditions might magnify effects or diminish them (Cottrell and Ungolo, 2015).
By utilizing symbols to represent direction and certain factors one can describe price dynamic in currency markets (Soros, 2003).
Irrational investors can be framed as a source of risk by defining the amount of holdings of an asset for a rational and irrational investor (Thaler, 1993).
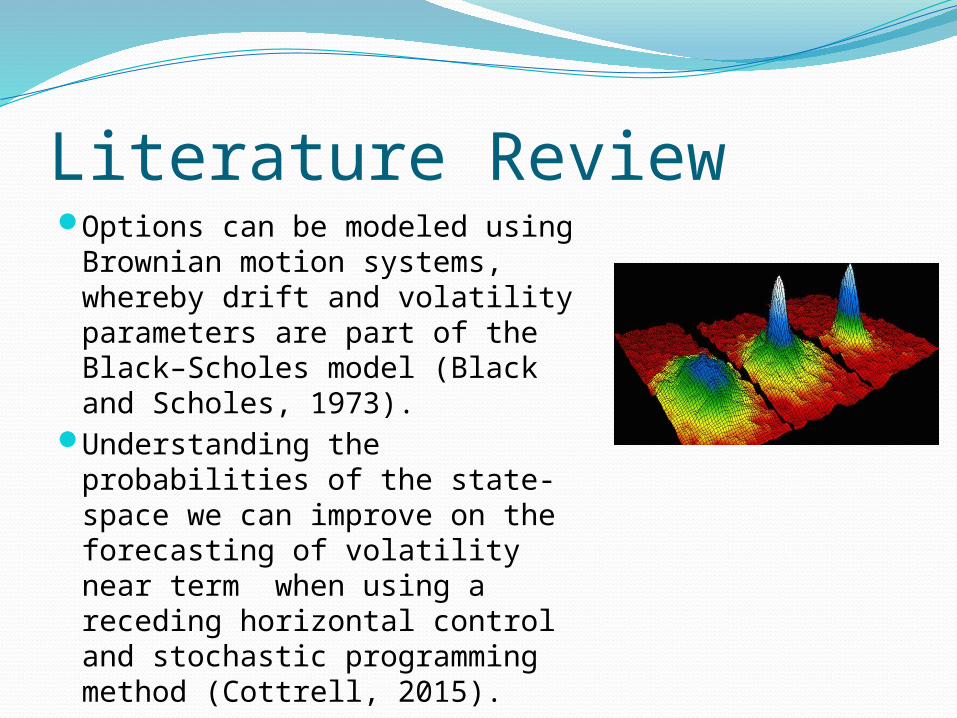
Literature ReviewOptions can be modeled using
Brownian motion systems, whereby drift and volatility parameters are part of the Black–Scholes model (Black and Scholes, 1973).
Understanding the probabilities of the state-space we can improve on the forecasting of volatility near term when using a receding horizontal control and stochastic programming method (Cottrell, 2015).
MethodologyLongitudinal studyIndependent Variables
Drift and TimeDependent Variable
VolatilitySamples
S&P 500, West Texas Intermediate (WTI), and 10-year Treasury
Bi-harmonic surfacing is different than volatility surfacing of options.

The DatasetTime Series
Daily closings from November 3rd , 2014 to February 27th, 2015.
From Federal Reserve Economic Data (FRED)85 observations for each asset in consideration.
ProcedureCalculate
Log-returns (5-day moving window) Volatility (5-day moving window) Drift (5-day moving window)
Surface dataset utilizing 80 data points.

Results for S&P500

Results for WTI

Results for 10-Year Treasury

ConclusionPrice dynamics can be described and forecasted
utilizing a bi-harmonic spline interpolation methodology.
PDF and CDF graphs can help with determining the probability of changes in volatility and drift.
Future StudiesUtilizing GARCH methods in improving volatility
prediction.Develop methods to improve volatility spiking
Probabilities between certain regime switchesUtilization of artificial intelligence
Using cortical computing for learning to predict price dynamics.

ReferenceBlack, F., & Scholes, M. (1973). The valuation of options and corporate
liabilities. Journal of Political Economy, 81(1), 637–654.
Cottrell, P. (2015). Dynamically hedging oil and currency futures using receding horizontal control and stochastic programming (Doctoral dissertation).
Mandelbrot, B. B., & Hudson, R. L. (2004). The (mis)behavior of markets: A fractal view of risk, ruin, and reward. New York, NY: Basic Books.
Soros, G. (2003). The alchemy of finance. Hoboken, NJ: John Wiley & Sons, Inc.
Thaler, R. H. (1993). Advances in behavioral finance. New York: Russell Sage Foundation.

Contact Information and PublicationsDr. Paul Cottrell
[email protected]@paulcottrell (Twitter)Paul Cottrell (YouTube)