presentation to investors - mahanagar gas · presentation to investors june, 2017. mgl : an...
TRANSCRIPT

PRESENTATION TO
INVESTORS
June, 2017

MGL : An Introduction
2
3
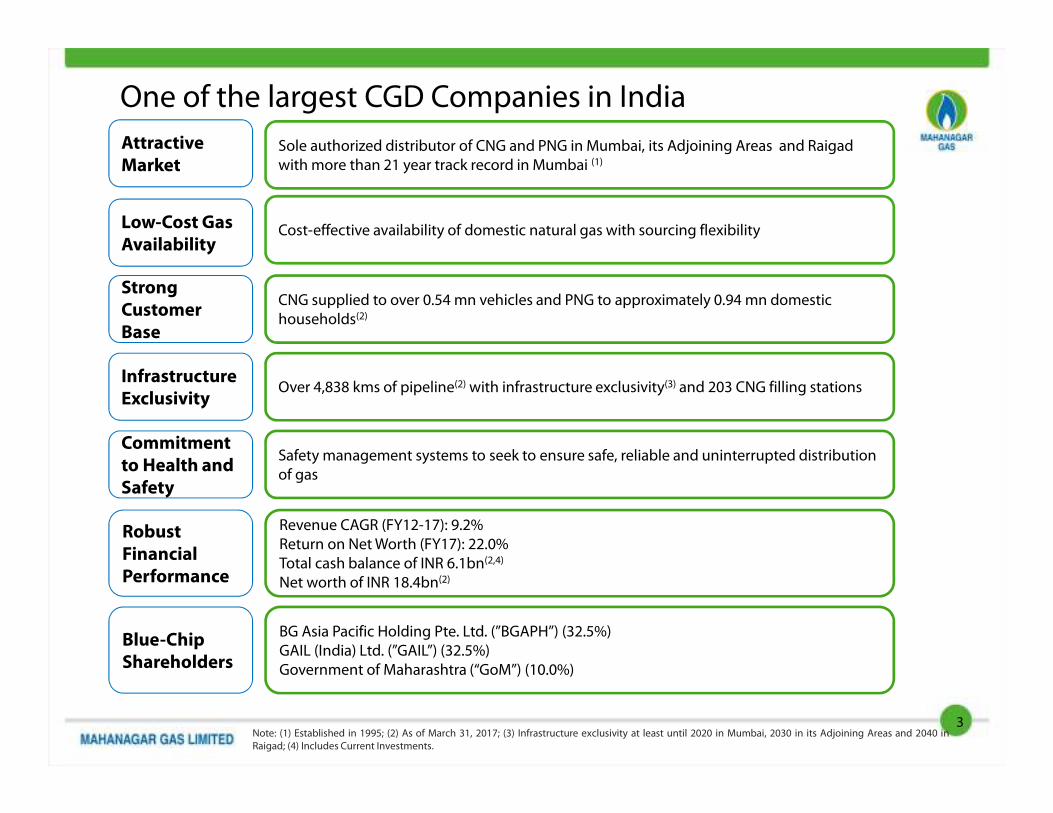
One of the largest CGD Companies in India
Attractive
MarketSole authorized distributor of CNG and PNG in Mumbai, its Adjoining Areas and Raigad
with more than 21 year track record in Mumbai (1)
Low-Cost Gas
AvailabilityCost-effective availability of domestic natural gas with sourcing flexibility
Infrastructure
ExclusivityOver 4,838 kms of pipeline(2) with infrastructure exclusivity(3) and 203 CNG filling stations
Robust
Financial
Performance
Revenue CAGR (FY12-17): 9.2%
Return on Net Worth (FY17): 22.0%
Total cash balance of INR 6.1bn(2,4)
Net worth of INR 18.4bn(2)
Blue-Chip
Shareholders
BG Asia Pacific Holding Pte. Ltd. (”BGAPH”) (32.5%)
GAIL (India) Ltd. (”GAIL”) (32.5%)
Government of Maharashtra (“GoM”) (10.0%)
Commitment
to Health and
Safety
Safety management systems to seek to ensure safe, reliable and uninterrupted distribution
of gas
Strong
Customer
Base
CNG supplied to over 0.54 mn vehicles and PNG to approximately 0.94 mn domestic
households(2)
Note: (1) Established in 1995; (2) As of March 31, 2017; (3) Infrastructure exclusivity at least until 2020 in Mumbai, 2030 in its Adjoining Areas and 2040 inRaigad; (4) Includes Current Investments.

Our Journey : Record of Growth and Excellence
4
97-98 08-09 10-11 11-12 12-13 13-14 14-15 15-16 16-17
Net Worth –
INR billion 18.4
Natural gas
supply &
transportation
contract with
GAIL
150th CNG
dispensing
station
3rd CGS at
Taloja &
4th CGS at
Ambernath
110%
allocation of
domestic
gas
Listing on
NSE and BSE
200th CNG
dispensing
station
New GA
Raigad
Pipeline
PE - 2,500 km
&
Steel - 250 km
2nd CGS at
Mahape
Net Worth –
INR billion 0.76
Pipeline
PE – 3,800 km
&
Steel - 380 km
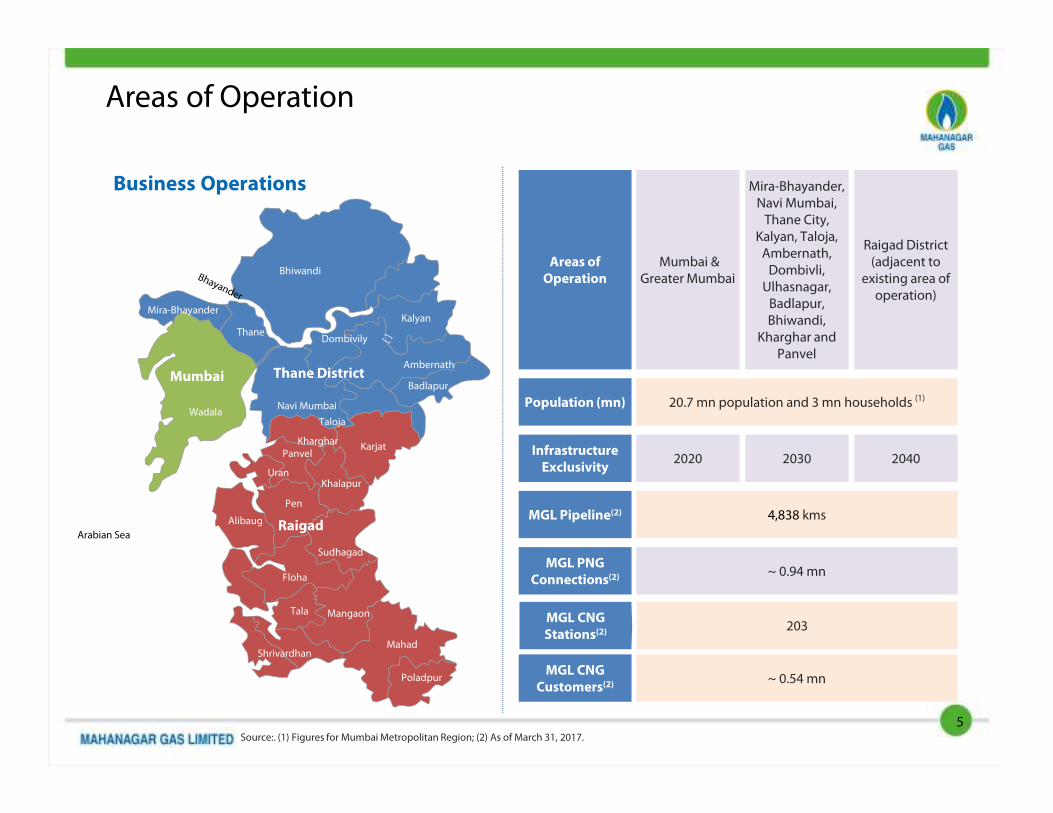
Areas of Operation
Source:. (1) Figures for Mumbai Metropolitan Region; (2) As of March 31, 2017.
Business Operations
MGL Pipeline(2) 4,838 kms
MGL PNG
Connections(2)~ 0.94 mn
MGL CNG
Stations(2)203
Areas of
Operation
Mumbai & Greater Mumbai
Mira-Bhayander, Navi Mumbai, Thane City,
Kalyan, Taloja, Ambernath, Dombivli,
Ulhasnagar, Badlapur, Bhiwandi,
Kharghar and Panvel
Raigad District (adjacent to
existing area of operation)
Infrastructure
Exclusivity2020 2030 2040
Mumbai Thane District
Raigad
Bhiwandi
Kalyan
Badlapur
Thane
Mira-Bhayander
Arabian Sea
Alibaug
Pen
Khalapur
Karjat
Taloja
KhargharPanvel
Uran
Sudhagad
Floha
Tala Mangaon
Wadala
Dombivily
Mahad
Poladpur
Shrivardhan
Navi Mumbai
Ambernath
Population (mn) 20.7 mn population and 3 mn households (1)
MGL CNG
Customers(2)~ 0.54 mn
5
MGL : Strong Fundamentals
6

The MGL Proposition
Significant Growth Potential Backed by Favorable
Industry Conditions
Significant Growth Potential Backed by Favorable
Industry Conditions�
Underpenetrated Market with Significant Potential for
Expansion�
Robust Infrastructure in Place to Support Future GrowthRobust Infrastructure in Place to Support Future Growth�
Favorable Regulatory Environment�
Cost Effective Sourcing StrategyCost Effective Sourcing Strategy�
Strong Operational and Financial PerformanceStrong Operational and Financial Performance�
Focused Growth Strategy in PlaceFocused Growth Strategy in Place�
7

Attractive Industry : Market Natural Gas and CGD
CGD Sector to Grow at a Faster Pace Post 2017 as Natural Gas becomes a
Preferred Fuel
…With Increased Government Focus
20
22
27
46
2015
2017E
2020E
2025E
Total CGD Demand (mmscmd)
CAGR 5%
CAGR 7%
CAGR 11%
• India was the third-largest energy consumer in the world after China and US in 2015
• India’s primary energy consumption has more than doubled between 2000 and 2015, reaching ~701 MToe
• India’s per capita energy consumption is one-third of the global average, indicating potentially higher
energy demand in the long-term
• Environmentally clean fuels, such as natural gas, are expected to play a dominant role in India's economic
growth in the coming years
Industry Overview
SourceBP Statistical Review of World Energy June 2016, MoPNG – Report of the Working Group on Petroleum & Natural Gas Sector 2011, ICRA Report onProspects for the CGD Sector - March 2015, India Census 2011.
Environmental Initiatives
PNG and CNG Corridor
CGD Expansion in New Cities
8

Attractive Fuel Economics
CNG Retains its Price Competitiveness vs. Other Fuels
Comparison of Alternative Fuel Costs
PNG Provides Savings with respect to Non-subsidized LPG
Energy Cost for Cylinders Number of Subsidized Cylinders
(INR / Mn Kcal) 12 9 6 0
LPG 3101 3361 3621 4141
PNG 2873 2873 2873 2873
% Difference 7% 15% 21% 31%
With gradual phasing out of subsidized LPG cylinders by
Government, consumers will be incentivized to purchase PNG due
to significant savings
Particulars INR / kg or INR / L
CNG 40.82
Diesel 60.47
Petrol 76.55
32%
diffe
rential
63%
diffe
rential
• Price Advantage
Natural gas provides economic benefits over most
alternative liquid fuels
• Fuel Efficiency
CNG vehicles typically enjoy higher fuel efficiency
• Payback Period
Lower running costs result in lower payback period
and savings
Particulars UoM
PNG INR/SCM 28.94
Light Diesel Oil INR/Ltr 32.88
Commercial
LPG
INR/Kg 54.86
~14%
diffe
rential
~37%
diffe
rential
9
Commercial PNG Favorably Priced vs. Alternate Fuels
Note: (1) Based on prices prevailing in Mumbai as on May 31, 2017

Attractive End Market Mumbai Market Size and penetration
10
Low penetration in areas of operations with
high likelihood of growth
Regulatory environment favorable for
managing profitability
533
680
220
335
Market Size (Nos.) Market Size (Vol.) Penetration (Nos.) Penetration (Vol.)
Remark : The Market size consist of alternate liquid and gaseous fuel
Industrial & Bulk
CommercialNos. & volume in ‘000 SCMD
49% penetration (vol.)
Restaurants Nos.
10000
3083
Market Size (Nos.) Penetration (Nos.)
31% penetration
CNG Vehicle and House holdsMn Nos.
1.8
3
0.540.94
30% 31%
0%
10%
20%
30%
40%
0
1
2
3
4
5
CNG Domestic PNG
In M
n.
Market Size (Mn) Penetration (Mn.) % Penetration

Diversified Sourcing Strategy
CNG & Domestic PNG Industrial / Commercial PNG
• Domestic supply agreement - MoPNG
allocates gas for entire requirement of CNG
and domestic PNG under Administered Price
Mechanism (APM) and PMT Agreements
• Allocation of 110% of consumption in
previous 6 months to be compulsorily
supplied by GAIL and to be only used for the
domestic PNG & CNG segments
• Price to be fixed on 6 monthly basis (market
linked – US$ 2.50 / mmbtu on GCV basis (1)
• Purchase of imported RLNG for industrial/
commercial PNG customers
• Mix of spot and term contracts
• Brent crude prices have recently decreased
significantly
APM Term RLNGPMT Spot RLNGSource
Suppliers
Allocation
Policy
MoPNG
• Assured supply of gas for priority sector requirement
• Priority given to CGDs under new policy
Note: (1) Applicable from October 01, 2016 to March 31, 2017.
GAIL
• GAIL
• GSPCL
• HPCL
• IOCL
• BPCL
• BGIES
• Hazira LNG
• PLL
11

1.83
1.99
2.132.25
1.9
2.03
2.08
2.2
1.5
2
2.5
FY14 FY15 FY16 FY17
Priority segment offtake/Supply Priority Sector Sales
96.3%
98%
102.4%
102.3%
Priority offtake/Supply as a % of Priority Sales
Diversified Sourcing Strategy
Priority Segment Sales (Domestic PNG + CNG) Reducing Dependence on Non APM/Spot/Term RLNG
Priority Segment Forms Majority
With revision of the MoPNG Guidelines in 2014, priority sector requirements are being met with reducing dependence on
sourcing spot RLNG
FY 17 Sales Composition
• Allocation
10% over and above the 100% requirement
• Pricing
APM price significantly lower than market price of
imported natural gas
• Distribution
Majority of MGL’s sales are from Priority Sector
12
73.9%
11.8%6.5% 7.8%
CNG Sales Domestic PNG
Sales
Commercial PNG
Sales
Industrial PNG
Sales
0.45 0.43
0.36 0.38
FY14 FY15 FY16 FY17Volume in MMSCMD

Infrastructure in place
Note: (1) As on March 31, 2017; (2) Includes purchase of fixed assets, including intangible assets, capital work in progress and capital advances;
MGL has established a widespread network and plans for expansion to enter into new areas and increase penetration in
existing areas
• Infrastructure Exclusivity
� Mumbai: Up to 2020
� Adjoining Areas: Up to 2030
� Raigad: Up to 2040
• Tariff Flexibility
� New operator can use MGL’s pipeline
network only on payment of
transportation tariff
Extensive Supply Network Built Over 20 Years (1)
Enablers
Asset Base (2)
Fixed Asset of INR 17.29 BnAverage Capex of INR 2.4 Bn
CNG Customer Base
~0.54 Mn
PNG Customer Base
~ 0.94 Mn
203 CNG filling stations
14 - MGL owned
Others – OMCs, Private Players
Pipeline and CGS
Over 4,838 kms of pipeline and 4 City Gate Stations
13

Regulatory Environment Creating Strong Barriers to Entry and
Incumbent Advantage
Regulatory tailwinds are driving sector growth, given the policies laid out by the MoPNG and PNGRB
Description Implication for MGL
AuthorizationAuthorization to lay, build, operate or
expand a CGD network
• Built in advantage for incumbent
• Authorization for Mumbai, its adjoining
areas and Raigad
Exclusivity
Infrastructure exclusivity in Mumbai and
certain Adjoining Areas, and marketing
exclusivity in Raigad
• Infrastructure exclusivity till 2020 in
Mumbai, 2030 in Adjoining areas and
2040 in Raigad
• Marketing exclusivity in Raigad valid up
to 2020
Gas Allocation
110% allocation for CNG and domestic PNG
requirements
• Ensured allocation for priority sectors
• Revenue mix for MGL
• Limited LNG requirement
Price Determination
Pricing benchmarked to market price of
alternative fuels
Ability to manage margins and pass on cost
increases to customers
Accelerated Bidding
• NITI Aayog agenda to expand CGD in
326 cities by 2022 from existing 75
authorized Geographical Area
Opportunities to expand for MGL
14

MGL Growth Strategy
Seek Growth
Opportunities
Continue Cost-
Effective and
Reliable Sourcing
Arrangement
Increase
penetration in
existing markets
Further develop
infrastructure
• PNGRB’s bidding rounds could be opportunity for MGL’s expansion beyond Mumbai
• NITI Aayog agenda to expand CGD in 326 cities by 2022 from existing 75 authorized Geographical Area
• New applications and technologies for CNG
• Monitor cost of natural gas and endeavor to source natural gas in the most cost effective manner
• Continue with commercially viable sourcing arrangements
• MoPNG allocation policy and pricing guidelines for domestic gas
• Term and spot contracts for commercial and industrial sourcing
• Increasing population expected to increase demand for commercial and domestic natural gas
• Increase reach to new customers for CNG and PNG – additional growth opportunities in the Raigad district
• Government’s plan to phase out LPG subsidies combined with savings made from using PNG are expected to further increase demand for PNG
• Invest in infrastructure to cater to MGL’s larger customer base and improve the quality of services
• Incur substantial capital expenditure to expand operations
• Add over 656 kms of steel and PE pipeline and 96 CNG filling stations during the next five years, in areas of operations
15

MGL Stakeholders
GAIL (India) Ltd.
BG Asia Pacific Holding Pte. Ltd.
Government of Maharashtra
• India’s largest natural gas company
with a market share of over 80%
• Possesses transmission network of
~11,000 kms of natural gas pipeline
transmission network with total
capacity of 210 MMSCMD
• BG Group has been a leader in
exploration, production of oil & natural
gas and LNG
• Now a Royal Dutch Shell Company
• Governor for the State of Maharashtra
in Western India
• Current shareholding in MGL: 10%
Shareholding Pattern as of 31stMarch, 2017
16
Promoter and
Promoter
Group, 65%
Government
10%
FIIs / FIPs,
10%
Mutual
Funds, 5%
Others,
10%

Our Experienced Management Team
Mr. Manoj Yande, Vice President – Human Resources & Corporate Communications
• Over 22 years of experience in HR Domain
• Prior experience at Adani Power, Apollo Tyres, Jindal Steel, Samtel Color, TATA Chemicals, Emcure Pharma
Mr. Sunil M Ranade, Chief Financial Officer
• Over 20 years of experience at MGL
• Prior experience at Wander Ltd., Herdillia Polymers, Goodlass Nerolac and Ashok
Organic Industries
Mr. Rajeev Mathur,Managing Director
• Over 29 years of experience
• Served 4 years as an Executive Director (Marketing) at GAIL
Mr. Shashwat Agarwal, Senior Vice President - Projects
• Over 26 years of experience
• Prior experience at Engineers India Limited and GSPC Gas Company Limited
Mr. Rajesh P Wagle, Senior Vice President — Commercial
• Over 14 years of experience at MGL
• Prior experience at GAIL, Quantum Information Systems Limited and Enron India
Private Limited
Ms. Susmita Sengupta, Technical Director
• On the Board since February 2014
• Prior experience at DCP Midstream in Denver, Colorado and in Midland, Texas
Mr. Srinivasan Murali, Senior Vice President - Operations and Maintenance
• Over 14 years of experience at MGL
• Prior experience at Bilt Chemicals, Cabot India, Cement Corporation of India and
Indian Aluminium Company
Note: (1) The Chairman shall be nominated by GAIL or BGAPH on a two year rotational basis, the first Chairman being nominated by GAIL.17

Financial and Operational
Performance
18

Growth backed by increased customer base and coverage area
19
285.5
359.1
421.3 470.5
545.5
FY 13 FY 14 FY 15 FY 16 FY 17
CNG Customers (end users) Growth
(In ‘000s)
643.5 708.6
804.0 865.2
952.2
FY 13 FY 14 FY 15 FY 16 FY 17
PNG Customers Growth
(In ‘000s)
1.52
1.66
1.771.80
1.90
FY 13 FY 14 FY 15 FY 16 FY 17
CNG Volume (mmscmd)5 yr. CAGR 5.8%
0.56
0.60
0.62 0.63
0.67
FY 13 FY 14 FY 15 FY 16 FY 17
PNG Volume (mmscmd)
5 yr. CAGR 5.1%
Total volume CAGR of 5.7%

Revenue and Profitability
Note: (1) Revenue from Operations (Net) excluding Other Income (2) Gross Profit = Revenue from Operations (Net) - Cost of Natural Gas and Traded Items..
INR Bn
20
7.0 7.4 8.0 8.510.2
FY 13 FY 14 FY 15 FY 16 FY 17
Gross Profit (2)
9.5 11.6 13.5 14.7 14.3
5.5
7.1 7.3 6.0 5.8
FY 13 FY 14 FY 15 FY 16 FY 17
CNG PNG OthersRevenue (1)
5 yr. CAGR CNG 10.9%
5 yr. CAGR PNG 5.7%
5 yr. CAGR Total 9.2%

Profitability
Note: (1) EBITDA = Revenue from Operations - Total expenses excluding Finance Costs and Depreciation and Amortization Expense. (2) Profit After Tax = Total
Revenue – Total Expenses – Tax Expense.
21
INR Bn
4.8 4.9 4.9 5.1
6.4
FY 13 FY 14 FY 15 FY 16 FY 17
EBITDA (1)
3.0 3.0 3.0 3.1 3.9
FY 13 FY 14 FY 15 FY 16 FY 17
PAT (2)
Adverse forex rate, Higher RLNG spot
rates, relatively less increase in alternate
fuel prices – so INR 0.24 billion less
margin from Industrial & Commercial
o Cautious pricing in view of 110%
allocation of domestic gas
o In 2nd half of FY 16, lower Brent � lower
Industrial & Commercial prices

Capex and Operating Cash Flows
The Company’s financial position provides it with flexibility to expand its network in existing markets and
expand to new markets in India
Note: (1) Includes purchase of fixed assets, including intangible assets, capital work in progress and capital advances. (2) Net cash flow from
operating activities as per the cash flow statement.
INR Bn
22
2.3
1.8
2.0
2.2
2.6
FY 13 FY 14 FY 15 FY 16 FY 17
Capex (1)
4.4
4.0 4.3 4.2
5.5
FY 13 FY 14 FY 15 FY 16 FY 17
Operating Cash Flow

Other Financial Metrics
Particulars FY 13 FY 14 FY 15 FY 16 FY17
Avg Realization / SCM (INR) 19.7 22.7 23.8 23.2 21.5
Gross Margin / SCM (INR) 9.0 8.8 9.0 9.4 10.7
Opex / SCM (INR) 2.9 3.1 3.6 3.8 4.0
EBITDA / SCM (INR) 6.4 5.9 5.6 5.7 6.9
EBITDA Margin % 31.9% 25.9% 23.4% 24.7% 31.7%
Days Receivable * (Days) 23.3 23.5 17.9 16.4 16.8
RONW % 26.5% 24.0% 20.8% 18.8% 22.0%
EPS (INR) 33.4 33.3 33.7 31.5 39.8
Note: Return on Net Worth = Profit After Tax / Net Worth (Share Capital + Reserves and Surplus) for the year. 23
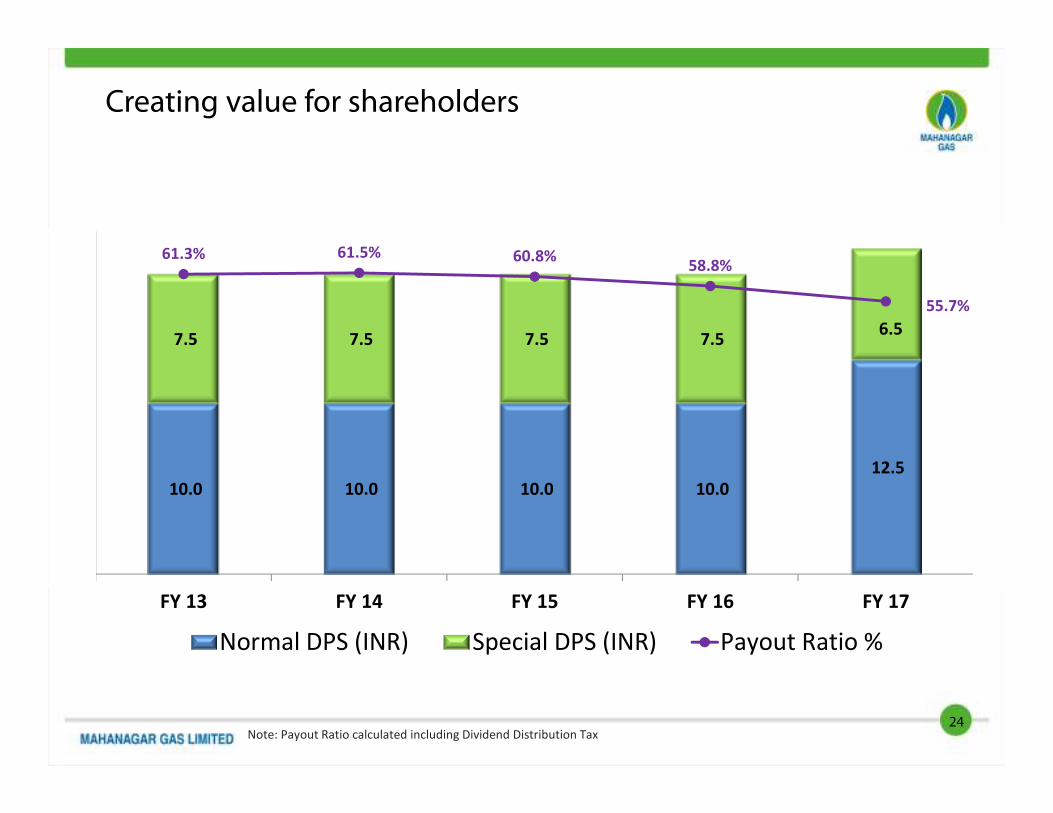
Creating value for shareholders
24Note: Payout Ratio calculated including Dividend Distribution Tax
10.0 10.0 10.0 10.0
12.5
7.5 7.5 7.5 7.5 6.5
61.3% 61.5% 60.8%58.8%
55.7%
FY 13 FY 14 FY 15 FY 16 FY 17
Normal DPS (INR) Special DPS (INR) Payout Ratio %

Appendix
25

Board of Directors – As on 31st March 2017Dr. Ashutosh Karnatak, Non-Executive Chairman (Nominee of GAIL)
• Over 30 years of experience
• Presently holds the position of Director (Projects) with GAIL
• D. Phil, University of Petroleum & Energy Studies, Dehradun, M. Tech (Energy Studies), IIT Delhi
Mr. Rajeev Kumar Mathur, Managing Director (Nominee of GAIL)
• Over 29 years of experience
• Served 4 years as an Executive Director (Marketing) at GAIL
• MBA from Jodhpur University and Bachelor’s degree in Mechanical Engineering from REC, Durgapur
Mr. Apurva Chandra, Non-executive Director (Nominee of Government of Maharashtra)
• Over 26 years of experience, including 7 years at MoPNG and belonged to the 1988 batch of IAS (Maharashtra Cadre)
• Also served on the Boards of GAIL and Petronet LNG
• Master’s degree in Structural Engineering and Bachelor’s degree in Civil Engineering from IIT, Delhi
Ms. Susmita Sengupta, Technical Director (Nominee of BGAPH)
• On the Board since February 2014
• Has worked with DCP Midstream in Denver, Colorado and in Midland, Texas
• Master’s degree in Chemical and Petroleum Engineering from the University of Calgary and Bachelor’s degree in
Applied Sciences
(Chemical Engineering) from the University of Waterloo
Mr. Akhil Mehrotra, Non-Executive Director (Nominee of BGAPH)
• On the Board since March 2016
• Over 24 years of experience in the industry and is presently Director – Downstream business at BG India
• Previously associated with the Reliance Group of Companies
26

Board of Directors – As on 31st March 2017
Mr. Arun Balakrishnan, Independent Director
• Over 35 years of experience and previously served as Chairman and Managing Director of HPCL
• PGDM from IIM, Bangalore and Bachelor’s degree in Chemical Engineering from the University of Calicut
Mr. Santosh Kumar, Independent Director
• On the board since July 2011 and served 3 years as Director (Projects) at GAIL
• Previously held positions such as Chairman, Green Gas Ltd., Director on the Boards of Maharashtra Natural Gas and
Central UP Gas Ltd., and Advisor with GSPL for 2009-10
• Bachelor’s degree in Electronic Engineering from the University of Allahabad
Mr. Raj Kishore Tewari, Independent Director
• On the board since March 2015
• Previously served as the Chairman of the Central Board of Direct Taxes in the Ministry of Finance, Govt. of India
• M.Sc. (Fiscal Studies) from the University of Bath, UK, M.Sc. (Physics) from the University of Lucknow and Bachelor’s
degree in Law from the University of Mumbai
Mr. Jainendar Kumar Jain, Independent Director
• On the Board since January 2008
• Served as Director (Finance) at GAIL from 1996 to 2005
• Chartered Accountant and fellow member of ICAI and holds a Bachelor’s degree in Commerce from Vikram University,
Ujjain
27
Ms RadhikaHaribhakti, Independent Director
• Over 30 years of experience in Commercial and Investment banking with Bank of America, JM Morgan Stanley and DSP Merrill Lynch.
• Serves as an Independent Director on the Boards of Adani Ports & SEZ, EIH Associated Hotels, Ltd., ICRA Ltd., Navin Flourine International Ltd., Rain Industries Ltd and Vistaar Financial Services Pvt. Ltd.
• An MBA in Finance from IIM, Ahmedabad and Commerce graduate from Gujarat University.

Balance Sheet as at March 31, 2017INR Mn
28
Particulars As at 31st March 2017 As at 31st March 2016
ASSETS
I. Non-current Assets
(a) Property, Plant and Equipment 13,003.09 11,240.60
(b) Capital Work-in-Progress 4,115.28 4,288.65
(c) Intangible Assets 44.43 46.87
(d) Financial Assets
(i) Trade Receivables 3.66 10.83
(ii) Security Deposits 217.20 171.02
(iii) Other Financial Assets 4.29 0.72
(e) Income Tax Assets (net) 79.93 107.96
(f ) Other Non-current Assets 815.34 447.75
Total Non-current Assets (I) 18,283.22 16,314.40
II. Current assets
(a) Inventories 237.63 180.27
(b) Financial Assets
(i) Investments 4,666.66 3,934.01
(ii) Trade Receivables 945.44 923.26
(iii) Cash and Cash Equivalents 73.89 221.91
(iv) Bank balances other than (iii) above 1,407.19 1,528.43
(v) Security Deposits 121.91 97.65
(vi) Other Financial Assets 286.87 322.99
(c) Other current assets 219.69 181.91
Total Current Assets (II) 7,959.28 7,390.43
TOTAL (I+II) 26,242.50 23,704.83

Balance Sheet as at March 31, 2017INR Mn
29
Particulars As at 31st March 2017 As at 31st March 2016
EQUITY AND LIABILITIES
I. Equity
(a) Equity Share Capital 987.78 893.42
(b) Other Equity 17,412.60 16,390.86
Total Equity (I) 18,400.38 17,284.28
II. Liabilities
A. Non-current Liabilities
(a) Financial Liabilities
(i) Borrowings 27.00 43.76
(ii) Other Financial Liabilities 1.96 4.63
(b) Provisions 140.06 111.77
(c) Deferred Tax Liabilities (net) 1,376.27 1,199.46
Total Non-current Liabilities (A) 1,545.29 1,359.62
B. Current Liabilities
(a) Current Financial Liabilities
(i) Trade Payables 1,489.60 1,116.17
(ii) Security Deposits 3,878.16 3,186.39
(iii) Capital Creditors 246.49 269.63
(iv) Other Financial Liabilities 134.19 6.07
(b) Provisions 147.67 116.30
(c) Income Tax Liabilities (net) 11.64 9.54
(d) Other Current Liabilities 389.08 356.83
Total Current Liabilities (B) 6,296.83 5,060.93
Total Liabilities (II = A+B) 7,842.12 6,420.55
TOTAL (I+II) 26,242.50 23,704.83

Statement of Profit and LossINR Mn
30
Particulars
For the year
ended
31st March 2017
For the year
ended
31st March 2016
I Revenue from Operations 22,390.71 22,851.31
II Other Income 526.57 471.78
III Total Income (I + II) 22,917.29 23,323.09
IV Expenses :
Cost of Natural Gas and Traded Items 10,183.62 12,296.26
Changes in Inventories 0.40 0.72
Excise Duty 2,051.00 2,068.34
Employee Benefits Expense 600.19 563.04
Finance Costs 10.21 22.22
Depreciation and Amortisation Expenses 951.32 826.08
Other Expenses 3,113.95 2,830.12
Total Expenses 16,910.68 18,606.78
V Profit Before Tax for the period (III- IV) 6,006.60 4,716.31
VI Income Tax Expense :
(i) Current Tax 1,894.72 1,447.44
(ii) Deferred Tax 177.61 160.00
Total Income Tax Expense (i+ii) 2,072.33 1,607.44
VII Profit After Tax for the period (V - VI) 3,934.28 3,108.87
VIII Other Comprehensive Income
Gain/(loss) that will not be reclassified to profit or loss (Net of Income Tax) (6.64) 16.95
Total Other Comprehensive Income (6.64) 16.95
IX Total Comprehensive Income for the period (VII + VIII) 3,927.64 3,125.82

Statement of Cash FlowsINR Mn
31
PARTICULARSFor the year ended
31st March 2017
For the year ended
31st March 2016
I. CASH FLOW FROM OPERATING ACTIVITIES
Profit before tax as per Statement of Profit and Loss 6,006.60 4,716.31
Adjustments for:
Depreciation and Amortisation Expense 951.32 826.08
Writeoff and Disposal of Property, Plant and Equipment 10.10 4.37
Net unrealised foreign exchange (gain)/ loss (9.75) 1.96
Gain on sale of Investments (69.50) (40.34)
Unrealised Gain on Investments (59.15) (48.36)
Allowance for Doubtful Trade Receivables (Net) 9.16 3.36
Allowance for Doubtful Security Deposits (Net) (13.21) (5.46)
Bad Trade Receivables written off 10.01 1.60
Sundry Deposits written Off 14.95 8.09
Provision for Leave Encashment 21.00 15.83
Finance Costs 10.21 22.22
Dividend Income on Investments (135.18) (150.20)
Interest Income (142.37) (108.45)
Operating Profit Before Working Capital Changes 6,604.19 5,247.03
Movements in working capital :
(Increase)/Decrease in Inventories (57.37) (6.72)
(Increase)/Decrease in Trade Receivables (34.18) 34.89
(Increase)/Decrease in Security Deposits (72.18) (23.89)
(Increase)/Decrease in Other Financial Assets 35.77 (51.34)
(Increase)/Decrease in Other Non Current Assets (370.04) (16.50)
(Increase)/Decrease in Other Current Assets (37.79) (22.05)
Increase/(Decrease) in Other Non Current Liabilities 131.52 (5.53)
Increase/(Decrease) in Provisions 28.52 24.69
Increase/(Decrease) in Trade Payables 383.18 50.79
Increase/(Decrease) in Security Deposits (Liab) 684.78 429.61
Increase/(Decrease) in Other Current Liabilities 32.25 30.07
724.48 444.03
Cash Generated from Operations 7,328.67 5,691.06
Income Taxes Paid (1,861.87) (1,500.70)
Net Cash from Operating Activities 5,466.80 4,190.35

Statement of Cash FlowsINR Mn
32
PARTICULARSFor the year ended
31st March 2017
For the year ended
31st March 2016
II. CASH FLOW FROM INVESTING ACTIVITIES
Payments for Property, Plant and Equipment (2,569.34) (2,154.33)
Proceeds from sale of Property, Plant and Equipment 0.55 1.09
Payments for purchase of Investments (25,616.03) (23,494.67)
Proceeds from sale of Investments 24,942.53 23,327.35
Movements in Bank Deposits not considered as Cash and Cash Equivalents 128.36 (215.50)
Interest Received 132.04 123.46
Dividend Received on Investments 135.18 150.20
Gain / (Loss) on sale of Investments 69.50 40.34
Net Cash (used in) Investing Activities (2,777.22) (2,222.06)
III. CASH FLOW FROM FINANCING ACTIVITIES
Repayment of Borrowings (18.32) (28.25)
Dividend Paid (2,816.16) (1,881.77)
Interest Paid (3.12) (4.31)
Net Cash (used in) Financing Activities (2,837.60) (1,914.32)
Net Increase/(Decrease) in Cash and Cash Equivalents (I+II+III) (148.02) 53.98
Cash and Cash Equivalents at the beginning of the year (refer note 11) 221.91 167.93
Cash and Cash Equivalents at the end of the year (refer note 11) 73.89 221.91
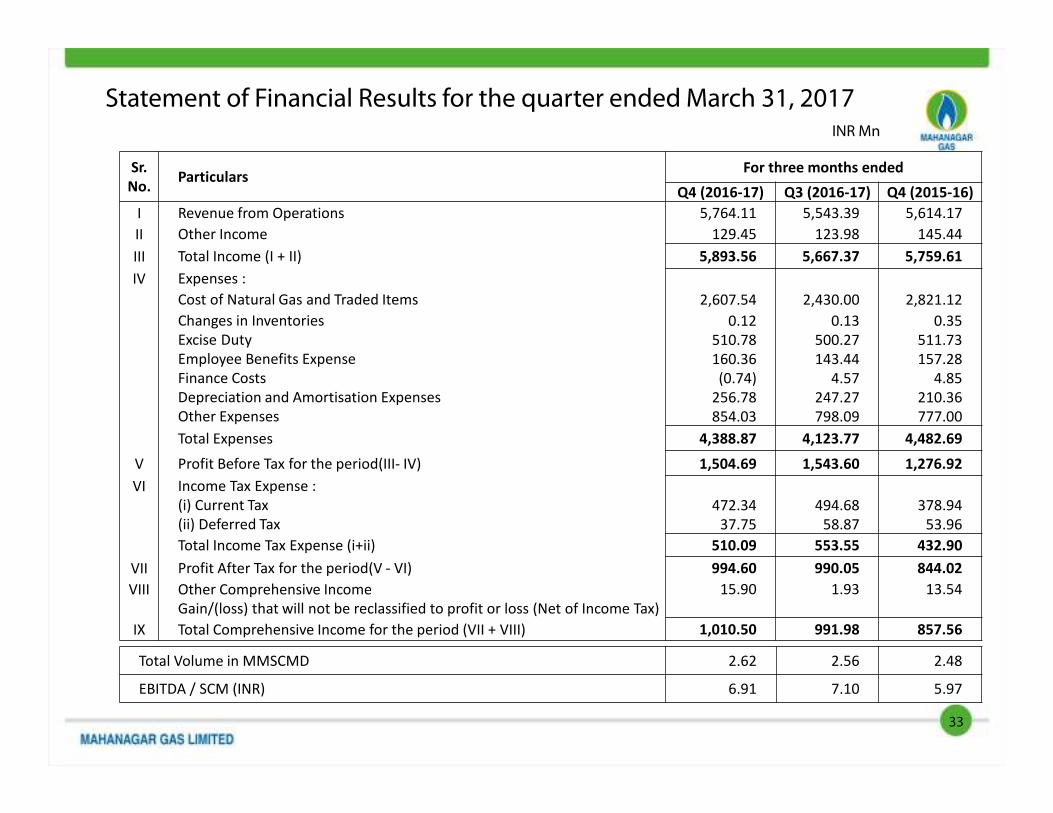
Statement of Financial Results for the quarter ended March 31, 2017INR Mn
33
Sr.
No.Particulars
For three months ended
Q4 (2016-17) Q3 (2016-17) Q4 (2015-16)
I Revenue from Operations 5,764.11 5,543.39 5,614.17
II Other Income 129.45 123.98 145.44
III Total Income (I + II) 5,893.56 5,667.37 5,759.61
IV Expenses :
Cost of Natural Gas and Traded Items 2,607.54 2,430.00 2,821.12
Changes in Inventories 0.12 0.13 0.35
Excise Duty 510.78 500.27 511.73
Employee Benefits Expense 160.36 143.44 157.28
Finance Costs (0.74) 4.57 4.85
Depreciation and Amortisation Expenses 256.78 247.27 210.36
Other Expenses 854.03 798.09 777.00
Total Expenses 4,388.87 4,123.77 4,482.69
V Profit Before Tax for the period(III- IV) 1,504.69 1,543.60 1,276.92
VI Income Tax Expense :
(i) Current Tax 472.34 494.68 378.94
(ii) Deferred Tax 37.75 58.87 53.96
Total Income Tax Expense (i+ii) 510.09 553.55 432.90
VII Profit After Tax for the period(V - VI) 994.60 990.05 844.02
VIII Other Comprehensive Income
Gain/(loss) that will not be reclassified to profit or loss (Net of Income Tax)
15.90 1.93 13.54
IX Total Comprehensive Income for the period (VII + VIII) 1,010.50 991.98 857.56
Total Volume in MMSCMD 2.62 2.56 2.48
EBITDA / SCM (INR) 6.91 7.10 5.97

34
Summary of Assets and Liabilities
ParticularsAs at
31. 03. 2015
As at
31. 03. 2014
As at
31. 03 . 2013
EQUITY AND LIABILITIES
Shareholders' Funds
Share Capital 893.42 893.42 893.42
Reserves and Surplus 13,181.23 12,076.16 10,932.86
Non-current Liabilities
Long-term Borrowings 155.88 79.83 98.33
Deferred tax Liabilities (Net) 1,027.09 887.09 796.76
Other long-term Liabilities 10.63 7.78 0.85
Long term Provisions 68.32 40.42 -
Current Liabilities
Total outstanding dues of Micro, Small and Medium Enterprises 26.61 13.02 10.11
Total outstanding dues of creditors other than Micro, Small and Medium Enterprises 1,092.94 1,050.69 853.82
Other current Liabilities 3,227.00 2,751.28 2,359.43
Short-term Provisions 1,972.73 1,943.32 1,884.12
TOTAL 21,655.85 19,743.01 17,829.70
ASSETS
Non-Current Assets
Tangible Assets 10,594.36 9,871.18 9,210.81
Intangible Assets 45.71 43.69 46.11
Capital work-in-progress 3,796.20 3,454.41 3,147.67
Long term Loans and Advances 296.34 236.07 253.54
Other Non-Current Assets 17.82 16.74 17.21
Current Assets
Current Investments 3,714.66 3,420.66 3,021.19
Inventories 173.55 158.66 137.73
Trade Receivables 962.31 1,092.63 901.87
Cash and Cash Equivalents 1,449.17 888.06 660.23
Short-term Loans and Advances 306.26 284.21 217.82
Other Current Assets 299.47 276.70 215.52
TOTAL 21,655.85 19,743.01 17,829.70
INR Mn
Note: These results are as per earlier accounting standards

35
INR Mn
Summary Statement of Profit and Loss
Particulars
For the year ended
31. 03 . 2015 31. 03 . 2014 31. 03 . 2013
Revenue from Operations
Sale of Natural Gas (Net) 20,778.09 18,686.40 14,977.03
Sale of pipes, fittings and other materials 4.68 12.43 8.30
Other operating income 166.51 152.70 158.45
Other Income 407.09 344.94 315.19
Total Revenue 21,356.37 19,196.47 15,458.97
Expenses
Cost of Natural Gas and Traded Items 12,958.08 11,444.37 8,121.94
Changes in Inventories (0.85) (1.09) (0.31)
Employee benefits expense 511.11 416.89 359.03
Finance Costs 12.05 2.07 10.69
Depreciation and amortization expense 799.09 807.16 711.08
Other expenses 2,583.95 2,109.24 1,829.45
Total expenses 16,863.43 14,778.64 11,035.43
Profit before tax 4,492.94 4,417.83 4,423.54
Total 1,482.93 1,445.34 1,438.48
Profit after tax for the year 3,010.01 2,972.49 2,985.06
Note: These results are as per earlier accounting standards
36
INR Mn
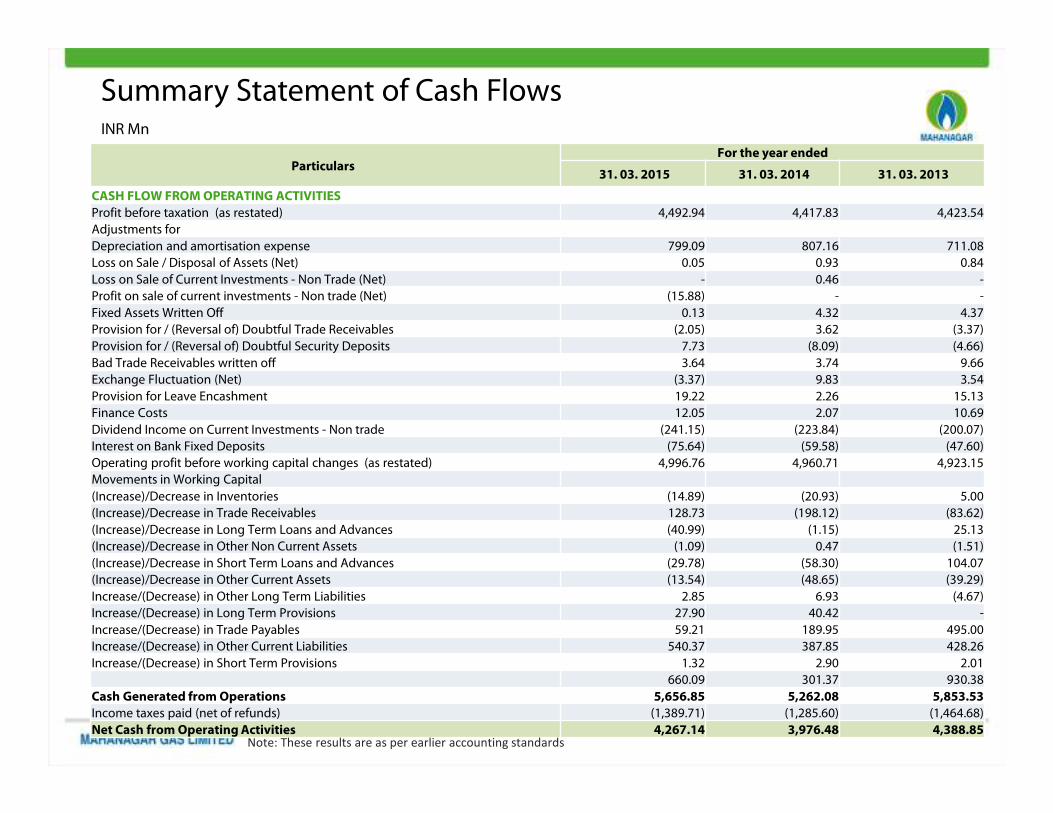
Summary Statement of Cash Flows
Particulars For the year ended
31. 03. 2015 31. 03. 2014 31. 03. 2013
CASH FLOW FROM OPERATING ACTIVITIES
Profit before taxation (as restated) 4,492.94 4,417.83 4,423.54
Adjustments for
Depreciation and amortisation expense 799.09 807.16 711.08
Loss on Sale / Disposal of Assets (Net) 0.05 0.93 0.84
Loss on Sale of Current Investments - Non Trade (Net) - 0.46 -
Profit on sale of current investments - Non trade (Net) (15.88) - -
Fixed Assets Written Off 0.13 4.32 4.37
Provision for / (Reversal of) Doubtful Trade Receivables (2.05) 3.62 (3.37)
Provision for / (Reversal of) Doubtful Security Deposits 7.73 (8.09) (4.66)
Bad Trade Receivables written off 3.64 3.74 9.66
Exchange Fluctuation (Net) (3.37) 9.83 3.54
Provision for Leave Encashment 19.22 2.26 15.13
Finance Costs 12.05 2.07 10.69
Dividend Income on Current Investments - Non trade (241.15) (223.84) (200.07)
Interest on Bank Fixed Deposits (75.64) (59.58) (47.60)
Operating profit before working capital changes (as restated) 4,996.76 4,960.71 4,923.15
Movements in Working Capital
(Increase)/Decrease in Inventories (14.89) (20.93) 5.00
(Increase)/Decrease in Trade Receivables 128.73 (198.12) (83.62)
(Increase)/Decrease in Long Term Loans and Advances (40.99) (1.15) 25.13
(Increase)/Decrease in Other Non Current Assets (1.09) 0.47 (1.51)
(Increase)/Decrease in Short Term Loans and Advances (29.78) (58.30) 104.07
(Increase)/Decrease in Other Current Assets (13.54) (48.65) (39.29)
Increase/(Decrease) in Other Long Term Liabilities 2.85 6.93 (4.67)
Increase/(Decrease) in Long Term Provisions 27.90 40.42 -
Increase/(Decrease) in Trade Payables 59.21 189.95 495.00
Increase/(Decrease) in Other Current Liabilities 540.37 387.85 428.26
Increase/(Decrease) in Short Term Provisions 1.32 2.90 2.01
660.09 301.37 930.38
Cash Generated from Operations 5,656.85 5,262.08 5,853.53
Income taxes paid (net of refunds) (1,389.71) (1,285.60) (1,464.68)
Net Cash from Operating Activities 4,267.14 3,976.48 4,388.85 Note: These results are as per earlier accounting standards

37
INR Mn
Summary Statement of Cash Flows
ParticularsFor the year ended
31. 03. 2015 31. 03. 2014 31. 03. 2013
CASH FLOW FROM INVESTING ACTIVITIES
Purchase of fixed assets, including intangible assets, capital work in progress and capital
advances(1,975.94) (1,768.44) (2,265.81)
Proceeds from sale of fixed assets 1.29 0.44 16.63
Purchase of current investments (24,398.62) (20,837.50) (17,033.62)
Sale of Current Investments 24,120.49 20,437.58 16,367.49
Bank balances not considered as Cash and Cash Equivalents (662.01) (101.59) (184.58)
Interest Received 66.41 47.05 46.16
Dividend Received on Current Investments - Non trade 241.15 223.84 200.07
Net Cash (used in) Investing Activities (2,607.23) (1,998.62) (2,853.66)
CASH FLOW FROM FINANCING ACTIVITIES
Issue of 9% Unsecured Compulsorily Convertible Debentures 94.36 - -
Repayment of Borrowings (18.31) (18.50) (6.38)
Dividend paid (1,563.48) (1,563.48) (1,340.13)
Corporate Dividend Tax (265.71) (265.71) (217.40)
Interest Paid (7.67) (3.93) (5.93)
Net Cash (used in) Financing Activities (1,760.81) (1,851.62) (1,569.84)
Net (Decrease)/Increase in Cash and Cash Equivalents (100.90) 126.24 (34.65)
Cash and Cash Equivalents at the beginning of the year 258.29 132.05 166.70
Cash and Cash Equivalents at the end of the year 157.39 258.29 132.05
Cash and cash equivalents at the end of the year comprises
Cash on Hand 0.01 0.01 0.04
Cheques on Hand 0.10 - 10.79
Balances with Banks
In Current Accounts 157.28 258.28 121.22
In Deposit Accounts with Original Maturity of 3 months or less
157.39 258.29 132.05
Note: These results are as per earlier accounting standards

Safe Harbor
• This presentation may contain statements which reflect the management’s current views and
estimates and could be construed as forward looking statements.
• The future involves certain risks and uncertainties that could cause actual results to differ
materially from the current views being expressed.
• Potential risks and uncertainties include such factors as general economic conditions,
competitive product and pricing pressures and regulatory developments.
38

MGL House, G-33, Bandra Kurla Complex, Bandra (E)
Mumbai – 400 051
T +91 22 6678 5000 F +91 22 6540093/1046
https://www.mahanagargas.com
CIN : U40200MH1995PLCO88133
39