presentation of the asean economic intelligence report --southeast asia area priscilla haifeng wu...
TRANSCRIPT

Presentation of the ASEANEconomic intelligence report
--Southeast Asia area
Priscilla Haifeng Wu
Hao Wang

Outline
1. Introduction
- Environment
- Political
- Economic
2. Trade & Service
3. FDI
4. Issues
5.Prosperous

BRUNEI DARUSSALAM
Background Information :
Capital : Bandar Seri Begawan
Land area : 5,765 sq.km
Population : 342,000 (2000)
Language : Malay
Religion : Moslem
Government Type : Constitutional Monarchy
Member of : ASEAN, APEC, APT, APDC, Commonwealth, ESCAP, GP 77, GATT/WTO, ICAO, IMO, IMF, WMO, UNDP, WHO, WIPO, WTO-GBT, ASEM, EALAF
Currency : B$ (Bruneian Dollar).
GDP : B$ 8.0 (2000) at current market prices
Major Industries : Oil and gas, textiles, food and beverages, building materials
Major Exports : Oil and gas, ready-made garments
Major Imports : Transport equipment and machinery, manufactured goods, food chemicals
CAMBODIA
Background Information :
Capital : Phnom Penh
Land area : 181,035 sq.km
Population : 11.0 million (1999)
Language : Khmer
Religion : Buddhism
Government Type : Constitutional Monarchy
Member of : ASEAN, CTBTO, ESCAP, FAO, IAEA, IBRD, ICAO, IDA, IFC, IFAD, ILO, IMF, IMO, ITU, LDC, UNO, UNCTAD, UNESCO, UPO, UNIDO, WIPO, WHO
Currency : Riel
GDP : Riel 12,406.5 (2000) at current market prices
Major Industries : Textiles and Garments, Beverages, Food Processing, Wood Processing
Major Exports : Garments, Textile Product Sawn, Wood Furniture and Rubber
Major Imports : Transport equipment and machinery, manufactured goods, food chemicals
INDONESIA
Background Information :
Capital : Jakarta.
Land area : 1,919,317 sq.km.
Population : 212 million (2000).
Language : Bahasa Indonesia
Religion : Moslem, Christian, Catholic, Buddhism, Hinduism
Government Type : Republic
Member of : ASEAN, UN, IMF, ESCAP, FAO, ILO, UNESCO, IBRD, IFC, MIGA, IDB, IDA, ADB, WTO, APEC, ASEM, EALAF
Currency : Rupiah
GDP : Rp. 1,332.2 billion (2000) at current market prices
Major Industries : Pulp and paper, cement, basic metals and fertilizer, power generation, telecommunication, transportation
Major Exports : Textile, electronic goods, footwear, oil & gas, plywood, sawn timber
Major Imports : Chemical and pharmaceutical, fertilizer, cotton yarns, textile fabric, machines, motor vehicles
LAO PDR
Background Information :
Capital : Vientiane
Land area : 236,800 sq.km
Population : 5.3 million (1999)
Language : Lao
Religion : Buddhism
Government Type : People's Democratic Republic
Member of : ASEAN, ADB, ESCAP, FAO, IBRD, WHO, IDA, WIPO, IFC, ILO, IMF, UN, NCTAD, UNESCO, UNIDO, UNICEF, WHO, EALAF
Currency : Kip
GDP : Kip 13,482 billion (2000) at current market prices
Major Industries : Garment industry, wood-based and processing industries, electricity
Major Exports : Coffee, electricity, clothing, wood and forest product and Gypsum
Major Imports : Industrial machinery, chemicals, iron, electrical machinery and parts, steel, oil, construction material and consumption goods
MYANMAR
Background Information :
Capital : Yangon
Land area : 676,575 sq.km
Population : 49.0 million (2000)
Language : Myanmar
Religion : Buddhism, Christians, Moslem
Government Type : State Peace Development Council
Member of : ASEAN, ADB, ESCAP, ACU, FAO, IBRD, IDA, IFC, ILO, IMF, ITU, WTO, UNESCO, UNIDO, UNICEF, EALAF
Currency : Myanmar Kyat
GDP : K 2,408.4 billion (2000) at current market prices
Major Industries : Agro-based industries, textiles industries, steel mills
Major Exports : Rice, teak, beans & pulses, rubber, coffee, minerals, gems marine products
Major Imports : Power tillers, hand tractor, fertilizer, diesel oil, cement, dumper, loader and spare parts, water pumps, hydraulic excavator
PHILIPPINES
Background Information :
Capital : Manila
Land area : 300,000 sq.km
Population : 78.4 million (2000)
Language : Filipino, English, Spanish
Religion : Buddhism, Christians, Moslem
Government Type : Democracy
Member of : ASEAN, ADB, APEC, ASEM, FAO, IBRD, IDA, IMF, IFAD, IFC, ILO, UN, UNESCO, UNICEF, UNIDO, WHO, WTO, WCO, WIPO, EALAF
Currency : Peso
GDP : Php 3,322.6 billion (2000) at current market prices
Major Industries : Food, petroleum and coal refining, chemical, electronics and electrical machinery
Major Exports : Electronics, garments, machinery and transport equipment, mineral and mineral products, coconut product, sugar, bananas, pineapple, mangoes
Major Imports : Materials for the manufacture of electronics/electrical equipment

SINGAPORE
Background Information :
Capital : Singapore
Land area : 647.8 sq.km
Population : 4.0 million (2000)
Language : English, Malay, Mandarin, Tamil
Religion : Buddhism, Christians, Moslem
Government Type : Parliamentary Democracy
Member of : ASEAN, ADB, APEC, ARF, COMMONWEALTH, FAO, IAEA, IBRD, IDA, IFC, IMF, IFAD, IMO, ILO, ITU, UNIDO, UPO, WHO, ASEM, EALAF
Currency : Singapore Dollar (S$)
GDP : S$ 159.0 billion (2000) at current market prices
Major Industries : Electronics, chemicals, banking and finance, real estate, tourism, trading
Major Exports : Petroleum products, industrial machines, radio & television receivers & parts, electronic component & parts, clothing, beverages & tobacco
Major Imports : Crude petroleum, iron & steel, industrial machines, electric generators, electronic component and parts

Environment In Economy and Politic
• GDP of Southeast Asia keeps continue growth after financial crisis
• Renewed investment in export-oriented industries has led to a recovery in private capital formation. Lower interest rates, lower the public and company’s debt
• In terms of domestic demand, consumption growth is also likely to remain weaker in 2001 than in 2000.
• Export growth (in US dollar terms) is likely to slow considerably in 2001; be accompanied by faster import growth (relative to exports) and a further narrowing of the current account surplus in the subregion in 2001.
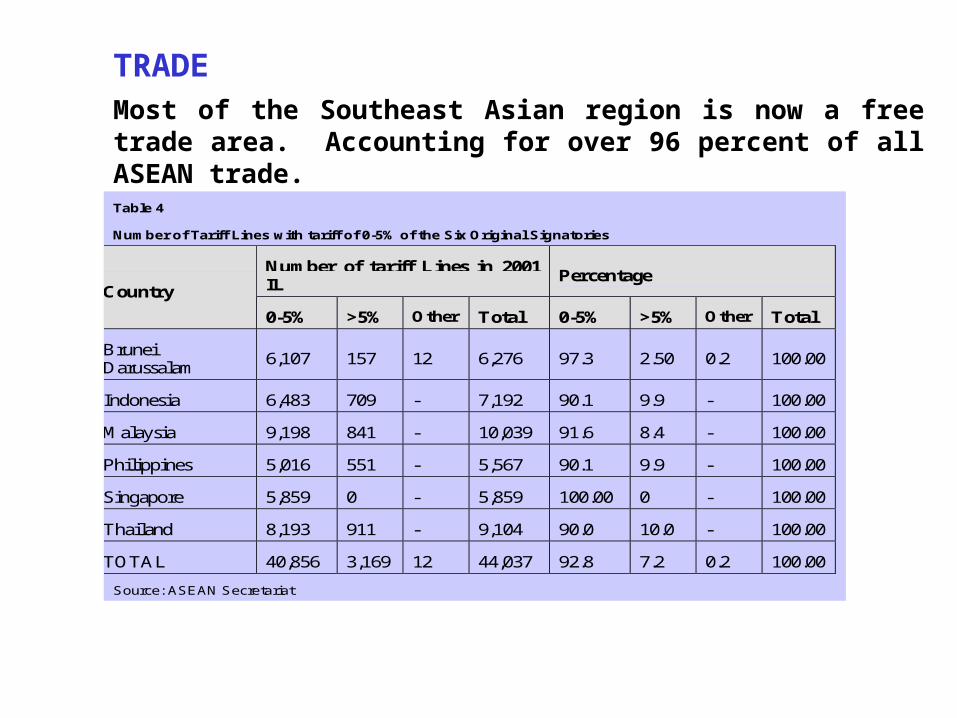
TRADEMost of the Southeast Asian region is now a free trade area. Accounting for over 96 percent of all ASEAN trade.
Table 4
Number of Tariff Lines with tariff of 0-5% of the Six Original Signatories
Number of tariff Lines in 2001IL
PercentageCountry
0-5% >5% Other Total 0-5% >5% Other Total
BruneiDarussalam
6,107 157 12 6,276 97.3 2.50 0.2 100.00
Indonesia 6,483 709 - 7,192 90.1 9.9 - 100.00
Malaysia 9,198 841 - 10,039 91.6 8.4 - 100.00
Philippines 5,016 551 - 5,567 90.1 9.9 - 100.00
Singapore 5,859 0 - 5,859 100.00 0 - 100.00
Thailand 8,193 911 - 9,104 90.0 10.0 - 100.00
TOTAL 40,856 3,169 12 44,037 92.8 7.2 0.2 100.00
Source: ASEAN Secretariat
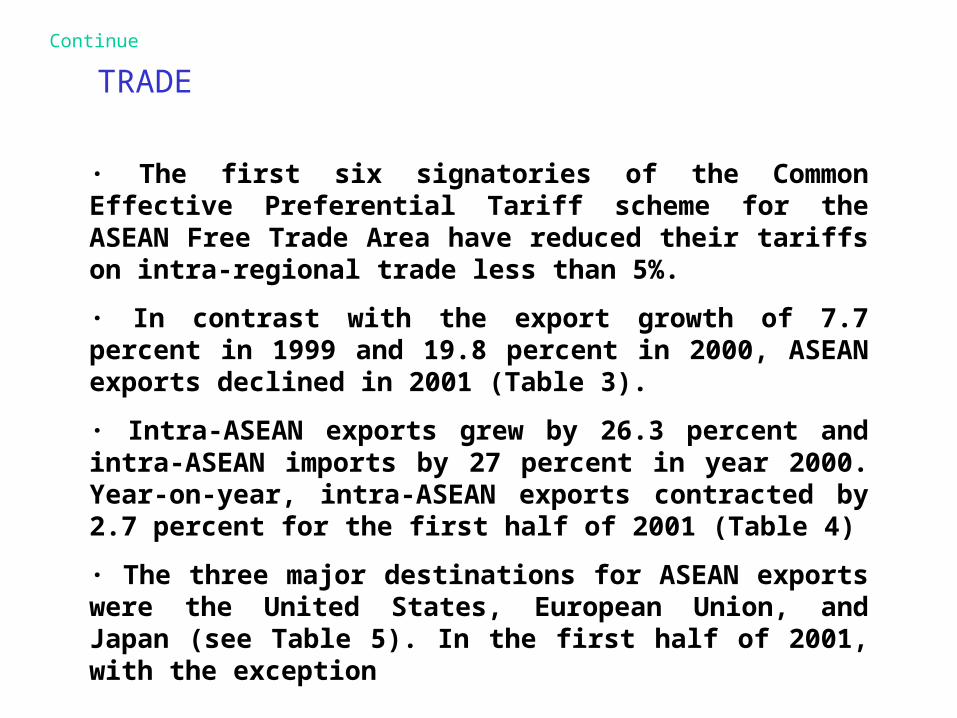
TRADE
· The first six signatories of the Common Effective Preferential Tariff scheme for the ASEAN Free Trade Area have reduced their tariffs on intra-regional trade less than 5%.
· In contrast with the export growth of 7.7 percent in 1999 and 19.8 percent in 2000, ASEAN exports declined in 2001 (Table 3).
· Intra-ASEAN exports grew by 26.3 percent and intra-ASEAN imports by 27 percent in year 2000. Year-on-year, intra-ASEAN exports contracted by 2.7 percent for the first half of 2001 (Table 4)
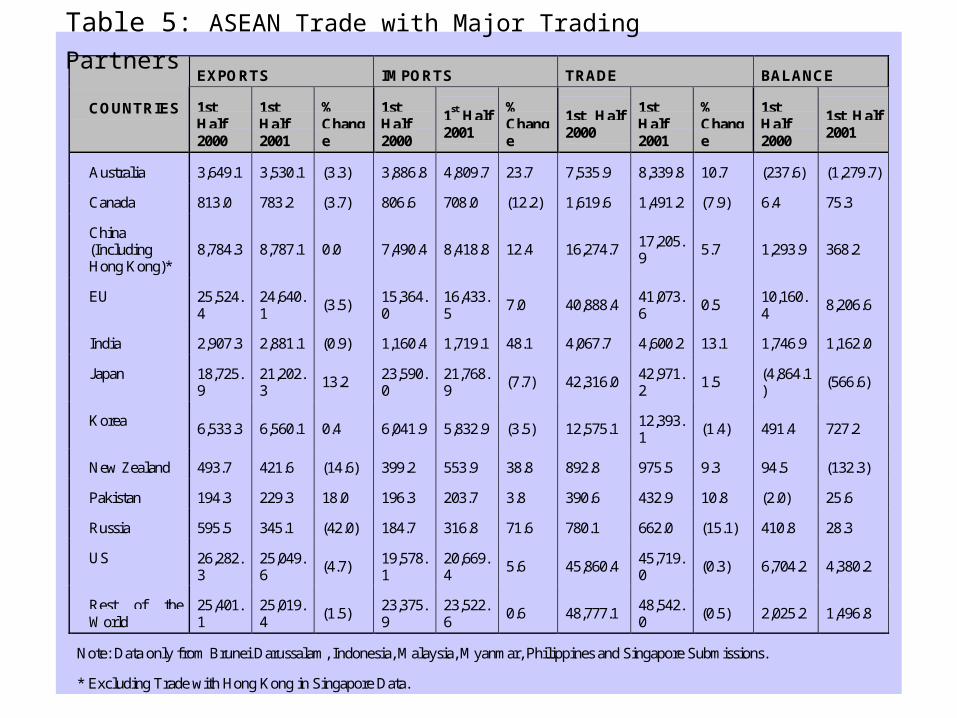
· The three major destinations for ASEAN exports were the United States, European Union, and Japan (see Table 5). In the first half of 2001, with the exception
Continue
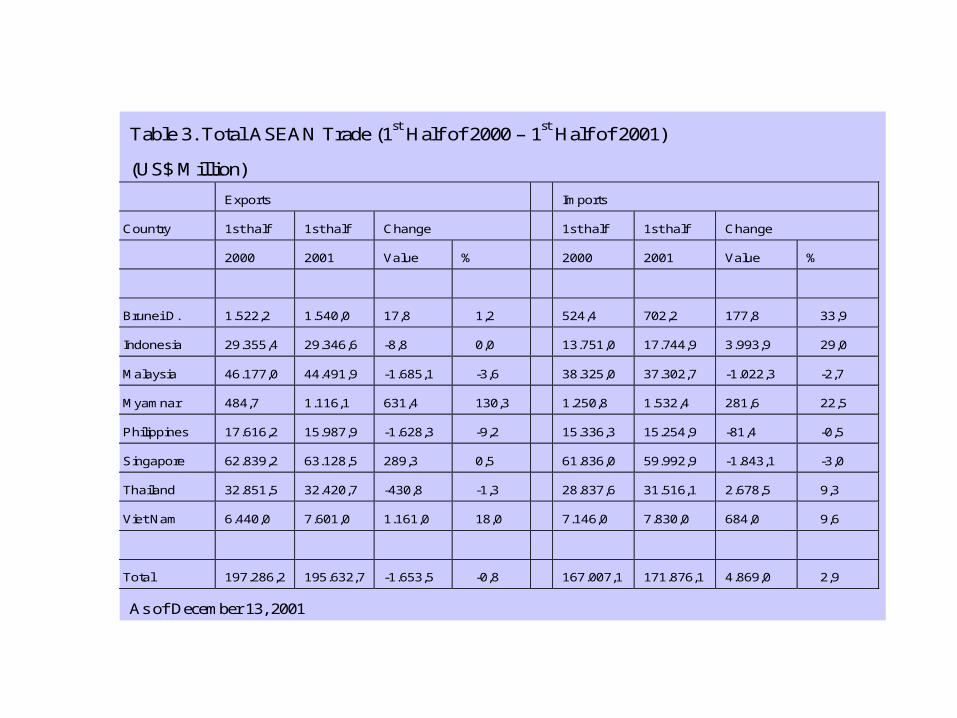
Table 3. Total ASEAN Trade (1st Half of 2000 – 1st Half of 2001)
(US$ Million)
Exports Imports
Country 1st half 1st half Change 1st half 1st half Change
2000 2001 Value % 2000 2001 Value %
Brunei D. 1.522,2 1.540,0 17,8 1,2 524,4 702,2 177,8 33,9
Indonesia 29.355,4 29.346,6 -8,8 0,0 13.751,0 17.744,9 3.993,9 29,0
Malaysia 46.177,0 44.491,9 -1.685,1 -3,6 38.325,0 37.302,7 -1.022,3 -2,7
Myamnar 484,7 1.116,1 631,4 130,3 1.250,8 1.532,4 281,6 22,5
Philippines 17.616,2 15.987,9 -1.628,3 -9,2 15.336,3 15.254,9 -81,4 -0,5
Singapore 62.839,2 63.128,5 289,3 0,5 61.836,0 59.992,9 -1.843,1 -3,0
Thailand 32.851,5 32.420,7 -430,8 -1,3 28.837,6 31.516,1 2.678,5 9,3
Viet Nam 6.440,0 7.601,0 1.161,0 18,0 7.146,0 7.830,0 684,0 9,6
Total 197.286,2 195.632,7 -1.653,5 -0,8 167.007,1 171.876,1 4.869,0 2,9
As of December 13, 2001

Table 4. Intra-ASEAN Trade (1st Half of 2000 – 1st Half of 2001)
(US$ Million)
Exports Imports
Country 1st half 1st half Change 1st half 1st half Change
2000 2001 Value % 2000 2001 Value %
Brunei D. 478,1 298,7 -179,4 -37,5 264,1 259,8 -4,3 -1,6
Indonesia 5.192,4 4.818,9 -373,5 -7,2 3.086,7 2.897,9 -188,8 -6,1
Malaysia 12.461,6 11.177,7 -1.283,9 -10,3 7.485,7 6.909,4 -576,3 -7,7
Myamnar 131,2 482,1 350,9 267,5 669,7 734,4 64,7 9,7
Philippines 2.628,6 2.590,5 -38,1 -1,4 2.414,5 2.349,3 -65,2 -2,7
Singapore 17.198,6 16.794,1 -404,5 -2,4 15.028,5 14.421,9 -606,6 -4,0
Thailand 6.697,4 7.366,6 669,2 10,0 4.747,6 5.078,1 330,5 7,0
Viet Nam 1.272,0 1.281,0 9,0 0,7 2.016,0 2.153,0 137,0 6,8
Total 46.059,9 44.809,6 -1.250,3 -2,7 35.712,8 34.803,8 -909,0 -2,5
As of December 13, 2001
EXPORTS IMPORTS TRADE BALANCE
COUNTRIES 1stHalf2000
1stHalf2001
%Change
1stHalf2000
1st Half2001
%Change
1st Half2000
1stHalf2001
%Change
1stHalf2000
1st Half2001
Australia 3,649.1 3,530.1 (3.3) 3,886.8 4,809.7 23.7 7,535.9 8,339.8 10.7 (237.6) (1,279.7)
Canada 813.0 783.2 (3.7) 806.6 708.0 (12.2) 1,619.6 1,491.2 (7.9) 6.4 75.3
China(IncludingHong Kong)*
8,784.3 8,787.1 0.0 7,490.4 8,418.8 12.4 16,274.717,205.9
5.7 1,293.9 368.2
EU 25,524.4
24,640.1
(3.5)15,364.0
16,433.5
7.0 40,888.441,073.6
0.510,160.4
8,206.6
India 2,907.3 2,881.1 (0.9) 1,160.4 1,719.1 48.1 4,067.7 4,600.2 13.1 1,746.9 1,162.0
Japan 18,725.9
21,202.3
13.223,590.0
21,768.9
(7.7) 42,316.042,971.2
1.5(4,864.1)
(566.6)
Korea6,533.3 6,560.1 0.4 6,041.9 5,832.9 (3.5) 12,575.1
12,393.1
(1.4) 491.4 727.2
New Zealand 493.7 421.6 (14.6) 399.2 553.9 38.8 892.8 975.5 9.3 94.5 (132.3)
Pakistan 194.3 229.3 18.0 196.3 203.7 3.8 390.6 432.9 10.8 (2.0) 25.6
Russia 595.5 345.1 (42.0) 184.7 316.8 71.6 780.1 662.0 (15.1) 410.8 28.3
US 26,282.3
25,049.6
(4.7)19,578.1
20,669.4
5.6 45,860.445,719.0
(0.3) 6,704.2 4,380.2
Rest of theWorld
25,401.1
25,019.4
(1.5)23,375.9
23,522.6
0.6 48,777.148,542.0
(0.5) 2,025.2 1,496.8
Note: Data only from Brunei Darussalam, Indonesia, Malaysia, Myanmar, Philippines and Singapore Submissions.
* Excluding Trade with Hong Kong in Singapore Data.
Table 5: ASEAN Trade with Major Trading Partners
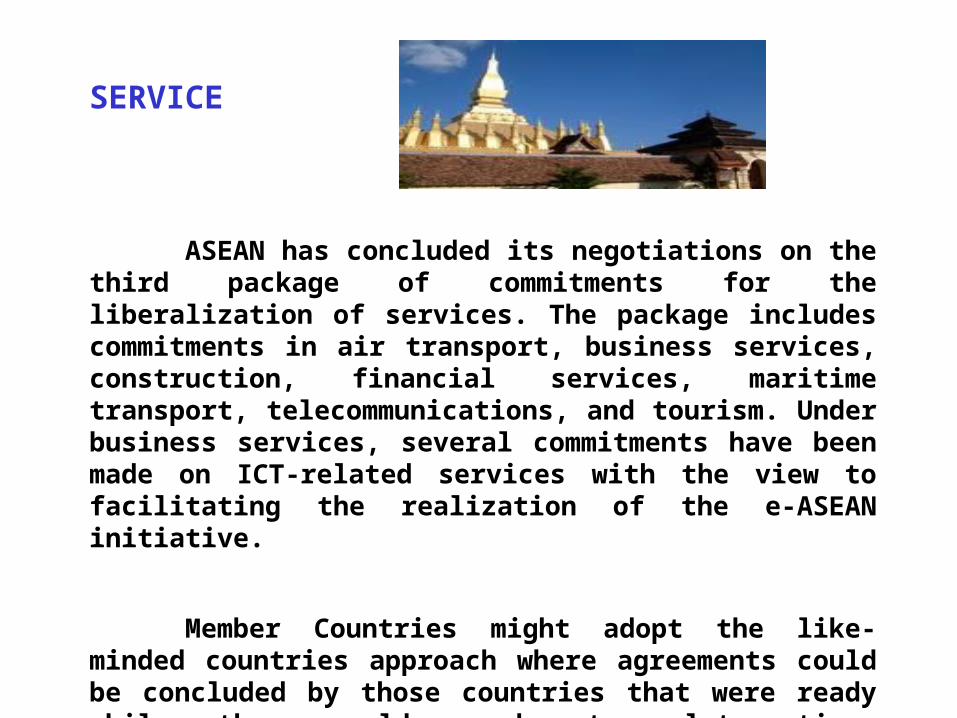
SERVICE
ASEAN has concluded its negotiations on the third package of commitments for the liberalization of services. The package includes commitments in air transport, business services, construction, financial services, maritime transport, telecommunications, and tourism. Under business services, several commitments have been made on ICT-related services with the view to facilitating the realization of the e-ASEAN initiative.
Member Countries might adopt the like-minded countries approach where agreements could be concluded by those countries that were ready while others could accede at a later time.
0
5
10
15
20
25
30
1 2 3 4 5 6
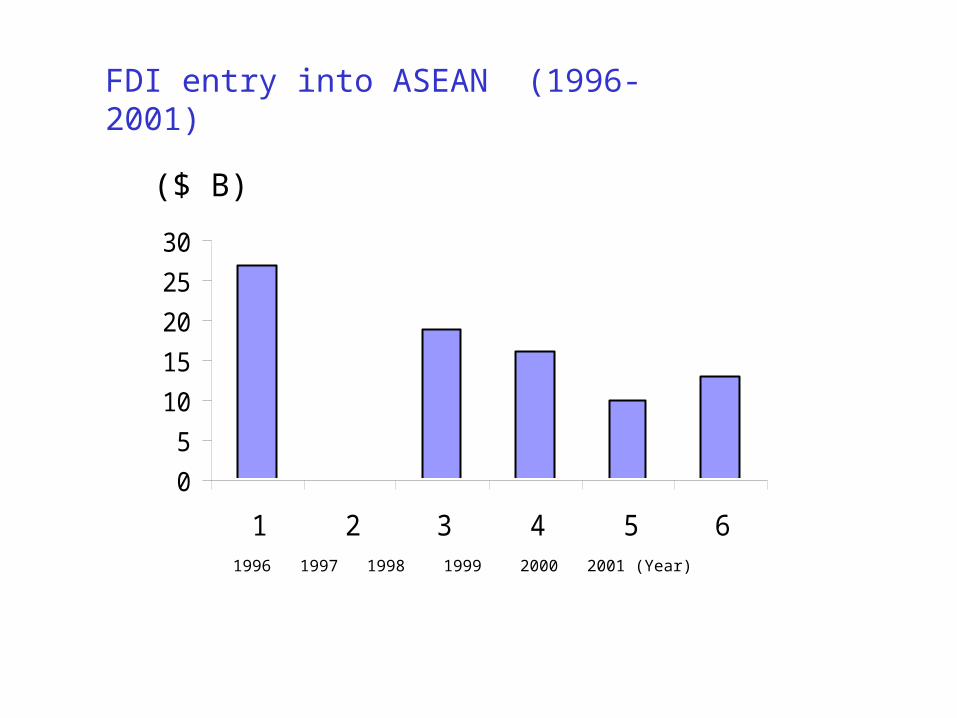
FDI entry into ASEAN (1996-2001)
1996 1997 1998 1999 2000 2001 (Year)
($ B)

ISSUES
1. Threaten from China
ASEAN's accumulated net FDI totaled only US$173 billion for 1980-2000 as substantial crowding out by China in 1993-2000 took its toll on the aggregate.

ISSUES
Continue
2. ASEAN Broadens Liberalization of Investment Rules
Any ASEAN investor can now invest in any ASEAN country and enjoy national investor treatment in the manufacturing areas that had been excluded previously. The decision has stepped up the timetable for investment liberalization, which had been set four years ago. Since the launch of ASEAN Investment Area in 1998, Southeast Asian states had started opening up all industries for investment and grant national treatment to ASEAN investors, with some exception as specified in the Temporary Exclusion List.
continue
ISSUES
3. The Culture and Information – the establishment of bridge of understanding
It aims to improve investor confidence, provide focus on regional economic integration, and other live issues, such as the possibility of the recurrence of the haze and regional cooperation against terrorism.
4. Democratic Expansion and Democratic Deepening in Southeast Asia: The Fateful Connection
The movement for democracy in Southeast Asia is in very bad shape.
The crisis is rooted in a number of problems, the principal one being a lack of consciousness of the intrinsic relationship
between the mission of democratic expansion in the region and the deepening of democratic practice in the countries where it now has a foothold.
Continue
ISSUES
ISSUES
Continue
5. Lessons learned from the Asia Finance Crisis
what is needed are reforms that embrace a number of elements that are vital for economic growth and financial stability?

greater transparency and accountability in government and corporate affairs;
stronger banking systems that protect the savings of small depositors;
the liberalization of capital flows in a prudent and properly sequenced way;
a more level playing field for the private sector—by dismantling monopolies and setting up simpler, more transparent regulatory systems;
reductions in unproductive government spending,
higher and more cost-effective spending on primary health care and education; adequate social protection of the poor, the unemployed etc.
a more effective dialogue with labor and the rest of civil society—to increase political support for adjustment and reform and to ensure that all segments of society benefit.
The southeast Asia region is generally poor. Governments range from brutal dictatorships to weak democracies. Ethnic conflicts and discrimination against minorities are problems in most countries. Internal wars rage in several parts of the region. Child prostitution and child labor are relatively common, and children and adults in some countries risk having their limbs blown off by land mines. Prison conditions are generally bad, police abuses are common and torture is practiced in some of these countries. Freedom of expression varies from country to country, but it's generally restricted.
6. Human rights in ASEAN
PROSPEROUS
Will Everything go well in ASEAN ?!
Time, Hope, Opportunity, and hard-work.