presentación de powerpoint 2h 2017_tcm30...mature assets rotation: 49% rutas de algarrobo and...
TRANSCRIPT
2017 – Presentation of Results
RESULTS 2017
2 8 F e b r u a r y 2 0 1 8
2017 – Presentation of Results
HIGHLIGHTS
OPERATIONAL DEVELOPMENT
PERFORMANCE BY BUSINESS AREAS
ANNEXES
2
Table of Contents
2017 – Presentation of Results 3
Corporate
Operational
Shareholder Remuneration
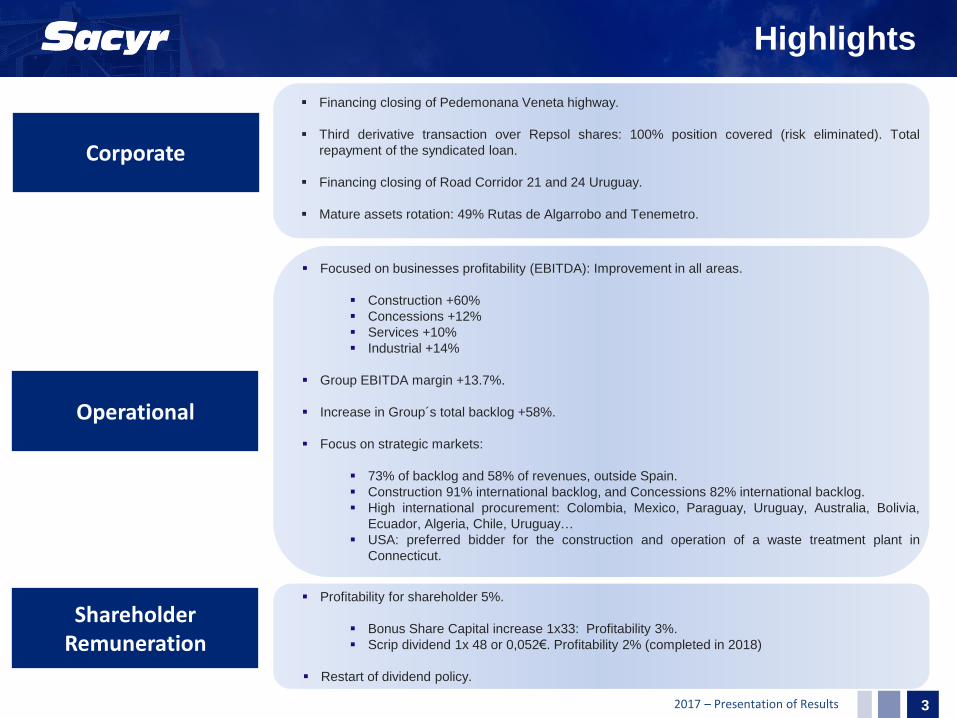
Financing closing of Pedemonana Veneta highway.
Third derivative transaction over Repsol shares: 100% position covered (risk eliminated). Total
repayment of the syndicated loan.
Financing closing of Road Corridor 21 and 24 Uruguay.
Mature assets rotation: 49% Rutas de Algarrobo and Tenemetro.
Highlights
Profitability for shareholder 5%.
Bonus Share Capital increase 1x33: Profitability 3%.
Scrip dividend 1x 48 or 0,052€. Profitability 2% (completed in 2018)
Restart of dividend policy.
Focused on businesses profitability (EBITDA): Improvement in all areas.
Construction +60%
Concessions +12%
Services +10%
Industrial +14%
Group EBITDA margin +13.7%.
Increase in Group´s total backlog +58%.
Focus on strategic markets:
73% of backlog and 58% of revenues, outside Spain.
Construction 91% international backlog, and Concessions 82% international backlog.
High international procurement: Colombia, Mexico, Paraguay, Uruguay, Australia, Bolivia,
Ecuador, Algeria, Chile, Uruguay…
USA: preferred bidder for the construction and operation of a waste treatment plant in
Connecticut.
2017 – Presentation of Results 4
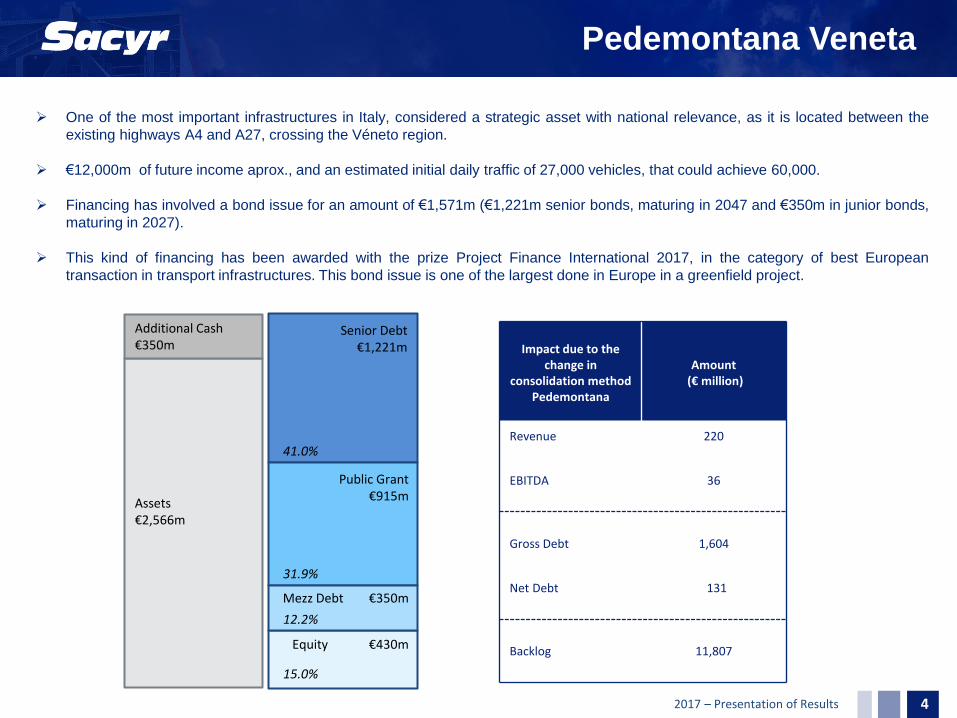
Pedemontana Veneta
One of the most important infrastructures in Italy, considered a strategic asset with national relevance, as it is located between the
existing highways A4 and A27, crossing the Véneto region.
€12,000m of future income aprox., and an estimated initial daily traffic of 27,000 vehicles, that could achieve 60,000.
Financing has involved a bond issue for an amount of €1,571m (€1,221m senior bonds, maturing in 2047 and €350m in junior bonds,
maturing in 2027).
This kind of financing has been awarded with the prize Project Finance International 2017, in the category of best European
transaction in transport infrastructures. This bond issue is one of the largest done in Europe in a greenfield project.
Assets €2,566m
Senior Debt €1,221m
Equity €430m
41.0%
15.0%
Public Grant €915m
31.9%
Mezz Debt €350m
12.2%
Additional Cash €350m Impact due to the
change in consolidation method
Pedemontana
Amount (€ million)
Revenue 220
EBITDA 36
Gross Debt 1,604
Net Debt 131
Backlog 11,807
2017 – Presentation of Results 5
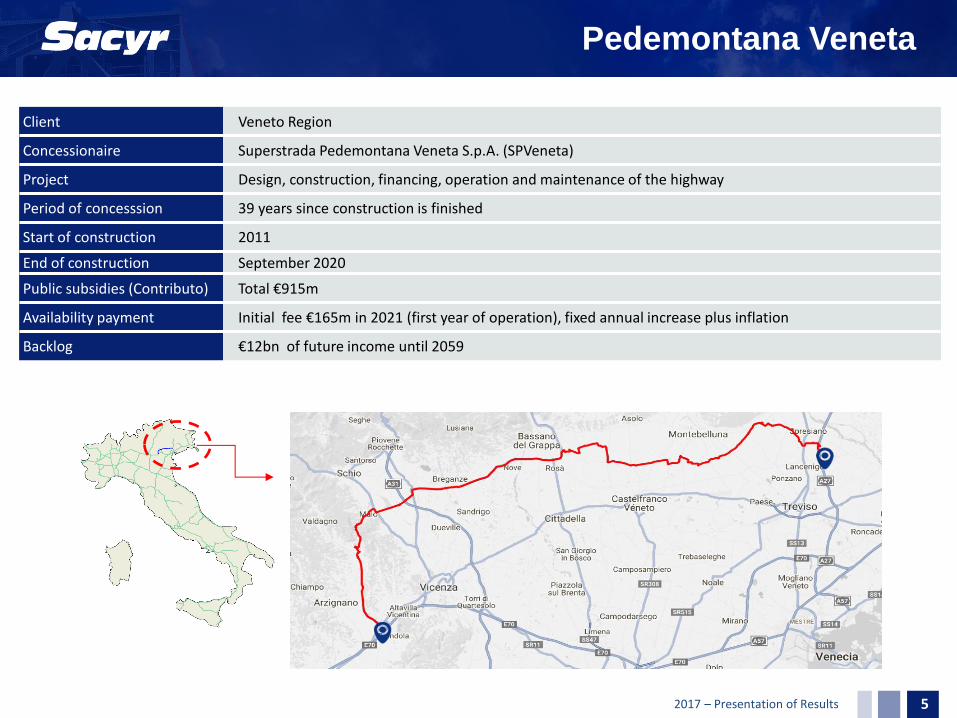
Pedemontana Veneta
Client Veneto Region
Concessionaire Superstrada Pedemontana Veneta S.p.A. (SPVeneta)
Project Design, construction, financing, operation and maintenance of the highway
Period of concesssion 39 years since construction is finished
Start of construction 2011
End of construction September 2020
Public subsidies (Contributo) Total €915m
Availability payment Initial fee €165m in 2021 (first year of operation), fixed annual increase plus inflation
Backlog €12bn of future income until 2059
2017 – Presentation of Results
HIGHLIGHTS
OPERATIONAL EVOLUTION
PERFORMANCE BY BUSINESS AREAS
ANNEXES
6
Table of Contents
2017 – Presentation of Results 7
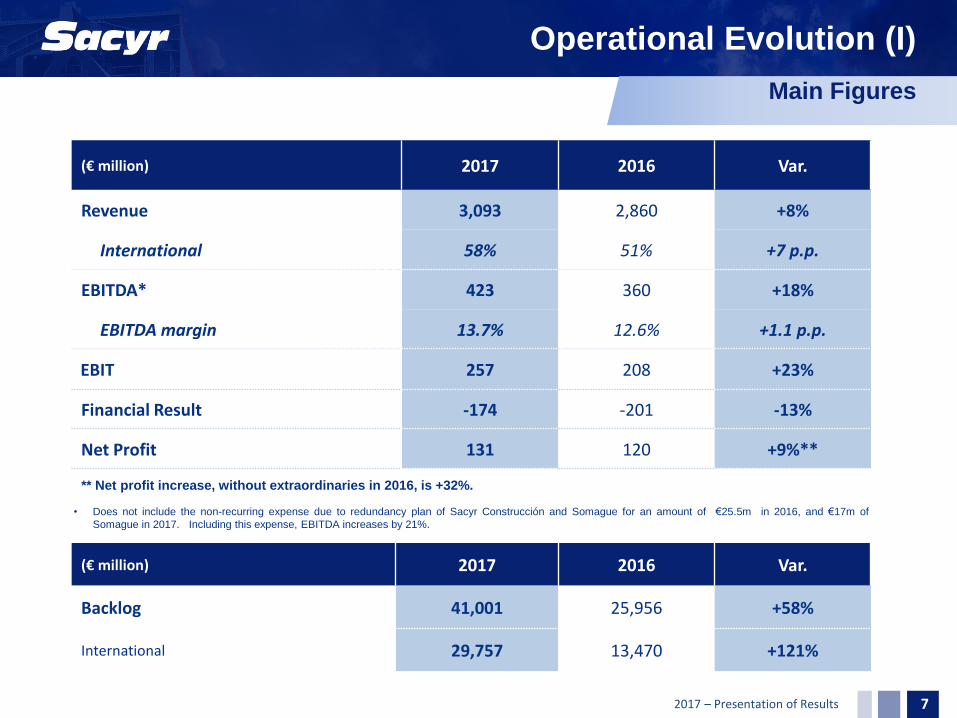
Operational Evolution (I)
(€ million) 2017 2016 Var.
Revenue 3,093 2,860 +8%
International 58% 51% +7 p.p.
EBITDA* 423 360 +18%
EBITDA margin 13.7% 12.6% +1.1 p.p.
EBIT 257 208 +23%
Financial Result -174 -201 -13%
Net Profit 131 120 +9%**
(€ million) 2017 2016 Var.
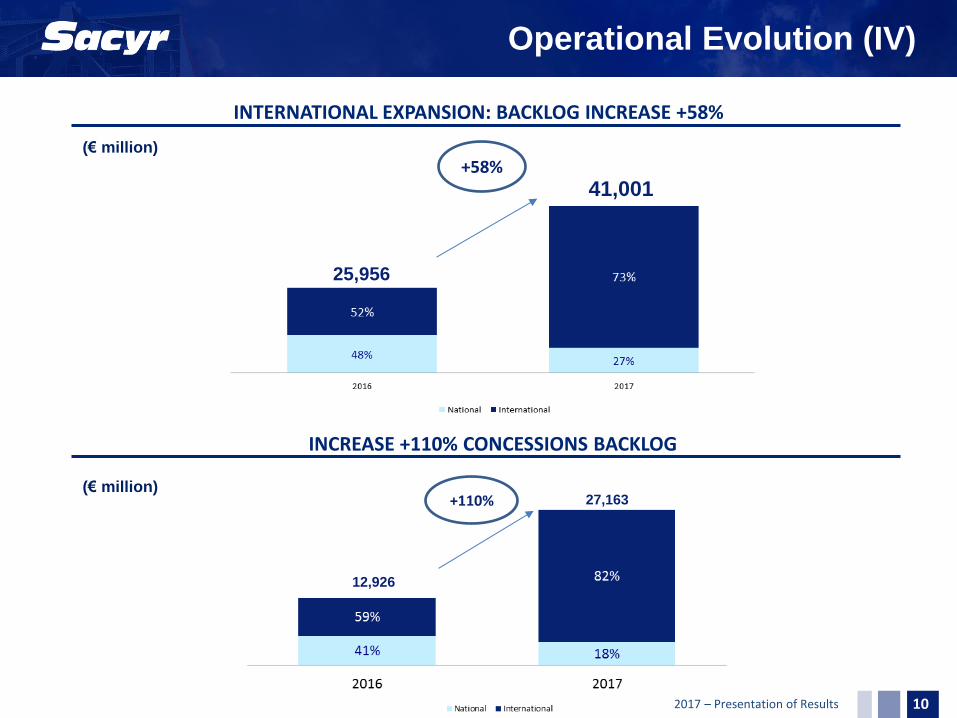
Backlog 41,001 25,956 +58%
International 29,757 13,470 +121%
Main Figures
• Does not include the non-recurring expense due to redundancy plan of Sacyr Construcción and Somague for an amount of €25.5m in 2016, and €17m of
Somague in 2017. Including this expense, EBITDA increases by 21%.
** Net profit increase, without extraordinaries in 2016, is +32%.
2017 – Presentation of Results 8
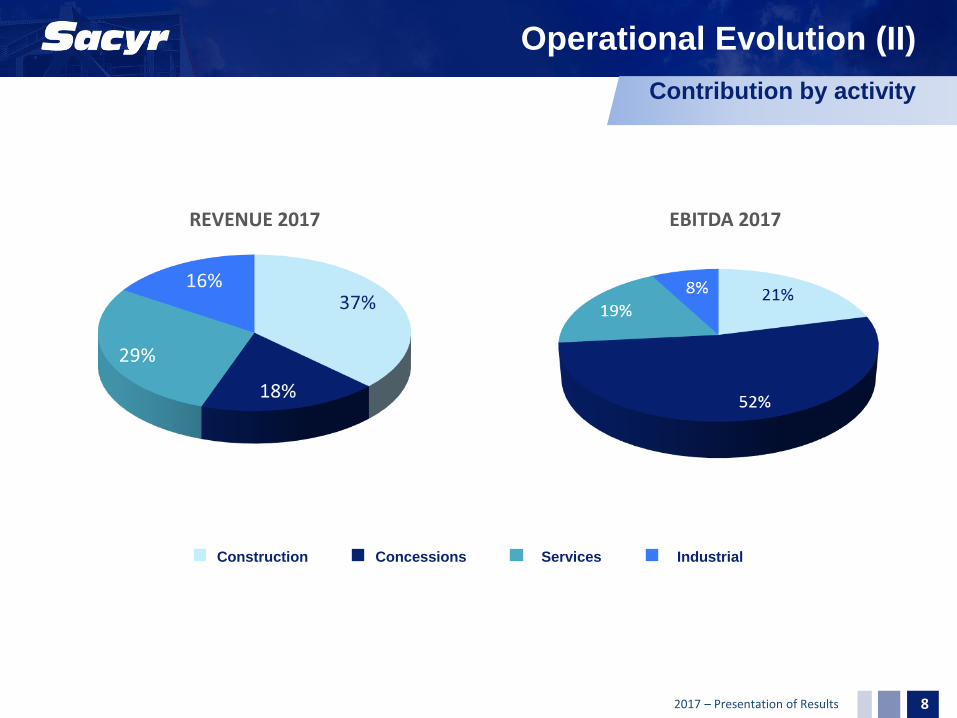
REVENUE 2017 EBITDA 2017
Operational Evolution (II)
Construction Concessions Services Industrial
Contribution by activity
2017 – Presentation of Results 9
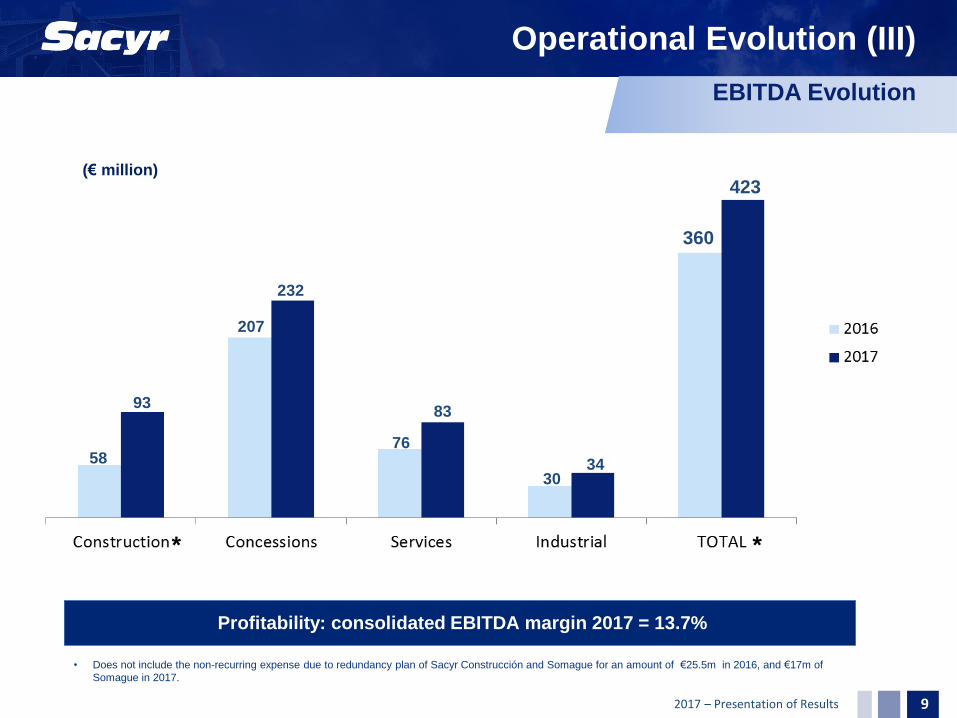
Profitability: consolidated EBITDA margin 2017 = 13.7%
58
93
232
76
83
30 34
423
360
207
Operational Evolution (III)
(€ million)
EBITDA Evolution
* *
• Does not include the non-recurring expense due to redundancy plan of Sacyr Construcción and Somague for an amount of €25.5m in 2016, and €17m of
Somague in 2017.
2017 – Presentation of Results 10
Operational Evolution (IV)
INTERNATIONAL EXPANSION: BACKLOG INCREASE +58%
41,001
25,956
+58%
27,163
12,926
+110%
INCREASE +110% CONCESSIONS BACKLOG
(€ million)
(€ million)
2017 – Presentation of Results 11
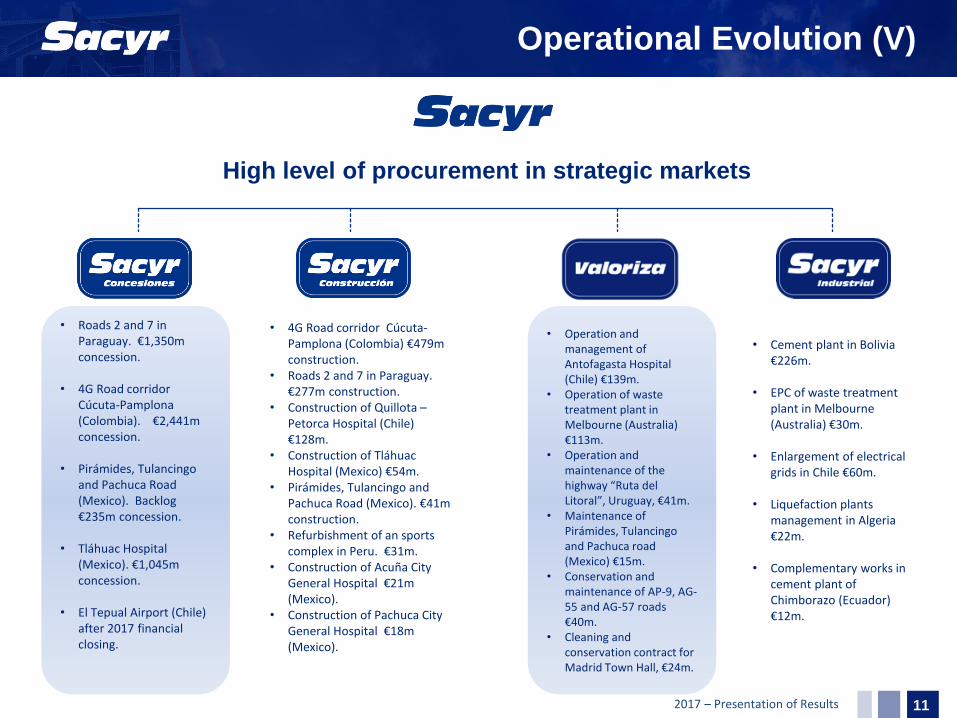
• Roads 2 and 7 in Paraguay. €1,350m concession.
• 4G Road corridor
Cúcuta-Pamplona (Colombia). €2,441m concession.
• Pirámides, Tulancingo and Pachuca Road (Mexico). Backlog €235m concession.
• Tláhuac Hospital (Mexico). €1,045m concession.
• El Tepual Airport (Chile) after 2017 financial closing.
• 4G Road corridor Cúcuta-
Pamplona (Colombia) €479m construction.
• Roads 2 and 7 in Paraguay. €277m construction.
• Construction of Quillota – Petorca Hospital (Chile) €128m.
• Construction of Tláhuac Hospital (Mexico) €54m.
• Pirámides, Tulancingo and Pachuca Road (Mexico). €41m construction.
• Refurbishment of an sports complex in Peru. €31m.
• Construction of Acuña City General Hospital €21m (Mexico).
• Construction of Pachuca City General Hospital €18m (Mexico).
• Operation and management of Antofagasta Hospital (Chile) €139m.
• Operation of waste treatment plant in Melbourne (Australia) €113m.
• Operation and maintenance of the highway “Ruta del Litoral”, Uruguay, €41m.
• Maintenance of Pirámides, Tulancingo and Pachuca road (Mexico) €15m.
• Conservation and maintenance of AP-9, AG-55 and AG-57 roads €40m.
• Cleaning and conservation contract for Madrid Town Hall, €24m.
• Cement plant in Bolivia
€226m.
• EPC of waste treatment plant in Melbourne (Australia) €30m.
• Enlargement of electrical grids in Chile €60m.
• Liquefaction plants management in Algeria €22m.
• Complementary works in cement plant of Chimborazo (Ecuador) €12m.
Operational Evolution (V)
High level of procurement in strategic markets
2017 – Presentation of Results 12
Deuda neta 2016 EBITDA* Working Capital Otros flujosoperativos + tax
Resultadofinanciero
Inversion Desinversion Repsol Otros +dif.conversión
Deuda neta Entradaperimetro
Pedemontana**
Deuda Neta 2017
(€ million) Net Debt decrease 2017 = (305)
Debt Evolution
Debt decrease due to
financing flow
(834)
Debt increase due
to net investment
513
Debt decrease due to
operating flow
(146)
(406)
(98)
213
145 3,726
3,259 36
(870)
3,421
582 (69)
162
* Does include expense due to Redundancy Plan €17m.
** Pedemontana debt increase €162m – €36m (EBITDA) + €5m (adjustments) = €131m
Net Debt
2016
Financial
Result
Other +
forex Other operating
flows + tax Consolidation
Pedemontana **
Net Debt Investment Divestment Net Debt
2017
2017 – Presentation of Results
HIGHLIGHTS
OPERATIONAL EVOLUTION
PERFORMANCE BY BUSINESS AREAS
ANNEXES
13
Table of Contents
2017 – Presentation of Results
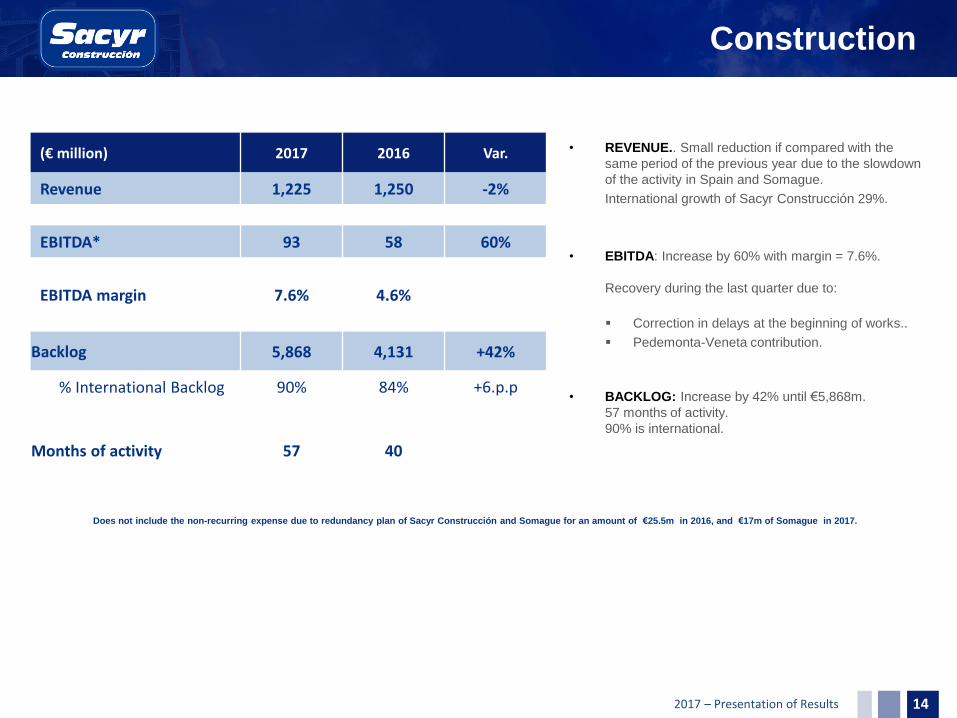
Construction
(€ million) 2017 2016 Var.
Revenue 1,225 1,250 -2%
EBITDA* 93 58 60%
EBITDA margin 7.6% 4.6%
Backlog 5,868 4,131 +42%
% International Backlog 90% 84% +6.p.p
Months of activity 57 40
14
• REVENUE.. Small reduction if compared with the
same period of the previous year due to the slowdown
of the activity in Spain and Somague.
International growth of Sacyr Construcción 29%.
• EBITDA: Increase by 60% with margin = 7.6%.
Recovery during the last quarter due to:
Correction in delays at the beginning of works..
Pedemonta-Veneta contribution.
• BACKLOG: Increase by 42% until €5,868m.
57 months of activity.
90% is international.
Does not include the non-recurring expense due to redundancy plan of Sacyr Construcción and Somague for an amount of €25.5m in 2016, and €17m of Somague in 2017.
2017 – Presentation of Results
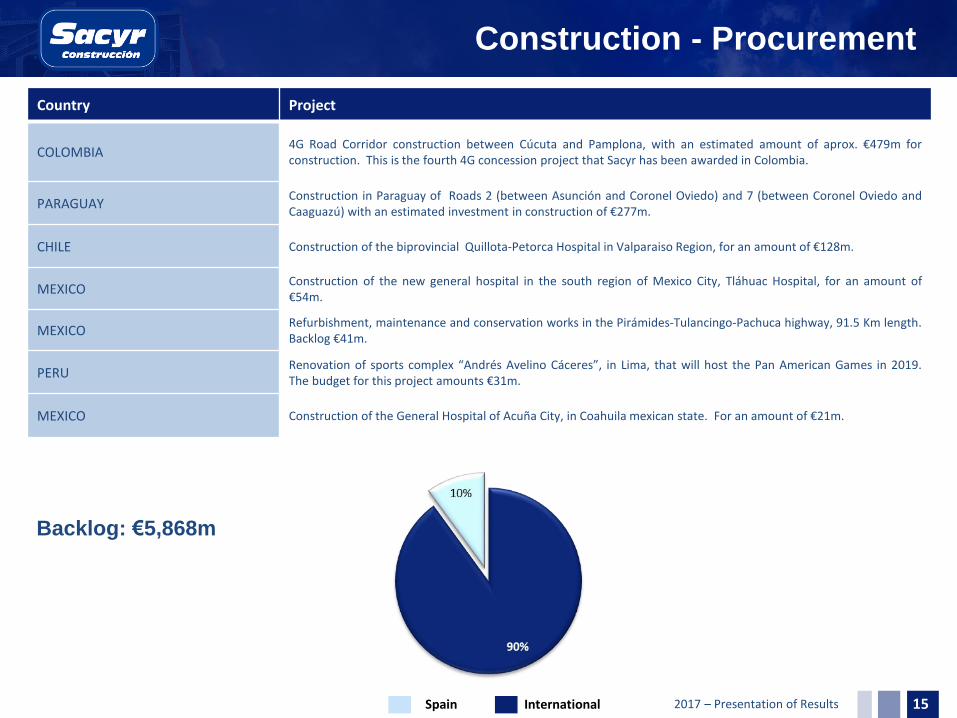
Construction - Procurement
15
Country Project
COLOMBIA 4G Road Corridor construction between Cúcuta and Pamplona, with an estimated amount of aprox. €479m for construction. This is the fourth 4G concession project that Sacyr has been awarded in Colombia.
PARAGUAY Construction in Paraguay of Roads 2 (between Asunción and Coronel Oviedo) and 7 (between Coronel Oviedo and Caaguazú) with an estimated investment in construction of €277m.
CHILE Construction of the biprovincial Quillota-Petorca Hospital in Valparaiso Region, for an amount of €128m.
MEXICO Construction of the new general hospital in the south region of Mexico City, Tláhuac Hospital, for an amount of €54m.
MEXICO Refurbishment, maintenance and conservation works in the Pirámides-Tulancingo-Pachuca highway, 91.5 Km length. Backlog €41m.
PERU Renovation of sports complex “Andrés Avelino Cáceres”, in Lima, that will host the Pan American Games in 2019. The budget for this project amounts €31m.
MEXICO Construction of the General Hospital of Acuña City, in Coahuila mexican state. For an amount of €21m.
Backlog: €5,868m
Spain International
2017 – Presentation of Results
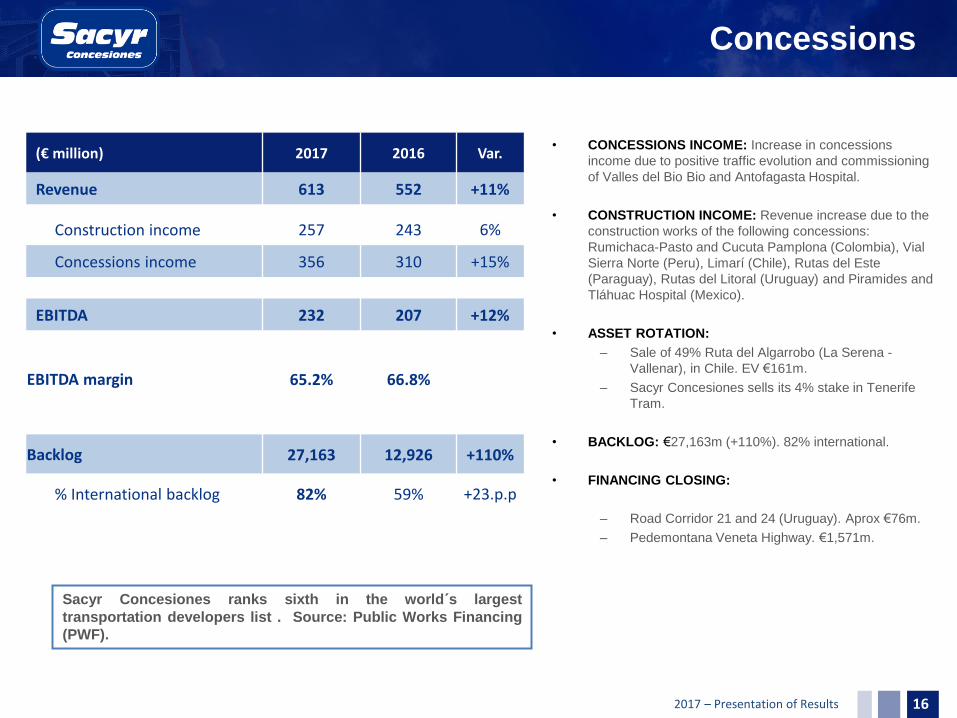
Concessions
(€ million) 2017 2016 Var.
Revenue 613 552 +11%
Construction income 257 243 6%
Concessions income 356 310 +15%
EBITDA 232 207 +12%
EBITDA margin 65.2% 66.8%
Backlog 27,163 12,926 +110%
% International backlog 82% 59% +23.p.p
• CONCESSIONS INCOME: Increase in concessions
income due to positive traffic evolution and commissioning
of Valles del Bio Bio and Antofagasta Hospital.
• CONSTRUCTION INCOME: Revenue increase due to the
construction works of the following concessions:
Rumichaca-Pasto and Cucuta Pamplona (Colombia), Vial
Sierra Norte (Peru), Limarí (Chile), Rutas del Este
(Paraguay), Rutas del Litoral (Uruguay) and Piramides and
Tláhuac Hospital (Mexico).
• ASSET ROTATION:
– Sale of 49% Ruta del Algarrobo (La Serena -
Vallenar), in Chile. EV €161m.
– Sacyr Concesiones sells its 4% stake in Tenerife
Tram.
• BACKLOG: €27,163m (+110%). 82% international.
• FINANCING CLOSING:
– Road Corridor 21 and 24 (Uruguay). Aprox €76m.
– Pedemontana Veneta Highway. €1,571m.
16
Sacyr Concesiones ranks sixth in the world´s largest
transportation developers list . Source: Public Works Financing
(PWF).
2017 – Presentation of Results
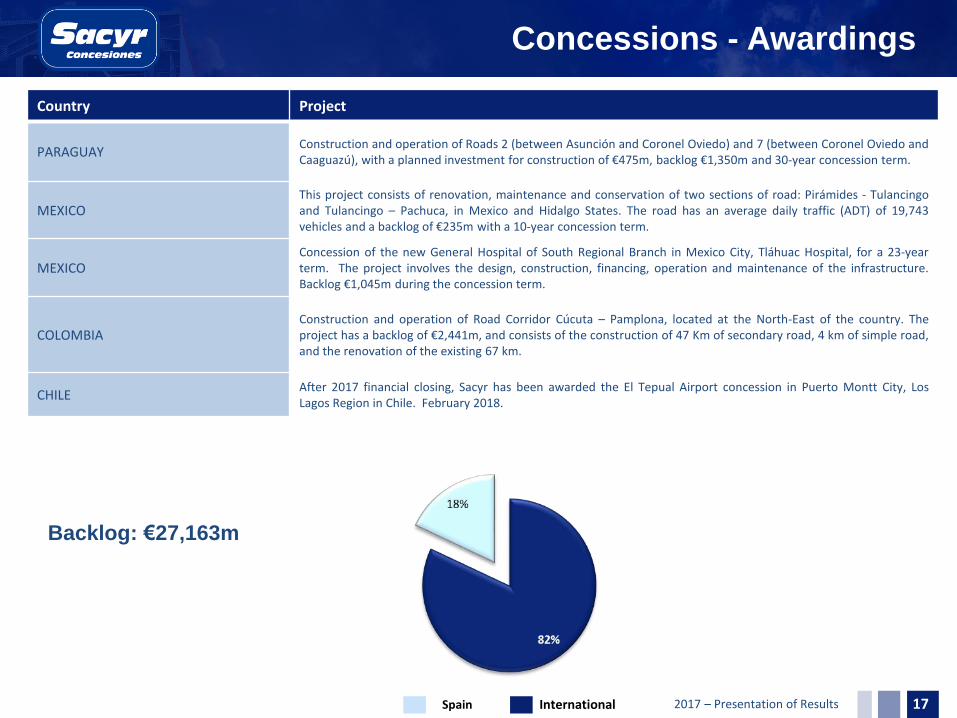
Concessions - Awardings
17
Country Project
PARAGUAY Construction and operation of Roads 2 (between Asunción and Coronel Oviedo) and 7 (between Coronel Oviedo and Caaguazú), with a planned investment for construction of €475m, backlog €1,350m and 30-year concession term.
MEXICO This project consists of renovation, maintenance and conservation of two sections of road: Pirámides - Tulancingo and Tulancingo – Pachuca, in Mexico and Hidalgo States. The road has an average daily traffic (ADT) of 19,743 vehicles and a backlog of €235m with a 10-year concession term.
MEXICO Concession of the new General Hospital of South Regional Branch in Mexico City, Tláhuac Hospital, for a 23-year term. The project involves the design, construction, financing, operation and maintenance of the infrastructure. Backlog €1,045m during the concession term.
COLOMBIA Construction and operation of Road Corridor Cúcuta – Pamplona, located at the North-East of the country. The project has a backlog of €2,441m, and consists of the construction of 47 Km of secondary road, 4 km of simple road, and the renovation of the existing 67 km.
CHILE After 2017 financial closing, Sacyr has been awarded the El Tepual Airport concession in Puerto Montt City, Los Lagos Region in Chile. February 2018.
Backlog: €27,163m
Spain International
2017 – Presentation of Results
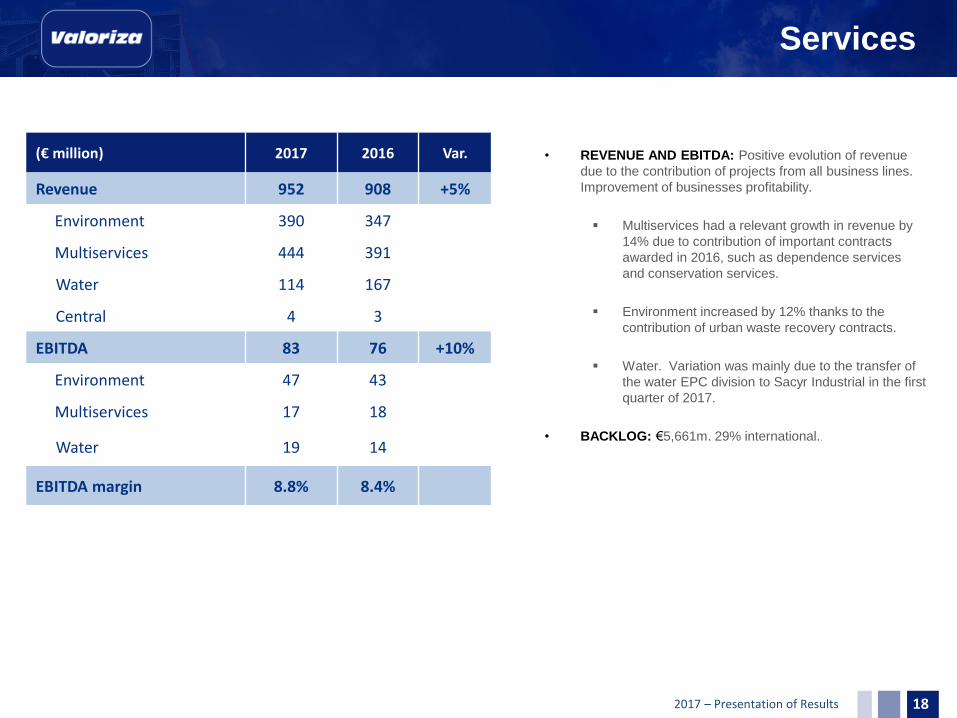
Services
• REVENUE AND EBITDA: Positive evolution of revenue
due to the contribution of projects from all business lines.
Improvement of businesses profitability.
Multiservices had a relevant growth in revenue by
14% due to contribution of important contracts
awarded in 2016, such as dependence services
and conservation services.
Environment increased by 12% thanks to the
contribution of urban waste recovery contracts.
Water. Variation was mainly due to the transfer of
the water EPC division to Sacyr Industrial in the first
quarter of 2017.
• BACKLOG: €5,661m. 29% international..
(€ million) 2017 2016 Var.
Revenue 952 908 +5%
Environment 390 347
Multiservices 444 391
Water 114 167
Central 4 3
EBITDA 83 76 +10%
Environment 47 43
Multiservices 17 18
Water 19 14
EBITDA margin 8.8% 8.4%
18
2017 – Presentation of Results
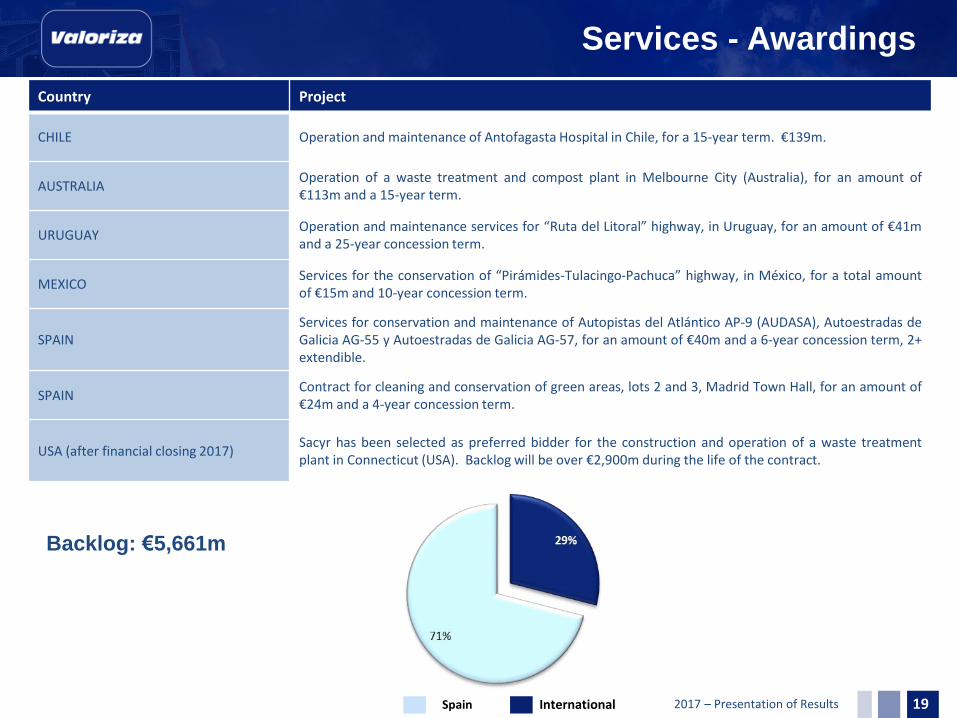
Services - Awardings
19
Country Project
CHILE Operation and maintenance of Antofagasta Hospital in Chile, for a 15-year term. €139m.
AUSTRALIA Operation of a waste treatment and compost plant in Melbourne City (Australia), for an amount of €113m and a 15-year term.
URUGUAY Operation and maintenance services for “Ruta del Litoral” highway, in Uruguay, for an amount of €41m and a 25-year concession term.
MEXICO Services for the conservation of “Pirámides-Tulacingo-Pachuca” highway, in México, for a total amount of €15m and 10-year concession term.
SPAIN Services for conservation and maintenance of Autopistas del Atlántico AP-9 (AUDASA), Autoestradas de Galicia AG-55 y Autoestradas de Galicia AG-57, for an amount of €40m and a 6-year concession term, 2+ extendible.
SPAIN Contract for cleaning and conservation of green areas, lots 2 and 3, Madrid Town Hall, for an amount of €24m and a 4-year concession term.
USA (after financial closing 2017) Sacyr has been selected as preferred bidder for the construction and operation of a waste treatment plant in Connecticut (USA). Backlog will be over €2,900m during the life of the contract.
Backlog: €5,661m
Spain International
2017 – Presentation of Results
Industrial
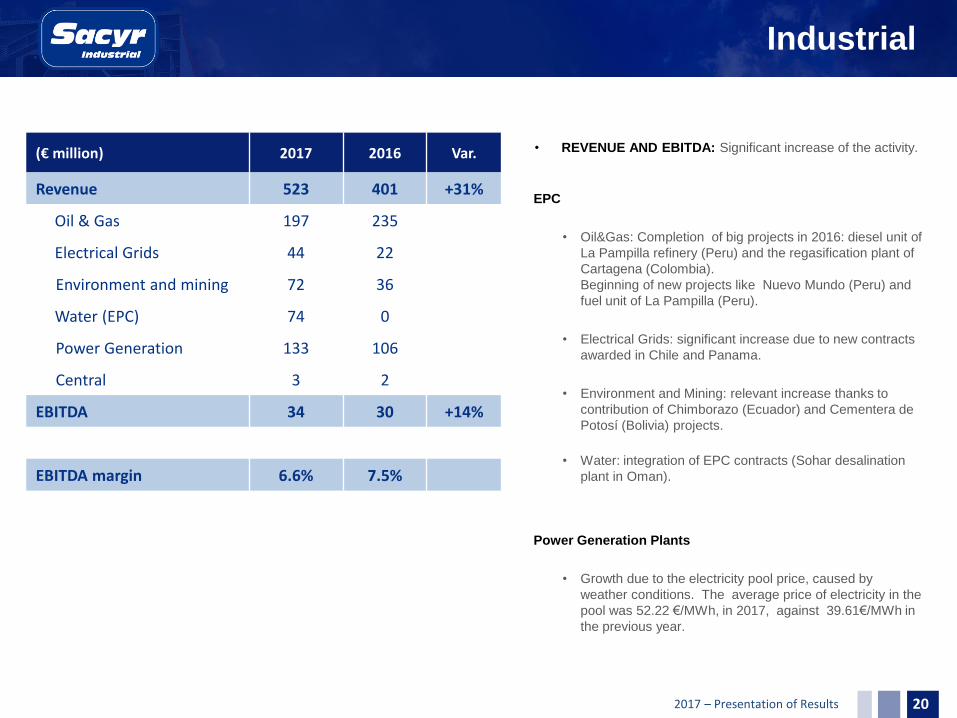
• REVENUE AND EBITDA: Significant increase of the activity.
EPC
• Oil&Gas: Completion of big projects in 2016: diesel unit of
La Pampilla refinery (Peru) and the regasification plant of
Cartagena (Colombia).
Beginning of new projects like Nuevo Mundo (Peru) and
fuel unit of La Pampilla (Peru).
• Electrical Grids: significant increase due to new contracts
awarded in Chile and Panama.
• Environment and Mining: relevant increase thanks to
contribution of Chimborazo (Ecuador) and Cementera de
Potosí (Bolivia) projects.
• Water: integration of EPC contracts (Sohar desalination
plant in Oman).
Power Generation Plants
• Growth due to the electricity pool price, caused by
weather conditions. The average price of electricity in the
pool was 52.22 €/MWh, in 2017, against 39.61€/MWh in
the previous year.
(€ million) 2017 2016 Var.
Revenue 523 401 +31%
Oil & Gas 197 235
Electrical Grids 44 22
Environment and mining 72 36
Water (EPC) 74 0
Power Generation 133 106
Central 3 2
EBITDA 34 30 +14%
EBITDA margin 6.6% 7.5%
20
2017 – Presentation of Results
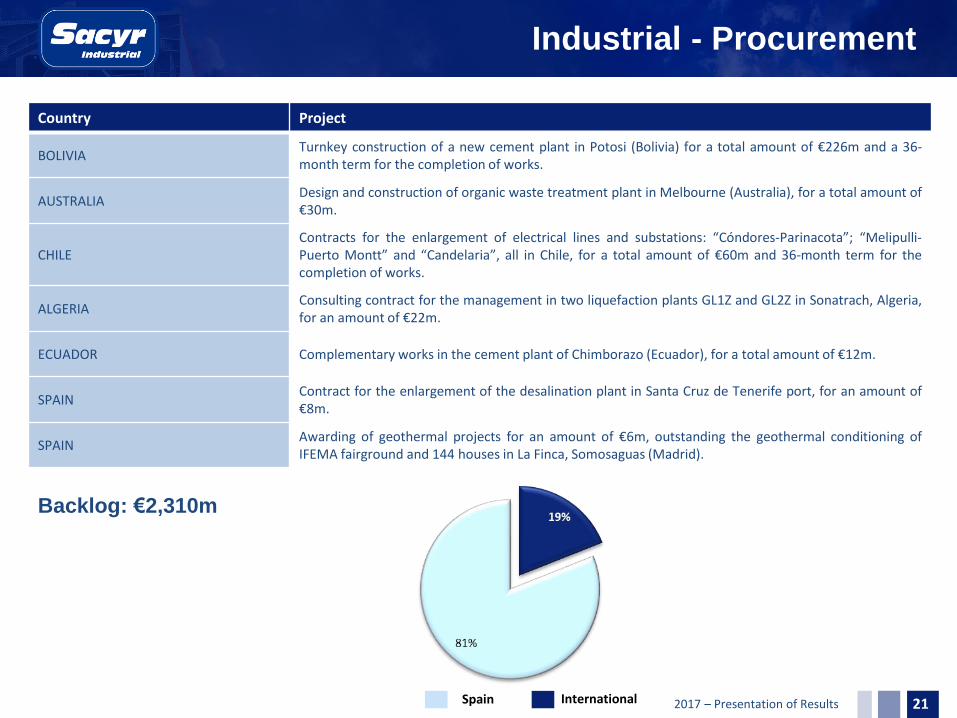
Industrial - Procurement
21
Country Project
BOLIVIA Turnkey construction of a new cement plant in Potosi (Bolivia) for a total amount of €226m and a 36-month term for the completion of works.
AUSTRALIA Design and construction of organic waste treatment plant in Melbourne (Australia), for a total amount of €30m.
CHILE Contracts for the enlargement of electrical lines and substations: “Cóndores-Parinacota”; “Melipulli-Puerto Montt” and “Candelaria”, all in Chile, for a total amount of €60m and 36-month term for the completion of works.
ALGERIA Consulting contract for the management in two liquefaction plants GL1Z and GL2Z in Sonatrach, Algeria, for an amount of €22m.
ECUADOR Complementary works in the cement plant of Chimborazo (Ecuador), for a total amount of €12m.
SPAIN Contract for the enlargement of the desalination plant in Santa Cruz de Tenerife port, for an amount of €8m.
SPAIN Awarding of geothermal projects for an amount of €6m, outstanding the geothermal conditioning of IFEMA fairground and 144 houses in La Finca, Somosaguas (Madrid).
Backlog: €2,310m
Spain International
2017 – Presentation of Results 22
HIGHLIGHTS
OPERATIONAL EVOLUTION
PERFORMANCE BY BUSINESS AREAS
ANNEXES
Table of Contents
2017 – Presentation of Results
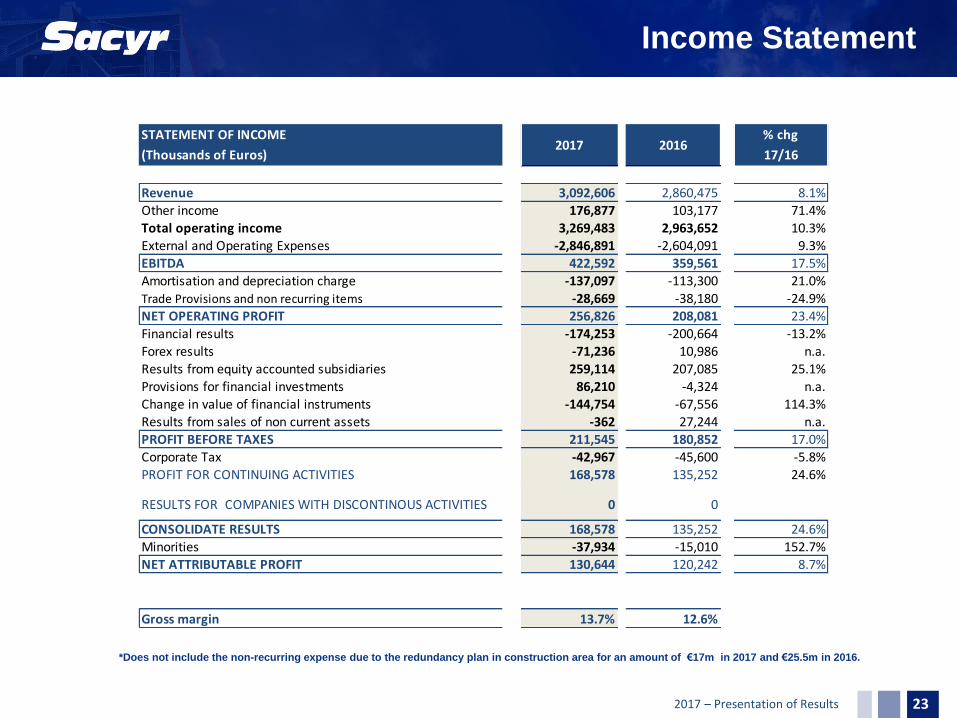
Income Statement
23
STATEMENT OF INCOME % chg
(Thousands of Euros) 17/16
Revenue 3,092,606 2,860,475 8.1%Other income 176,877 103,177 71.4%Total operating income 3,269,483 2,963,652 10.3%External and Operating Expenses -2,846,891 -2,604,091 9.3%EBITDA 422,592 359,561 17.5%Amortisation and depreciation charge -137,097 -113,300 21.0%Trade Provisions and non recurring items -28,669 -38,180 -24.9%NET OPERATING PROFIT 256,826 208,081 23.4%Financial results -174,253 -200,664 -13.2%Forex results -71,236 10,986 n.a.Results from equity accounted subsidiaries 259,114 207,085 25.1%Provisions for financial investments 86,210 -4,324 n.a.Change in value of financial instruments -144,754 -67,556 114.3%Results from sales of non current assets -362 27,244 n.a.PROFIT BEFORE TAXES 211,545 180,852 17.0%Corporate Tax -42,967 -45,600 -5.8%PROFIT FOR CONTINUING ACTIVITIES 168,578 135,252 24.6%
RESULTS FOR COMPANIES WITH DISCONTINOUS ACTIVITIES 0 0
CONSOLIDATE RESULTS 168,578 135,252 24.6%Minorities -37,934 -15,010 152.7%NET ATTRIBUTABLE PROFIT 130,644 120,242 8.7%
Gross margin 13.7% 12.6%
2017 2016
*Does not include the non-recurring expense due to the redundancy plan in construction area for an amount of €17m in 2017 and €25.5m in 2016.
2017 – Presentation of Results
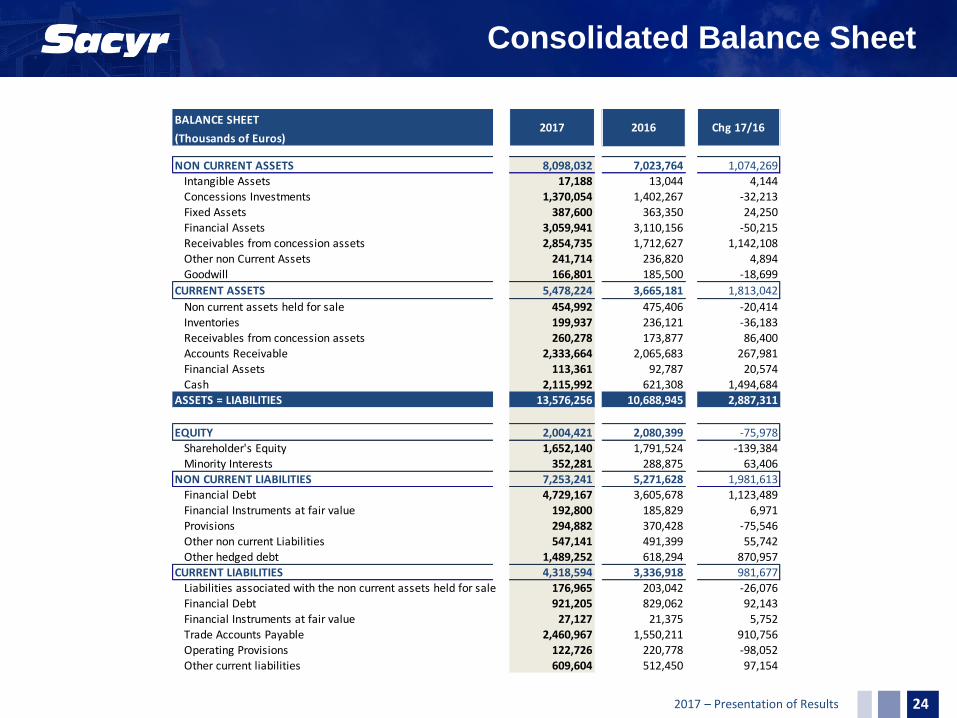
Consolidated Balance Sheet
24
BALANCE SHEET
(Thousands of Euros)
NON CURRENT ASSETS 8,098,032 7,023,764 1,074,269Intangible Assets 17,188 13,044 4,144Concessions Investments 1,370,054 1,402,267 -32,213Fixed Assets 387,600 363,350 24,250Financial Assets 3,059,941 3,110,156 -50,215Receivables from concession assets 2,854,735 1,712,627 1,142,108Other non Current Assets 241,714 236,820 4,894Goodwill 166,801 185,500 -18,699
CURRENT ASSETS 5,478,224 3,665,181 1,813,042
Non current assets held for sale 454,992 475,406 -20,414Inventories 199,937 236,121 -36,183Receivables from concession assets 260,278 173,877 86,400Accounts Receivable 2,333,664 2,065,683 267,981Financial Assets 113,361 92,787 20,574Cash 2,115,992 621,308 1,494,684
ASSETS = LIABILITIES 13,576,256 10,688,945 2,887,311
EQUITY 2,004,421 2,080,399 -75,978Shareholder's Equity 1,652,140 1,791,524 -139,384Minority Interests 352,281 288,875 63,406
NON CURRENT LIABILITIES 7,253,241 5,271,628 1,981,613Financial Debt 4,729,167 3,605,678 1,123,489Financial Instruments at fair value 192,800 185,829 6,971Provisions 294,882 370,428 -75,546Other non current Liabilities 547,141 491,399 55,742Other hedged debt 1,489,252 618,294 870,957
CURRENT LIABILITIES 4,318,594 3,336,918 981,677Liabilities associated with the non current assets held for sale 176,965 203,042 -26,076Financial Debt 921,205 829,062 92,143Financial Instruments at fair value 27,127 21,375 5,752Trade Accounts Payable 2,460,967 1,550,211 910,756Operating Provisions 122,726 220,778 -98,052Other current liabilities 609,604 512,450 97,154
Chg 17/162017 2016
2017 – Presentation of Results
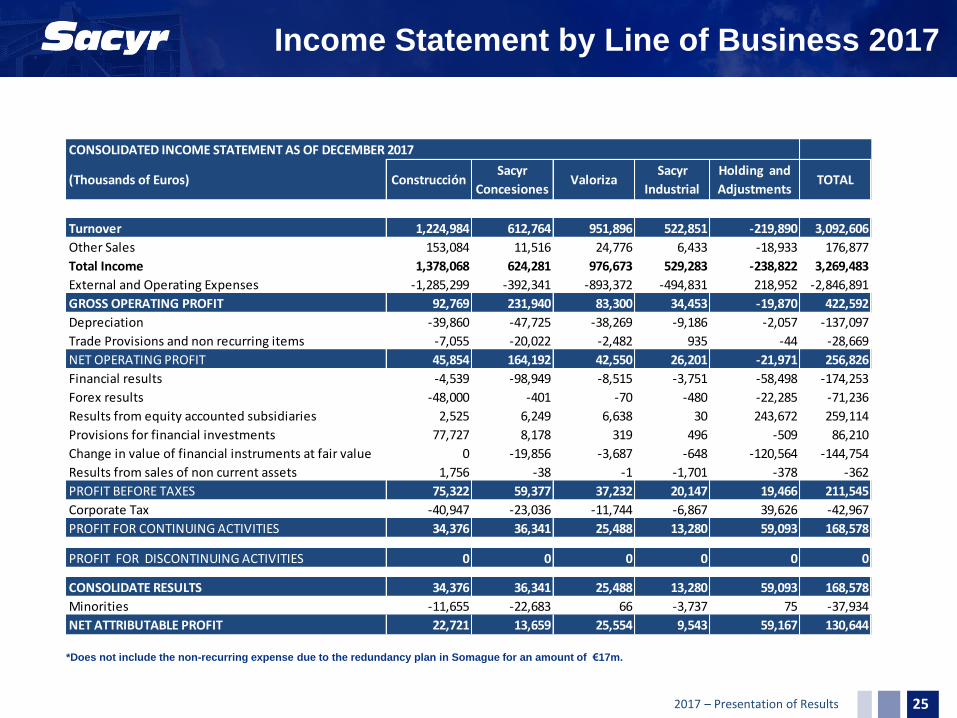
Income Statement by Line of Business 2017
25
CONSOLIDATED INCOME STATEMENT AS OF DECEMBER 2017
(Thousands of Euros) ConstrucciónSacyr
ConcesionesValoriza
Sacyr
Industrial
Holding and
AdjustmentsTOTAL
Turnover 1,224,984 612,764 951,896 522,851 -219,890 3,092,606
Other Sales 153,084 11,516 24,776 6,433 -18,933 176,877
Total Income 1,378,068 624,281 976,673 529,283 -238,822 3,269,483
External and Operating Expenses -1,285,299 -392,341 -893,372 -494,831 218,952 -2,846,891
GROSS OPERATING PROFIT 92,769 231,940 83,300 34,453 -19,870 422,592
Depreciation -39,860 -47,725 -38,269 -9,186 -2,057 -137,097
Trade Provisions and non recurring items -7,055 -20,022 -2,482 935 -44 -28,669
NET OPERATING PROFIT 45,854 164,192 42,550 26,201 -21,971 256,826
Financial results -4,539 -98,949 -8,515 -3,751 -58,498 -174,253
Forex results -48,000 -401 -70 -480 -22,285 -71,236
Results from equity accounted subsidiaries 2,525 6,249 6,638 30 243,672 259,114
Provisions for financial investments 77,727 8,178 319 496 -509 86,210
Change in value of financial instruments at fair value 0 -19,856 -3,687 -648 -120,564 -144,754
Results from sales of non current assets 1,756 -38 -1 -1,701 -378 -362
PROFIT BEFORE TAXES 75,322 59,377 37,232 20,147 19,466 211,545
Corporate Tax -40,947 -23,036 -11,744 -6,867 39,626 -42,967
PROFIT FOR CONTINUING ACTIVITIES 34,376 36,341 25,488 13,280 59,093 168,578
PROFIT FOR DISCONTINUING ACTIVITIES 0 0 0 0 0 0
CONSOLIDATE RESULTS 34,376 36,341 25,488 13,280 59,093 168,578
Minorities -11,655 -22,683 66 -3,737 75 -37,934
NET ATTRIBUTABLE PROFIT 22,721 13,659 25,554 9,543 59,167 130,644
*Does not include the non-recurring expense due to the redundancy plan in Somague for an amount of €17m.
2017 – Presentation of Results
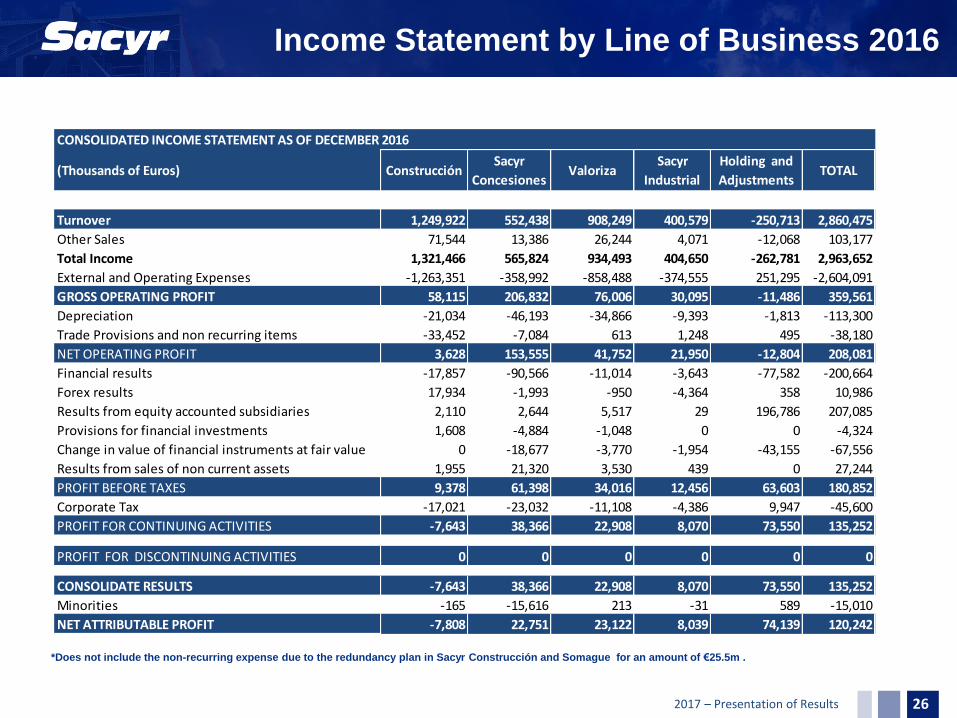
Income Statement by Line of Business 2016
26
CONSOLIDATED INCOME STATEMENT AS OF DECEMBER 2016
(Thousands of Euros) ConstrucciónSacyr
ConcesionesValoriza
Sacyr
Industrial
Holding and
AdjustmentsTOTAL
Turnover 1,249,922 552,438 908,249 400,579 -250,713 2,860,475
Other Sales 71,544 13,386 26,244 4,071 -12,068 103,177
Total Income 1,321,466 565,824 934,493 404,650 -262,781 2,963,652
External and Operating Expenses -1,263,351 -358,992 -858,488 -374,555 251,295 -2,604,091
GROSS OPERATING PROFIT 58,115 206,832 76,006 30,095 -11,486 359,561
Depreciation -21,034 -46,193 -34,866 -9,393 -1,813 -113,300
Trade Provisions and non recurring items -33,452 -7,084 613 1,248 495 -38,180
NET OPERATING PROFIT 3,628 153,555 41,752 21,950 -12,804 208,081
Financial results -17,857 -90,566 -11,014 -3,643 -77,582 -200,664
Forex results 17,934 -1,993 -950 -4,364 358 10,986
Results from equity accounted subsidiaries 2,110 2,644 5,517 29 196,786 207,085
Provisions for financial investments 1,608 -4,884 -1,048 0 0 -4,324
Change in value of financial instruments at fair value 0 -18,677 -3,770 -1,954 -43,155 -67,556
Results from sales of non current assets 1,955 21,320 3,530 439 0 27,244
PROFIT BEFORE TAXES 9,378 61,398 34,016 12,456 63,603 180,852
Corporate Tax -17,021 -23,032 -11,108 -4,386 9,947 -45,600
PROFIT FOR CONTINUING ACTIVITIES -7,643 38,366 22,908 8,070 73,550 135,252
PROFIT FOR DISCONTINUING ACTIVITIES 0 0 0 0 0 0
CONSOLIDATE RESULTS -7,643 38,366 22,908 8,070 73,550 135,252
Minorities -165 -15,616 213 -31 589 -15,010
NET ATTRIBUTABLE PROFIT -7,808 22,751 23,122 8,039 74,139 120,242
*Does not include the non-recurring expense due to the redundancy plan in Sacyr Construcción and Somague for an amount of €25.5m .
2017 – Presentation of Results
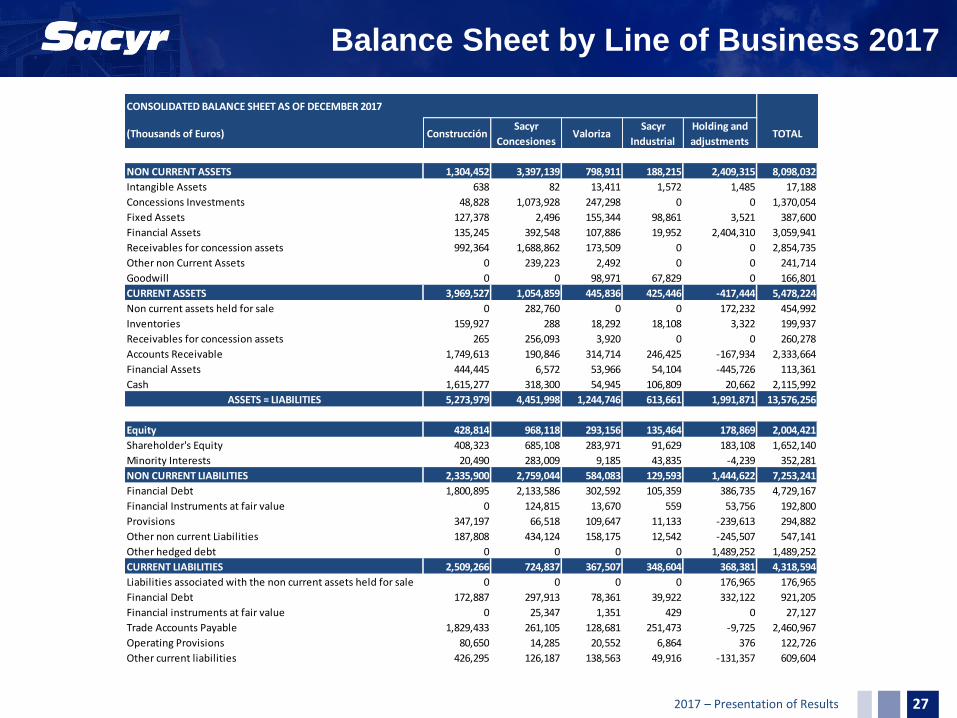
Balance Sheet by Line of Business 2017
27
CONSOLIDATED BALANCE SHEET AS OF DECEMBER 2017
(Thousands of Euros) ConstrucciónSacyr
ConcesionesValoriza
Sacyr
Industrial
Holding and
adjustmentsTOTAL
NON CURRENT ASSETS 1,304,452 3,397,139 798,911 188,215 2,409,315 8,098,032
Intangible Assets 638 82 13,411 1,572 1,485 17,188
Concessions Investments 48,828 1,073,928 247,298 0 0 1,370,054
Fixed Assets 127,378 2,496 155,344 98,861 3,521 387,600
Financial Assets 135,245 392,548 107,886 19,952 2,404,310 3,059,941
Receivables for concession assets 992,364 1,688,862 173,509 0 0 2,854,735
Other non Current Assets 0 239,223 2,492 0 0 241,714
Goodwill 0 0 98,971 67,829 0 166,801
CURRENT ASSETS 3,969,527 1,054,859 445,836 425,446 -417,444 5,478,224
Non current assets held for sale 0 282,760 0 0 172,232 454,992
Inventories 159,927 288 18,292 18,108 3,322 199,937
Receivables for concession assets 265 256,093 3,920 0 0 260,278
Accounts Receivable 1,749,613 190,846 314,714 246,425 -167,934 2,333,664
Financial Assets 444,445 6,572 53,966 54,104 -445,726 113,361
Cash 1,615,277 318,300 54,945 106,809 20,662 2,115,992
ASSETS = LIABILITIES 5,273,979 4,451,998 1,244,746 613,661 1,991,871 13,576,256
Equity 428,814 968,118 293,156 135,464 178,869 2,004,421
Shareholder's Equity 408,323 685,108 283,971 91,629 183,108 1,652,140
Minority Interests 20,490 283,009 9,185 43,835 -4,239 352,281
NON CURRENT LIABILITIES 2,335,900 2,759,044 584,083 129,593 1,444,622 7,253,241
Financial Debt 1,800,895 2,133,586 302,592 105,359 386,735 4,729,167
Financial Instruments at fair value 0 124,815 13,670 559 53,756 192,800
Provisions 347,197 66,518 109,647 11,133 -239,613 294,882
Other non current Liabilities 187,808 434,124 158,175 12,542 -245,507 547,141
Other hedged debt 0 0 0 0 1,489,252 1,489,252
CURRENT LIABILITIES 2,509,266 724,837 367,507 348,604 368,381 4,318,594
Liabilities associated with the non current assets held for sale 0 0 0 0 176,965 176,965
Financial Debt 172,887 297,913 78,361 39,922 332,122 921,205
Financial instruments at fair value 0 25,347 1,351 429 0 27,127
Trade Accounts Payable 1,829,433 261,105 128,681 251,473 -9,725 2,460,967
Operating Provisions 80,650 14,285 20,552 6,864 376 122,726
Other current liabilities 426,295 126,187 138,563 49,916 -131,357 609,604
2017 – Presentation of Results
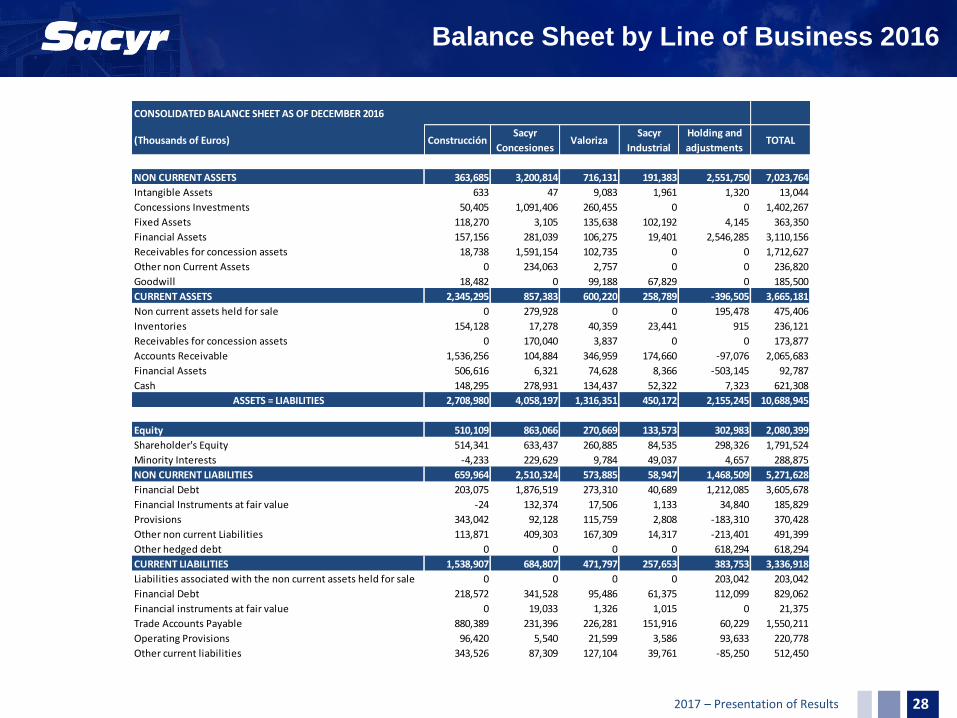
Balance Sheet by Line of Business 2016
28
CONSOLIDATED BALANCE SHEET AS OF DECEMBER 2016
(Thousands of Euros) ConstrucciónSacyr
ConcesionesValoriza
Sacyr
Industrial
Holding and
adjustmentsTOTAL
NON CURRENT ASSETS 363,685 3,200,814 716,131 191,383 2,551,750 7,023,764
Intangible Assets 633 47 9,083 1,961 1,320 13,044
Concessions Investments 50,405 1,091,406 260,455 0 0 1,402,267
Fixed Assets 118,270 3,105 135,638 102,192 4,145 363,350
Financial Assets 157,156 281,039 106,275 19,401 2,546,285 3,110,156
Receivables for concession assets 18,738 1,591,154 102,735 0 0 1,712,627
Other non Current Assets 0 234,063 2,757 0 0 236,820
Goodwill 18,482 0 99,188 67,829 0 185,500
CURRENT ASSETS 2,345,295 857,383 600,220 258,789 -396,505 3,665,181
Non current assets held for sale 0 279,928 0 0 195,478 475,406
Inventories 154,128 17,278 40,359 23,441 915 236,121
Receivables for concession assets 0 170,040 3,837 0 0 173,877
Accounts Receivable 1,536,256 104,884 346,959 174,660 -97,076 2,065,683
Financial Assets 506,616 6,321 74,628 8,366 -503,145 92,787
Cash 148,295 278,931 134,437 52,322 7,323 621,308
ASSETS = LIABILITIES 2,708,980 4,058,197 1,316,351 450,172 2,155,245 10,688,945
Equity 510,109 863,066 270,669 133,573 302,983 2,080,399
Shareholder's Equity 514,341 633,437 260,885 84,535 298,326 1,791,524
Minority Interests -4,233 229,629 9,784 49,037 4,657 288,875
NON CURRENT LIABILITIES 659,964 2,510,324 573,885 58,947 1,468,509 5,271,628
Financial Debt 203,075 1,876,519 273,310 40,689 1,212,085 3,605,678
Financial Instruments at fair value -24 132,374 17,506 1,133 34,840 185,829
Provisions 343,042 92,128 115,759 2,808 -183,310 370,428
Other non current Liabilities 113,871 409,303 167,309 14,317 -213,401 491,399
Other hedged debt 0 0 0 0 618,294 618,294
CURRENT LIABILITIES 1,538,907 684,807 471,797 257,653 383,753 3,336,918
Liabilities associated with the non current assets held for sale 0 0 0 0 203,042 203,042
Financial Debt 218,572 341,528 95,486 61,375 112,099 829,062
Financial instruments at fair value 0 19,033 1,326 1,015 0 21,375
Trade Accounts Payable 880,389 231,396 226,281 151,916 60,229 1,550,211
Operating Provisions 96,420 5,540 21,599 3,586 93,633 220,778
Other current liabilities 343,526 87,309 127,104 39,761 -85,250 512,450
2017 – Presentation of Results
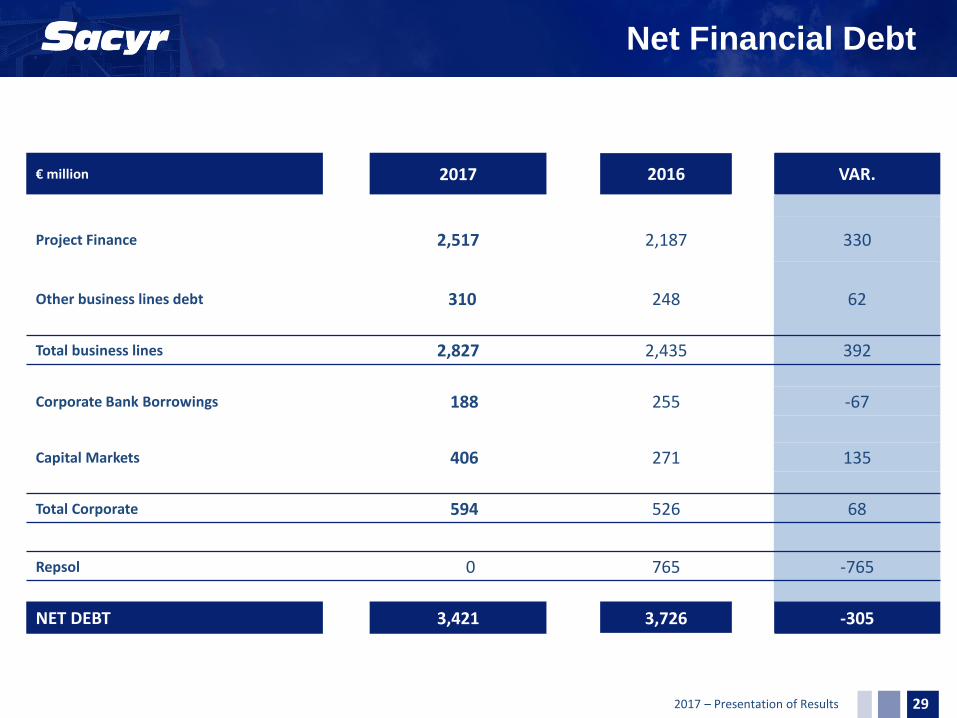
€ million 2017 2016 VAR.
Project Finance 2,517 2,187 330
Other business lines debt 310 248 62
Total business lines 2,827 2,435 392
Corporate Bank Borrowings 188 255 -67
Capital Markets 406 271 135
Total Corporate 594 526 68
Repsol 0 765 -765
NET DEBT 3,421 3,726 -305
Net Financial Debt
29
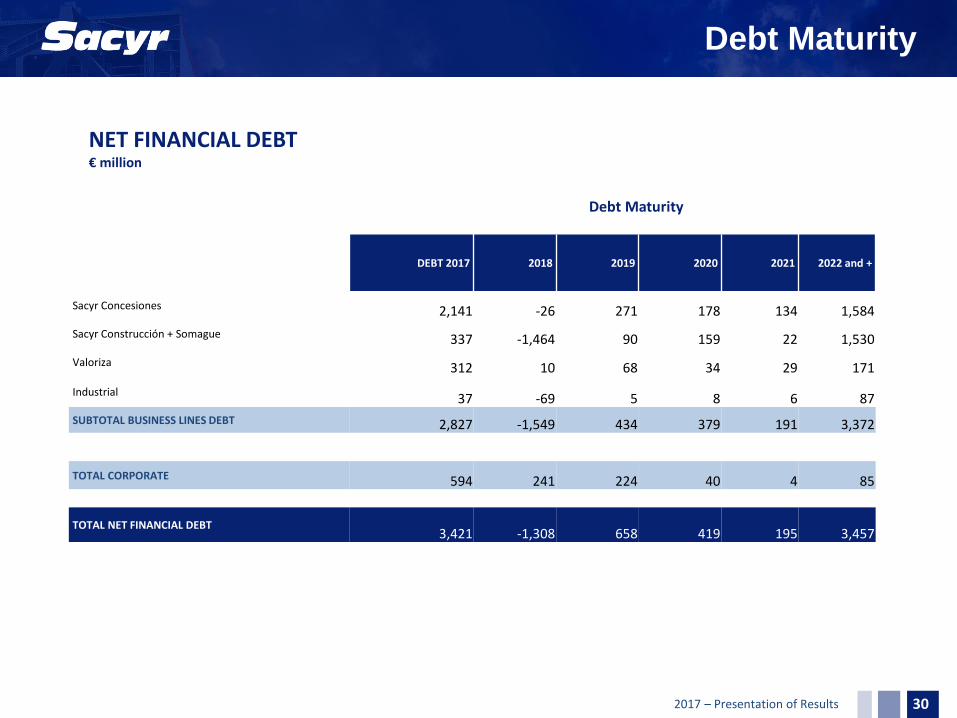
2017 – Presentation of Results 30
Debt Maturity
DEBT 2017 2018 2019 2020 2021 2022 and +
Sacyr Concesiones 2,141 -26 271 178 134 1,584
Sacyr Construcción + Somague 337 -1,464 90 159 22 1,530
Valoriza 312 10 68 34 29 171
Industrial 37 -69 5 8 6 87
SUBTOTAL BUSINESS LINES DEBT 2,827 -1,549 434 379 191 3,372
TOTAL CORPORATE 594 241 224 40 4 85
TOTAL NET FINANCIAL DEBT 3,421 -1,308 658 419 195 3,457
Debt Maturity
NET FINANCIAL DEBT € million
2017 – Presentation of Results
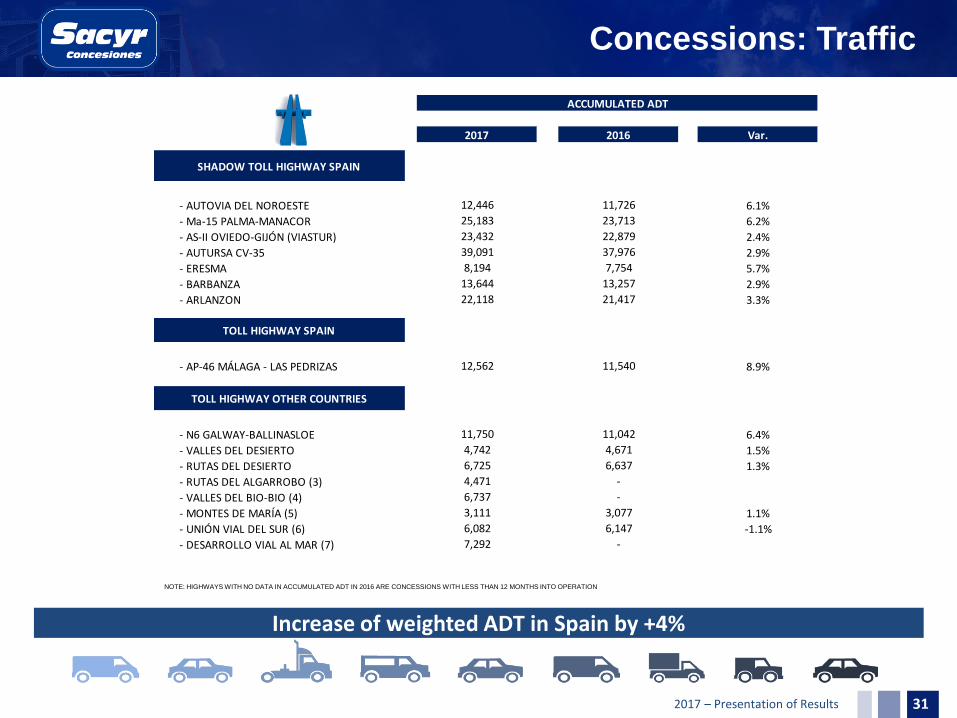
SHADOW TOLL HIGHWAY SPAIN
- AUTOVIA DEL NOROESTE
- Ma-15 PALMA-MANACOR
- AS-II OVIEDO-GIJÓN (VIASTUR)
- AUTURSA CV-35
- ERESMA
- BARBANZA
- ARLANZON
TOLL HIGHWAY SPAIN
- AP-46 MÁLAGA - LAS PEDRIZAS
TOLL HIGHWAY OTHER COUNTRIES
- N6 GALWAY-BALLINASLOE
- VALLES DEL DESIERTO
- RUTAS DEL DESIERTO
- RUTAS DEL ALGARROBO (3)
- VALLES DEL BIO-BIO (4)
- MONTES DE MARÍA (5)
- UNIÓN VIAL DEL SUR (6)
- DESARROLLO VIAL AL MAR (7)
ACCUMULATED ADT
2017 2016 Var.
12,446 11,726 6.1%25,183 23,713 6.2%23,432 22,879 2.4%39,091 37,976 2.9%8,194 7,754 5.7%
13,644 13,257 2.9%22,118 21,417 3.3%
12,562 11,540 8.9%
11,750 11,042 6.4%4,742 4,671 1.5%6,725 6,637 1.3%
3,111 3,077 1.1%
4,471 -
6,737 -
-1.1%7,292 -
6,082 6,147
Increase of weighted ADT in Spain by +4%
Concessions: Traffic
31
NOTE: HIGHWAYS WITH NO DATA IN ACCUMULATED ADT IN 2016 ARE CONCESSIONS WITH LESS THAN 12 MONTHS INTO OPERATION
2017 – Presentation of Results
Concessions: Income Breakdown
32
(Thousand of Euros) 2017 2016 Var. (%)
AUTOVÍA DEL TURIA 13,382.6 12,290.6 8.9%
AUTOVÍA NOROESTE C.A.R.M. 6,810.4 7,024.8 -3.1%
VIASTUR 7,225.1 7,022.6 2.9%
PALMA MANACOR 11,104.8 10,407.8 6.7%
AUTOVÍA DEL BARBANZA 9,335.2 9,007.6 3.6%
AUTOVÍA DEL ERESMA 7,195.7 6,719.7 7.1%
AUTOVÍA DEL ARLANZÓN 37,618.7 34,746.8 8.3%
INTERCAMBIADOR DE MONCLOA 12,665.2 12,547.5 0.9%
INTERCAMBIADOR DE PLAZA ELÍPTICA 6,709.3 6,578.1 2.0%
AUTOPISTA DE GUADALMEDINA 15,343.0 13,974.6 9.8%
HOSPITAL DE PARLA 13,050.0 13,962.4 -6.5%
HOSPITAL DE COSLADA 14,067.7 13,751.4 2.3%
HOLDINGS 1,598.6 2,068.4 -22.7%AEROPUERTO DE MURCIA CONCESIONARIA -100.0%
SPAIN 156,106.3 150,102.2 4.0%
SACYR CONCESSIONS - IRLANDA 1,261.6 1,252.0 0.8%
IRELAND 1,261.6 1,252.0 0.8%
HOLDINGS 938.3 1,023.7 -13.8%
ESCALA PARQUE - 326.7 -100.0%
PORTUGAL 938.3 4,029.8 -76.7%
HOLDINGS 1,495.9 1,425.0 4.7%
RUTAS DEL DESIERTO - ACCESOS A IQUIQUE 19,791.1 20,199.2 -2.0%
VALLES DEL BIO BIO - CONCEPCIÓN CABRERO 35,809.3 27,620.2 29.6%
VALLES DEL DESIERTO - VALLENAR CALDERA 23,009.1 23,263.4 -1.1%
RUTA 43 - LIMARI 3,739.4 1,673.7 123.4%
HOSPITAL ANTOFAGASTA 21,809.4 12,556.8 73.7%
SERENA VALLENAR - RUTAS DEL ALGARROBO 29,796.8 28,894.9 3.1%
CHILE 135,451.0 115,633.2 17.1%
CONVIAL SIERRA NORTE 13,818.3 14,387.5 -4.0%
PERU 13,818.3 14,387.5 -4.0%
HOLDINGS 809.7 444.0 82.4%MONTES DE MARÍA 16,940.9 12,526.2 35.2%RUMICHACA 10,371.9 11,142.4 -6.9%PAMPLONA-CÚCUTA 16,874.3 - n/a
COLOMBIA 44,996.8 24,112.5 86.6%
HOLDINGS 31.5 - n/aRUTAS DEL LITORAL 208.8 1.5 14245.0%
URUGUAY 240.3 1.5 n.a.
RUTAS DEL ESTE 1,074.3 - n/a
PARAGUAY 1,074.3 - n/a
HOSPITAL TLAHUAC 1,616.6 - n/aAUTOVIA PIRÁMIDES TULANCINGO PACHUCA 254.7 - n/a
MEXICO 1,871.4 - n/a
TOTAL WITHOUT CONSTRUCTION INCOME 355,758.3 309,518.7 14.9%
CONSTRUCTION INCOME 257,006.2 242,919.5 5.8%
TOTAL 612,764.5 552,438.2 10.9%
2017 – Presentation of Results
Alternative Performance Measures
33
The Sacyr Group presents its earnings in accordance with International Financial Reporting Standards (IFRS). The Group also provide certain additional financial
measurements, known as Alternative Performance Measures (APMs) used by management in decision-making and evaluation of the Group's financial performance, cash
flows and financial position.
In order to comply with the Guidelines on Alternative Performance Measures (2015/1415en) published by the European Securities and Markets Authority (ESMA), the
disclosures required for each APM are set out below, including its definition, reconciliation, explanation of its use, comparatives and consistency.
Sacyr Group considers that this additional information will improve the comparability, reliability and comprehensibility of its financial information. ALTERNATIVE PERFORMANCE MEASURES EBITDA: this indicator shows operating profit or loss prior to depreciation and amortisation and any change in provisions , excluding extraordinary/non-recurring profits and
losses.
EBIT: Calculated as the difference between Operating income (Revenue, Own work capitalized, Other operating income, Government grants released to the income statement)
and Operating expenses (Staff costs, Depreciation and amortisation expense, Changes in provisions and Other). GROSS DEBT: Comprises Non-current financial debt and Current financial debt as shown on the liabilities side of the consolidated statement of financial position, which include
bank borrowings and issues in capital markets (bonds). NET DEBT: Calculated as Gross debt less Other current financial assets and Cash and cash equivalents, from the asset side of the consolidated statement of financial position.
PROJECT FINANCE DEBT (GROSS OR NET): The financial debt (gross or net) from project companies. In this type of debt, the guarantee received by the lender is limited to the
project cash flow and its asset value, with limited recourse to shareholders. CORPORATE DEBT (GROSS OR NET): Debt held by the Group's Parent, comprising bank borrowings and issues in capital markets.
FINANCIAL RESULT: The difference between Total finance income and Total finance costs.
BACKLOG: Value of awarded and closed work contracts pending completion. These contracts are included in the backlog once they are formalised. The backlog is shown as
the percentage attributable to the Group, as per the corresponding consolidation method.
Once a contract has been included in the backlog, the value of production pending completion on the contract remains in the backlog, until it is completed or cancelled.
Nevertheless, valuation adjustments are made to reflect any changes in prices and time periods agreed with the client. Due to a number of factors, all or part of the backlog
linked to a contract may not actually become income. The Group's backlog is subject to adjustments and cancellation of projects, and cannot be taken as an exact indicator of
future earnings.
Given that no comparable financial measure is foreseen under IFRS, a reconciliation with the financial statements is not possible.
Management considers that the backlog is a useful indicator of the Group's future revenues and a customary indicator used by companies in the sector in which Sacyr
operates.
The concessions backlog represents estimated future revenues on concessions, over the concession period, based on the financial plan for each concession, and includes
projected fluctuations in the exchange rate between the euro and other currencies, as well as changes in inflation, prices, tolls and traffic volumes.
MARKET CAP: Number of shares at the end of the accounting period, multiplied by the share price at the end of the accounting period .
LIKE-FOR-LIKE BASIS: On occasions, certain figures are corrected to permit a comparison between accounting periods, for example, by eliminating non-recurring
impairment, significant changes in the consolidation scope that could distort the year-on-year comparison of indicators such as sales, the effect of exchange rates, etc. In
each case, details are provided in the notes to the corresponding item .
ADT: Defined as the total number of users of a concession during a day. ADT is normally calculated as the total number of vehicles travelling on the motorway each day
2017 – Presentation of Results
NOTE: The financial information contained in this document is drafted according to the International Financial Reporting
Standards. This information has not been audited and therefore may be modified in the future. This document is not a offer,
invitation or recommendation to buy, sell or exchange shares or make any kind of investment. Sacyr does not assume any
type of damages or losses as a result of the use of this document or its content.
In addition, the Group uses Alternative Performance Measures to provide with additional information which enhances the
comparability and comprehension of its financial information and facilitate the decision-making and the evaluation of the
group´s performance.
To comply with the Directives (2015/1415es) of European Securities and Markets Authority (ESMA) on APMs, this
document comprises the more outstanding APMs used in the preparation of this document (Annex).