preparing pre-service teachers to teach science to … · preparing pre-service teachers to teach...
TRANSCRIPT
PRELIMINARY ANALYSES OF SCIENCE LEARNING
Preparing Pre-Service Teachers to Teach Science to English
Language Learners: Preliminary Analyses of Impact on Student
Learning
Jerome M. Shaw1, Edward G. Lyon2, Eduardo Mosqueda1, Patricia Stoddart1, Preetha Menon1
1Department of Education
University of California, Santa Cruz
1156 High Street
Santa Cruz, CA 95064, USA
2Mary Lou Fulton Teachers College
Arizona State University
1050 S. Forest Mall
Tempe, AZ 85287-5411, USA
Correspondence to: Jerome Shaw; Email: [email protected]
Author Note
[Insert Author Note here]

PRELIMINARY ANALYSES OF SCIENCE LEARNING 2
Abstract
This paper presents student learning analyses conducted as part of the NSF-funded Effective
Science Teaching for English Language Learners (ESTELL) project. A collection of five,
research-based practices form the ESTELL instructional framework, which was integrated into
an intervention that included a revised methods course and other supports in post-baccalaureate
teacher education programs at three California universities. To explore the intervention’s
influence on student learning we gathered science achievement data from the classrooms of nine
beginning teachers who experienced the intervention. Participating teachers taught a common
science unit and their students (N = 185) were administered, pre and post instruction, an
assessment aligned with the common science unit. This assessment contained a mix of
constructed and selected response items covering three main categories – science concepts,
science vocabulary, and science writing. Preliminary results indicate that student learning
improved across all categories. The effect was large on science concepts (d = .949), medium on
science writing (d = .698), and non-existent on science vocabulary (d = .195). Learning
differences were found across grade levels, with generally larger effects in grades 3-4 than in
grades 5-6. Finally, ELL learning gains were on-par (no statistical difference) with non-ELLs
across all categories. These results suggest that the ESTELL intervention does lead to improved
student learning for both ELLs and Non-ELLs, even in novice elementary teachers. Further
analyses are needed to support this claim, such as (1) comparison of treatment with control
teachers, and (2) exploration of relationships between teacher fidelity of implementation of the
ESTELL instructional practices and measures of student learning.
Keywords: student achievement, English Language Learners, intervention study,
pre-service elementary teachers, science and literacy integration
PRELIMINARY ANALYSES OF SCIENCE LEARNING 3
Preparing Pre-Service Teachers to Teach Science to English Language Learners:
Preliminary Analyses of Impact on Student Learning
A critical challenge facing science education today is improving the teaching and
learning of students who do not speak English as a first language (English Language Learners, or
ELLs) and the preparation of teachers who serve them. ELLs are the fastest growing sector of the
school-age population (National Center for Education Statistics [NCES], 2006a; US Census,
2010). The National Education Association (NEA) projects that by 2025 one in four students in
the U.S. will be from homes where a language other than English is spoken. Currently,
California public schools – the context of this study – educate over one-third of the nation’s
ELLs (California Legislative Analyst’s Office Report, 2007-08). However, the number of ELLs
is growing rapidly in other parts of the country (Meyer, Madden, & McGrath, 2000), and they
are among the most academically vulnerable students in schools today (Wong-Fillmore & Snow,
2000). For at least thirty years, ELLs’ achievement in science, language, and literacy has lagged
behind that of native English speakers (Buxton, 2006; Grigg, Daane, Jin & Campell, 2003; Lee &
Luyxk, 2006; NCES, 2006). They are also less likely to pursue advanced degrees in science
(Commission on Professionals in Science and Technology [CPST], 2007; NAS, 2010) or to
perceive science subjects as being relevant to their lives (Aikenhead, 2006; Buxton, 2006;
Calabrese Barton, 2003; Lynch 2001; Rodriguez, 1998).
However, a new body of research has demonstrated that integrating the development of
English language and literacy through contextualized science inquiry improves the achievement
of ELLs in science (Baquedano-López, Solís, & Kattan, 2005; Bravo & Garcia, 2004; Cervetti,
Pearson, Barber, Hiebert & Bravo, 2007; Lee, Maerten-Rivera, Penfield, LeRoy, & Secada,
2008; Ovando & Combs, 2012; Rivet & Kracjik, 2008; Rosebery & Warren, 2008; Short, Vogt
PRELIMINARY ANALYSES OF SCIENCE LEARNING 4
& Echevarria, 2011; Tharp & Gallimore, 1988). Advances in the knowledge base on teaching
science to ELLs are consonant with the discourse around the development of the Next
Generation Science Standards (NGSS) based upon the National Research Council (2012) report,
A Framework for K-12 Science Education: Practices, Crosscutting Concepts, and Core Idea,
which recognizes that the teaching and learning of language and science content intersect as
students construct oral and written explanations and engage in argumentation from evidence
(Cheuk, 2012; Quinn, Lee & Valdes, 2012). As the Framework recognizes, science
investigations involve more than hands-on activities – they also involve active thinking and
discourse around activities (NRC, 2012).
Thus, the relationship between science learning and English language and literacy
development can be viewed as reciprocal and synergistic. Through the contextualized and
authentic use of language in scientific practices, students develop and practice complex language
forms and functions. Simultaneously, through the use of language functions such as explanations
and arguments in science investigations, students make sense of abstract core science ideas and
enhance their conceptual understanding as well as understanding of the nature of science (Driver,
Newton, & Osborne, 2000; Stoddart et. al, 2002).
This new approach to teaching science to ELLs presents two challenges to educators: (1)
the preparation of teachers to integrate the teaching of science language and literacy; and (2) the
assessment of student learning. Despite the severity and persistence of the achievement gap
between ELLs and their native English speaking peers, few teachers receive education in how to
teach science to ELLs (Ballantyne et al., 2008; Darling-Hammond, 2006; Gándara, Maxwell-
Jolly, & Driscoll, 2005; NCES, 2001; Stoddart et al., 2002, Villegas & Lucas, 2002). As a
consequence, most novice and experienced teachers do not feel prepared to teach ELLs
PRELIMINARY ANALYSES OF SCIENCE LEARNING 5
(California Legislative Analyst’s Office [LAO], 2007-2008; NCES, 2001). It is not surprising,
therefore, that ELLs are the group least likely to have a qualified or experienced science teacher
(Business-Higher Education Forum [BHEF], 2006; California Council on Science and
Technology [CCST], 2007; Oakes et al., 2004).
In addition, the recognition that effective science learning for ELLs requires the
integration of science, language and literacy teaching presents a challenge for assessing ELL
students’ learning. Language (text, forms of communication, and ways of participating) is at the
heart of equitably assessing ELLs (Lee, Santau, & Maerten-Rivera, 2011; Solano-Flores &
Nelson-Barber, 2001; Shaw, Bunch & Geaney, 2010). Previous research demonstrates that math
and science assessments items are often biased against ELLs due to complex sentence structure,
unfamiliar vocabulary, and cultural references (Martiniello, 2008; Shaftel, Belton-Kocher,
Glasnapp, & Poggio, 2006; Solano-Flores & Nelson-Barber, 2001). In fact, any content-area
assessment, such as science, also evaluates a student’s proficiency in the language of the
assessment (American Educational Research Association [AERA], American Psychological
Association [APA], & National Council on Measurement in Education [NCME], 1999). This
increases the assessment bias against ELLs and may result in misinformation about a student’s
science knowledge (Lee, 2005).
Approaches to addressing this bias include modification of assessment items to reduce or
remove irrelevant language demands (Siegel, 2007) and sensitizing raters so that they more
accurately score ELL written responses (Kopriva, 2008; Kopriva & Sexton, 1999). Additionally,
science-based assessments may include measures of language and literacy skills, including the
one used in this study, which aligns with tenets of our larger research program described next.
PRELIMINARY ANALYSES OF SCIENCE LEARNING 6
The ESTELL Project
The research presented in this paper is part of the Effective Science Teaching for English
Language Learners (ESTELL) project. With four years of funding from the National Science
Foundation, the ESTELL project focused on preparing pre-service teachers to integrate the
teaching of science, language, and literacy for ELLs. As described below, essential features of this
project are its (a) instructional framework, and (b) educational intervention.
The ESTELL Instructional Framework
The ESTELL instructional framework is based on research exploring teaching practices
that promote science, language, and literacy learning. The use of an integrated pedagogy for
ELLs has previously been studied by researchers from: (a) the USDOE funded Center for
Research on Education Diversity and Excellence (CREDE) project (Doherty & Pinal, 2004;
Hilberg, Tharp & DeGeest, 2000;) and (b) a set of NSF funded science-language-literacy
integration projects (Cervetti, Pearson, Barber, Hiebert & Bravo, 2007; ; Lee, Maerten-Rivera,
Penfield, LeRoy, & Secada, 2008; Stoddart, Pinal, Latzke & Canaday, 2002).
Both approaches have identified a common set of specific and observable teacher actions
that a substantial body of empirical research has demonstrated raise the achievement of culturally
and linguistically diverse students and improves their motivation to learn (Stoddart, Solis,
Tolbert & Bravo, 2010; Tharp & Dalton, 2007). For the ESTELL instructional framework, these
six teaching practices are: (1) facilitating collaborative inquiry, (2) promoting science talk, (3)
literacy in science, (4) scaffolding & development of language in science, (5) contextualizing
science activity, and (6) promoting complex thinking (see Table 1). Although the integration of
these practices into science teaching has been shown to improve the learning of ELLs, the
PRELIMINARY ANALYSES OF SCIENCE LEARNING 7
challenge is to prepare teachers to actually use this integrated pedagogy with ELLs, and to
evaluate the impact on ELLs’ learning of science, language, and literacy.
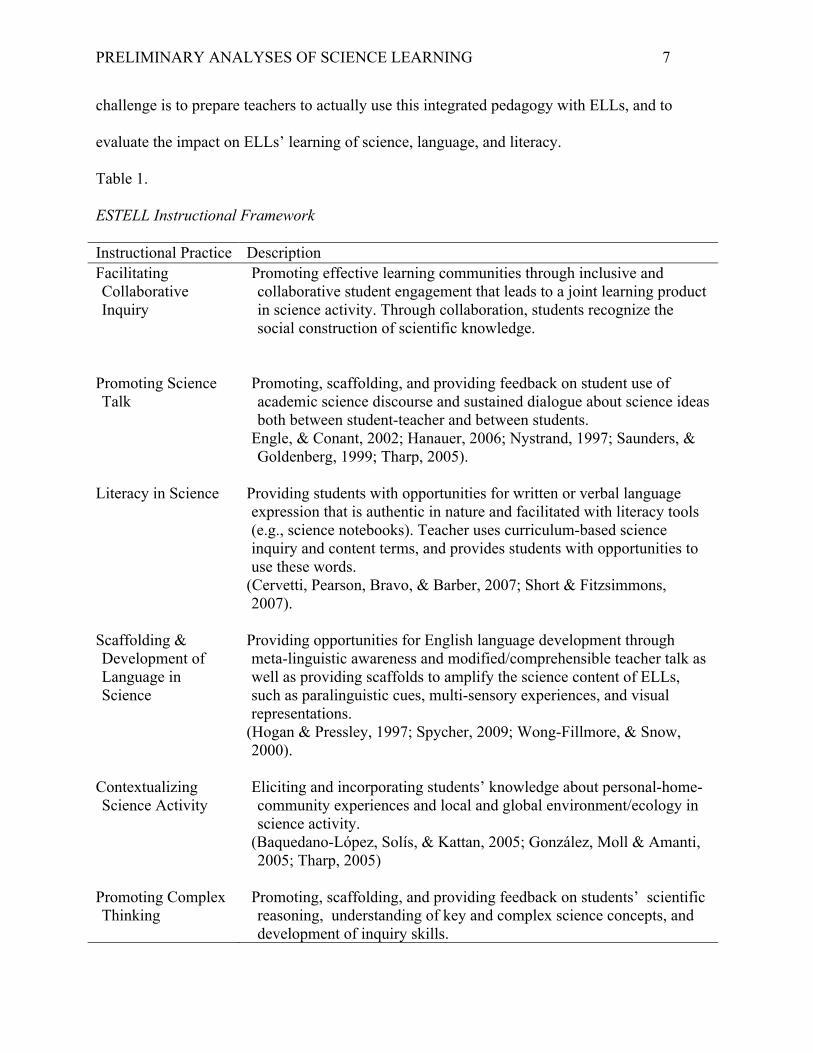
Table 1.
ESTELL Instructional Framework
Instructional Practice Description Facilitating Collaborative Inquiry
Promoting effective learning communities through inclusive and collaborative student engagement that leads to a joint learning product in science activity. Through collaboration, students recognize the social construction of scientific knowledge.
Promoting Science Talk
Promoting, scaffolding, and providing feedback on student use of academic science discourse and sustained dialogue about science ideas both between student-teacher and between students.
Engle, & Conant, 2002; Hanauer, 2006; Nystrand, 1997; Saunders, & Goldenberg, 1999; Tharp, 2005).
Literacy in Science Providing students with opportunities for written or verbal language
expression that is authentic in nature and facilitated with literacy tools (e.g., science notebooks). Teacher uses curriculum-based science inquiry and content terms, and provides students with opportunities to use these words.
(Cervetti, Pearson, Bravo, & Barber, 2007; Short & Fitzsimmons, 2007).
Scaffolding & Development of Language in Science
Providing opportunities for English language development through meta-linguistic awareness and modified/comprehensible teacher talk as well as providing scaffolds to amplify the science content of ELLs, such as paralinguistic cues, multi-sensory experiences, and visual representations.
(Hogan & Pressley, 1997; Spycher, 2009; Wong-Fillmore, & Snow, 2000).
Contextualizing Science Activity
Eliciting and incorporating students’ knowledge about personal-home-community experiences and local and global environment/ecology in science activity.
(Baquedano-López, Solís, & Kattan, 2005; González, Moll & Amanti, 2005; Tharp, 2005)
Promoting Complex Thinking
Promoting, scaffolding, and providing feedback on students’ scientific reasoning, understanding of key and complex science concepts, and development of inquiry skills.
PRELIMINARY ANALYSES OF SCIENCE LEARNING 8
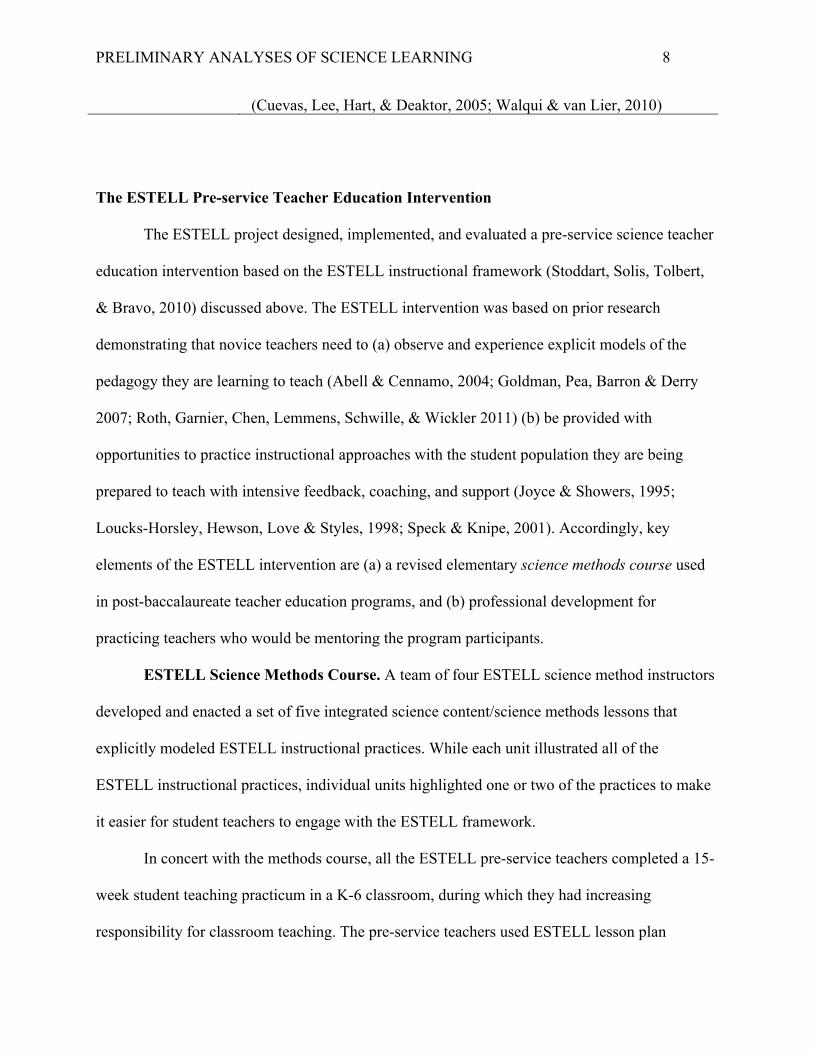
(Cuevas, Lee, Hart, & Deaktor, 2005; Walqui & van Lier, 2010)
The ESTELL Pre-service Teacher Education Intervention
The ESTELL project designed, implemented, and evaluated a pre-service science teacher
education intervention based on the ESTELL instructional framework (Stoddart, Solis, Tolbert,
& Bravo, 2010) discussed above. The ESTELL intervention was based on prior research
demonstrating that novice teachers need to (a) observe and experience explicit models of the
pedagogy they are learning to teach (Abell & Cennamo, 2004; Goldman, Pea, Barron & Derry
2007; Roth, Garnier, Chen, Lemmens, Schwille, & Wickler 2011) (b) be provided with
opportunities to practice instructional approaches with the student population they are being
prepared to teach with intensive feedback, coaching, and support (Joyce & Showers, 1995;
Loucks-Horsley, Hewson, Love & Styles, 1998; Speck & Knipe, 2001). Accordingly, key
elements of the ESTELL intervention are (a) a revised elementary science methods course used
in post-baccalaureate teacher education programs, and (b) professional development for
practicing teachers who would be mentoring the program participants.
ESTELL Science Methods Course. A team of four ESTELL science method instructors
developed and enacted a set of five integrated science content/science methods lessons that
explicitly modeled ESTELL instructional practices. While each unit illustrated all of the
ESTELL instructional practices, individual units highlighted one or two of the practices to make
it easier for student teachers to engage with the ESTELL framework.
In concert with the methods course, all the ESTELL pre-service teachers completed a 15-
week student teaching practicum in a K-6 classroom, during which they had increasing
responsibility for classroom teaching. The pre-service teachers used ESTELL lesson plan
PRELIMINARY ANALYSES OF SCIENCE LEARNING 9
templates to design and implement science lesson activities during their student teaching field
experiences.
Professional Development for Cooperating Teachers. Pre-service teachers were placed
in the classrooms of cooperating teachers who had been trained in ESTELL practices and had
used the practices in their own instruction. The cooperating teachers attended a two-day
ESTELL professional development institute where they were introduced to the ESTELL
framework and analyzed instructional exemplars of ESTELL practices (Stoddart et al., 2010).
They also participated in a personal learning experience through an ESTELL integrated
curriculum unit. The cooperating teachers were also trained in the use of the ESTELL
observation rubric and coached in mentoring techniques, which they used to support the
ESTELL pre-service teachers in implementing the ESTELL practices in their classrooms.
In addition to designing, implementing, and evaluating the intervention itself, the larger
ESTELL project also called for evidentiary support of the model’s efficacy on student learning.
This paper focuses on our preliminary analysis of student learning as described below.
Research Methods
We employed a quasi-experimental design that included convenience samples of control
and treatment beginning teachers (i.e., those who did not and did participate in the above-
described intervention), all of whom were graduates of teacher education programs at three
ESTELL-affiliated universities. While future studies will compare results across control and
treatment teachers, the results presented here focus exclusively on the treatment teachers and
their students.
PRELIMINARY ANALYSES OF SCIENCE LEARNING 10
Research Questions
Our preliminary analysis of ESTELL-trained teacher and student data is designed to
explore the following two questions:
1. What are the patterns of student learning gains?
2. What is the relationship between ELL status and student learning gains?
Teacher Sample
Teacher participants in this study are referred to as “Case Study Teachers” or CSTs. This
designation reflects the ESTELL project’s broader research design in which quantitative and
qualitative data will be integrated into a more holistic portrayal of student learning. The nine
CSTs in the present study were recruited from the total pool of ESTELL teacher participants in
years 3 and 4 of the project (185 in year 3, 195 in year 4). CST selection was based upon the
following required criteria: (1) participant in the ESTELL project (enrolled in either the control
or treatment course and completed a pre/post survey), and (2) mentored by a cooperating teacher
who participated in the ESTELL professional development during the time the CST engaged in
her/his teaching practicum. Further desired characteristics included (1) being a full time teacher
in a grade 3-6 classroom, (2) having a minimum of 25% ELL students, and (3) being employed
in California. Of the 13 CSTs selected, 10 were treatment teachers. One of these teachers taught
seventh grade, yet was selected because he completed a BCLAD program, which would serve as
a useful comparison in future qualitative analyses. Students from the 7th grade teacher’s class
were not included in this study, which focuses on the nine grade 3-6 treatment CSTs.
All nine CSTs in this study were females between the ages of 20 and 25, and received
their credential from one of the three ESTELL-affiliated universities. Two CSTs were non-White
PRELIMINARY ANALYSES OF SCIENCE LEARNING 11
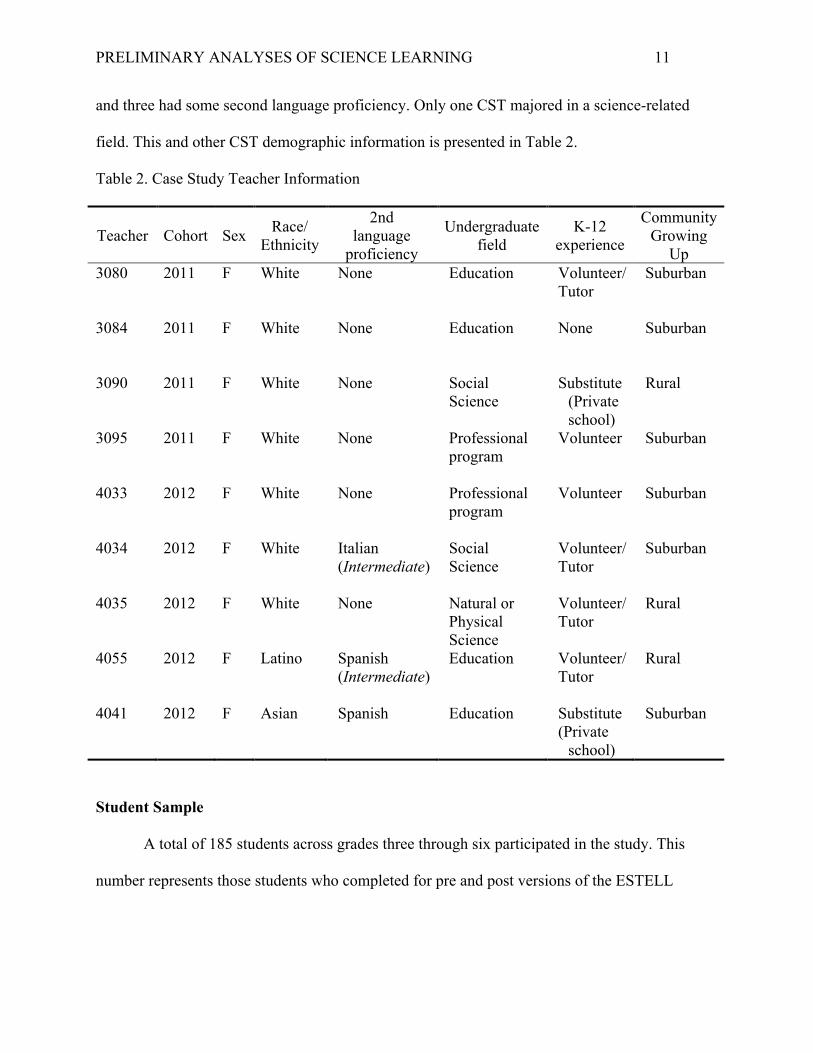
and three had some second language proficiency. Only one CST majored in a science-related
field. This and other CST demographic information is presented in Table 2.
Table 2. Case Study Teacher Information
Teacher Cohort Sex Race/ Ethnicity
2nd language
proficiency
Undergraduate field
K-12 experience
Community Growing
Up 3080 2011 F White None Education Volunteer/
Tutor Suburban
3084 2011 F White None Education None Suburban
3090 2011 F White None Social Science
Substitute (Private school)
Rural
3095 2011 F White None Professional program
Volunteer Suburban
4033 2012 F White None Professional program
Volunteer Suburban
4034 2012 F White Italian (Intermediate)
Social Science
Volunteer/ Tutor
Suburban
4035 2012 F White None Natural or Physical Science
Volunteer/ Tutor
Rural
4055 2012 F Latino Spanish (Intermediate)
Education Volunteer/ Tutor
Rural
4041 2012 F Asian Spanish
Education Substitute (Private
school)
Suburban
Student Sample
A total of 185 students across grades three through six participated in the study. This
number represents those students who completed for pre and post versions of the ESTELL

PRELIMINARY ANALYSES OF SCIENCE LEARNING 12
assessment (described below) and for whom we have ELL status information, including level of
proficiency in English as measured by the California English Language Development Test.
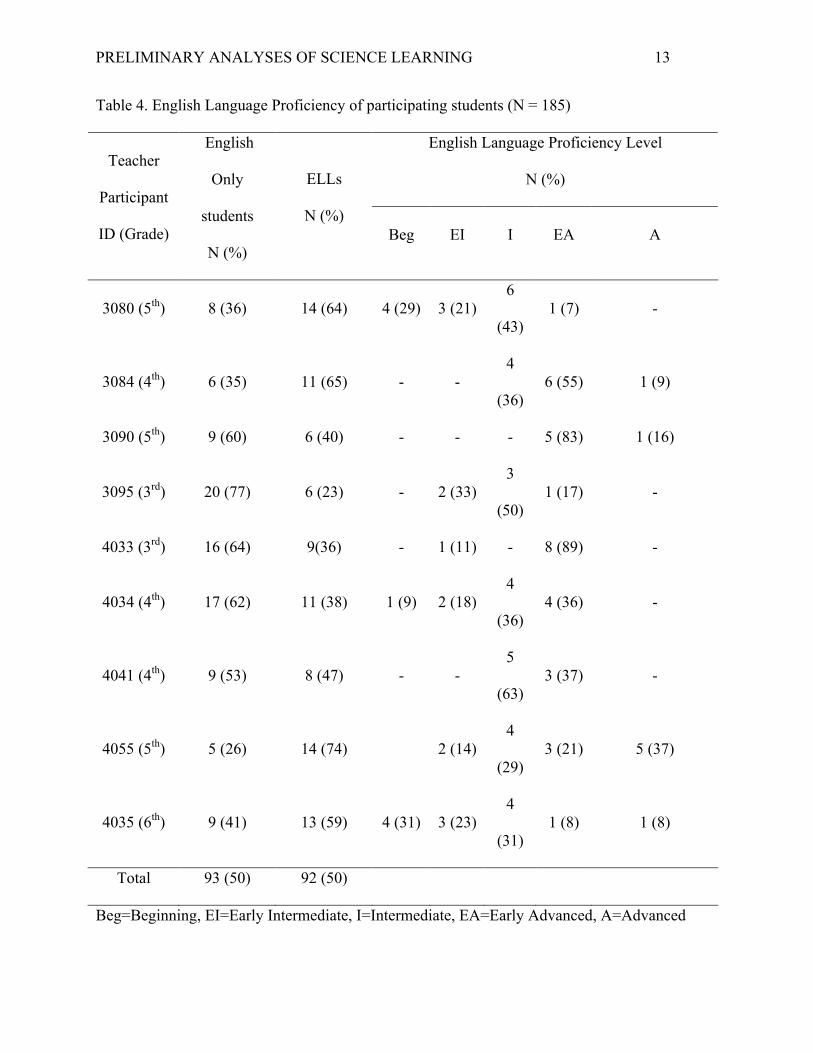
Students are predominantly Hispanic (62.2%) and 52 percent of the students are female
(see Table 3). Forty-nine percent (N=92) of the students are ELLs, distributed across four levels
of English language proficiency (see Table 4).
Table 3. Student Demographics for the total sample (N = 191)
Teacher Grade Total
students
Male*
White*
Hispanic*
Black*
Asian*
Multiracial*
Free/
Reduced
Lunch*
3080 5th 22 8(36) 5(23) 14(64) 1(5) - 2(9) 19(86)
3084 4th 17 11(64) - 17(100) - - - 12(71)
3090 5th 15 3(20) 6(40) 8(53) - - 1(7) na
3095 3rd 26 12(46) 7(27) 10(38) 2(7) 5(19) 2(8) 11(42)
4033 3rd 25 13(50) 3(12) 14(58) 4(16) 2(8) 2(8) na
4034 4th 28 12(41) 13(46) 14(50) 1(4) - - na
4041 4th 17 11(65) 4(23) 11(64) - 2(11) - na
4055 5th 19 10(52) - 18(95) - 1(4) - 19(100)
4035 6th 22 14(64) 5(22) 12(54) 3(13) - 2(9) 22(100)
*The percentage of students is in parenthesis
PRELIMINARY ANALYSES OF SCIENCE LEARNING 13
Table 4. English Language Proficiency of participating students (N = 185)
English Language Proficiency Level
N (%) Teacher
Participant
ID (Grade)
English
Only
students
N (%)
ELLs
N (%) Beg EI I EA A
3080 (5th) 8 (36) 14 (64) 4 (29) 3 (21) 6
(43) 1 (7) -
3084 (4th) 6 (35) 11 (65) - - 4
(36) 6 (55) 1 (9)
3090 (5th) 9 (60) 6 (40) - - - 5 (83) 1 (16)
3095 (3rd) 20 (77) 6 (23) - 2 (33) 3
(50) 1 (17) -
4033 (3rd) 16 (64) 9(36) - 1 (11) - 8 (89) -
4034 (4th) 17 (62) 11 (38) 1 (9) 2 (18) 4
(36) 4 (36) -
4041 (4th) 9 (53) 8 (47) - - 5
(63) 3 (37) -
4055 (5th) 5 (26) 14 (74) 2 (14) 4
(29) 3 (21) 5 (37)
4035 (6th) 9 (41) 13 (59) 4 (31) 3 (23) 4
(31) 1 (8) 1 (8)
Total 93 (50) 92 (50)
Beg=Beginning, EI=Early Intermediate, I=Intermediate, EA=Early Advanced, A=Advanced
PRELIMINARY ANALYSES OF SCIENCE LEARNING 14
Common Curriculum
To make fair comparisons of student achievement across all teachers, each teacher was
required to teach Terrarium Habitats, a science unit developed by the Great Explorations in
Mathematics and Science (GEMS) program at the Lawrence Hall of Science (Housome and
Barber, 1994). Terrarium Habitats, intended for grades K-6, introduces students to key ecological
concepts - such as the role of soil, an organism’s habitat, and decomposition in an ecosystem, as
well as the concept of adaptation - as students build a model terrarium and add to it organisms
such as earthworms and isopods. Depending on the frequency and duration of science
instruction, teaching of the unit’s five investigations can span from one to several weeks.
We selected Terrarium Habitats since it was aligned with grade 3-6 California standards
(the grade range of our teachers) and did not have an explicit focus on integrating literacy and
science. The latter attribute allowed researchers to see the impact of teachers’ application of what
they learned in their methods course, and not the impact of the curriculum itself, on student
achievement. Other considerations included the demands on teacher time for preparation and
implementation, availability of validated corresponding assessment items, and affordability of
the materials.
Before teaching Terrarium Habitats, all CSTs participated in a two-day (11-hour)
workshop that (1) oriented them to project goals, responsibilities, and logistics; (2) familiarized
them with the focal science unit and assessment; (3) enhanced their understanding of the focal
science unit’s content; and (4) supported them in developing draft plans for teaching the focal
science unit.
PRELIMINARY ANALYSES OF SCIENCE LEARNING 15
The ESTELL Student Assessment
Project researchers designed the ESTELL Student Assessment to measure student
achievement of curriculum-based learning addressed in the Terrarium Habitats unit. The
assessment is composed of items from the Soil Habitats summative assessment packet
(Lawrence Hall of Science, 2007). Those items were developed by Non-ESTELL affiliated
researchers to accompany the Soil Habitats curricular unit, which itself is an updated version of
Terrarium Habitats (which does not have an assessment package). Soil Habitats assessment
items were selected because of their alignment with the Terrarium Habitats content and their
inclusion of literacy tasks, such as for writing and vocabulary. In some cases, minor revisions
were made to the Soil Habitats assessment items to maintain alignment with the Terrarium
Habitats curriculum. For example, items that contained the phrase “worm box” had those words
changed to “terrarium habitat” due to the fact that worm boxes were part of the Soil Habitats but
not the Terrarium Habitats unit. Such changes did not alter the content focus of the effected
items.
The ESTELL Student Assessment consists of three achievement categories (science
concepts, science writing, and science vocabulary) and one affective category (science attitudes).
These categories were combined into a two-part test: Part A includes science writing and
attitudes while Part B includes science concepts and vocabulary. In this study, we focus solely on
the three achievement categories. Information regarding score ranges and item reliability for
those categories is provided in Table 5.
Science Concepts. This category is composed of 14 items (12 multiple-choice; 2
constructed response) across two conceptual clusters: “Decomposition” and “Adaptation.”
PRELIMINARY ANALYSES OF SCIENCE LEARNING 16
Multiple-choice items ask questions, such as “An earthworm’s tail can break off and then grow
back. Which of these explains why that is an important adaptation for earthworms?” The two
constructed response items are as follows: “What could you observe in a terrarium habitat that
would be evidence of decomposition?” (Decomposition cluster) and “Choose one of these
organisms: earthworm, pill bug, or sow bug. For this organism, describe something it does or
something about its body that helps protect the organism from predators” (Adaptation cluster).
Since internal consistency for the multiple-choice items in each conceptual cluster was
unacceptable (α < .700), all multiple-choice items were grouped together to form one scale.
Science Writing. This item consists of the following prompt: Imagine that you are going
to make a place for an earthworm to live (in other words, a terrarium habitat). What 3 things
(living or non-living) would you put in your habitat to help an earthworm survive? For each
thing, explain how that thing would help an earthworm survive. Students were given written
guidelines to (1) Use complete sentences; (2) Use as many science words as possible; and (3) Be
as clear as possible. Before writing their response, students are given a 10 minute planning
period to (1) write words they think you will use (in a word box) and (2) make drawings that
they could write about (in a drawing box).
Science Vocabulary. This category consists of 30 multiple-choice items in which
students either choose the term that best matches the given definition (e.g., An organism that
breaks down dead plants and animals) or the term that would best complete a sentence (e.g.,
Earthworms are __________ that break down dead plants and animals in the soil). Fifteen of the
terms relate to science content vocabulary learned throughout the unit (e.g., decompose,
adaptation, nutrients) while the other 15 relate to more generic science inquiry vocabulary (e.g.,
predict, observe).
PRELIMINARY ANALYSES OF SCIENCE LEARNING 17
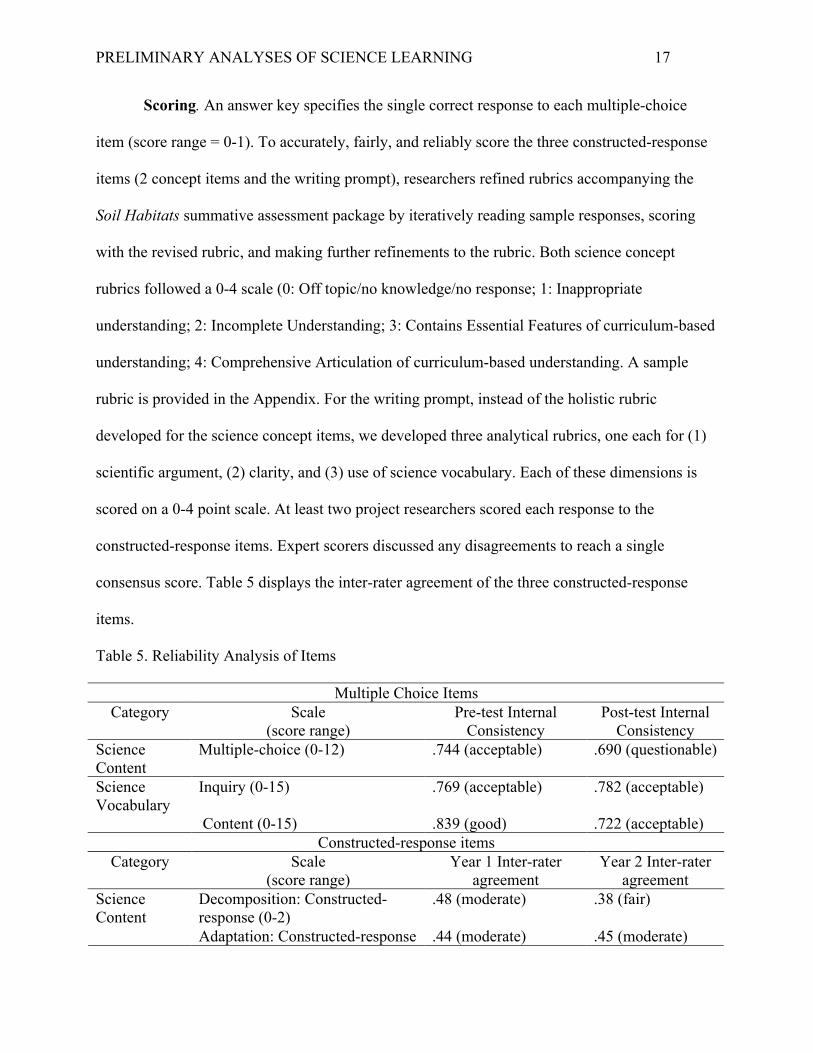
Scoring. An answer key specifies the single correct response to each multiple-choice
item (score range = 0-1). To accurately, fairly, and reliably score the three constructed-response
items (2 concept items and the writing prompt), researchers refined rubrics accompanying the
Soil Habitats summative assessment package by iteratively reading sample responses, scoring
with the revised rubric, and making further refinements to the rubric. Both science concept
rubrics followed a 0-4 scale (0: Off topic/no knowledge/no response; 1: Inappropriate
understanding; 2: Incomplete Understanding; 3: Contains Essential Features of curriculum-based
understanding; 4: Comprehensive Articulation of curriculum-based understanding. A sample
rubric is provided in the Appendix. For the writing prompt, instead of the holistic rubric
developed for the science concept items, we developed three analytical rubrics, one each for (1)
scientific argument, (2) clarity, and (3) use of science vocabulary. Each of these dimensions is
scored on a 0-4 point scale. At least two project researchers scored each response to the
constructed-response items. Expert scorers discussed any disagreements to reach a single
consensus score. Table 5 displays the inter-rater agreement of the three constructed-response
items.
Table 5. Reliability Analysis of Items
Multiple Choice Items Category Scale
(score range) Pre-test Internal
Consistency Post-test Internal
Consistency Science Content
Multiple-choice (0-12) .744 (acceptable) .690 (questionable)
Science Vocabulary
Inquiry (0-15) .769 (acceptable) .782 (acceptable)
Content (0-15) .839 (good) .722 (acceptable) Constructed-response items
Category Scale (score range)
Year 1 Inter-rater agreement
Year 2 Inter-rater agreement
Decomposition: Constructed-response (0-2)
.48 (moderate) .38 (fair) Science Content
Adaptation: Constructed-response .44 (moderate) .45 (moderate)
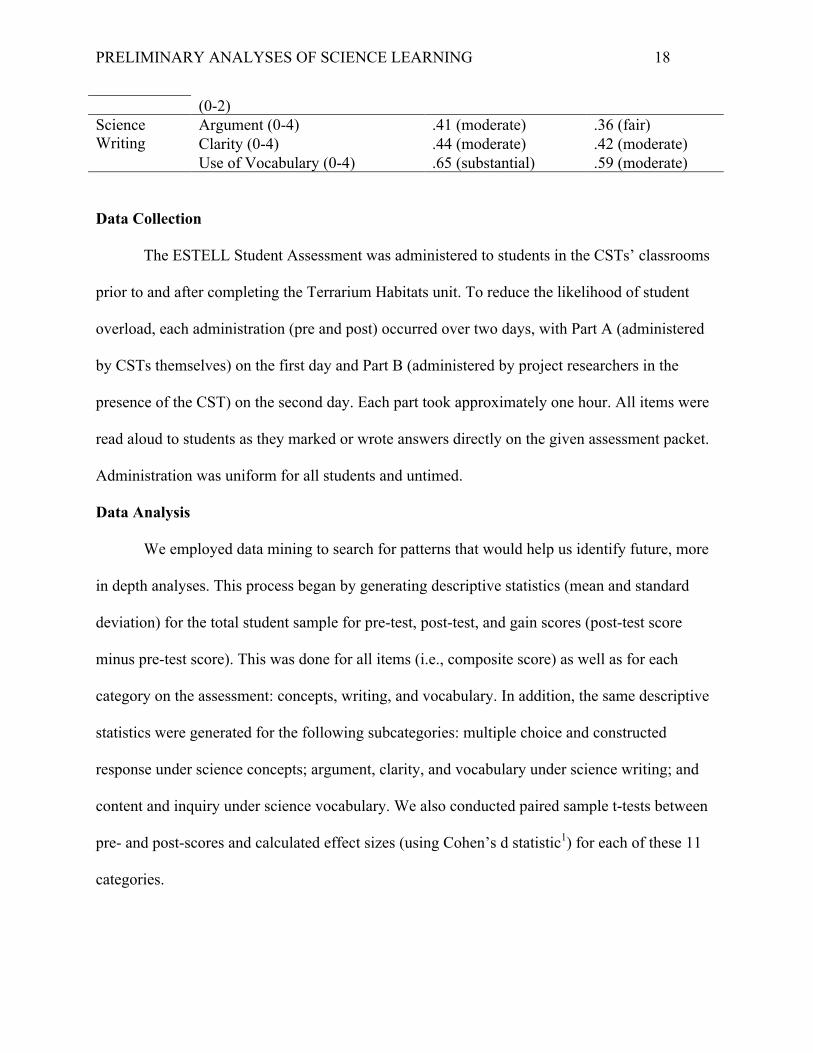
PRELIMINARY ANALYSES OF SCIENCE LEARNING 18
(0-2) Argument (0-4) .41 (moderate) .36 (fair) Clarity (0-4) .44 (moderate) .42 (moderate)
Science Writing
Use of Vocabulary (0-4) .65 (substantial) .59 (moderate)
Data Collection
The ESTELL Student Assessment was administered to students in the CSTs’ classrooms
prior to and after completing the Terrarium Habitats unit. To reduce the likelihood of student
overload, each administration (pre and post) occurred over two days, with Part A (administered
by CSTs themselves) on the first day and Part B (administered by project researchers in the
presence of the CST) on the second day. Each part took approximately one hour. All items were
read aloud to students as they marked or wrote answers directly on the given assessment packet.
Administration was uniform for all students and untimed.
Data Analysis
We employed data mining to search for patterns that would help us identify future, more
in depth analyses. This process began by generating descriptive statistics (mean and standard
deviation) for the total student sample for pre-test, post-test, and gain scores (post-test score
minus pre-test score). This was done for all items (i.e., composite score) as well as for each
category on the assessment: concepts, writing, and vocabulary. In addition, the same descriptive
statistics were generated for the following subcategories: multiple choice and constructed
response under science concepts; argument, clarity, and vocabulary under science writing; and
content and inquiry under science vocabulary. We also conducted paired sample t-tests between
pre- and post-scores and calculated effect sizes (using Cohen’s d statistic1) for each of these 11
categories.
PRELIMINARY ANALYSES OF SCIENCE LEARNING 19
Our next two cycles of analysis explored the data disaggregated by grade level (3rd-6th) and
teacher (9 individuals). For these groups, we generated the same descriptive statistics as for the
total sample. Finally, we conducted the same set of analyses (means and standard deviations for
composite, assessment categories and sub-categories, t-tests and effect sizes; by grade level and
by teacher) comparing ELLs to non-ELLs.
RESULTS
Question 1: Patterns of Student Learning Gains
In this section we present results from our analyses for the total sample in the following
order: comprehensive (composite, assessment categories and their respective sub-categories),
grade level, teacher. Results of our analyses comparing ELLs and Non ELLs (our second
research question) are presented in the subsequent section. Due to lack of space and notable
results, for the analyses by grade level and teacher we only report results at the comprehensive
and assessment category levels. This is done for both the total sample and ELL v. Non-ELL
comparisons.
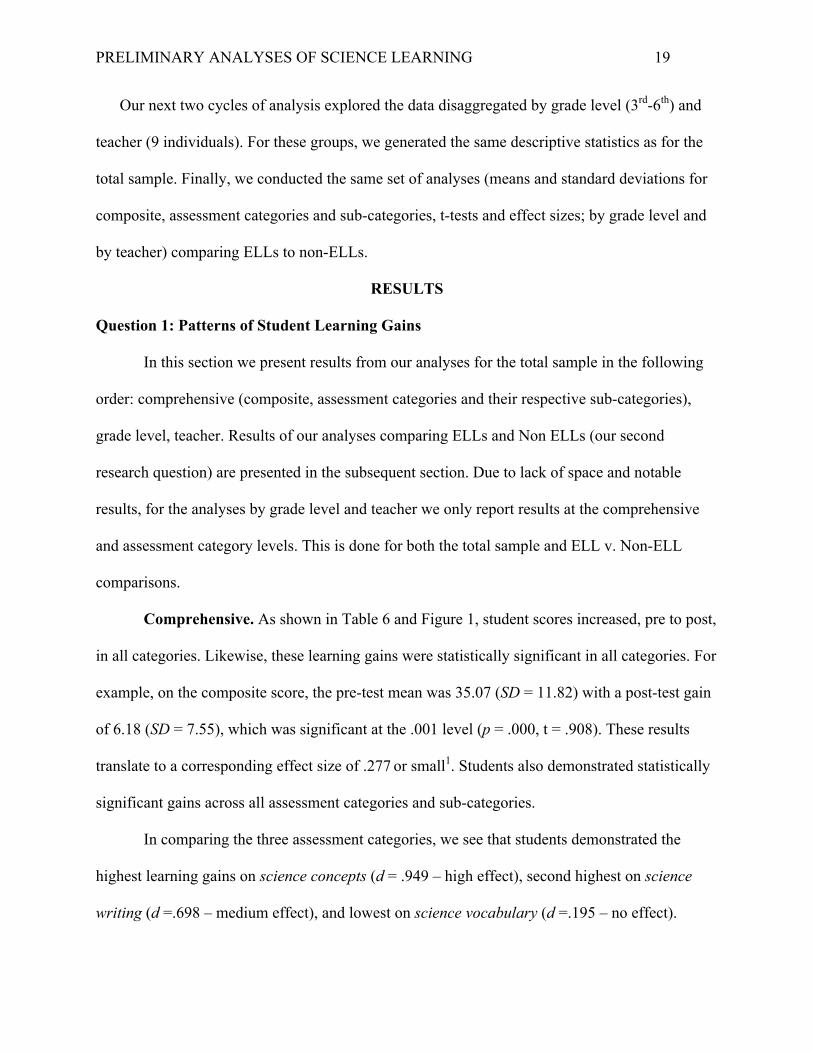
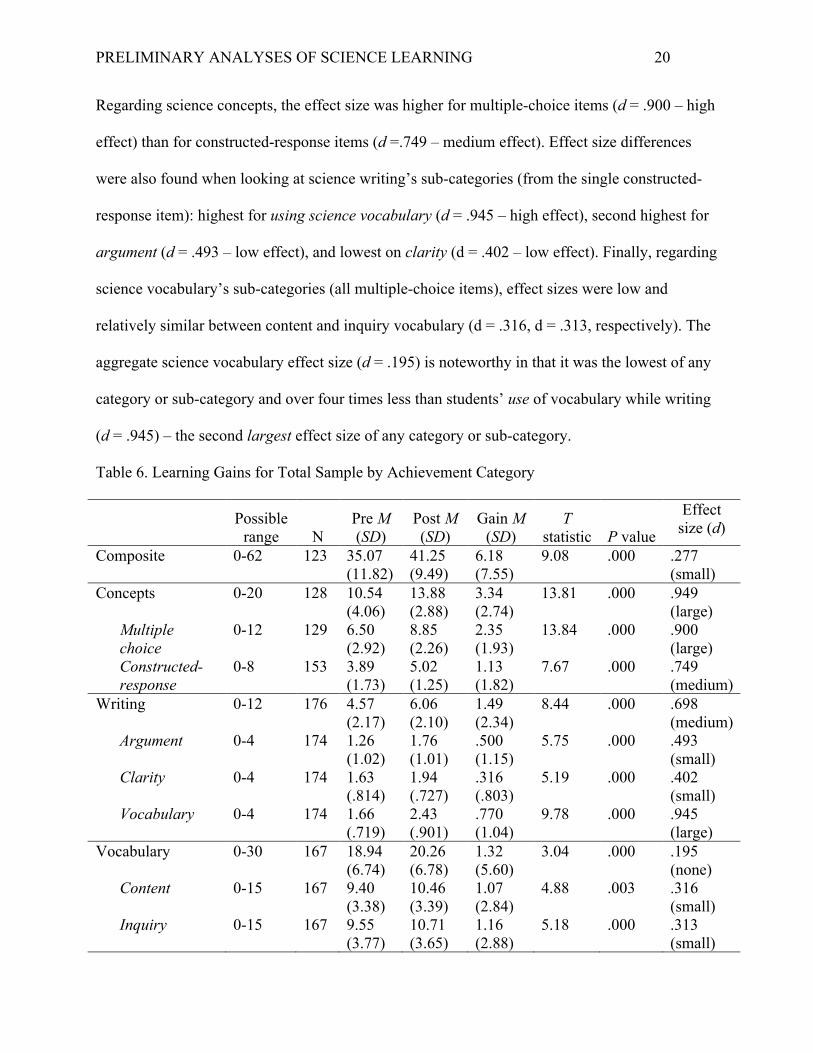
Comprehensive. As shown in Table 6 and Figure 1, student scores increased, pre to post,
in all categories. Likewise, these learning gains were statistically significant in all categories. For
example, on the composite score, the pre-test mean was 35.07 (SD = 11.82) with a post-test gain
of 6.18 (SD = 7.55), which was significant at the .001 level (p = .000, t = .908). These results
translate to a corresponding effect size of .277 or small1. Students also demonstrated statistically
significant gains across all assessment categories and sub-categories.
In comparing the three assessment categories, we see that students demonstrated the
highest learning gains on science concepts (d = .949 – high effect), second highest on science
writing (d =.698 – medium effect), and lowest on science vocabulary (d =.195 – no effect).
PRELIMINARY ANALYSES OF SCIENCE LEARNING 20
Regarding science concepts, the effect size was higher for multiple-choice items (d = .900 – high
effect) than for constructed-response items (d =.749 – medium effect). Effect size differences
were also found when looking at science writing’s sub-categories (from the single constructed-
response item): highest for using science vocabulary (d = .945 – high effect), second highest for
argument (d = .493 – low effect), and lowest on clarity (d = .402 – low effect). Finally, regarding
science vocabulary’s sub-categories (all multiple-choice items), effect sizes were low and
relatively similar between content and inquiry vocabulary (d = .316, d = .313, respectively). The
aggregate science vocabulary effect size (d = .195) is noteworthy in that it was the lowest of any
category or sub-category and over four times less than students’ use of vocabulary while writing
(d = .945) – the second largest effect size of any category or sub-category.
Table 6. Learning Gains for Total Sample by Achievement Category
Possible range N
Pre M (SD)
Post M (SD)
Gain M (SD)
T statistic P value
Effect size (d)
Composite 0-62 123 35.07 (11.82)
41.25 (9.49)
6.18 (7.55)
9.08 .000 .277 (small)
Concepts 0-20 128 10.54 (4.06)
13.88 (2.88)
3.34 (2.74)
13.81 .000 .949 (large)
Multiple choice
0-12 129 6.50 (2.92)
8.85 (2.26)
2.35 (1.93)
13.84 .000 .900 (large)
Constructed- response
0-8 153 3.89 (1.73)
5.02 (1.25)
1.13 (1.82)
7.67 .000 .749 (medium)
Writing 0-12 176 4.57 (2.17)
6.06 (2.10)
1.49 (2.34)
8.44 .000 .698 (medium)
Argument 0-4 174 1.26 (1.02)
1.76 (1.01)
.500 (1.15)
5.75 .000 .493 (small)
Clarity 0-4 174 1.63 (.814)
1.94 (.727)
.316 (.803)
5.19 .000 .402 (small)
Vocabulary 0-4 174 1.66 (.719)
2.43 (.901)
.770 (1.04)
9.78 .000 .945 (large)
Vocabulary 0-30 167 18.94 (6.74)
20.26 (6.78)
1.32 (5.60)
3.04 .000 .195 (none)
Content 0-15 167 9.40 (3.38)
10.46 (3.39)
1.07 (2.84)
4.88 .003 .316 (small)
Inquiry 0-15 167 9.55 (3.77)
10.71 (3.65)
1.16 (2.88)
5.18 .000 .313 (small)
PRELIMINARY ANALYSES OF SCIENCE LEARNING 21
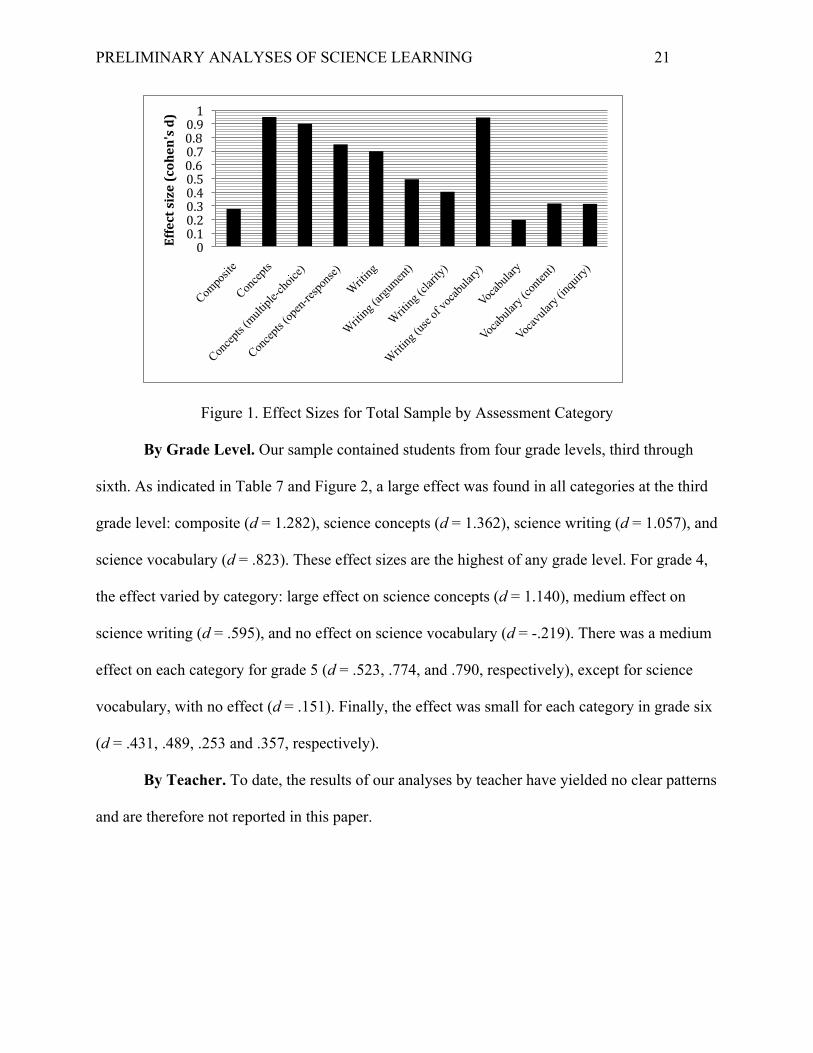
Figure 1. Effect Sizes for Total Sample by Assessment Category
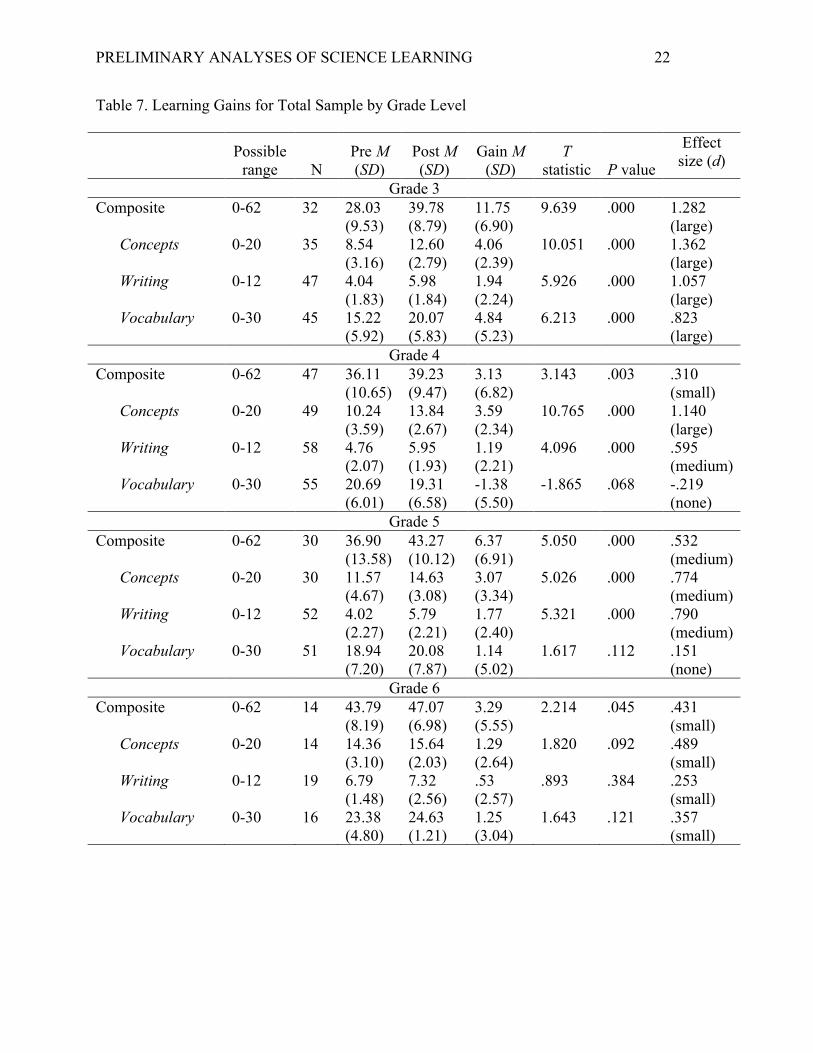
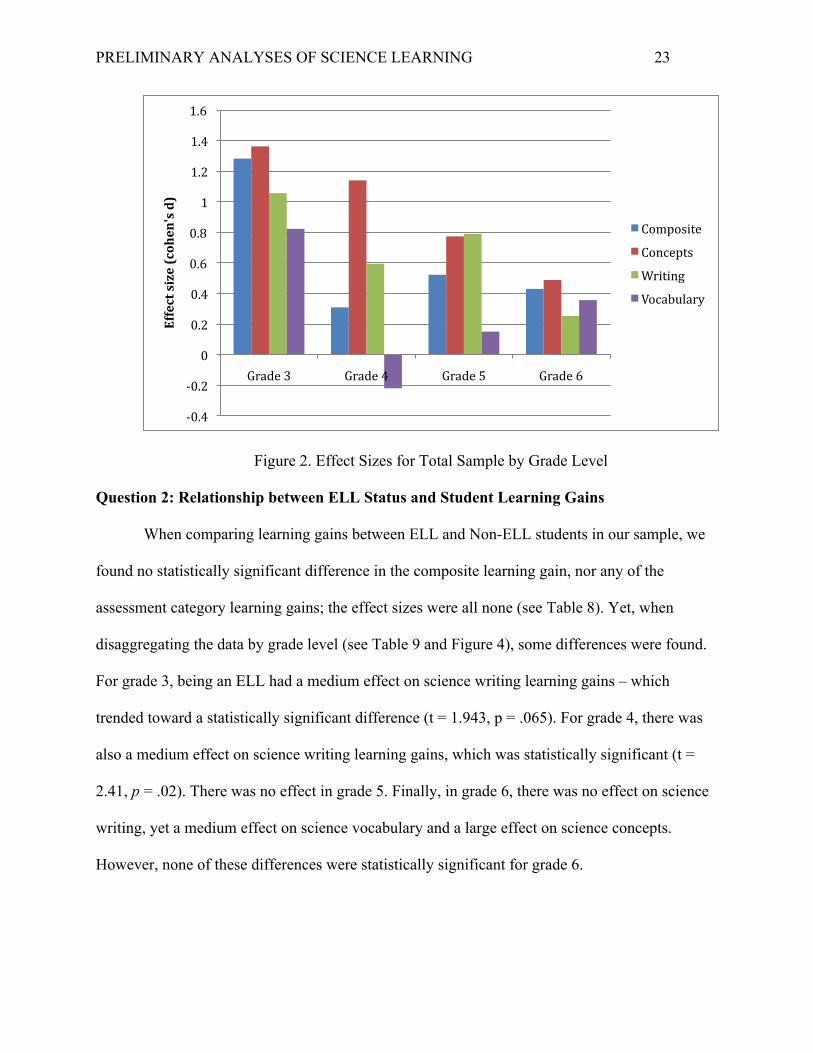
By Grade Level. Our sample contained students from four grade levels, third through
sixth. As indicated in Table 7 and Figure 2, a large effect was found in all categories at the third
grade level: composite (d = 1.282), science concepts (d = 1.362), science writing (d = 1.057), and
science vocabulary (d = .823). These effect sizes are the highest of any grade level. For grade 4,
the effect varied by category: large effect on science concepts (d = 1.140), medium effect on
science writing (d = .595), and no effect on science vocabulary (d = -.219). There was a medium
effect on each category for grade 5 (d = .523, .774, and .790, respectively), except for science
vocabulary, with no effect (d = .151). Finally, the effect was small for each category in grade six
(d = .431, .489, .253 and .357, respectively).
By Teacher. To date, the results of our analyses by teacher have yielded no clear patterns
and are therefore not reported in this paper.
00.10.20.30.40.50.60.70.80.91
Effectsize(cohen'sd)
PRELIMINARY ANALYSES OF SCIENCE LEARNING 22
Table 7. Learning Gains for Total Sample by Grade Level
Possible range N
Pre M (SD)
Post M (SD)
Gain M (SD)
T statistic P value
Effect size (d)
Grade 3 Composite 0-62 32 28.03
(9.53) 39.78 (8.79)
11.75 (6.90)
9.639 .000 1.282 (large)
Concepts 0-20 35 8.54 (3.16)
12.60 (2.79)
4.06 (2.39)
10.051 .000 1.362 (large)
Writing 0-12 47 4.04 (1.83)
5.98 (1.84)
1.94 (2.24)
5.926 .000 1.057 (large)
Vocabulary 0-30 45 15.22 (5.92)
20.07 (5.83)
4.84 (5.23)
6.213 .000 .823 (large)
Grade 4 Composite 0-62 47 36.11
(10.65) 39.23 (9.47)
3.13 (6.82)
3.143 .003 .310 (small)
Concepts 0-20 49 10.24 (3.59)
13.84 (2.67)
3.59 (2.34)
10.765 .000 1.140 (large)
Writing 0-12 58 4.76 (2.07)
5.95 (1.93)
1.19 (2.21)
4.096 .000 .595 (medium)
Vocabulary 0-30 55 20.69 (6.01)
19.31 (6.58)
-1.38 (5.50)
-1.865 .068 -.219 (none)
Grade 5 Composite 0-62 30 36.90
(13.58) 43.27 (10.12)
6.37 (6.91)
5.050 .000 .532 (medium)
Concepts 0-20 30 11.57 (4.67)
14.63 (3.08)
3.07 (3.34)
5.026 .000 .774 (medium)
Writing 0-12 52 4.02 (2.27)
5.79 (2.21)
1.77 (2.40)
5.321 .000 .790 (medium)
Vocabulary 0-30 51 18.94 (7.20)
20.08 (7.87)
1.14 (5.02)
1.617 .112 .151 (none)
Grade 6 Composite 0-62 14 43.79
(8.19) 47.07 (6.98)
3.29 (5.55)
2.214 .045 .431 (small)
Concepts 0-20 14 14.36 (3.10)
15.64 (2.03)
1.29 (2.64)
1.820 .092 .489 (small)
Writing 0-12 19 6.79 (1.48)
7.32 (2.56)
.53 (2.57)
.893 .384 .253 (small)
Vocabulary 0-30 16 23.38 (4.80)
24.63 (1.21)
1.25 (3.04)
1.643 .121 .357 (small)
PRELIMINARY ANALYSES OF SCIENCE LEARNING 23
Figure 2. Effect Sizes for Total Sample by Grade Level
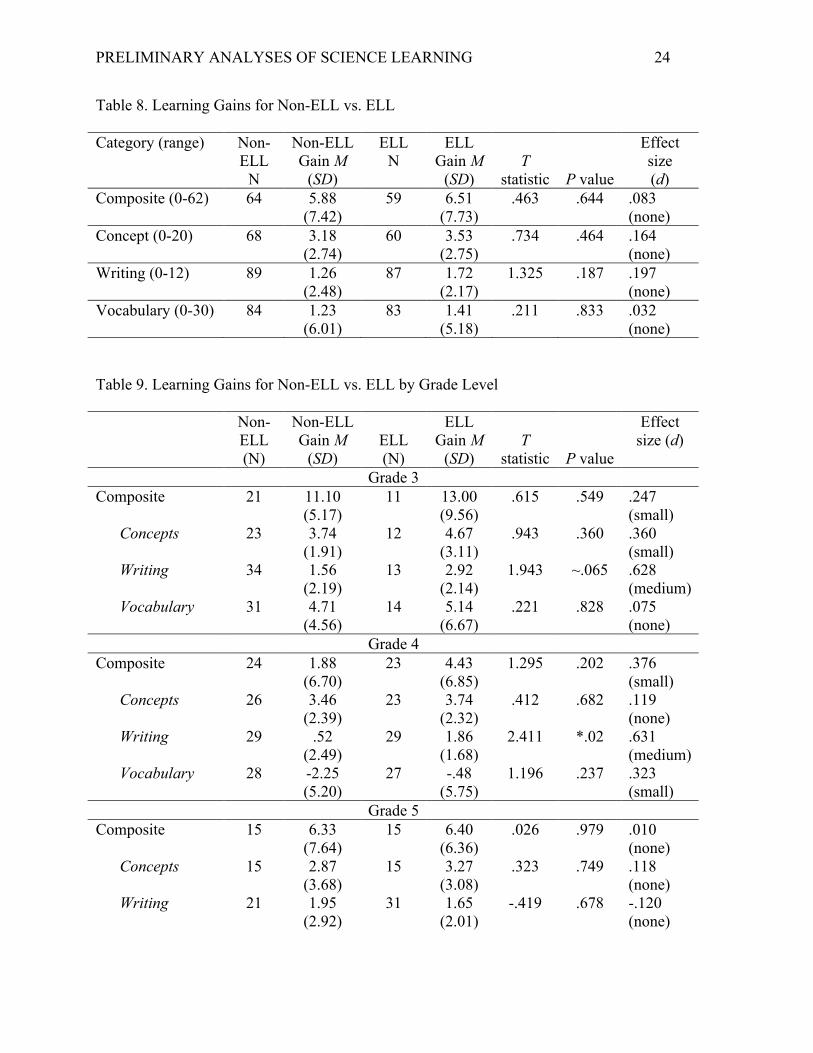
Question 2: Relationship between ELL Status and Student Learning Gains
When comparing learning gains between ELL and Non-ELL students in our sample, we
found no statistically significant difference in the composite learning gain, nor any of the
assessment category learning gains; the effect sizes were all none (see Table 8). Yet, when
disaggregating the data by grade level (see Table 9 and Figure 4), some differences were found.
For grade 3, being an ELL had a medium effect on science writing learning gains – which
trended toward a statistically significant difference (t = 1.943, p = .065). For grade 4, there was
also a medium effect on science writing learning gains, which was statistically significant (t =
2.41, p = .02). There was no effect in grade 5. Finally, in grade 6, there was no effect on science
writing, yet a medium effect on science vocabulary and a large effect on science concepts.
However, none of these differences were statistically significant for grade 6.
‐0.4
‐0.2
0
0.2
0.4
0.6
0.8
1
1.2
1.4
1.6
Grade3 Grade4 Grade5 Grade6
Effectsize(cohen'sd)
Composite
Concepts
Writing
Vocabulary
PRELIMINARY ANALYSES OF SCIENCE LEARNING 24
Table 8. Learning Gains for Non-ELL vs. ELL
Category (range) Non-ELL
N
Non-ELL Gain M
(SD)
ELL N
ELL Gain M
(SD) T
statistic P value
Effect size (d)
Composite (0-62) 64 5.88 (7.42)
59 6.51 (7.73)
.463 .644 .083 (none)
Concept (0-20) 68 3.18 (2.74)
60 3.53 (2.75)
.734 .464 .164 (none)
Writing (0-12) 89 1.26 (2.48)
87 1.72 (2.17)
1.325 .187 .197 (none)
Vocabulary (0-30) 84 1.23 (6.01)
83 1.41 (5.18)
.211 .833 .032 (none)
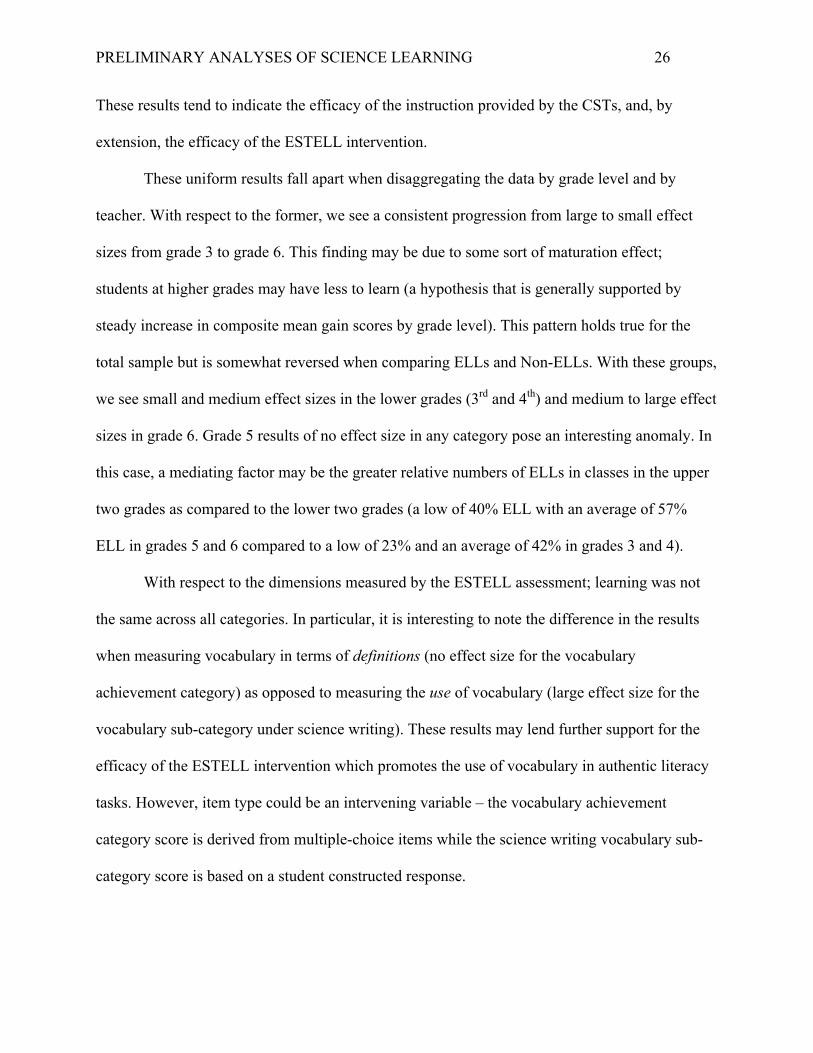
Table 9. Learning Gains for Non-ELL vs. ELL by Grade Level
Non-ELL (N)
Non-ELL Gain M
(SD) ELL (N)
ELL Gain M
(SD) T
statistic P value
Effect size (d)
Grade 3 Composite 21 11.10
(5.17) 11 13.00
(9.56) .615 .549 .247
(small) Concepts 23 3.74
(1.91) 12 4.67
(3.11) .943 .360 .360
(small) Writing 34 1.56
(2.19) 13 2.92
(2.14) 1.943 ~.065 .628
(medium) Vocabulary 31 4.71
(4.56) 14 5.14
(6.67) .221 .828 .075
(none) Grade 4
Composite 24 1.88 (6.70)
23 4.43 (6.85)
1.295 .202 .376 (small)
Concepts 26 3.46 (2.39)
23 3.74 (2.32)
.412 .682 .119 (none)
Writing 29 .52 (2.49)
29 1.86 (1.68)
2.411 *.02 .631 (medium)
Vocabulary 28 -2.25 (5.20)
27 -.48 (5.75)
1.196 .237 .323 (small)
Grade 5 Composite 15 6.33
(7.64) 15 6.40
(6.36) .026 .979 .010
(none) Concepts 15 2.87
(3.68) 15 3.27
(3.08) .323 .749 .118
(none) Writing 21 1.95
(2.92) 31 1.65
(2.01) -.419 .678 -.120
(none)
PRELIMINARY ANALYSES OF SCIENCE LEARNING 25
Vocabulary 21 .90 (6.75)
30 1.30 (3.48)
.247 .807 .074 (none)
Grade 6 Composite 4 .75
(4.30) 10 4.30
(6.18) 1.507 .158 .667
(medium) Concepts 5 -.75
(2.10) 10 2.10
(2.33) 1.964 .104 1.28
(large) Writing 5 .60
(1.52) 14 .50
(2.90) -.097 .924 -.043
(none) Vocabulary 4 .25
(1.58) 12 1.58
(3.32) .948 .369 .512
(medium)
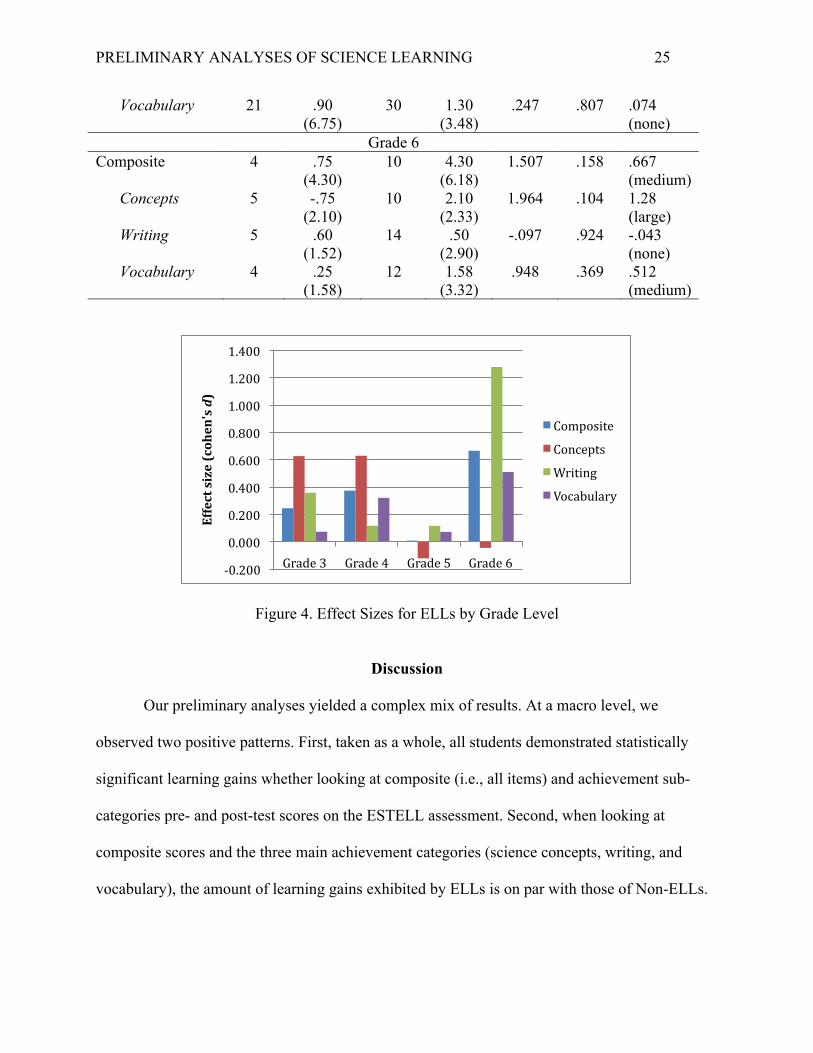
Figure 4. Effect Sizes for ELLs by Grade Level
Discussion
Our preliminary analyses yielded a complex mix of results. At a macro level, we
observed two positive patterns. First, taken as a whole, all students demonstrated statistically
significant learning gains whether looking at composite (i.e., all items) and achievement sub-
categories pre- and post-test scores on the ESTELL assessment. Second, when looking at
composite scores and the three main achievement categories (science concepts, writing, and
vocabulary), the amount of learning gains exhibited by ELLs is on par with those of Non-ELLs.
‐0.200
0.000
0.200
0.400
0.600
0.800
1.000
1.200
1.400
Grade3 Grade4 Grade5 Grade6
Effectsize(cohen'sd)
Composite
Concepts
Writing
Vocabulary
PRELIMINARY ANALYSES OF SCIENCE LEARNING 26
These results tend to indicate the efficacy of the instruction provided by the CSTs, and, by
extension, the efficacy of the ESTELL intervention.
These uniform results fall apart when disaggregating the data by grade level and by
teacher. With respect to the former, we see a consistent progression from large to small effect
sizes from grade 3 to grade 6. This finding may be due to some sort of maturation effect;
students at higher grades may have less to learn (a hypothesis that is generally supported by
steady increase in composite mean gain scores by grade level). This pattern holds true for the
total sample but is somewhat reversed when comparing ELLs and Non-ELLs. With these groups,
we see small and medium effect sizes in the lower grades (3rd and 4th) and medium to large effect
sizes in grade 6. Grade 5 results of no effect size in any category pose an interesting anomaly. In
this case, a mediating factor may be the greater relative numbers of ELLs in classes in the upper
two grades as compared to the lower two grades (a low of 40% ELL with an average of 57%
ELL in grades 5 and 6 compared to a low of 23% and an average of 42% in grades 3 and 4).
With respect to the dimensions measured by the ESTELL assessment; learning was not
the same across all categories. In particular, it is interesting to note the difference in the results
when measuring vocabulary in terms of definitions (no effect size for the vocabulary
achievement category) as opposed to measuring the use of vocabulary (large effect size for the
vocabulary sub-category under science writing). These results may lend further support for the
efficacy of the ESTELL intervention which promotes the use of vocabulary in authentic literacy
tasks. However, item type could be an intervening variable – the vocabulary achievement
category score is derived from multiple-choice items while the science writing vocabulary sub-
category score is based on a student constructed response.
PRELIMINARY ANALYSES OF SCIENCE LEARNING 27
Limitations and Next Steps
The results discussed above are limited by several factors. Some have to do with the data
set itself: there is a small number of teachers overall (nine), a single teacher at the 6th grade level,
and small numbers of ELLs in each of the five levels of English proficiency. We are currently
expanding the teacher sample with the intent to address these issues.
Other limitations have to do with the state of our analyses to date. Gain scores, for
example, may not be the best measure for comparison. The significance observed from the t-tests
may not hold up with more sophisticated analyses that control for different variables. We will
use tests such as analysis of covariance (ANCOVA) and ordinary least squares (OLS) linear
regression to further tease out the nuances in the observed patterns. In such analyses, predictors,
such as ELL status and English language proficiency, can be added to exploring models for
predicting post-test scores.
In addition, we will explore relationships between fidelity of implementation of ESTELL
instructional practices and student achievement. Participating teachers were observed four times
while teaching the common science unit with corresponding ratings on each of the ESTELL
instructional practices. We also gathered extensive qualitative data (e.g., observation field notes,
audio-recordings of selected lessons, teacher interviews, student work samples) that provide a
richer context for examining and explaining the results.
Contribution to Science Teacher Education
The ESTELL project is unique in that it focuses on an intervention for pre-service
teachers. Most intervention studies focus on practicing or in-service classroom teachers (see for
example, Lara-Alecio et al., 2012). Our methodology of following pre-service teachers in to the
PRELIMINARY ANALYSES OF SCIENCE LEARNING 28
classroom as in-service teachers to gather student learning data holds high potential for
informing similar studies in the future.
Perhaps more important are the potential improvements in teacher practice and student
learning. The ESTELL project offers a promising model that may have broad application.
Demonstrated positive impact on student learning, such as we have begin to document here, is a
significant source of evidence to support further dissemination of the model, thus broadening the
positive impacts on the science and literacy learning of ELLs.
Footnotes
1 Effect size calculated with the following website: http://www.uccs.edu/~lbecker/
PRELIMINARY ANALYSES OF SCIENCE LEARNING 29
References
American Educational Research Association. (1999). American Psychological
Association & National Council on Measurement in Education (1999).Standards for
educational and psychological testing, 3.
Abell, S.K., & Cennamo, K.S. (2004). Videocases in elementary science teacher
preparation. In J. Brophy (Ed.), Advances in research on teaching: Using video in teacher
education (Vol. 10, pp. 103–130). New York, NY: Elsevier JAI.
Aikenhead, G. (2006). Science Education for Everyday Life: Evidence-Based Practice.
New York: Teachers College Press.
Ballantyne, K.G., Sanderman, A. R., & Levy, J. (2008). Educating English Language
Learners: Building Teacher Capacity Roundtable Report. National Clearinghouse for
English Language Acquisition & Language Instruction Educational Program. George
Washington University, Graduate School of Education and Human Development.
Baquedano-Lopez, P., Solis, J. L., & Kattan, S. (2005). Adaptation: The language of
classroom learning. Linguistics and Education, 6, 1-26.
Bravo, M., & Garcia, E. (2004). Learning to write like scientists: English language
learners science inquiry and writing understanding in responsive learning contexts.
National Clearinghouse for English language acquisition.
Bravo, M., & Solis, J. (2009). Stoddart, T., Tolbert, S., & McKinney de Royston, M., non-
presenting authors. Dialogic activity in science instruction (DAISI): Integrating CREDE
pedagogy into observations of preservice science teaching. The American Educational
Research Association Annual Meeting in San Diego CA, April 12-18, 2009.
Business-Higher Education Forum (BHEF) Issue Brief (2006). Collaborating to address the math
PRELIMINARY ANALYSES OF SCIENCE LEARNING 30
and science shortage: A state university – business partnership. Retrieved February
13,2009, from http://www.bhef.com/publications/Winter06IssueBrief3.pdf
Buxton, C. A. (2006). Creating contextually authentic science in "low-performing" urban
elementary schools. Journal of Research in Science Teaching, 43(7), 695-721.
Calabrese Barton, A. (2003). Teaching Science for Social Justice. New York: Teachers College
Press. California Legislative Analysts Office (LAO) 2007 -08 Budget Book - Education
Analyses, February 21, 2007. California Legislative Analyst’s Office report, 2007-08.
Callahan, R. M. (2005). Tracking and high school English learners: Limiting opportunity to
learn. American Educational Research Journal, 42(2), 305.
California Legislative Analysts Office (LAO) 2007 -08 Budget Book - Education
Analyses, February 21, 2007.
Cervetti, G.N., Pearson, P. D., Barber, J., Hiebert, E., & Bravo, M. A. (2007). Integrating
literacy and science: The research we have, the research we need. In M. Pressley, A. K.
Billman, K. Perry, K. Refitt, & J. Reynolds (Eds.), Shaping literacy achievement. New
York: Guilford.
Cervetti, G. N., Bravo, M. A., Duong, T., Hernandez, S., & Tilson, J. (2008). A research-
based approach to instruction for English language learners in science. Report prepared
for the Noyce Foundation. Available at http://www. scienceandliteracy.
org/research/researchandresources.
Cheuk, T. (2012). Relationships and Convergences Found in the Common Core State
Standards in Mathematics (practices), Common Core State Standards in ELA/Literacy
(student portraits), and A Framework for K-12 Science Education (science & engineering
practices). Unpublished work. Stanford University, Understanding Language Inititative.

PRELIMINARY ANALYSES OF SCIENCE LEARNING 31
Commission on Professionals in Science and Technology, STEM Workforce Data Project
(2007). Four decades of STEM degrees, 1966-2004: The devil is in the details. CPST
Report no. 6. www.cpst.org
Cuevas, P., Lee, O., Hart, J., & Deaktor, R. (2005). Improving science inquiry with elementary
students of diverse backgrounds. Journal of Research in Science Teaching, 42(3), 337-357.
Doherty, R. W., & Pinal, A. (2004). Joint productive activity and cognitive reading strategy
use. TESOL Quarterly, 38(3), 219-27.
Driver, R., Newton, P., & Osborne, J. (2000). Establishing the norms of scientific argumentation
in classrooms. Science education, 84(3), 287-312.
Engle, R. A., & Conant, F. R. (2002). Guiding principles for fostering productive disciplinary
engagement: Explaining an emergent argument in a community of learners
classroom. Cognition and Instruction, 20(4), 399-483.
Fillmore, L. W., & Snow, C. E. (2000). What teachers need to know about language. US
Department of Education, Office of Educational Research and Improvement, Educational
Resources Information Center.
Gandara, P., Maxwell-Jolly, J., & Driscoll, A. (2005). Listening to teachers of English language
learners: A survey of California teachers’ challenges, experiences, and professional
development needs.
Goldman, R., & Pea, R. B. B. & Derry, SJ (Eds.)(2007). Video research in the learning sciences.
Mahwah, NJ: Erlbaum..
Gonzalez, N., Moll, L., & Amanti, C. (2005). Funds of knowledge. Mahwah, NJ.
Grigg, W. S., Daane, M. C., Jin, Y., & Campbell, J. R. (2002). The nation’s report card. Reading,
2003-521.
PRELIMINARY ANALYSES OF SCIENCE LEARNING 32
Hilberg, R. S., Tharp, R. G., & DeGeest, L. (2000). The Efficacy of CREDE's Standards‐based
Instruction in American Indian Mathematics Classes. Equity & Excellance in
Education, 33(2), 32-40.
Hanauer, D. I. (2006). Scientific discourse: Multiliteracy in the classroom. London, UK:
Continuum Press.
Hogan, K. E., & Pressley, M. E. (1997). Scaffolding student learning: Instructional approaches
and issues. Brookline Books.
Hosoume, K., & and Barber, J. (1999). Terrarium Habitats. Berkeley: Lawrence Hall of
Science, University of California.
Joyce, B. Showers. B (1995). Student Achievement through Staff Development. Fundamentals
of School Renewal.
Kopriva, R., & Sexton, U. M. (1999). Guide to scoring LEP student responses to open-ended
science items. Washington, DC: Council of Chief State School Officers.
Kopriva, R. J. (2008). Improving testing for English language learners. New York: Routledge.
LaCelle-Peterson, M. W., & Rivera, C. (1994). Is it real for all kids? A framework for equitable
assessment policies for English language learners. Harvard Educational Review, 64(1),
55-76.
Lara‐Alecio, R., Tong, F., Irby, B. J., Guerrero, C., Huerta, M., & Fan, Y. (2012). The effect of
an instructional intervention on middle school english learners' science and english
reading achievement. Journal of Research in Science Teaching.
Lawrence Hall of Science. (2007). Soil habitats assessment system. Berkeley: Lawrence
Hall of Science, University of California.
Lee, O. (2005). Science education with English language learners: Synthesis and research
PRELIMINARY ANALYSES OF SCIENCE LEARNING 33
agenda. Review of Educational Research, 75(4), 491-530.
Lee, O., & Luykx, A. (2006). Science education and student diversity: Synthesis and research
agenda. Cambridge University Press.
Lee, O., Maerten‐Rivera, J., Penfield, R. D., LeRoy, K., & Secada, W. G. (2008). Science
achievement of English language learners in urban elementary schools: Results of a
first‐year professional development intervention. Journal of Research in Science
Teaching, 45(1), 31-52.
Lee, O., Santau, A. O., & Maerten-Rivera, J. (2011). Science and literacy assessments with
English language learners. In C. Basterra, E. Trumbull, & G. Solano-Flores (Eds.),
Cultural validity in assessment: Addressing linguistic and cultural diversity (pp. 254-
274). New York: Routledge.
Loucks-Horsley, S., Hewson, P., Love, N., & Stiles, K. (1998). Designing professional
development for teachers of mathematics and science.
Lynch, S. (2001). “Science for all” is not equal to “one size fits all”: Linguistic and cultural
diversity and science education reform. Journal of Research in Science Teaching, 38(5),
622-627.
Martiniello, M. (2008). Language and the performance of English-language learners in math
word problems. Harvard Educational Review, 78(2), 333-368.
National Academy of the Sciences [NAS], (2010). Expanding underrepresented minority
participation: America’s science and technology talent at the crossroads. (A research
report co-sponsored by the Committee on Underrepresented Groups and the Expansion of
Science and Engineering Workforce Pipeline; Committee on Science, Engineering, and
Public Policy; Policy and Global Affairs; National Academy of Sciences, National
PRELIMINARY ANALYSES OF SCIENCE LEARNING 34
Academy of Engineering, Institute of Medicine). Washington, D.C.: National Academies
Press. Available from http://www.nap.edu/catalog/12984.html
National Center for Education Statistics (2001). The condition of education in 2001. U.S.
Department of Education. Office of Educational Research and Improvement, NCES
2001–072.
National Center for Education Statistics (2011). (NCES) The Nation’s Report Card:
Science2009. Institute of Education Sciences.
National Research Council (2012). A Framework for K-12 Science Education: Practices,
Crosscutting Concepts, and Core Ideas. National Academies Press: Washington, D.C.
Nystrand, M., Gamoran, A., Kachur, R., & Prendergast, C. (1997). Opening dialogue. New
York: Teachers College Press.
Oakes, J., Joseph, R., & Muir, K. (2004). Access and achievement in mathematics and science:
Inequalities that endure and change. In Banks, J. & Banks, C. (Eds), Handbook of
Research on Multicultural Education, 2nd Ed., (pp. 69-90). San Francisco, CA: Jossey
Bass)
Ovando, C. J., & Combs, M. C. (2012). Bilingual and ESL classrooms. 5th Edition. Boston, MA:
McGraw-Hill.
Quinn, H., Lee, O., & Valdés, G., 2012. Demands and Opportunities in Relation to Next
Generation Science Standards for English Language Learners: What Teachers Need to
Know. Unpublished document. Stanford University, Understanding Language Inititative.
Rosebery, A.S., & Warren, B. (2008). Teaching science to English language learners.
Alexandria, VA: National Science Teachers Association.
Rodriguez, A. J. (1998). The dangerous discourse of invisibility: A critique of the National
PRELIMINARY ANALYSES OF SCIENCE LEARNING 35
Research Council's National Science Education Standards.Journal of Research in Science
Teaching, 34(1), 19-37.
Rivet, A. E., & Krajcik, J. S. (2008). Contextualizing instruction: Leveraging students' prior
knowledge and experiences to foster understanding of middle school science. Journal of
Research in Science Teaching, 45(1), 79-100.
Roth, K. J., Garnier, H. E., Chen, C., Lemmens, M., Schwille, K., & Wickler, N. I.
(2011). Videobased lesson analysis: Effective science PD for teacher and student
learning. Journal of Research in Science Teaching, 48(2), 117-148.
Saunders, W., O’Brien, G., Lennon, D., & McLean, J. (1998). Making the transition to English
literacy successful: Effective strategies for studying literature with transition
students. Effective strategies for teaching language minority students, 99-132.
Saunders, W. M., & Goldenberg, C. (1999). Effects of instructional conversations and literature
logs on limited-and fluent-English-proficient students' story comprehension and thematic
understanding. The Elementary School Journal, 277-301.
Seeds of Science/Roots of Reading Soil Habitats Summative Assessment Package
(Regents of the University of California, (2009) . Soil Habitats, Seeds of Science/Roots of
Reading Assessment System. University of California, Berkeley.
Shaftel, J., Belton-Kocher, E., Glasnapp, D., & Poggio, J. (2006). The impact of language
characteristics in mathematics test items on the performance of English language learners
and students with disabilities. Educational Assessment, 11(2), 105-126.
Shaw, J., Bunch, G., & Geaney, E. (2010). Analyzing language demands facing English learners
PRELIMINARY ANALYSES OF SCIENCE LEARNING 36
on science performance assessments: The SALD framework. Journal of Research in
Science Teaching. Retrieved from
http://onlinelibrary.wiley.com.oca.ucsc.edu/doi/10.1002/tea.20364/full
Short, D, J., Vogt, M., & Echevarría, J. (2011). The SIOP Model for teaching science to English
learners. Boston, MA: Pearson.
Siegel, M. A. (2007). Striving for equitable classroom assessments for linguistic minorities:
Strategies for and effects of revising life science items.Journal of Research in Science
Teaching, 44(6), 864-881.
Solano‐Flores, G., & Nelson‐Barber, S. (2001). On the cultural validity of science
assessments. Journal of Research in Science Teaching, 38(5), 553-573.
Speck, M., & Knipe, C. (2001). Why Can't We Get It Right? Professional Development in Our
Schools. Corwin Press, Inc., A Sage Publications Company, 2455 Teller Road, Thousand
Oaks, CA 91320-2218.
Spycher, P. (2009). Learning academic language through science in two linguistically diverse
kindergarten classes. The Elementary School Journal,109(4), 359-379.
Stoddart, T., Abrams, R., Gasper, E., & Canaday, D. (2000). Concept maps as assessment in
science inquiry learning-a report of methodology. International Journal of Science
Education, 22(12), 1221-1246.
Stoddart, T., Pinal, A., Latzke, M., & Canaday, D. (2002). Integrating inquiry science and
language development for English language learners. Journal of Research in Science
Teaching, 39(8), 664-687.
Stoddart, T., Bravo, M., Solís, J.L., Stevens, M., & R. Vega de Jesús (2009). Preparing Pre-
Service Teachers to Integrate Inquiry Science with Language and Literacy Instruction for
PRELIMINARY ANALYSES OF SCIENCE LEARNING 37
English Language Learners: An Experimental Study. Conference Proceedings: Improving
Recruitment, Development, & Retention through Effective Pedagogy. University of
California, Berkeley: Center for Research on Education, Diversity, & Excellence.
Stoddart, T., Solis, J., Tolbert, S., & Bravo, M. (2010). A framework for the effective science
teaching of English Language Learners in elementary schools. In Sunal, D., Sunal, C., &
Wright, E., (Eds), Teaching Science with Hispanic ELLs in K-16 Classrooms.
Information Age Publishing: Charlotte, NC.
Stoddart, T., Bravo, M., Mosqueda & Solis, J. (in press). Preparing Pre-service Elementary
Teachers to Teach Science to English Language Learners. Research in Higher Education.
Tharp, R. G., & Gallimore, R. (1988). Rousing minds to life: Teaching, learning, and schooling
in social context. New York: Cambridge University Press.
Tharp, R. G. (2005). Research in diversity and education: Process and structure in synthesizing
knowledge. Journal of Education for Students Placed at Risk, 10(4), 355-361.
Tharp, R. G., & Dalton, S. S. (2007). Orthodoxy, cultural compatibility, and universals in
education. Comparative Education, 43(1), 53-70.
U.S. Census Bureau (2010). American Community Survey [2005-2009]. Available online at
www.census.gov/acs/www.
U.S. Census Bureau (2011). U.S. Census 2010 Redistricting Data Summary File, Available
online http://census.gov
Villegas, A. M., & Lucas, T. (2002). Preparing culturally responsive teachers rethinking the
curriculum. Journal of Teacher Education, 53(1), 20-32.
Walqui, A., & Van Lier, L. (2010). Scaffolding the academic success of adolescent English
language learners. San Francisco, CA: WestEd.
PRELIMINARY ANALYSES OF SCIENCE LEARNING Page 38
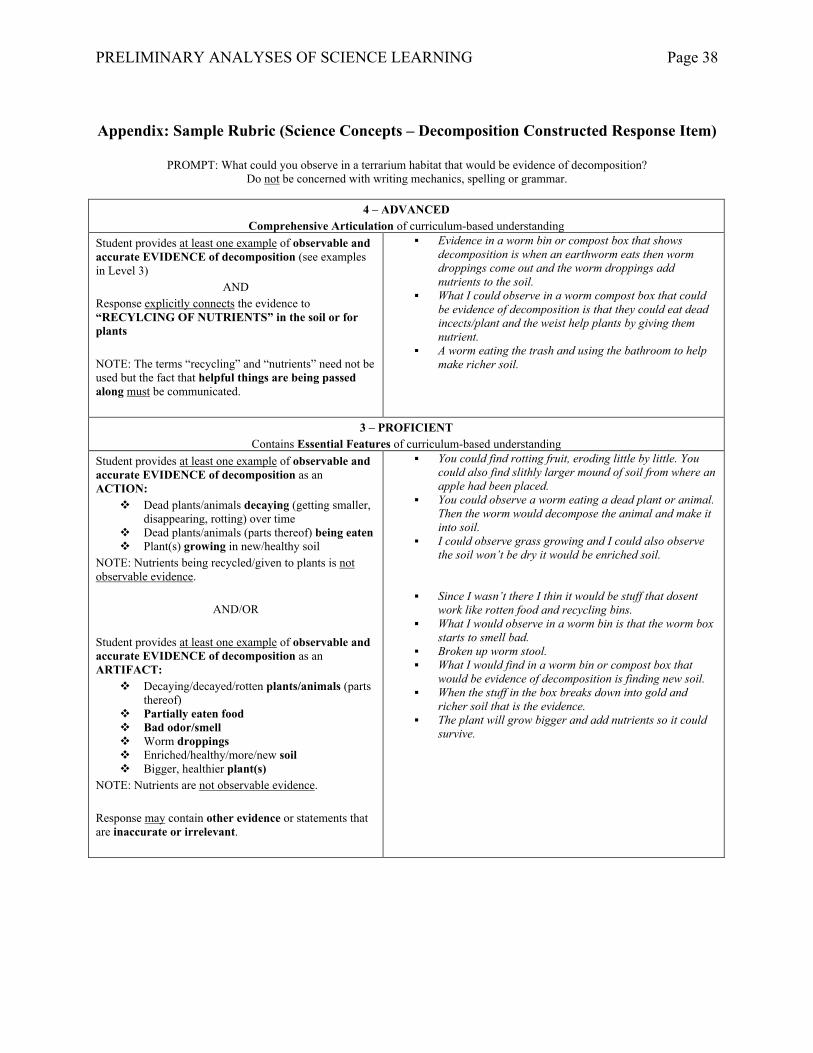
Appendix: Sample Rubric (Science Concepts – Decomposition Constructed Response Item)
PROMPT: What could you observe in a terrarium habitat that would be evidence of decomposition? Do not be concerned with writing mechanics, spelling or grammar.
4 – ADVANCED
Comprehensive Articulation of curriculum-based understanding Student provides at least one example of observable and accurate EVIDENCE of decomposition (see examples in Level 3)
AND Response explicitly connects the evidence to “RECYLCING OF NUTRIENTS” in the soil or for plants NOTE: The terms “recycling” and “nutrients” need not be used but the fact that helpful things are being passed along must be communicated.
Evidence in a worm bin or compost box that shows decomposition is when an earthworm eats then worm droppings come out and the worm droppings add nutrients to the soil.
What I could observe in a worm compost box that could be evidence of decomposition is that they could eat dead incects/plant and the weist help plants by giving them nutrient.
A worm eating the trash and using the bathroom to help make richer soil.
3 – PROFICIENT Contains Essential Features of curriculum-based understanding
Student provides at least one example of observable and accurate EVIDENCE of decomposition as an ACTION:
Dead plants/animals decaying (getting smaller, disappearing, rotting) over time
Dead plants/animals (parts thereof) being eaten Plant(s) growing in new/healthy soil
NOTE: Nutrients being recycled/given to plants is not observable evidence.
AND/OR
Student provides at least one example of observable and accurate EVIDENCE of decomposition as an ARTIFACT:
Decaying/decayed/rotten plants/animals (parts thereof)
Partially eaten food Bad odor/smell Worm droppings Enriched/healthy/more/new soil Bigger, healthier plant(s)
NOTE: Nutrients are not observable evidence. Response may contain other evidence or statements that are inaccurate or irrelevant.
You could find rotting fruit, eroding little by little. You could also find slithly larger mound of soil from where an apple had been placed.
You could observe a worm eating a dead plant or animal. Then the worm would decompose the animal and make it into soil.
I could observe grass growing and I could also observe the soil won’t be dry it would be enriched soil.
Since I wasn’t there I thin it would be stuff that dosent work like rotten food and recycling bins.
What I would observe in a worm bin is that the worm box starts to smell bad.
Broken up worm stool. What I would find in a worm bin or compost box that
would be evidence of decomposition is finding new soil. When the stuff in the box breaks down into gold and
richer soil that is the evidence. The plant will grow bigger and add nutrients so it could
survive.
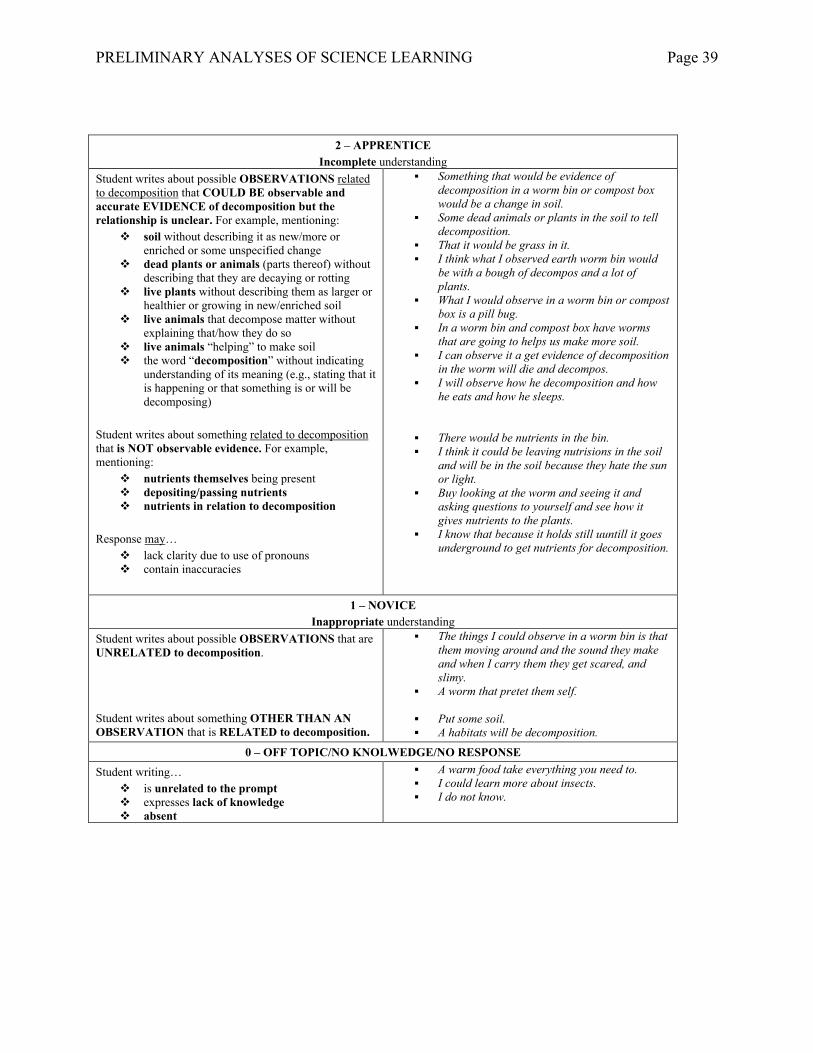
PRELIMINARY ANALYSES OF SCIENCE LEARNING Page 39
2 – APPRENTICE
Incomplete understanding Student writes about possible OBSERVATIONS related to decomposition that COULD BE observable and accurate EVIDENCE of decomposition but the relationship is unclear. For example, mentioning:
soil without describing it as new/more or enriched or some unspecified change
dead plants or animals (parts thereof) without describing that they are decaying or rotting
live plants without describing them as larger or healthier or growing in new/enriched soil
live animals that decompose matter without explaining that/how they do so
live animals “helping” to make soil the word “decomposition” without indicating
understanding of its meaning (e.g., stating that it is happening or that something is or will be decomposing)
Student writes about something related to decomposition that is NOT observable evidence. For example, mentioning:
nutrients themselves being present depositing/passing nutrients nutrients in relation to decomposition
Response may…
lack clarity due to use of pronouns contain inaccuracies
Something that would be evidence of decomposition in a worm bin or compost box would be a change in soil.
Some dead animals or plants in the soil to tell decomposition.
That it would be grass in it. I think what I observed earth worm bin would
be with a bough of decompos and a lot of plants.
What I would observe in a worm bin or compost box is a pill bug.
In a worm bin and compost box have worms that are going to helps us make more soil.
I can observe it a get evidence of decomposition in the worm will die and decompos.
I will observe how he decomposition and how he eats and how he sleeps.
There would be nutrients in the bin. I think it could be leaving nutrisions in the soil
and will be in the soil because they hate the sun or light.
Buy looking at the worm and seeing it and asking questions to yourself and see how it gives nutrients to the plants.
I know that because it holds still uuntill it goes underground to get nutrients for decomposition.
1 – NOVICE Inappropriate understanding
Student writes about possible OBSERVATIONS that are UNRELATED to decomposition. Student writes about something OTHER THAN AN OBSERVATION that is RELATED to decomposition.
The things I could observe in a worm bin is that them moving around and the sound they make and when I carry them they get scared, and slimy.
A worm that pretet them self.
Put some soil. A habitats will be decomposition.
0 – OFF TOPIC/NO KNOLWEDGE/NO RESPONSE Student writing…
is unrelated to the prompt expresses lack of knowledge absent
A warm food take everything you need to. I could learn more about insects. I do not know.