preparative purification of antibiotics for comparing hydrostatic and hydrodynamic mode...
TRANSCRIPT

Journal of Chromatography A, 831 (1999) 203–216
Preparative purification of antibiotics for comparing hydrostatic andhydrodynamic mode counter-current chromatography and
preparative high-performance liquid chromatographya , b*M.-C. Menet , D. Thiebaut
aLaboratoire de Chimie Analytique UFR des Sciences Pharmaceutiques et Biologiques, Av. de l’Observatoire, 75006 Paris, FrancebLaboratoire de Chimie Analytique et des Processus Industriels, ESPCI, 10 rue Vauquelin, 75005 Paris, France
Received 6 April 1998; received in revised form 2 October 1998; accepted 2 October 1998
Abstract
Two modes allow the retention of the stationary phase in counter-current chromatography (CCC): one is called‘‘hydrodynamic’’ and the other ‘‘hydrostatic’’. The analytical comparison between the two modes of CCC shows that it isnecessary to carefully choose the mobile phase and the composition of the solvent system depending on the mode ofretention of the stationary phase. On a semi-preparative scale, the two modes are similar towards obtained purities and yields(hourly and volumetric). CCC consequently consumes three times less solvents than semi-preparative HPLC and enables therecovery of milligram amounts of pure compounds with purities higher than 95%. No preliminary extraction is required asopposed to semi-preparative HPLC. 1999 Elsevier Science B.V. All rights reserved.
Keywords: Counter-current chromatography; Preparative chromatography; Antibiotics
1. Introduction contrary, in the hydrostatic mode, the centrifugalforce field is constant [2].
Counter-current chromatography (CCC) is a chro- This technique has been revealed as a verymatographic separation method based on the parti- interesting preparative chromatographic method [3].tion of solutes between two immiscible liquid Indeed, the volume of the stationary phase retainedphases. One of the two phases is retained in the in the column is at least 50% of its total volume,column by a centrifugal force field and is called the while reversed-phase high-performance liquid chro-stationary phase. The second phase, which is called matography (HPLC) is commonly based on 10% ofthe mobile phase, percolates through the stationary stationary phase inside the whole column. Moreover,one. Two modes allow the retention of the stationary commercial devices for the hydrostatic mode arephase. In the hydrodynamic mode [1], the stationary available with columns of 5.4 l or more. Anotherphase is retained in the column by a centrifugal force striking advantage is the use of a liquid stationaryfield varying in intensity and direction. On the phase, which prevents the denaturation of fragile
solutes and irreversible adsorption and thereforeallows the use of raw samples.
*Corresponding author. In this paper, we will first introduce the two
0021-9673/99/$ – see front matter 1999 Elsevier Science B.V. All rights reserved.PI I : S0021-9673( 98 )00795-X

204 M.-C. Menet, D. Thiebaut / J. Chromatogr. A 831 (1999) 203 –216
modes for the retention of the stationary phase and (CPC) (Fig. 1) manufactured by Sanki Engineering,the corresponding devices we used in our laboratory. Yamazaki, Japan. It was used with six or twelveSecondly, we will describe the design of a selective Type 250 W cartridges put in a rotor and providingsolvent system for the separation of two antibiotics X an internal volume of 125 and 250 ml, respectively.and Y from their fermentation broth and we will Two rotary seals were set in the head and end of thecompare its use in the two modes. Then we will column and allowed the junctions with the pumpsexplain the optimization of the running conditions and the detector. A strong centrifugal force waswith regard to the injection solvent, injection volume applied to the liquid phases inside the column byand injection mode to obtain the highest resolution in rotation of the rotor at various speeds, from 200 tothe two modes (keeping in mind the preparative 2000 rpm [2,4]. In the hydrostatic mode, the constantpurpose of the separation). Finally, we will compare centrifugal force field did not allow a chromato-the preparative chromatographic parameters (yield graphic efficiency of 500 theoretical plates to beper hour and volumetric yield) obtained in the two obtained. Indeed, it was shown that the mobile phasemodes of CCC and in preparative HPLC. only percolates through the stationary one without a
real mixing of the two phases [5].In the hydrodynamic mode (Fig. 2), two devices
2. Experimental were used: a Model CPHV 2000 system (derivedfrom Pharmatech 2000) and a Model CCC 800
2.1. Chromatographic systems (Pharma-Tech. Research, Baltimore, MD, USA). Thefirst one was equipped with three identical and
2.1.1. CCC independent columns symmetrically arranged aroundThe chromatographic system consisted of a the central axis of the centrifuge. Each column was
Shimadzu Model LC 5 A HPLC pump (Touzart et prepared from 93.5 m30.80 mm I.D. PTFE tubingMatignon, Vitry sur Seine, France) and a Constamet- wound onto a holder in a multilayer coil to give aric II G pump (Milton-Roy, Villepinte, France) for capacity of 47 ml. The maximum speed was 2000pumping the aqueous and the organic phases, respec- rpm. The second one was equipped with two identi-tively. The pumps were connected to the CCC cal and independent columns symmetrically arrangedcolumn. around the central axis of the centrifuge. Each
In the hydrostatic mode, the CCC apparatus was a column was prepared from 2.6 mm I.D. PTFE tubingModel LLN centrifugal partition chromatograph to obtain a capacity around 500 ml. The maximum
Fig. 1. CCC apparatus in the hydrostatic mode (‘‘Sanki’’) 15rotary seal, 25connecting tube, 35separation column, 45rotor, g5
centrifugal force.

M.-C. Menet, D. Thiebaut / J. Chromatogr. A 831 (1999) 203 –216 205
Fig. 2. CCC in the hydrodynamic mode.
attainable speed was 1000 rpm. It was shown that connected to a fraction collector Model Helirac 2212variable centrifugal forces create two phases settling (LKB, Les Ulis, France).and mixing zones allowing a higher chromatographicefficiency than in hydrostatic mode (1000 theoretical 2.1.2. Analytical HPLCplates) to be obtained. HPLC analyses of sample solutions were per-
A third pump allowed the injection of the sample formed at 358C on a Pecosphere 5CR C column (58
to the head of the column. The backflush valve mm, 15034.6 mm) (Perkin-Elmer, Saint Quentin enallowed the elution mode of the mobile phase to be Yvelines, France) with 0.1 M phosphate buffer (pH5
chosen. In the hydrostatic mode, two elution modes 2.9)–acetonitrile (67.5: 32.5 v/v) as the mobileare available: the ascending mode referring to the phase at a flow-rate of 1 ml /min.flow of the mobile lighter phase through the channelsin an inward direction, opposite to the direction of 2.1.3. Preparative HPLCthe centrifugal force and the descending mode For comparison between CCC and preparativereferring to the flow of the mobile heavier phase HPLC, Y was purified on octyl bonded silica Li-through the channels in the same direction as the Chrospher 100 RP8 column (100 mm, 3436 cm)centrifugal force. In the hydrodynamic mode, the (Merck, Nogent sur Maine, France) with a Prochromends of the column are labelled ‘‘head’’ or ‘‘tail’’, axial compression system, Model LC6O.VE900depending on both the type of helix (right-handed or (Champigneulles, France). A step gradient was per-left-handed) and the direction of rotation [1]. It was formed: after injection, 2 l of water–acetonitrilefound experimentally that in order to retain the (84:16, v /v) were pumped, then the mobile phasestationary phase in the column, the lighter phase had made of water–acetonitrile (70:30, v /v) wereto be pumped either from the tail to the head or from pumped at a flow-rate of 80–90 ml /min. Thethe head to the tail, depending on the nature of the pressure drop was 40 bar. Solutes to be injected weretwo-phase solvent system and on the b ratio de- dissolved in 500 ml of water–acetonitrile (80:20,scribed Fig. 2 [1]. v /v) and detected by UV absorption at 250 nm
The detection of the solutes was based on evapora- (Spectromonitor 3100, Milton-Roy, Riviera Beach,tive light scattering detection (ELSD) [6] on-line Florida).with the CCC apparatus. The unit was a Sedex 45
´ ´ ´ELSD system manufactured by Sedere, Vitry sur 2.2. ReagentsSeine, France, designed for HPLC and used withoutmodification. The nebulizer of the ELSD system was All organic solvents were of HPLC grade. Metha-supplied with nitrogen by L’Air Liquide, Paris, nol and acetonitrile were purchased from Prolabo,France. The outlet of the column could also be Paris, France; chloroform and ethyl acetate from
206 M.-C. Menet, D. Thiebaut / J. Chromatogr. A 831 (1999) 203 –216
Rathburn (Chromoptic, Montpellier, France). Water Injected volumes were limited to about 2 ml inwas bidistilled. The solvents were filtered before use. analytical chromatography and to 10% of the volume
of the column in preparative chromatography [7].2.3. Solvent systems and sample solution
Solvent mixtures were equilibrated at room tem- 3. Theoretical backgroundperature and the phases were separated shortly beforeuse. The solutions of pure antibiotics or crude In this part, we remind readers of the formulasextracts were prepared by dissolving the samples in used to calculate the efficiency and the resolution.the mobile phase or the stationary one. The classical parameters which are used in Section 4
Two raw materials were used: a crude ethyl are gathered in the glossary.acetate extract of fermentation medium containing7% (w/w) in Y or a purified extract containing 25% 3.1. Efficiency(w/w) in Y. The one-day purification of the extract at7% gave the extract at 25% in many steps: it The number of theoretical plates N for aincluded a dissolution followed by a filtration, then symmetrical peak (as observed during our analyticalan extraction by methylene chloride, a treatment by studies) is computed using the Gaussian peak disper-alumina and a final drying [5]. sion equation.
The number of theoretical plates N for an2.4. Injection procedures asymmetrical peak (as observed during our semi-
preparative studies) is computed using the Foley andTwo different injection procedures were followed Dorsey formula [8]
for the CCC devices.2trThe standard method consisted in first filling ]]S Dw0.1entirely the CCC column with the stationary phase.
]]]N 5 41.7 ? (1)AThen the apparatus was rotated at the desired speed.] 1 1.25BAfter that, the mobile phase was pumped into the
column at the desired flow-rate. Finally, after the where w is the peak width at 10% of the peak0.1equilibrium between the two phases was reached, a height and A /B the asymmetry factor with A1B5sample solution was injected and the mobile phase w .0.1pumped into the column.
The second procedure was called the ‘‘sandwich’’ 3.2. Resolutioninjection. The column was first entirely filled withthe stationary phase and the apparatus rotated at the In the analytical studies, the resolution betweendesired speed. Then the sample was injected into the two peaks, R , can be calculated using:scolumn head and the mobile phase was pumped at
]Œthe desired flow-rate. The separation occurred during 9kN a 2 1 2] ]] ]]R 5 ? ? (2)sthe phase equilibrium. 94 a k 1 12
The sample was injected via a Rheodyne Modelif we assume the widths of the two peaks are equal,7125 injection valve in the hydrodynamic mode andwhere N is the efficiency calculated with the secondvia a Sanki injection valve (Model FCU II valve
9peak, k the retention factor of the second peak and2connection) or a pump in the hydrostatic mode.a the separation factor. R can be calculated by thesInjection with a valve indicates that the sample isconventional formula:introduced into the rotating column through a loop
attached to the injection valve whereas the injection 2(t 2 t )r r2 1]]]R 5 (3)with the pump indicates that the sample is first s v 1 v1 2introduced into the stationary column using a pump
and then the column is rotated to start separation. where t and t are the retention time of the firstr r1 2
M.-C. Menet, D. Thiebaut / J. Chromatogr. A 831 (1999) 203 –216 207
Table 1and the second solutes, respectively, and w and w1 2Selection of solvent systemthe widths of the two peaks.
Solvent system: CHCl –C H OCOCH –CH OH–water3 2 5 3 3
3:1:3:2 (v /v) 2.4:1.6:3:2 (v /v) 2:2:3:2 (v /v)
4. Results and discussion K 0.07 0.13 0.2X
K 0.12 0.21 0.35Y
a 1.7 1.6 1.7Firstly, the separation was optimized in the hydro-R 1.8 2.1 2.6s1dynamic mode prior its adaptation to the hydrostatic
mode. R 0.56 0.75 1.1s2
9K 14.3 7.7 5X4.1. Design of a selective solvent system9K 8.3 4.8 2.9Y
9k 33.2 15.4 10XTaking into account the relative hydrophobicity of R 2.4 2.1 2.2s3the solutes X and Y we had to separate and accord-ing to Ito’s classification [1], we chose an inter-mediate polarity solvent system, made of chloro-
hydrodynamic mode to select the best solvent systemform–ethyl acetate–methanol–water. Such a solvent
in the hydrostatic mode.composition has already been described for anti- Firstly, we calculated the Y and X retention factorsbiotics separation [1]. k9 according to (8), by using an average value for the
S in hydrostatic mode (commonly 70% versus 90%F4.1.1. Hydrodynamic mode for hydrodynamic one) and by using the organic
The volumetric composition of the solvent system mobile phase. Then, we estimated the resolution Rs2was varied to obtain the best resolution for the of the antibiotics separation by using relation (2)separation. For each composition, an analytical sepa- with a 500 value for the efficiency (versus 1000 inration of the two antibiotics was carried out and the the hydrodynamic mode) (Table 1). Indeed, thepartition coefficients computed according to (10) measured efficiency in the hydrodynamic mode isSection 6), the retention factors according to (8), the higher than that in the hydrostatic mode because theseparation factor a and the resolution R accordings improved mixing in the hydrodynamic mode in-1
to classical formulae (3). The partition coefficients K creases the liquid–liquid interface and facilitates thewere defined as the ratio of the concentration in the exchange of the X and Y solutes through theaqueous phase on the concentration in the organic interface [5].mobile phase. Because the retention of the stationary phase and
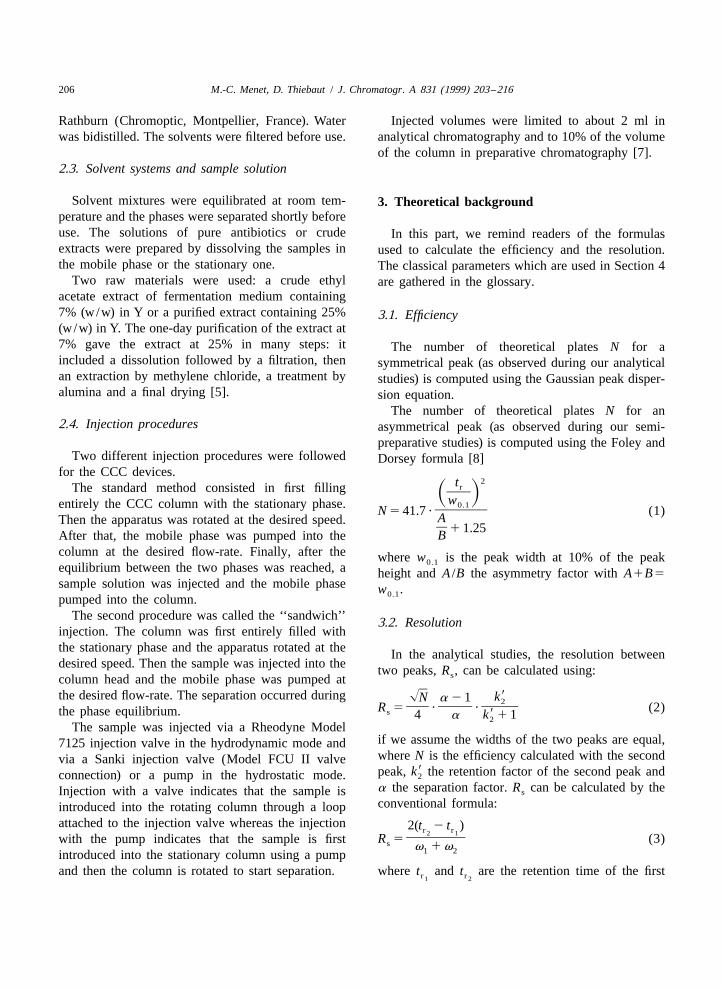
Table 1 shows the partition coefficients K andX the efficiency are higher in the hydrodynamic modeK were smaller than one (i.e., ,0.35) whichY compared to the hydrostatic mode, a very goodindicated that the antibiotics are more soluble in the resolution R was obtained for the hydrodynamics1organic phase. The separation factors a were con- mode with an aqueous stationary phase. Indeed, thestant (1.7), even if the partition coefficients increased estimated resolution R for the hydrostatic modes2with the proportion of ethyl acetate. Therefore, the was not satisfactory (,1.1). Hence, to compensatenature of the interactions which allows the solubility for the lower values of S and efficiency, it wasFof the solutes in the organic phase is not modified by necessary to increase the partition coefficient. Byaddition of ethyl acetate. Whatever the composition, exchanging the roles of the stationary phase and thethe resolution was satisfactory. Thus, a satisfactory mobile one, the partition coefficients K9 were thenseparation of the two antibiotics in less than 30 min defined as the ratio of the concentration in thewas obtained with a resolution close to 2 (Fig. 3a). organic phase to the concentration in the aqueous
phase and is the inverse of previous ones while a
4.1.2. Hydrostatic mode remains constant. Estimated resolutions R are givens3
We used the partition coefficients obtained in in Table 1 by using relation (2).
208 M.-C. Menet, D. Thiebaut / J. Chromatogr. A 831 (1999) 203 –216
CH OH–water (2:2:3:2, v /v) composition for the3
separation, which gave the smallest retention factors[calculated according to (10)] and therefore theshortest separation time (Fig. 3b).
These results show that the optimized solventcomposition for the hydrodynamic mode cannot bedirectly applied to the hydrostatic mode because thelatter lacks efficiency to obtain a satisfactory res-olution (R .1.5) [7]. It was demonstrated therefores
to be necessary to choose the mobile phase and thecomposition of the solvent system carefully.
Remark: The organic stationary phase could also beused in the hydrodynamic system with an expectedhigher resolution than with the aqueous stationaryphase.
These preliminary studies allowed the optimiza-tion of the composition of the solvent system foranalytical scale purposes and a more than satisfac-tory resolution to ensure the further quality of thepreparative scale separation to be obtained. Variousrunning conditions remained to be optimized. Thefollowing studies were intended to determine if theresolution depended only on the selection of thesolvent system or if it also involved the choice ofother parameters such as the injection solvent, theinjection volume and the injection mode.
4.2. Running conditions
Keeping in mind the preparative purpose of CCC,the analytical separation should show a higher thanFig. 3. (a) Chromatogram of the separation of X and Y on CPHV
2000. Internal volume: 110 ml. Solvent system: chloroform–ethyl 1.5 resolution.acetate–methanol–water (2.4:1.6:3:2, v /v). Organic mobile phase For these studies with an organic stationary phase,is pumped into the head. Flow-rate: 2 ml /min. Injection volume 2
the Sanki LLN with six cartridges was used.ml. Injected quantities: 4 mg of a pure antibiotics mixture.Rotational speed: 900 rpm. S : 52%. ELSD: 408C, nitrogenF
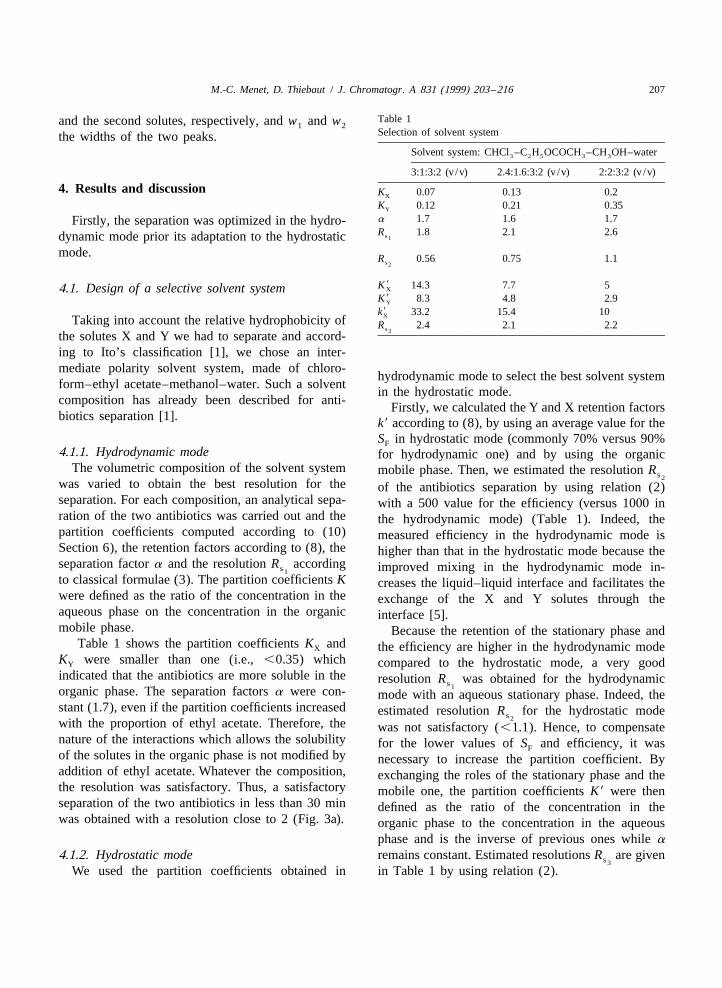
4.2.1. Injection solventpressure: 2 bar. (b) Chromatogram of the separation of Y and Xon Sanki LLN. Internal volume: 125 ml. Solvent system: chloro- A mixture of the two pure antibiotics was dis-form–ethyl acetate–methanol–water (2:2:3:2, v /v). Ascending solved either in the aqueous mobile phase (first case:mode. Aqueous mobile phase flow-rate: 4 ml /min. Injection
a) or in the organic stationary phase (second case: b)volume: 2 ml. Injected quantities: 4 mg of a pure antibiotics(Fig. 4). A 1.5 ml volume of the samples at 2 g/ lmixture. Rotational speed: 900 rpm. S : 52%. ELSD: 408C,F
was injected by the sandwich method.nitrogen pressure: 2 bar.
We have calculated the stationary phase retentionS according to formula (6), the efficiency and theF
An increase of the resolution was observed by resolution according to Eq. (3) for each case. Theusing an organic stationary phase instead of an injection in the aqueous phase disturbed the two-aqueous one. We chose the CHCl –C H OCOCH – phase equilibrium inside the column, leading to leaks3 2 5 3
M.-C. Menet, D. Thiebaut / J. Chromatogr. A 831 (1999) 203 –216 209
with the sample dissolved in the organic phase whichis the stationary one. This result was interestingbecause the antibiotics are highly soluble in thisorganic phase.
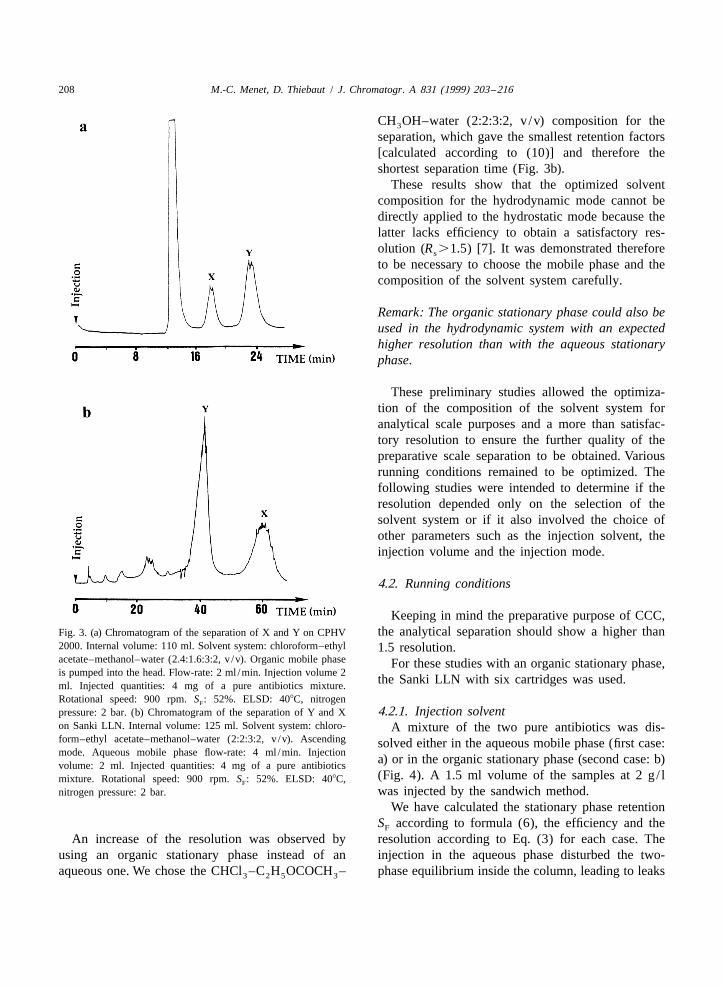
4.2.2. Injection volumeAccording to the first study, the organic stationary
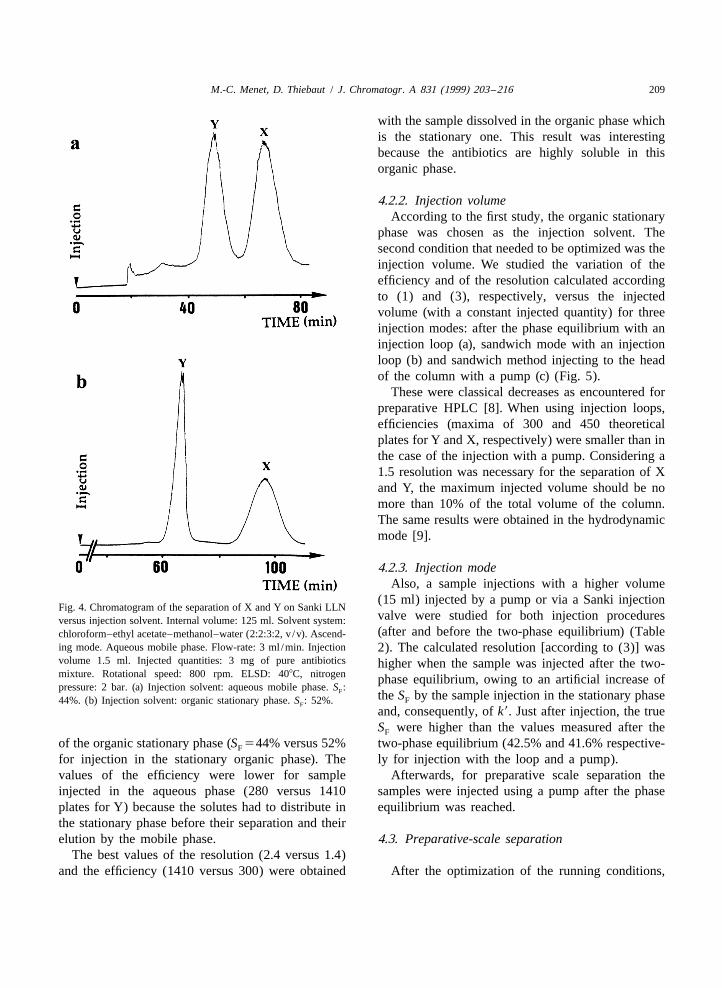
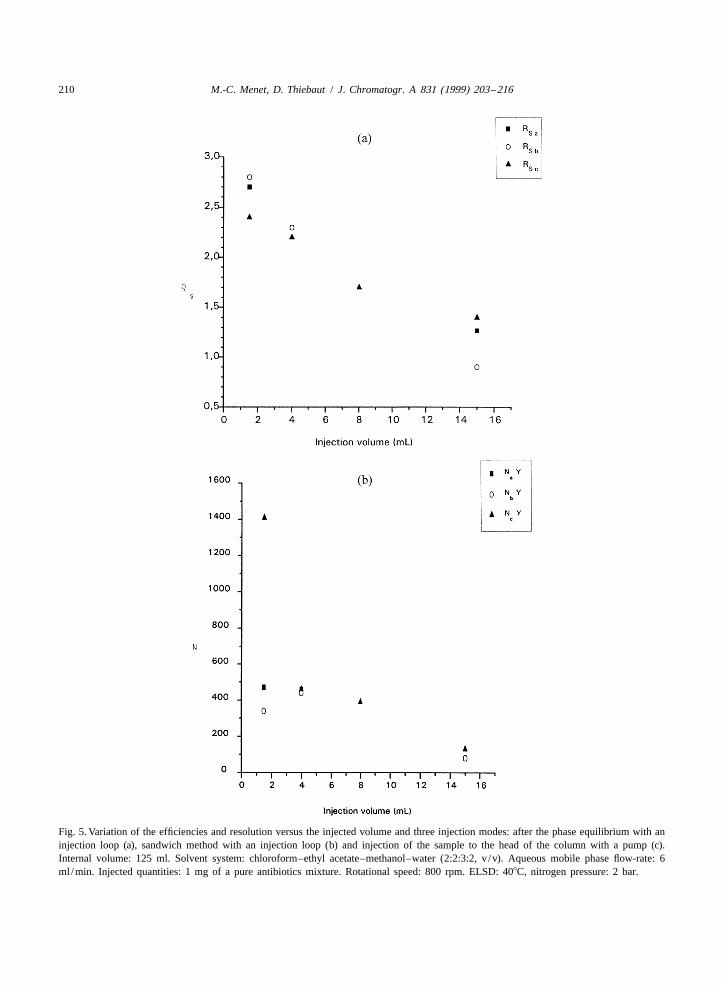
phase was chosen as the injection solvent. Thesecond condition that needed to be optimized was theinjection volume. We studied the variation of theefficiency and of the resolution calculated accordingto (1) and (3), respectively, versus the injectedvolume (with a constant injected quantity) for threeinjection modes: after the phase equilibrium with aninjection loop (a), sandwich mode with an injectionloop (b) and sandwich method injecting to the headof the column with a pump (c) (Fig. 5).
These were classical decreases as encountered forpreparative HPLC [8]. When using injection loops,efficiencies (maxima of 300 and 450 theoreticalplates for Y and X, respectively) were smaller than inthe case of the injection with a pump. Considering a1.5 resolution was necessary for the separation of Xand Y, the maximum injected volume should be nomore than 10% of the total volume of the column.The same results were obtained in the hydrodynamicmode [9].
4.2.3. Injection modeAlso, a sample injections with a higher volume
(15 ml) injected by a pump or via a Sanki injectionFig. 4. Chromatogram of the separation of X and Y on Sanki LLN
valve were studied for both injection proceduresversus injection solvent. Internal volume: 125 ml. Solvent system:(after and before the two-phase equilibrium) (Tablechloroform–ethyl acetate–methanol–water (2:2:3:2, v /v). Ascend-
ing mode. Aqueous mobile phase. Flow-rate: 3 ml /min. Injection 2). The calculated resolution [according to (3)] wasvolume 1.5 ml. Injected quantities: 3 mg of pure antibiotics higher when the sample was injected after the two-mixture. Rotational speed: 800 rpm. ELSD: 408C, nitrogen phase equilibrium, owing to an artificial increase ofpressure: 2 bar. (a) Injection solvent: aqueous mobile phase. S :F the S by the sample injection in the stationary phaseF44%. (b) Injection solvent: organic stationary phase. S : 52%.F
and, consequently, of k9. Just after injection, the trueS were higher than the values measured after theF
of the organic stationary phase (S 544% versus 52% two-phase equilibrium (42.5% and 41.6% respective-F
for injection in the stationary organic phase). The ly for injection with the loop and a pump).values of the efficiency were lower for sample Afterwards, for preparative scale separation theinjected in the aqueous phase (280 versus 1410 samples were injected using a pump after the phaseplates for Y) because the solutes had to distribute in equilibrium was reached.the stationary phase before their separation and theirelution by the mobile phase. 4.3. Preparative-scale separation
The best values of the resolution (2.4 versus 1.4)and the efficiency (1410 versus 300) were obtained After the optimization of the running conditions,
210 M.-C. Menet, D. Thiebaut / J. Chromatogr. A 831 (1999) 203 –216
Fig. 5. Variation of the efficiencies and resolution versus the injected volume and three injection modes: after the phase equilibrium with aninjection loop (a), sandwich method with an injection loop (b) and injection of the sample to the head of the column with a pump (c).Internal volume: 125 ml. Solvent system: chloroform–ethyl acetate–methanol–water (2:2:3:2, v /v). Aqueous mobile phase flow-rate: 6ml /min. Injected quantities: 1 mg of a pure antibiotics mixture. Rotational speed: 800 rpm. ELSD: 408C, nitrogen pressure: 2 bar.

M.-C. Menet, D. Thiebaut / J. Chromatogr. A 831 (1999) 203 –216 211
Fig. 5. (continued)
preparative scale separations were carried out with most difficult to purify because of its physico-chemi-the two CCC modes and preparative HPLC. To cal properties (particularly hydrophobicity) whichcompare the separations, classical parameters of are close to those of the main impurities. The hourlypreparative scale chromatography were calculated: yield (g /h) is defined as the ratio of the recoveredthe experimental duration including the sample prep- quantity to the experimental duration. The volu-aration and the separation time, the solvent consump- metric yield (g / l) is defined as the ratio of thetion including the volume of the mobile phase, the recovered quantity to the solvent consumption [7].stationary phase and the injection solvent, the purityof the purest fraction in Y. The parameter ‘‘purity in 4.3.1. CCCY’’ was chosen because Y is the solute which is the According to the previous studies, the samples to
Table 2Efficiency, resolution and S versus the injection modeF
15 ml Loop Pumpinjection
After equilibrium Before equilibrium After equilibrium Before equilibrium
N 80 80 140 1301
N 140 50 80 2202
R 1.3 0.9 1.5 1.4sa b a bS (%) 42.5 37.6 41.6 40F
a bmeasured after the two- phase equilibrium, measured after the column emptying.
212 M.-C. Menet, D. Thiebaut / J. Chromatogr. A 831 (1999) 203 –216
be injected were prepared in the organic phase [4]. Finally, the preparative scale separation was(which is the stationary phase in the two modes). directly scaled up from a small internal volume to aInjected volume was up to 10% of the total volume higher one as in the hydrodynamic mode [9]. Thisof the column, i.e., 10 ml, 20 ml and 100 ml (for 125 scale up is very interesting in the hydrostatic modeml and 250 ml internal column volume in hydrostatic because a column with a volume up to 5 l ismode and 1000 ml in the hydrodynamic mode, commercially available.respectively) injected with a pump and after the CCC was revealed as a very suitable method forphase equilibrium was established. The collection of the purification of selected compounds from complexthe fractions allowed the effluent to be analyzed and mixtures because fractions at 96% in Y were ob-potential stationary phase leaks to be monitored. tained from crude extract with a 7% content in Y [8].
4.3.1.1. Hydrostatic mode 4.3.1.2. Hydrodynamic modeTwo purifications of raw material at 7% in Y were One experiment was carried out by using the
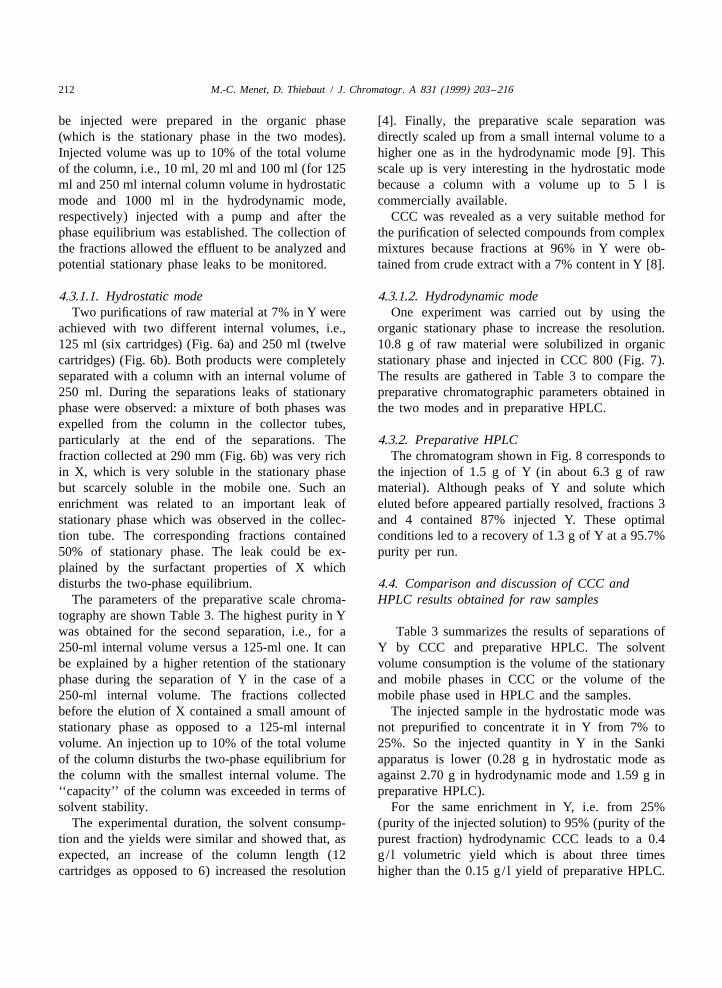
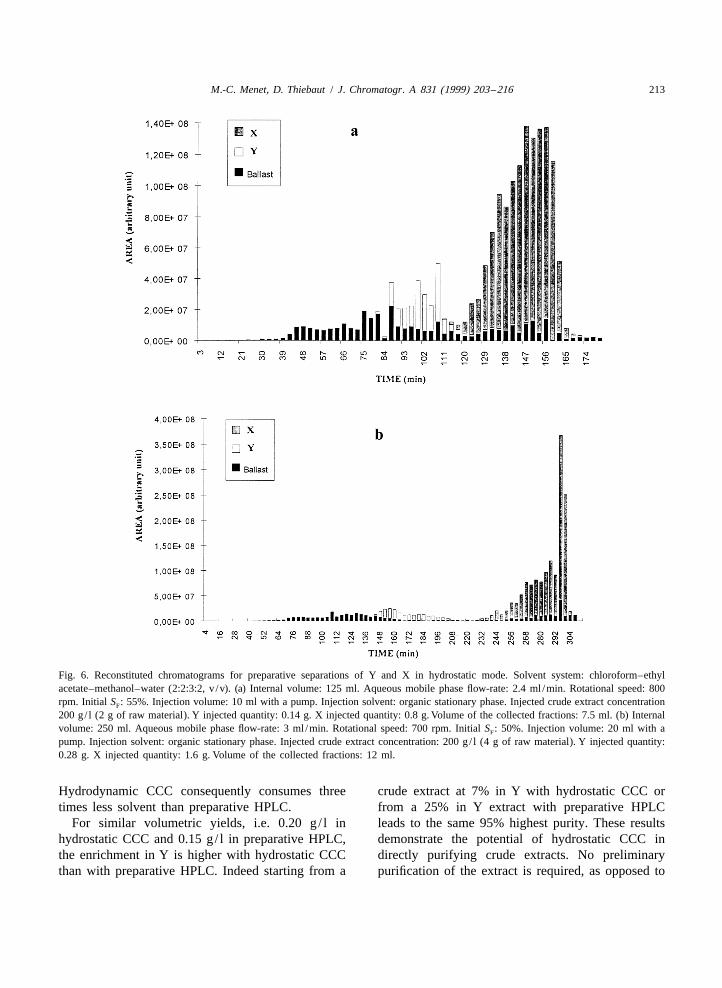
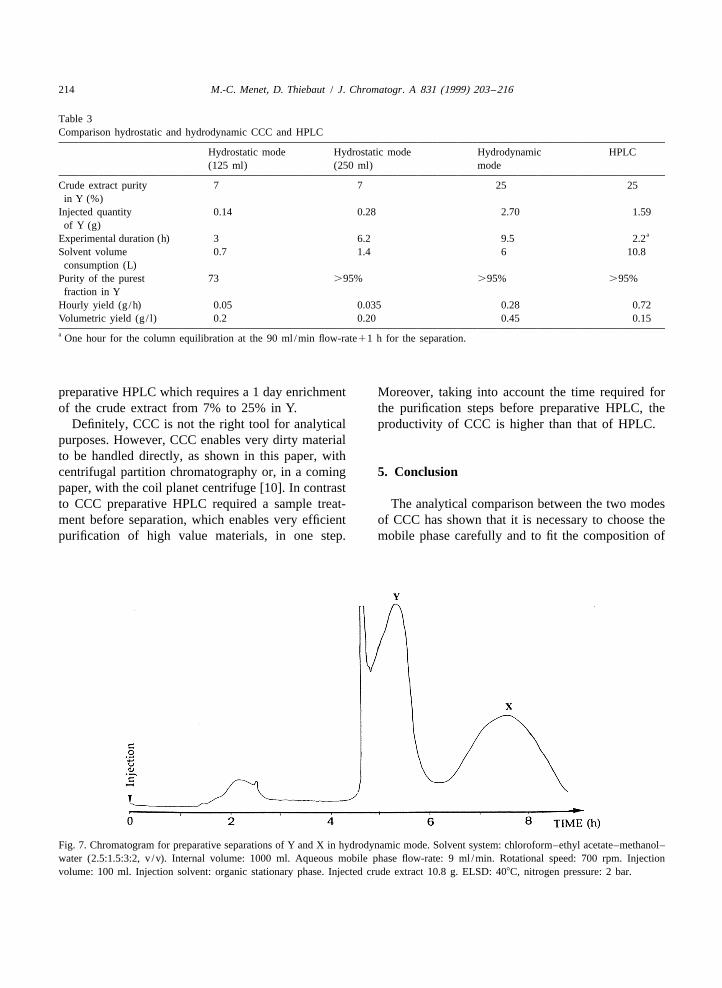
achieved with two different internal volumes, i.e., organic stationary phase to increase the resolution.125 ml (six cartridges) (Fig. 6a) and 250 ml (twelve 10.8 g of raw material were solubilized in organiccartridges) (Fig. 6b). Both products were completely stationary phase and injected in CCC 800 (Fig. 7).separated with a column with an internal volume of The results are gathered in Table 3 to compare the250 ml. During the separations leaks of stationary preparative chromatographic parameters obtained inphase were observed: a mixture of both phases was the two modes and in preparative HPLC.expelled from the column in the collector tubes,particularly at the end of the separations. The 4.3.2. Preparative HPLCfraction collected at 290 mm (Fig. 6b) was very rich The chromatogram shown in Fig. 8 corresponds toin X, which is very soluble in the stationary phase the injection of 1.5 g of Y (in about 6.3 g of rawbut scarcely soluble in the mobile one. Such an material). Although peaks of Y and solute whichenrichment was related to an important leak of eluted before appeared partially resolved, fractions 3stationary phase which was observed in the collec- and 4 contained 87% injected Y. These optimaltion tube. The corresponding fractions contained conditions led to a recovery of 1.3 g of Y at a 95.7%50% of stationary phase. The leak could be ex- purity per run.plained by the surfactant properties of X whichdisturbs the two-phase equilibrium. 4.4. Comparison and discussion of CCC and
The parameters of the preparative scale chroma- HPLC results obtained for raw samplestography are shown Table 3. The highest purity in Ywas obtained for the second separation, i.e., for a Table 3 summarizes the results of separations of250-ml internal volume versus a 125-ml one. It can Y by CCC and preparative HPLC. The solventbe explained by a higher retention of the stationary volume consumption is the volume of the stationaryphase during the separation of Y in the case of a and mobile phases in CCC or the volume of the250-ml internal volume. The fractions collected mobile phase used in HPLC and the samples.before the elution of X contained a small amount of The injected sample in the hydrostatic mode wasstationary phase as opposed to a 125-ml internal not prepurified to concentrate it in Y from 7% tovolume. An injection up to 10% of the total volume 25%. So the injected quantity in Y in the Sankiof the column disturbs the two-phase equilibrium for apparatus is lower (0.28 g in hydrostatic mode asthe column with the smallest internal volume. The against 2.70 g in hydrodynamic mode and 1.59 g in‘‘capacity’’ of the column was exceeded in terms of preparative HPLC).solvent stability. For the same enrichment in Y, i.e. from 25%
The experimental duration, the solvent consump- (purity of the injected solution) to 95% (purity of thetion and the yields were similar and showed that, as purest fraction) hydrodynamic CCC leads to a 0.4expected, an increase of the column length (12 g/ l volumetric yield which is about three timescartridges as opposed to 6) increased the resolution higher than the 0.15 g/ l yield of preparative HPLC.
M.-C. Menet, D. Thiebaut / J. Chromatogr. A 831 (1999) 203 –216 213
Fig. 6. Reconstituted chromatograms for preparative separations of Y and X in hydrostatic mode. Solvent system: chloroform–ethylacetate–methanol–water (2:2:3:2, v /v). (a) Internal volume: 125 ml. Aqueous mobile phase flow-rate: 2.4 ml /min. Rotational speed: 800rpm. Initial S : 55%. Injection volume: 10 ml with a pump. Injection solvent: organic stationary phase. Injected crude extract concentrationF
200 g/ l (2 g of raw material). Y injected quantity: 0.14 g. X injected quantity: 0.8 g. Volume of the collected fractions: 7.5 ml. (b) Internalvolume: 250 ml. Aqueous mobile phase flow-rate: 3 ml /min. Rotational speed: 700 rpm. Initial S : 50%. Injection volume: 20 ml with aF
pump. Injection solvent: organic stationary phase. Injected crude extract concentration: 200 g/ l (4 g of raw material). Y injected quantity:0.28 g. X injected quantity: 1.6 g. Volume of the collected fractions: 12 ml.
Hydrodynamic CCC consequently consumes three crude extract at 7% in Y with hydrostatic CCC ortimes less solvent than preparative HPLC. from a 25% in Y extract with preparative HPLC
For similar volumetric yields, i.e. 0.20 g/ l in leads to the same 95% highest purity. These resultshydrostatic CCC and 0.15 g/ l in preparative HPLC, demonstrate the potential of hydrostatic CCC inthe enrichment in Y is higher with hydrostatic CCC directly purifying crude extracts. No preliminarythan with preparative HPLC. Indeed starting from a purification of the extract is required, as opposed to
214 M.-C. Menet, D. Thiebaut / J. Chromatogr. A 831 (1999) 203 –216
Table 3Comparison hydrostatic and hydrodynamic CCC and HPLC
Hydrostatic mode Hydrostatic mode Hydrodynamic HPLC(125 ml) (250 ml) mode
Crude extract purity 7 7 25 25in Y (%)
Injected quantity 0.14 0.28 2.70 1.59of Y (g)
aExperimental duration (h) 3 6.2 9.5 2.2Solvent volume 0.7 1.4 6 10.8consumption (L)
Purity of the purest 73 .95% .95% .95%fraction in Y
Hourly yield (g /h) 0.05 0.035 0.28 0.72Volumetric yield (g / l) 0.2 0.20 0.45 0.15a One hour for the column equilibration at the 90 ml /min flow-rate11 h for the separation.
preparative HPLC which requires a 1 day enrichment Moreover, taking into account the time required forof the crude extract from 7% to 25% in Y. the purification steps before preparative HPLC, the
Definitely, CCC is not the right tool for analytical productivity of CCC is higher than that of HPLC.purposes. However, CCC enables very dirty materialto be handled directly, as shown in this paper, withcentrifugal partition chromatography or, in a coming 5. Conclusionpaper, with the coil planet centrifuge [10]. In contrastto CCC preparative HPLC required a sample treat- The analytical comparison between the two modesment before separation, which enables very efficient of CCC has shown that it is necessary to choose thepurification of high value materials, in one step. mobile phase carefully and to fit the composition of
Fig. 7. Chromatogram for preparative separations of Y and X in hydrodynamic mode. Solvent system: chloroform–ethyl acetate–methanol–water (2.5:1.5:3:2, v /v). Internal volume: 1000 ml. Aqueous mobile phase flow-rate: 9 ml /min. Rotational speed: 700 rpm. Injectionvolume: 100 ml. Injection solvent: organic stationary phase. Injected crude extract 10.8 g. ELSD: 408C, nitrogen pressure: 2 bar.

M.-C. Menet, D. Thiebaut / J. Chromatogr. A 831 (1999) 203 –216 215
Fig. 8. Preparative HPLC chromatogram of Y. Column 3436 cm I.D. with axial compression, stationary phase: octyl bonded silica,LiChrospher 100 RP8, 100 mm. Mobile phase: water–acetonitrile (70:30, v /v), flow-rate: 80–90 ml /min. Pressure drop: 40 bar. Injection:6.3 g of raw material containing 1.55 g of Y. Detection: UV at 250 nm.
the solvent system, because efficiency and retention V (5) can be measured after the columns
of the stationary phase in the hydrostatic mode are emptying.lower than in the hydrodynamic mode. On a semi- S retention of the stationary phase: S 5(V /V )F F s m
preparative scale, the two modes of CCC are similar (6)in terms of purities and of yields obtained (hourly t hold-up time: t 5(V /F (7), where F (ml /min)0 0 m
and volumetric). is the flow-rate of the mobile phaseUsing small scale devices as described in this k9 retention factor: t 5t (11k9) (8), where t isr 0 r
paper, CCC has enabled the recovery of an amount the retention time of the solute.(about 1 g) of pure compound with a higher purity K partition coefficient: K5(C /C ) (9) and K5s m
than 95%, without previous extraction as opposed to k9(V /V )5k9[(1 /S )21] (10), where C is them s F s
semi-preparative HPLC. It is a unique technique for concentration of the solute in the stationarythe fractionation and the purification of compounds phase and C its concentration in the mobilem
from raw samples. phase.a separation factor, which is related to the sol-
vent selectivity, is defined as the ratio of the6. Symbols peak retention factor to the first peak retention
factor.V internal volume of the column.t
V volume of the stationary phase expelled frome
the column by the mobile phase during the Acknowledgementsequilibrium period.
ˆV Volume of the stationary phase: V 5V 2V The authors wish to thank Rhone-Poulenc Rorers s t e
(4). who furnished crude and purified extracts of X andV mobile phase volume in the column: V 5V 2 Y.m m t

216 M.-C. Menet, D. Thiebaut / J. Chromatogr. A 831 (1999) 203 –216
´[5] J.-M. Menet, M.-C. Rolet, D. Thiebaut, R. Rosset, Y. Ito, J.ReferencesLiq. Chromatogr. 15 (1992) 2883.
´[6] S. Drogue, M.-C. Rolet, D. Thiebaut, R. Rosset, J. Chroma-[1] B. N. Mandava, Y. Ito, Countercurrent Chromatography. togr. 538 (1991) 91.
Theory and Practice, Chromatographic Science Series, vol. [7] R. Rosset, M. Caude, A. Jardy, Chromatographies en Phases44, Marcel Dekker, New York, 1988. Liquide et Supercritique, Masson, Paris, 1991.
[2] Manual for Centrifugal Partition Chromatography, Model [8] J.P. Foley, J.G. Dorsey, Anal. Chem. 55 (1983) 730.LLN, Sharon Hill, PA, 1987. ` ´[9] S. Drogue, These de Doctorat, Universite de Paris VI, 1992.
[3] K. Hostettman, A. Marston, Anal. Chim. Acta 236 (1990) ´[10] M. Agnely, D. Thiebaut, J. Chromatogr. A 790 (1997) 17.63.
[4] W. Marayama, T. Kobayashi, Y. Kosuge, J. Chromatogr. 239(1982) 643.