preparative high-performance liquid chromatography of echinocandins
TRANSCRIPT

Journal of Chromatography A, 827 (1998) 373–389
Preparative high-performance liquid chromatography ofechinocandins* ¨David J. Roush , Firoz D. Antia, Kent E. Goklen
Merck & Co. Inc., BioProcess R&D, BioPurification Development Group, P.O. Box 2000, RY806-100, Rahway, NJ 07065, USA
Abstract
The isolation of fermentation derived small bioactive molecules remains extremely challenging due to the presence ofmany analogues with similar physicochemical behavior. Removal of analogue impurities typically involves crystallizationand/or preparative HPLC. The normal-phase preparative HPLC for the purification of fermentation derived echinocandins isdescribed. Resolution of key impurities from the product of interest, pneumocandin B , is accomplished using a ternary ethylo
acetate–methanol–water mobile phase with silica gel as the sorbent. Plate counts, measured with small molecules, show thatthe column efficiency is excellent under the operating conditions despite the use of an irregular silica and unusually highlevels (greater than 6%) of water in the mobile phase. The results of optimization studies indicate the product solubility,retention and resolution of key analogue impurities are strong functions of the ternary mobile phase composition. Thenormal-phase HPLC process was optimized by carrying out eluent flow-rate (linear velocity) and column loading studies.The results of these experimental studies indicate that both yield and productivity are a function of linear velocity andproduct loading and that a tradeoff exists between these two parameters. 1998 Elsevier Science B.V. All rights reserved.
Keywords: Preparative chromatography; Echinocandins; Lipopeptides; Peptides; Pneumocandins
1. Introduction pneumocandins B and C differ only in the positiono o
of the hydroxyl group on this side chain, whereasEchinocandins are a class of naturally occurring pneumocandin A has an additional methyl groupo
lipopeptides with antifungal activity. The structures [1].of three closely related members of the subclass The large-scale isolation of pneumocandin Bo
known as pneumocandins are given in Fig. 1. They from cultures of the fungus Glarea lozoyensis is aare cyclic hexapeptides with multiple hydroxyl significant technical challenge. The organism cangroups and a hydrophobic dimethylmyristate tail produce, in addition to the desired compound, aconnected via an amide bond to the a-amino group dozen or more echinocandins [2,3] including pneu-of the (hydroxylated) ornithine residue. The three mocandins A and C . Furthermore, the lipopeptideso o
compounds in the figure differ from each other only have unique solubility properties: they are essentiallyin subtle modifications to the side chain of the insoluble in water and most pure solvents, butproline residue adjacent to the ‘‘ornithine’’. Indeed, dissolve in alcohols and some aqueous–organic
solvent mixtures [4]. Moreover, they are difficult topurify by crystallization.
* The present work outlines some aspects of theCorresponding author. Tel.: 11 732 5943204; fax: 11 7325944973; e-mail: david [email protected] development and scale-up of a large-scale high-
]
0021-9673/98/$ – see front matter 1998 Elsevier Science B.V. All rights reserved.PI I : S0021-9673( 98 )00804-8

374 D.J. Roush et al. / J. Chromatogr. A 827 (1998) 373 –389
performance liquid chromatography (LS-HPLC) step 2. Experimentalfor purification of pneumocandin B , extendingo
earlier reports on low pressure silica-gel chromatog- 2.1. Materialsraphy of the pneumocandins [4–6]. The feasibility ofpneumocandin purification by HPLC has been dem- All experimental studies employed irregular silicaonstrated [7]. The use of bare and functionalized from Amicon (Cherry Hill, MA, USA) designatedsilica-gel media in the purification of many low- Grade 631, Si-60 of nominal particle size 20 mm.molecular-mass compounds has been repeatedly Analytical scale columns (25034.6 mm) were ob-documented in the literature [8–12] and summarized tained prepacked from Amicon (Beverly, MA, USA).in a recent review [13]. Typical normal-phase sepa- All solvents employed in the ternary mobile phaserations are performed with bare silica, either spheri- (ethyl acetate, methanol and water) were HPLCcal or irregular, employing a binary mobile phase grade from Fisher Scientific (Pittsburgh, PA, USA).composed of a weakly polar solvent combined with Mobile phases employed for the preparative scalean alcohol (e.g. EtOAc and MeOH). However, chromatography were prepared from MeOH (99.9%,balancing the solvent polarity of a mobile phase via w/w, purity) from Enron (Houston, TX, USA), andthe use of ternary solvent system for preparative urethane grade ethyl acetate from Eastman (Perthnormal-phase separations has only seen limited Amboy, NJ, USA) and low ion water produced in theutilization [14]. laboratory using a purification unit from Osmonics
This work discusses reasons for selection of the (Minnetonka, MN, USA). Volumetric compositionsnormal-phase system, choice of the stationary phase, of solutions are designated as volumes prior toand selection and optimization of the mobile phase, mixing and do not account for non-ideal mixingwhich is a ternary solution of ethyl acetate (EtOAc), effects. For example, an EtOAc–MeOH–water solu-methanol, (MeOH) and water with an unusually high tion designated as 84:9:7 was prepared by mixing 84water content of about 7%. Although much specula- volumes of EtOAc, 9 volumes of MeOH and 7tion exists on the effect of water on the separation volumes of water.efficiency and compound adsorption in normal-phase Tracer solutions for both analytical and prepara-chromatography, in particular in a ternary mobile tive scale were prepared by adding 2.5% (v/v)phase, few conclusive experimental studies have methylethyl ketone (MEK; 2-butanone) and 0.5%been presented in the literature [15]. The question of (v /v) toluene to the ternary mobile phase. The MEKwhether water content impacts column efficiency is was ACS grade from Fisher Scientific and theexamined with the help of plate number measure- toluene was GR grade (99%) from EM Sciencements with tracer compounds at different water (Gibbstown, NJ, USA).levels. Feedstock for the preparative separation experi-
Translating the research performed at analytical to ments was derived from an isolated solid inter-preparative scale, including the importance of mediate containing the product of interest, pneumo-balancing yield and productivity, [16] has been the candin B , in addition to more than ten othero
focus of significant research. Previous investigators analogue impurities. A method for isolation of thehave described the important parameters associated feedstock material from a fermentation broth usingwith the successful development and scaleup of solvent extractions and a precipitation is describedpreparative HPLC processes [17] including the pack- elsewhere [1,6]. The structure of the product and twoing and operation of dynamic axial compression other marker analogue impurities is presented in Fig.columns [18–25]. 1. The feed to the preparative scale HPLC experi-
The maximization of preparative HPLC through- ments contained the product at a concentrationput is also examined here with experiments carried ranging from 10 to 30 g/ l and was prepared viaout at different loads and flow-rates, using pneumo- dissolution in a proprietary solvent blend.candins A and C as critical markers of the qualityo o
of separation. Finally, results of scaling up from the 2.2. Equipmentlaboratory to a 15-cm I.D. column in our pilot plantare presented. Analytical scale experiments were performed on a
D.J. Roush et al. / J. Chromatogr. A 827 (1998) 373 –389 375
Hewlett-Packard (Waldbronn, Germany) HP-1100 tant was decanted and additional mobile phase, equalHPLC system composed of a quaternary pump, to the original silica-gel volume, was added to thecolumn thermostat and variable-wavelength detector wetted silica and the step repeated. Following com-(VWD) with detection monitored at 278 nm. The pletion of the silica-gel de-fining operation, the silicadata analyses were performed using CHEMSTATION gel was reslurried in the mobile phase and poured orSoftware Rev. A.05.04 and a Windows 95 (Mi- pumped into either a 6-, 15- or 30-cm I.D. Prochromcrosoft, Eugene, OR, USA) operating system. All axial compression column. The silica-gel slurry wasmobile phases were prepared via blending of sol- then rapidly compressed with a packing pressure invents off-line to HPLC operations. Injection volumes the range of 4.14 to 4.48 MPa. Column volume wasfor tracer experiments were performed at volumes calculated by multiplying the column length, de-from 5 to 20 ml. Analyses of detailed fractions from termined immediately after completion of packing,preparative HPLC runs were performed with the by the internal diameter of the column.HP-1100 system.
Preparative experiments were performed at twodifferent scales of operation employing a 6-cm I.D.
3. Results and discussionsemipreparative column and a 15-cm I.D. preparativecolumn. The semipreparative experiments employed
Two key marker compounds (Fig. 1), pneumo-a Dorr Oliver Model C (1 l /min pumping skid,
candin A and C , are employed throughout theo oBiotage Division of Dyax) and a 6-cm I.D. (0.5-mwork to demonstrate the sensitivity of the isolation
length column) axial compression column fromprocess to the parameters investigated. Note that
Prochrom (Indianapolis, IN, USA). The preparativethese two compounds differ only slightly from
experiments employed a Dorr Oliver Model B (5pneumocandin B , the compound of interest. Pneu-ol /min pumping skid, Biotage) and a 15-cm I.D.mocandin A contains an additional methyl group ato(1.7-m length) axial compression column fromthe 4 position in the hydroxyproline functional
Prochrom. A limited number of column efficiencygroup. One key analogue impurity, pneumocandin
measurements are reported using a Biotage KP 3000C , is a positional isomer of the product, ando(12 l /min pumping skid) and a 30-cm I.D. dynamicrepresents a shift in a hydroxyl group from the 4 to
axial compression column from Prochrom. Detectionthe 3 position on the hydroxyproline section of the
for all systems was at 278 nm.polar hexapeptide core.
Tracer solutions were injected via a sample pumpThe goal of these experimental studies was the
for the 6- and 15-cm I.D. columns and via a syringedevelopment of a purification process for pneumo-
for the 30-cm I.D. column. Owing to the designcandin B from various other analogue impuritiesolimitations for the 15-cm system, a minimum in-present in the feedstock solution. The research is
jection volume of 2 column volume percent wascomposed of two parts: the first consists of a
required. Data obtained from the laboratory experi-background/overview section which provides the
ments that explored the effect of tracer injectionrationale for why chromatography was pursued to
volume on column efficiency were subsequentlyisolate the product of interest and the second ex-
employed to normalize all column efficiency mea-plores the process development aspect of the project.
surements to a fixed tracer volume injection of 0.5column volume percent (Appendix B).
3.1. Choice of normal-phase silica-gel HPLC2.3. Silica gel defining protocol /column packing
The first technical question is — why explorePacking for preparative scale columns was de- chromatography to purify pneumocandin B ? Theo
fined using the following protocol derived from answer to this question lies in the complex nature oftechnical discussions with Prochrom, the preparative the compound. The amphiphilic nature of thesecolumn vendor. The dry silica powder was slurried compounds gives rise to unusual partitioning andin an equal volume of mobile phase followed by solubility properties, and makes them extremelygravity settling for a minimum of 3 h. The superna- difficult to purify via conventional crystallization,
376 D.J. Roush et al. / J. Chromatogr. A 827 (1998) 373 –389
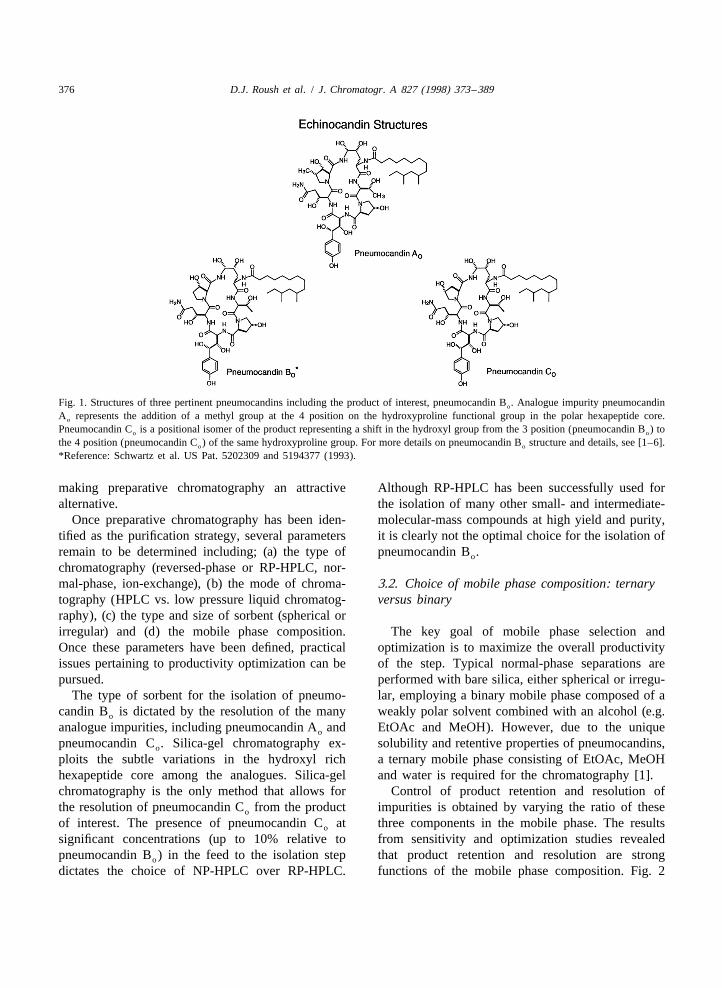
Fig. 1. Structures of three pertinent pneumocandins including the product of interest, pneumocandin B . Analogue impurity pneumocandino
A represents the addition of a methyl group at the 4 position on the hydroxyproline functional group in the polar hexapeptide core.o
Pneumocandin C is a positional isomer of the product representing a shift in the hydroxyl group from the 3 position (pneumocandin B ) too o
the 4 position (pneumocandin C ) of the same hydroxyproline group. For more details on pneumocandin B structure and details, see [1–6].o o
*Reference: Schwartz et al. US Pat. 5202309 and 5194377 (1993).
making preparative chromatography an attractive Although RP-HPLC has been successfully used foralternative. the isolation of many other small- and intermediate-
Once preparative chromatography has been iden- molecular-mass compounds at high yield and purity,tified as the purification strategy, several parameters it is clearly not the optimal choice for the isolation ofremain to be determined including; (a) the type of pneumocandin B .o
chromatography (reversed-phase or RP-HPLC, nor-mal-phase, ion-exchange), (b) the mode of chroma- 3.2. Choice of mobile phase composition: ternarytography (HPLC vs. low pressure liquid chromatog- versus binaryraphy), (c) the type and size of sorbent (spherical orirregular) and (d) the mobile phase composition. The key goal of mobile phase selection andOnce these parameters have been defined, practical optimization is to maximize the overall productivityissues pertaining to productivity optimization can be of the step. Typical normal-phase separations arepursued. performed with bare silica, either spherical or irregu-
The type of sorbent for the isolation of pneumo- lar, employing a binary mobile phase composed of acandin B is dictated by the resolution of the many weakly polar solvent combined with an alcohol (e.g.o
analogue impurities, including pneumocandin A and EtOAc and MeOH). However, due to the uniqueo
pneumocandin C . Silica-gel chromatography ex- solubility and retentive properties of pneumocandins,o
ploits the subtle variations in the hydroxyl rich a ternary mobile phase consisting of EtOAc, MeOHhexapeptide core among the analogues. Silica-gel and water is required for the chromatography [1].chromatography is the only method that allows for Control of product retention and resolution ofthe resolution of pneumocandin C from the product impurities is obtained by varying the ratio of theseo
of interest. The presence of pneumocandin C at three components in the mobile phase. The resultso
significant concentrations (up to 10% relative to from sensitivity and optimization studies revealedpneumocandin B ) in the feed to the isolation step that product retention and resolution are strongo
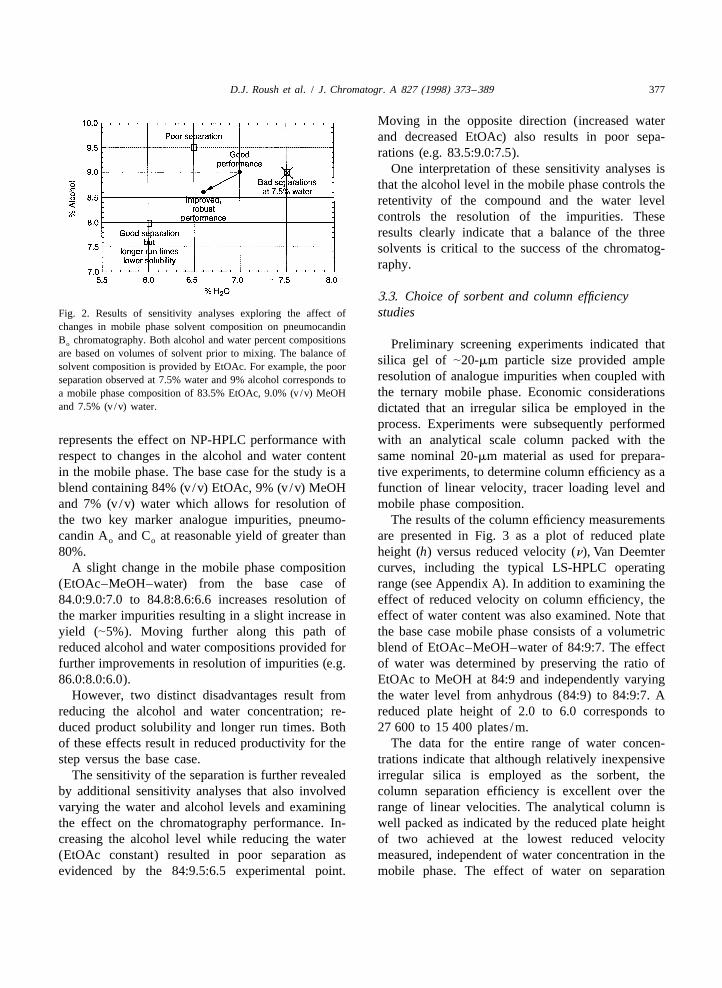
dictates the choice of NP-HPLC over RP-HPLC. functions of the mobile phase composition. Fig. 2
D.J. Roush et al. / J. Chromatogr. A 827 (1998) 373 –389 377
Moving in the opposite direction (increased waterand decreased EtOAc) also results in poor sepa-rations (e.g. 83.5:9.0:7.5).
One interpretation of these sensitivity analyses isthat the alcohol level in the mobile phase controls theretentivity of the compound and the water levelcontrols the resolution of the impurities. Theseresults clearly indicate that a balance of the threesolvents is critical to the success of the chromatog-raphy.
3.3. Choice of sorbent and column efficiencystudiesFig. 2. Results of sensitivity analyses exploring the affect of
changes in mobile phase solvent composition on pneumocandinB chromatography. Both alcohol and water percent compositionso Preliminary screening experiments indicated thatare based on volumes of solvent prior to mixing. The balance of
silica gel of |20-mm particle size provided amplesolvent composition is provided by EtOAc. For example, the poorresolution of analogue impurities when coupled withseparation observed at 7.5% water and 9% alcohol corresponds tothe ternary mobile phase. Economic considerationsa mobile phase composition of 83.5% EtOAc, 9.0% (v/v) MeOH
and 7.5% (v/v) water. dictated that an irregular silica be employed in theprocess. Experiments were subsequently performed
represents the effect on NP-HPLC performance with with an analytical scale column packed with therespect to changes in the alcohol and water content same nominal 20-mm material as used for prepara-in the mobile phase. The base case for the study is a tive experiments, to determine column efficiency as ablend containing 84% (v/v) EtOAc, 9% (v/v) MeOH function of linear velocity, tracer loading level andand 7% (v/v) water which allows for resolution of mobile phase composition.the two key marker analogue impurities, pneumo- The results of the column efficiency measurementscandin A and C at reasonable yield of greater than are presented in Fig. 3 as a plot of reduced plateo o
80%. height (h) versus reduced velocity (n), Van DeemterA slight change in the mobile phase composition curves, including the typical LS-HPLC operating
(EtOAc–MeOH–water) from the base case of range (see Appendix A). In addition to examining the84.0:9.0:7.0 to 84.8:8.6:6.6 increases resolution of effect of reduced velocity on column efficiency, thethe marker impurities resulting in a slight increase in effect of water content was also examined. Note thatyield (|5%). Moving further along this path of the base case mobile phase consists of a volumetricreduced alcohol and water compositions provided for blend of EtOAc–MeOH–water of 84:9:7. The effectfurther improvements in resolution of impurities (e.g. of water was determined by preserving the ratio of86.0:8.0:6.0). EtOAc to MeOH at 84:9 and independently varying
However, two distinct disadvantages result from the water level from anhydrous (84:9) to 84:9:7. Areducing the alcohol and water concentration; re- reduced plate height of 2.0 to 6.0 corresponds toduced product solubility and longer run times. Both 27 600 to 15 400 plates /m.of these effects result in reduced productivity for the The data for the entire range of water concen-step versus the base case. trations indicate that although relatively inexpensive
The sensitivity of the separation is further revealed irregular silica is employed as the sorbent, theby additional sensitivity analyses that also involved column separation efficiency is excellent over thevarying the water and alcohol levels and examining range of linear velocities. The analytical column isthe effect on the chromatography performance. In- well packed as indicated by the reduced plate heightcreasing the alcohol level while reducing the water of two achieved at the lowest reduced velocity(EtOAc constant) resulted in poor separation as measured, independent of water concentration in theevidenced by the 84:9.5:6.5 experimental point. mobile phase. The effect of water on separation

378 D.J. Roush et al. / J. Chromatogr. A 827 (1998) 373 –389
Fig. 3. Reduced plate height (h) versus reduced velocity (n) over a range of mobile phase compositions from anhydrous, (84:9)(EtoAc–MeOH) to the base case composition of 84:9:7 (EtoAc–MeOH–water). All column efficiency measurements were performed usingan analytical scale column of nominal dimensions 25034.6 mm. Reduced velocity range typically employed in operating the large scaleHPLC (LS-HPLC) for this process is also illustrated on the plot.
efficiency appears to be almost insignificant over the performing the parametric examination of: (a) thetypical LS-HPLC operating range corresponding to effect of product loading and separation efficiency onreduced velocities in the range of 6 to 16 (equivalent yield, (b) productivity as a function of eluent flow-to flow-rates of 1000 to 2400 ml /min in the 15-cm rate and (c) scaleup from 6 to 15 cm.I.D. column). However, the effect of water becomesmore pronounced at higher velocities (e.g. reduced 4.1. Effect of product loading on separationvelocity of 22). Note that these column efficiency efficiency and yielddeterminations were based on tracer retention studiesof a relatively small compound, MEK. However, the Initial experiments to examine the effect of prod-influence of water on the column efficiency for a uct loading and separation efficiency on yield werelarger compound such as pneumocandin B may be performed on a 6-cm semipreparative scale. Theseo
more significant and is currently under investigation. initial experiments were carried out at a fixed mobilephase superficial velocity of 9.3 cm/min (0.16 cm/s)using a 750-ml bed volume. The goal of these initial
4. Case study of process optimization experiments was to determine the column loadingconditions and fraction recovery strategy prior to
Once the key parameters, i.e. sorbent and mobile scaleup to the 15-cm preparative system.phase composition were defined (Section 3.3) op- The column efficiency for the 6-cm scale wastimization and scaleup experiments commenced. determined to be 10 000 plates /m or 2500 plates /Practical process optimization was performed by column (25-cm length) via tracer solution injection at

D.J. Roush et al. / J. Chromatogr. A 827 (1998) 373 –389 379
0.5 column volume percent loading. For ease of the concentration of product in the feed was in-experimentation, the linear velocity was fixed at 9.3 creased from 11.7 to 29.9 g/ l to affect the highercm/min which corresponds to a reduced velocity of column loading.4.9 and the mobile phase composition was held The results of the experiment (Fig. 4a) at 1.2 g / lconstant at the base case of 84:9:7. The typical bed loading indicate that pneumocandin A is essen-o
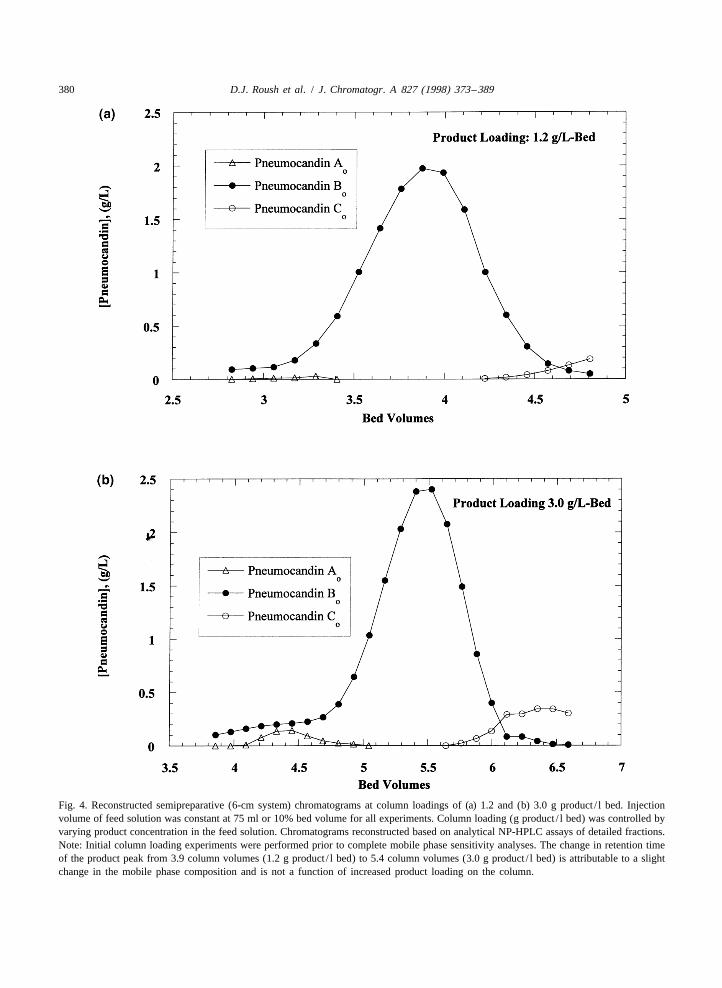
feedstock analogue profile, target concentration in tially completely resolved from the product peakthe rich cut and purification factor required for the with the maximum concentration of the analoguepreparative HPLC step are presented in Table 1. impurity at less than 100 mg/ l in the front shoulderAlthough more than ten other analogue impurities of the product peak. Resolution of pneumocandin Co
are present in the feed and removed during the from the product is also excellent with concen-preparative HPLC separation for reasons of brevity trations of this analogue in the tail of the productonly three marker analogue impurities are presented peak comparable to pneumocandin A in the front ofo
in Table 1, pneumocandins A , C and D . Pneumo- the peak. Increasing the product loading to 3.0 g/ lo o o
candin D is analogous to pneumocandin B with an bed (Fig. 4b) results in the melding of pneumocandino o
additional hydroxyl group located at the 4 position of A peak into a front shoulder of the product peak.o
the hydroxyproline functional group in place of the Resolution of the other marker analogue, pneumo-hydrogen present in pneumocandin B . Although candin C , is also significantly diminished witho o
pneumocandin D is present in significant concen- concentrations as high as 250 mg/ l in the finalo
tration in the feed to the preparative HPLC step, it is fractions of the main peak. Note that the analoguereadily resolved to the target level of 0.1% in the impurity concentration in the tail corresponds toproduct rich cut fraction. |10% of the maximum concentration of the product
Clearly from the information presented in Table 1, in the main peak.the targets for this purification step are typical for a Fractions were selected to achieve a rich cut poolpreparative HPLC process. To ensure the success of meeting target purity specifications shown in Tablethe scaleup, initial experiments involved collection 1. The fraction collection range and associated yieldof detailed fractions that were analyzed by analytical for the two loading experiments is presented in Fig.HPLC to determine the analogue impurity profiles. 5. The data clearly indicate that increasing theThe analogue profiles in the preparative HPLC loading of the product on the column to 3.0 g/ lchromatograms were then reconstructed based on results in only a modest decrease in yield (|4%) andthese analytical results. The detailed fraction in- a more concentrated product rich cut. Judiciousformation allowed for an accurate determination of fraction collection allows for this high yield of 93%the yield associated with the desired purification while still maintaining the target purification factorsfactors. The results of product loading experiments, of 2 and 7 for pneumocandin A and C , respective-o o
at 1.2 and 3.0 g product / l bed, are presented in Fig. ly. However, shifting the collection point for the4a and b, respectively. Note that the injection volume fractions by only a slight degree results in a signifi-was fixed at 10 column volume percent (75 ml) and cant increase in the concentration of either of these
Table 1Purification targets for analogue impurities
Compound Feed concentration Target concentration Purification factor(%) (%) required
Pneumocandin A 1.5 ,1 ,2o
Pneumocandin C 12.4 2 7o
Pneumocandin D 7.5 0.1 75o
Analogue impurity profile / target concentration in the rich cut and purification factor required for a typical feed to the HPLC step. Note thatpneumocandin D represents an analogue of pneumocandin B with an additional hydroxyl group at the 4 position on the hydroxyprolineo o
functional group of the molecule. Although pneumocandin D is present at a relatively large concentrations in the feed it elutes significantlyo
after the product and does not appear in any of the assayed fractions from the preparative HPLC experiments.
380 D.J. Roush et al. / J. Chromatogr. A 827 (1998) 373 –389
Fig. 4. Reconstructed semipreparative (6-cm system) chromatograms at column loadings of (a) 1.2 and (b) 3.0 g product / l bed. Injectionvolume of feed solution was constant at 75 ml or 10% bed volume for all experiments. Column loading (g product / l bed) was controlled byvarying product concentration in the feed solution. Chromatograms reconstructed based on analytical NP-HPLC assays of detailed fractions.Note: Initial column loading experiments were performed prior to complete mobile phase sensitivity analyses. The change in retention timeof the product peak from 3.9 column volumes (1.2 g product / l bed) to 5.4 column volumes (3.0 g product / l bed) is attributable to a slightchange in the mobile phase composition and is not a function of increased product loading on the column.

D.J. Roush et al. / J. Chromatogr. A 827 (1998) 373 –389 381
Fig. 5. Analogue impurity profiles from semipreparative experiments indicating fraction selection and yield as a function of column loading.Adjusted yields of 97% and 93% were obtained at the two column loadings at column loadings of (a) 1.2 and (b) 3.0 g product / l bed,respectively.

382 D.J. Roush et al. / J. Chromatogr. A 827 (1998) 373 –389
two analogue impurities. Although additional optimi- 4.3. Tradeoff between yield and productivityzation could increase the robustness of the process,owing to project time constraints the promising One practical issue associated with the develop-results of the 6-cm semipreparative were employed ment of a manufacturing scale process, includingas a template for scaling to the 15-cm preparative preparative HPLC, is productivity. Often the focus ofsystem. laboratory development activities is the step yield
with only modest regard given to the influence ofcycle time or productivity. Although some comment
4.2. Scaleup from 6-cm (semipreparative) to 15- has been made in the literature on the importance ofcm (preparative) optimizing the combination of productivity and yield
[16], this case study underscores the importance ofA linear scaleup was performed from the parame- these practical considerations.
ters employed for the 6-cm scale experiment to the The results of experiments to determine the po-15-cm preparative HPLC system. The product load- tential effect of eluent flow-rate on yield and prod-ing, linear velocity and column length were all held uctivity are presented in Table 3. Tracer experimentsconstant for the scaleup. Fractions were collected for were performed on the 15-cm column (76-cm length)the initial 15-cm scale experiment in the same using injections of 2.0 column volume percent. Notemanner as the 6-cm scale experiments and assayed that a separate set of experiments indicated a linearby analytical scale NP-HPLC. A comparison of the relationship between the column volume loading ofreconstructed chromatograms from the two systems tracer solution to plate count (see Appendix B foris presented in Fig. 6. Resolution of the two marker details). For consistency with other data presentedanalogues, pneumocandin A and C , are equivalent herein, the plate count data obtained for the 15-cmo o
in the two systems. Only slight differences exist column at tracer injection amounts of 2.0 columnbetween the two scales including a subtle difference volume percent have been normalized to a standardin peak maxima for the main product peak. tracer injection of 0.5 column volume percent for
Following successful scaleup of the initial HPLC presentation in Table 3.process to the 15-cm scale, additional optimization / For comparison, the productivity which would besensitivity experiments were performed to ensure achieved at the very low flow-rate of 500 ml /min (nprocess robustness. Recall that the experimental of 3.3) was calculated assuming a yield of 100%.results from the 6-cm scale (25-cm column length) Even if such a high yield could be achieved byindicated that the analogue impurity profile in the operating at this low flow-rate, overall productivityproduct rich cut was quite sensitive to the fraction would be quite low at 7.7 g product /h. The standardselection strategy. A slight shift in the position of the operating case for the experiment was the lowestfraction selection on either side of the product peak eluent flow-rate of 1000 ml /min at which 10 375would result in unacceptably high levels of analogue plates were present in the column and a reasonableimpurity in the product cut. This observation implies yield of 85% was obtained with a productivity ofthat the 25-cm length column provided only the 13.1 g product /h.minimum number of theoretical plates to affect the One way to increase productivity is to increaseresolution of the analogues. Therefore, in the final flow-rate, if this can be done without changing yield.scaleup experiments the column length was increased Increasing the flow-rate clearly increases productivi-|3-fold to afford better analogue resolution, reduce ty for a fixed yield via reducing cycle time; for athe sensitivity of the product cut to fraction selection, fixed yield via reducing cycle time. Indeed for thisand increase the yield for the step. In addition, the process increasing the eluent flow-rate from 1000 tofeed volume and linear velocity were increased to 2100 ml /min results in a only modest decrease in thehelp offset the decrease in productivity associated column efficiency (32%) and product yield (3%) butwith the increased column length. The final scaleup a strong decrease in cycle time (56%); the largeconditions are presented in Table 2. reduction in cycle time offsets the loss of product to

D.J. Roush et al. / J. Chromatogr. A 827 (1998) 373 –389 383
Fig. 6. Comparison of reconstructed chromatograms indicating the excellent agreement obtained on the 6-cm (semipreparative, 750-mlcolumn volume) and 15-cm I.D. (preparative, 6.2-l column volume) scale chromatographies at a fixed column loading of 3.0 g product / lbed.

384 D.J. Roush et al. / J. Chromatogr. A 827 (1998) 373 –389
Table 2Scaleup of the preparative normal-phase HPLC — final scaleup parameters
Parameter Semipreparative Preparative(6-cm I.D.) (15-cm I.D.)
Column length (cm) 25 76Column volume (L) 0.7 13.4Linear velocity (cm/min) 9.3 10.2Feed volume (% column volume) 10 13Feed concentration (g product / l) |30 |30Column loading (g product / l bed) 3.0 3.0Product load (g) 2.12 40.2
Summary listing of the final scaleup parameters following completion of optimisation studies. Key parameter changes include increasedcolumn length (76 vs. 25 cm) and increased linear velocity (10.2 vs. 9.3 cm/min).
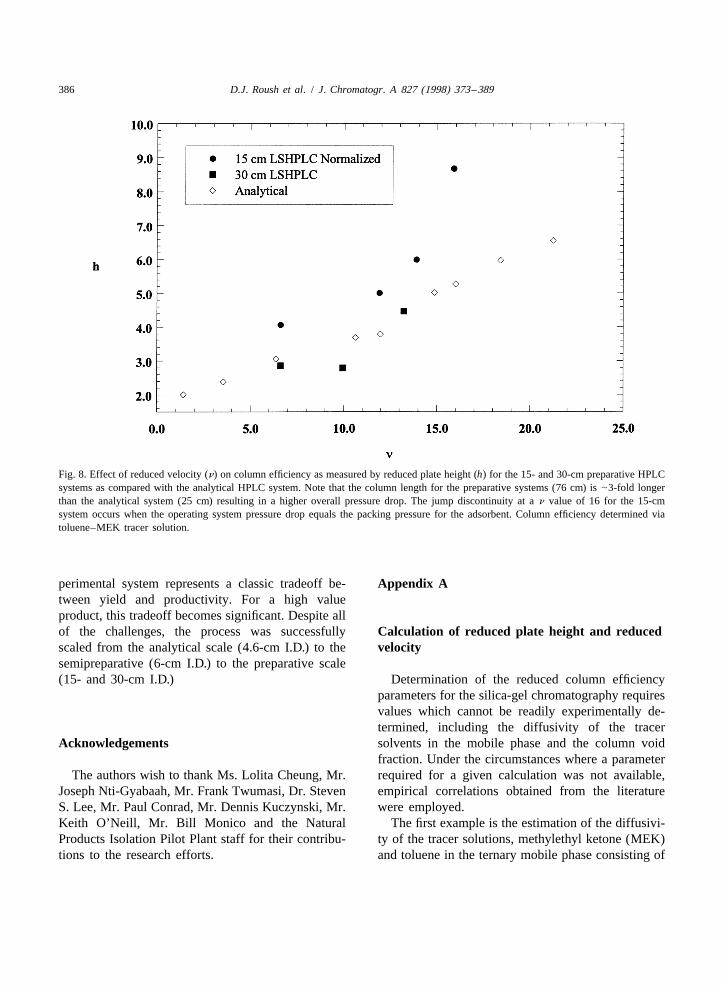
the reduced yield ultimately resulting in improved performed on the preparative scale to those on theproductivity. Productivity for the 15-cm LS-HPLC analytical scale (as shown in Fig. 8).reaches a maximum at an eluent flow-rate of 2100 At the highest reduced velocity measured for theml /min at 28.7 g product /h. 15-cm column, n equal to 16, a significant difference
The breakpoint is actually reached at 2400 ml /min exists between the analytical and preparative data.eluent flow-rate where a precipitous drop is observed The main difference between the analytical andin column efficiency as well as yield; product yield preparative scale systems is the column length, 25falls by 15% while cycle time decreases by 15%. cm for the analytical scale and 76 cm for theThese results indicate a classic tradeoff between preparative scale. This difference in column lengthproductivity and yield as presented in Fig. 7. The results in significant differences in the operatingoptimal productivity for the process occurs at the pressures for the two systems at elevated eluentintermediate eluent flow-rate of 2100 ml /min. Under flow-rates. The 15-cm I.D. system operating at athese conditions, the only means of increasing prod- reduced velocity of 16, corresponding to an eluentuctivity for this process is to increase the scale of the flow-rate of 2400 ml /min, has an associated pressureequipment. drop of |4.5 MPa across the column. This pressure
The issue as to why such a marked breakpoint was drop is essentially equivalent to the packing pressureobserved in the column efficiency and productivity at of the column and at the limit of the sustainable2400 ml /min flow-rate. The effect is also observed if pressure for the irregular silica. In an axial compres-one compares the column efficiency measurements sion system, when elution pressure exceeds the
Table 3LS-HPLC productivity evaluation
aEluant flow-rate N Product cycle time Yield Productivity(ml /min) (plates per column) (min) (%) (g product /h)
b b500 N/A 312 100 7.71000 10 375 156 85 13.11800 8440 87 80 22.02100 7040 69 82 28.72400 4870 60 67 26.8
Experimental parameters included the use of a 15-cm I.D. preparative scale column packed with a 13.5 l bed with a product loading of 3.0g/ l bed volume. The effect of eluent flow-rate (linear velocity) on column efficiency (as demonstrated by tracer tests), yield and productivityare presented. Data presented for the column efficiency measurements are normalised to a tracer loading level of 0.5 column volume percent.a Theoretical plates determined via tracer solution of MEK and toluene; normalised to injection volume.b Assume maximum yield of 100% for 500 ml /min eluent flow-rate.

D.J. Roush et al. / J. Chromatogr. A 827 (1998) 373 –389 385
Fig. 7. Tradeoff between productivity and yield as a function of eluent flow-rate at the preparative scale (15-cm I.D. LS-HPLC). Note thatfor this preparative separation the optimum flow-rate for operation is 2100 ml /min.
packing pressure, the column piston can ‘‘float’’, ment for an intermediate-molecular-mass am-causing loss of performance. Thus, the practical limit phiphilic compound. Resolution of a key isomericto the productivity of the system is the fragile nature analogue, pneumocandin C from the product ofo
of the irregular silica. This limitation is not revealed interest, pneumocandin B , required the use ofo
at the analytical scale due to the shorter column normal-phase HPLC to exploit the subtle change inlength. position of a hydroxl group. Initial efforts helped to
Additional data are presented in Fig. 8 from a define the necessity of the use of a ternary mobile30-cm I.D. system packed with the same media, phase in order to afford product solubility andcolumn length and mobile phase composition as the selectivity. Subsequent optimization /sensitivity15-cm column. The only difference between the two studies clearly demonstrated that a balance in thepreparative systems, 15- and 30-cm I.D. is the scale. composition of the ternary mobile phase was re-As shown in the figure, data points for the 30-cm quired in order to control the product solubility,column lie on or about the same line as for the retention and resolution of key analogues. Additional15-cm column and analytical scale data, indicating experimental results confirmed that these three vari-that performance is independent of scale for dynamic ables were a strong function of the composition ofaxially compressed columns. the mobile phase.
Practical issues relating to scaleup and optimi-zation provided the framework for the remainder of
5. Conclusions the case study. For this experimental system, yield isa strong function of column loading and linear
This research provides a case study of the chal- velocity. In addition, productivity is dictated bylenges associated with preparative HPLC develop- loading and linear velocity. Therefore, this ex-
386 D.J. Roush et al. / J. Chromatogr. A 827 (1998) 373 –389
Fig. 8. Effect of reduced velocity (n) on column efficiency as measured by reduced plate height (h) for the 15- and 30-cm preparative HPLCsystems as compared with the analytical HPLC system. Note that the column length for the preparative systems (76 cm) is |3-fold longerthan the analytical system (25 cm) resulting in a higher overall pressure drop. The jump discontinuity at a n value of 16 for the 15-cmsystem occurs when the operating system pressure drop equals the packing pressure for the adsorbent. Column efficiency determined viatoluene–MEK tracer solution.
perimental system represents a classic tradeoff be- Appendix Atween yield and productivity. For a high valueproduct, this tradeoff becomes significant. Despite allof the challenges, the process was successfully Calculation of reduced plate height and reducedscaled from the analytical scale (4.6-cm I.D.) to the velocitysemipreparative (6-cm I.D.) to the preparative scale(15- and 30-cm I.D.) Determination of the reduced column efficiency
parameters for the silica-gel chromatography requiresvalues which cannot be readily experimentally de-termined, including the diffusivity of the tracer
Acknowledgements solvents in the mobile phase and the column voidfraction. Under the circumstances where a parameter
The authors wish to thank Ms. Lolita Cheung, Mr. required for a given calculation was not available,Joseph Nti-Gyabaah, Mr. Frank Twumasi, Dr. Steven empirical correlations obtained from the literatureS. Lee, Mr. Paul Conrad, Mr. Dennis Kuczynski, Mr. were employed.Keith O’Neill, Mr. Bill Monico and the Natural The first example is the estimation of the diffusivi-Products Isolation Pilot Plant staff for their contribu- ty of the tracer solutions, methylethyl ketone (MEK)tions to the research efforts. and toluene in the ternary mobile phase consisting of

D.J. Roush et al. / J. Chromatogr. A 827 (1998) 373 –389 387
ethyl acetate, methanol and water. An estimate of where u is the superficial velocity (cm/s) of the2diffusion coefficient (cm /s) for small concentrations mobile phase, d is the average particle size, and Dp AB
of compound A in a solution of B can be derived is the diffusion coefficient for MEK or toluene.from the Wilke–Chang equation [26–28] as de- Based on data provided by the manufacturer, a dp
23scribed in Eq. (1). value of 18 mm or 1.8?10 cm was employed forthe nominal 20-mm material. A void fraction of 0.75
28 0.57.4 ? 10 (c M ) T was employed for the silica media. Note that theB B]]]]]]D 5 (1)AB 0.6 flow-rate corresponding to the LS-HPLC reducedmV A
velocities indicated in Fig. 3 are 1000 to 2400in which c is an association parameter for the ml /min in the 15-cm I.D. system.B
solvent B, M is the molar mass for solvent B, T is The number of plates for both analytical andB
the absolute temperature in degrees Kelvin, m is the preparative columns was calculated based on theviscosity of the solution in centipoise, V is the molar results of tracer injections according to a standardA
3 21volume of the solute A in cm g mol as liquid at half-height measurement per Eq. (4).its normal boiling point. Data for molar volumes of 2N 5 5.54(t /w ) (4)R 1 / 2toluene and MEK, and viscosities of ethyl acetate,methanol and water were obtained from the literature where t is the retention time of the tracer species (s)R[29]. The experimental conditions employed a tem- and w is the width of the tracer peak at half1 / 2perature of 258C or 298 K. The molecular mass height. The plate height, H, was then calculated byemployed for the ternary mobile phase, M , is theB dividing the column length, L, by the number ofaverage of the three solvents in the mobile phase plates, N, determined according to Eq. (4). Thenormalized to the volume contributions of the sol- reduced plate height, h, was subsequently determinedvents as described in Eq. (2). according to Eq. (5).
M 5 M v 1 M v 1 M v (2) h 5 H /d (5)B 1 1 2 2 3 3 p] ] ]
where M , M , M and v , v , v are the molecular1 2 3 1 2 3] ] ]masses and volume fractions of ethyl acetate, metha- Appendix Bnol and water, respectively. The volume fractions ofEtOAc, MeOH and water employed were the basecase of 0.84, 0.09 and 0.07, respectively. The
Effect of volume loading on column plate countviscosity of the ternary mobile phase was determinedin a weighted linear combination of the volume
Experiments were performed on an analyticalfractions of the three solvents employing literaturescale column (25034.6 mm) at 258C and mobilevalues [29]. A value for c , the association parame-B phase composition of 84:9:7 to determine the po-ter, was determined as a weighted linear combinationtential affect of varying the loading of tracer solutionof the volume fractions of the three solvents employ-(Section 2.1) on the measured column efficiency.ing values [26] of 1.5 for EtOAc, 1.9 for MeOH andExperiments examined a range of tracer column2.6 for water. Application of these parameters to Eq.volume loading from 0.5 to 2.0 column volume25(1) yields diffusion coefficients of 3.17?10 andpercent, which translates to injection amounts rang-25 23.40?10 cm /s for toluene and MEK, respectively,ing from 10 to 80 ml. The potential affect of tracerin the ternary mobile phase solution.loading was also evaluated over the same range ofOnce the values of the diffusion coefficients forreduced velocity, 1.4 to 21.2, as examined in thetoluene and MEK were obtained, the reduced ve-previous experiments.locity, n, could be calculated from the experimental
The results of the tracer loading experiments anddata according to Eq. (3).the least squares linear regression analyses of the
n 5 ud /D (3) data are presented in Fig. 9. The analyses of thep AB

388 D.J. Roush et al. / J. Chromatogr. A 827 (1998) 373 –389
Fig. 9. Tracer loading experiments indicating reduced plate height as a function tracer column loading percent and reduced velocity. Leastsquares linear regression analyses are also indicated. See Appendix B for details.
experimental results clearly indicate a linear relation- Referencesship between reduced plate height and tracer loadinglevel at each reduced velocity examined. These [1] R.E. Schwartz, D.F. Sesin, H. Joshua, K.E. Wilson, A.J.
Kempf, K.E. Goklen, D. Kuehner, P. Gailliot, C. Gleason, R.results translate into an inverse linear relationshipWhite, E. Inamine, G. Bills, P. Salmon, L. Zitano, J.between plate number and tracer loading levels. NoteAntibiotics 45 (1992) 1853.
that due to system limitations, the tracer experiments [2] O.D. Hensens, J.M. Liesch, D.L. Zink, J.L. Smith, C.F.were performed on the 15-cm system at loading Wichman, R.E. Schwartz, J. Antibiotics 45 (1992) 1875.levels of 2.0 column volume percent. The linear [3] A. Adeferati, O. Hensens, E.T.T. Jones, J. Tkacz, J. Anti-
biotics 45 (1992) 1953.relationship (for each reduced velocity) between[4] R. Schwartz, P. Masurekar, R. White in: J. Rippon, R.reduced plate height and tracer loading was then
Fromtling (Editors), Cutaneous Antifungal Agents, Marcelemployed to calculate the normalized reduced plate Dekker, New York, 1993, Ch. 27.height for the 15-cm system equivalent to a 0.5 [5] R.E. Schwartz, J.M. Liesch, R.F. White, O.D. Hensens, H.column volume percent loading. Joshua, D.M. Schmatz, US Pat. 5202309 (1993).

D.J. Roush et al. / J. Chromatogr. A 827 (1998) 373 –389 389
[6] R.E. Schwartz, R.F. White, US Pat. 5194377 (1993). [18] J.H. Kennedy, Org. Proc. Res. Dev. 1 (1997) 68.[7] A.E. Osawa, R. Sitrin, S.S. Lee, J. Chromatogr., submitted [19] H. Colin, P. Hilaireau, J. de Tournemire, LC?GC 8 (1990)
for publication. 302.[8] K.K. Unger, Porous Silica, Elsevier, Amsterdam, 1979. [20] E.P. Kroeff, R.A. Owens, E.L. Campbell, R.D. Johnson, H.I.[9] M.P. Henry, J. Chromatogr. 544 (1991) 413. Marks, J. Chromatogr. 461 (1989) 45.
[10] S.H. Hansen, P. Helboe, M. Thomsen, J. Chromatogr. 544 [21] H. Colin, Sep. Sci. Technol. 22 (1987) 1851–1856.(1991) 53. [22] E. Godbille, P. Devaux, J. Chromatogr. Sci. 12 (1974) 564.
[11] D.J. Andersen, Anal. Chem. 67 (1995) 475R. [23] M. Sarker, G. Guichon, J. Chromatogr. A 702 (1995) 27.[12] P. Jandera, J. Churracek, J. Chromatogr. 91 (1974) 207. [24] M. Sarker, G. Guichon, J. Chromatogr. A 705 (1995) 227.[13] J. Nawrocki, J. Chromatogr. A 779 (1997) 29. [25] B. Stanley, M. Sarker, G. Guichon, J. Chromatogr. A 741[14] P. Jandera, L. Petranek, M. Kucerova, J. Chromatogr. A 791 (1996) 175.
(1997) 1. [26] R. Bird, W. Stewart, E. Lightfoot, Transport Phenomena,[15] C.A. Fung Kee Fung, M. Burke, J. Chromatogr. A 752 Wiley, New York, 1960.
(1996) 41. [27] C.R. Wilke, Chem. Eng. Prog. 45 (1949) 218.[16] A. Felinger, G. Guichon, J. Chromatogr. A 752 (1996) 31. [28] C.R. Wilke, P. Chang, AIChE J. 1 (1955) 264.[17] C. Heuer, P. Hugo, G. Mann, A. Seidel-Morgenstern, J. [29] Handbook of Chemistry and Physics, CRC Press, 63rd
Chromatogr. A 752 (1996) 19. Edition, 1982.