preparation of dye sensitized solar cells with high ...preparation of dye sensitized solar cells...
TRANSCRIPT
Nano Res
1
Preparation of Dye Sensitized Solar Cells with high
photocurrent and photovoltage by using mesoporous
TiO2 particles as photoanode material
Yi Zhang1,2
, Bao Zhang1,†
(), Xiao Peng1, Lin Liu
1, Shuo Dong
1, Liping Lin
1, Si Chen
1, Shuxian Meng
1,
and Yaqing Feng1,2,†
()
Nano Res., Just Accepted Manuscript • DOI 10.1007/s12274-015-0883-y
http://www.thenanoresearch.com on August 20, 2015
© Tsinghua University Press 2015
Just Accepted
This is a “Just Accepted” manuscript, which has been examined by the peer-review process and has been
accepted for publication. A “Just Accepted” manuscript is published online shortly after its acceptance,
which is prior to technical editing and formatting and author proofing. Tsinghua University Press (TUP)
provides “Just Accepted” as an optional and free service which allows authors to make their results available
to the research community as soon as possible after acceptance. After a manuscript has been technically
edited and formatted, it will be removed from the “Just Accepted” Web site and published as an ASAP
article. Please note that technical editing may introduce minor changes to the manuscript text and/or
graphics which may affect the content, and all legal disclaimers that apply to the journal pertain. In no event
shall TUP be held responsible for errors or consequences arising from the use of any information contained
in these “Just Accepted” manuscripts. To cite this manuscript please use its Digital Object Identifier (DOI®),
which is identical for all formats of publication.
Nano Research
DOI 10.1007/s12274-015-0883-y
Template for Preparation of Manuscripts for Nano Research
This template is to be used for preparing manuscripts for submission to Nano Research. Use of this template will
save time in the review and production processes and will expedite publication. However, use of the template
is not a requirement of submission. Do not modify the template in any way (delete spaces, modify font size/line
height, etc.). If you need more detailed information about the preparation and submission of a manuscript to
Nano Research, please see the latest version of the Instructions for Authors at http://www.thenanoresearch.com/.
TABLE OF CONTENTS (TOC)
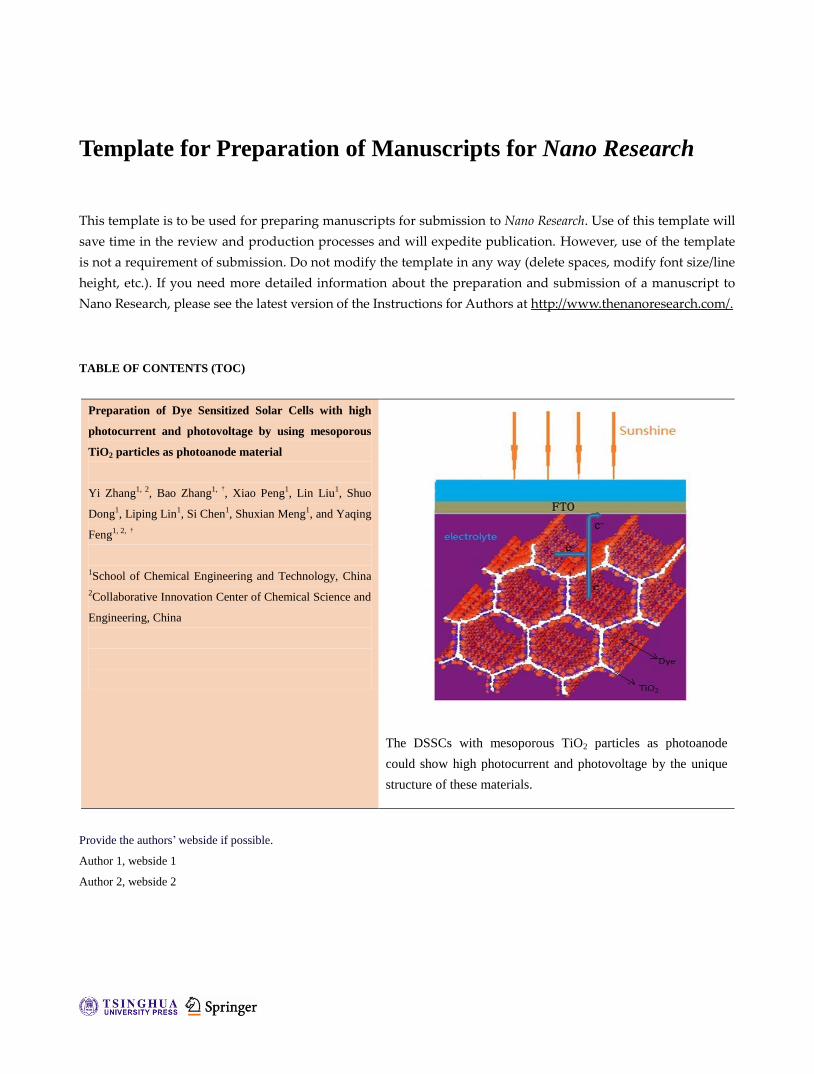
Preparation of Dye Sensitized Solar Cells with high
photocurrent and photovoltage by using mesoporous
TiO2 particles as photoanode material
Yi Zhang1, 2, Bao Zhang1, †, Xiao Peng1, Lin Liu1, Shuo
Dong1, Liping Lin1, Si Chen1, Shuxian Meng1, and Yaqing
Feng1, 2, †
1School of Chemical Engineering and Technology, China
2Collaborative Innovation Center of Chemical Science and
Engineering, China
The DSSCs with mesoporous TiO2 particles as photoanode
could show high photocurrent and photovoltage by the unique
structure of these materials.
Provide the authors’ webside if possible.
Author 1, webside 1
Author 2, webside 2
Preparation of Dye Sensitized Solar Cells with high
photocurrent and photovoltage by using mesoporous
TiO2 particles as photoanode material
Yi Zhang1, 2
, Bao Zhang1, †
(), Xiao Peng1, Lin Liu
1, Shuo Dong
1, Liping Lin
1, Si Chen
1, Shuxian Meng
1,
and Yaqing Feng1, 2,†
()
Received: day month year
Revised: day month year
Accepted: day month year
(automatically inserted by
the publisher)
© Tsinghua University Press
and Springer-Verlag Berlin
Heidelberg 2014
KEYWORDS
Dye Sensitized Solar
Cells, Mesoporous TiO2,
high photocurrent and
photovoltage.
ABSTRACT
Several mesoporous TiO2 (MT) materials were synthesized under different
conditions following a hydrothermal procedure using Poly(ethylene-glycol)
-block-poly(propylene-glycol)-block-poly(ethylene-glycol) (P123) as template
and titanium isopropoxide as titanium source. The molar ratios of Ti/P123 and
the pH values of reaction solution in autoclave were investigated. Various
techniques such as Brunauer-Emmett-Teller (BET), X-ray diffraction (XRD),
X-ray photoelectron spectroscopy (XPS), laser Raman spectrometry (LRS),
scanning electron microscope (SEM) and high resolution transmission electron
microscopy (HRTEM) were used to characterize the products. Then, these
materials were assembled into dye sensitized solar cells (DSSCs). The analysis
of J-V curves and electrochemical impedance spectroscopy (EIS) were applied to
characterize the cells. The result indicated the specific surface area and
crystalline structure of materials provided the possibility of high photocurrent
for cells, and the structural characteristics of specimen led to the increased
electron transfer resistance of cells which was beneficial for the improvement of
the photovoltage of DSSCs. The highest photoelectric conversion efficiency of
the cells involving MT materials reached 8.33% which, compared to that of
P25-based solar cell (5.88%), increased by 41.7%.
1 Introduction
Sunlight is arguably the most abundant clean
source of energy that is capable of enabling
“indefinite” and sustainable economic growth, with
minimum detrimental impact on the environment.
Crystalline silicon solar cells shave been
continuously advancing in efficiency and reducing in
cost of fabrication over the last 40 years [1-2], but in
most places of the world, they are still expensive
compared to the price of electricity generated from
fossil fuels [3]. In order to cut the cost of photovoltaic
energy, there are many other new solar cell
technologies that have attracted considerable
attentions, such as dye-sensitized solar cells (DSSCs).
DSSC represents an attractive alternative with the
advantages of low material costs, simple
| www.editorialmanager.com/nare/default.asp
2 Nano Res.
manufacture process, desired durability and
compatibility with flexible substrates [4-5].
The photoanode material of DSSCs is one of the
key factors affecting the photoelectric conversion
efficiency. Nanoparticles were conventional and most
widely studied for use in DSSCs to form photoanode
film [6-7]. However, due to the restriction of
characteristics itself, the small size of individual
nanoparticles has been regarded as an unfavorable
factor that may increase interfacial charge
recombination occurring between the
photogenerated electrons and the redox species in
electrolyte [8-9]. In order to improve the efficiency of
solar cells, several semiconductor materials with
special morphology were prepared for use in
photoanodes. For example, Chen et al. [9] and
Diamant et al. [10-11] prepared a series of core-shell
nanostructures to decrease the charge recombination
based on hypothesis that a coating layer could build
up an energy barrier at the semiconductor/electrolyte
interface. However, this nanostructure has been
proved to be less effective and lack of consistency
and reproducibility. One-dimensional nanostructures,
such as nanowires [12-13], nanorods [14] and
nanotubes [15-16], were synthesized to solve this
problem based on a consideration that these
materials can provide direct pathways for electron
transport from the site occurring electron injection to
the conducting film of collector electrode. However,
these materials face drawback of insufficient internal
surface area, leading to relatively low conversion
efficiency. The oxide aggregates, so called
three-dimensional nanostructures, are addressed to
be a potentially promising structure since it is
believed that the aggregates may simultaneously
generate light scattering and provide a ‘‘highway’’
for electrolyte diffusion in view of the existence of
pores [17-18]. But the surface area of usual
aggregates was not obviously higher than that of
nanoparticles.
Since 1991, mesoporous materials with high
surface area, large pore size and narrow pore size
distribution have caused the extensive interest of
researchers [19-20]. From the view-points of
adsorption, the mesoporous materials can increase
greatly the adsorption capacity of dye. Hence, DSSCs
assembled using mesoporous TiO2 materials
(denoted as “MT” hereinafter) as photoanode films
should show immense potential to improve
photocurrent and photoelectric conversion efficiency.
And the mesoporous TiO2 could provide extra
channels to transmit light ray besides the stacking
mesoporous of traditional scaffold particle. In our
studies, a series of MT materials were prepared by a
hydrothermal soft-templating method employing
different Ti:P123 molar ratios and pH values. The
properties of these materials were characterized
using XRD, XPS, LRS, BET and HRTEM techniques.
For a comparison, DSSCs with newly prepared MT
materials and with the commercial P25 as
photoanode materials were fabricated via a doctor
coating method. The cells were analysed by J-V
curves and EIS. The photoelectric conversion
efficiencies of these cells were examined and it was
shown that the cell performance could be influenced
by the characteristics of MT materials. The highest
photoelectric conversion efficiency of the cells
involving MT materials reached 8.33%. And the
photovoltaic results were well explained based on
the properties of MT materials.
2 Experimental
2.1. Synthesis of MT materials
The MT materials were synthesized under
various conditions (Table 1), since the synthesis
conditions of materials were closely related with
their morphology [21]. Firstly, to decrease the
hydrolysis rate of titanates, 0.05 mol of titanium
isopropoxide and an equivalent amount of
acetylacetone were transferred into a beaker and
stirred at room temperature (RT). Then, an
appropriate amount of P123 was dissolved with 100
mL of distilled water (DW) and the concentration of
P123 was represented as x wt% in Table 1. After
stirring at 40 oC for 12 h, the treated mixed solution
was added dropwise to the aforementioned water
solution. In the meantime, 1 mol/L of H2SO4 solution
was used to adjust pH with stirring continually for
another 2 h. Finally, the obtained sol was transferred
into a Teflon-lined autoclave and hydrothermal
synthesis was conducted at 90 oC for 12 h. The
products were filtered, washed to neutral and
calcined at 550 oC for 3 h. The obtained samples were
then denoted as “MT-x-pH” hereinafter.
2.2. Fabrication of DSSC
www.theNanoResearch.com∣www.Springer.com/journal/12274 | Nano Research
3 Nano Res.
According to the reported procedure [22-24], the
pastes used for fabricating porous films were
prepared by mixing 1 g TiO2, 0.5 g ethyl cellulose
(EC), 3.5 g terpineol and 25 g ethanol together. After
ball milling for 3 h, the mixture was concentrated
using a rotary evaporator to obtain viscous pastes.
FTO was ultrasonically cleaned with soapsuds,
distilled water and ethanol, respectively, and then
treated with 50 mmol TiCl4 at 70 oC for 0.5 h. A thin
coating was assembled by the pastes on an FTO glass
using a doctor blade method, and the film thickness
of all samples was 12±2 μm. After dried at 80 oC for
30 min, these samples were annealed at 500 oC for 1 h
and then treated with 50 mmol TiCl4 at 70 oC for 30
min. Another heat treatment proceeded at 500 oC for
30 min. After they were cooled to 110 oC, the films
were immersed in an ethanol solution of N719 (3 ×
10−4 M) for 20 h. The final TiO2 film electrodes were
obtained by rinsing these films with anhydrous
ethanol and drying them at 100 oC in oven. The
photoelectrode was assembled with Pt counter
electrode and electrolyte to form a sandwich-type cell.
And the injected electrolyte consisted of 0.6 M DMPII,
0.03 M I2, 0.5 M 4-TBP and 0.1 M GuSCN in
acetonitrile and valeronitrile (the volume ratio of
85/15).
2.3. Characterization of synthesized materials
The nitrogen adsorption isotherms of MT
materials were measured on a home-made N2
adsorption apparatus at 77 K [25-26]. Prior to
analysis, the samples were treated in vacuum at 200 oC for 2 h. The BET surface area, pore volume and
pore size of the samples were calculated by
Barrett-Joyner-Halenda (BJH) method via correlative
isotherms. Wide-angle powder X-ray diffraction
(XRD) investigation was conducted over a
PANalytical X’Pert PRO Diffractometer with Cu Kα
radiation (λ = 0.15406 nm) and Ni filter at settings of
“40 kV, 50 mA”. X-ray photoelectron spectroscopy
(XPS) experiments were carried out on a RBD
upgraded PHI-5000C ESCA system (Perkin Elmer)
with Mg Kα radiation (h =1253.6 eV). The X-ray
anode was run at 250 W and high voltage was kept at
14.0 kV with a detection angle at 54. The whole
spectra (0~1100 (or 1200) eV) and the narrow spectra
of all the elements with high resolution were
recorded using RBD 147 interface (RBD Enterprises,
USA) through the AugerScan 3.21 software. The
effect of surface charging was calibrated via the C 1s
binding energy (BE) (284.6 eV) of contaminant
carbon.
The laser Raman spectroscopy (LRS) study was
performed by single spectrum using a Thermo
Fischer DXR Raman Microscope. We select the
50×objective of the confocal microscope together with
a laser source of 532 nm at 10 mW in mode laser
power at 100%. Ten spectrum signals of 10 s exposure
were averaged to improve the signal to noise ratio.
Spectra were analyzed using the OMNIC for
Dispersive Raman Software. The scanning electron
microscope (SEM) images were performed on a
Hitachi S4800 electron microscopy operated at 15 kV.
The high resolution transmission electron
micrograph (HRTEM) images and selected area
electron diffraction (SAED) analysis were performed
on a Tecnai G2 F20 electron microscopy operated at
200 kV.
Table 1. Specific surface area (SBET), total pore volume (VT) and average pore size (Da) of fresh and calcined samples isotherms.
3 Results and discussion 3.1 BET characterization of MT materials
Synthesis conditions Physical properties of materials
Fresh sample
Calcined sample
MT-x-pH SBET
(m2/g)
VT
(mm3/g)
Da
(nm)
SBET
(m2/g)
VT
(mm3/g)
Da
(nm)
MT-12-0.8
MT-12-1.2
MT-12-1.6
MT-12-2.0
MT-8-1.2
MT-10-1.2
MT-14-1.2
218 242 4.26 121 224 7.40
247 203 3.92 142 266 7.50
209 207 3.96 133 248 7.47
196 131 2.68 123 176 5.73
232 247 3.08 137 219 6.39
217 248 4.59 130 246 7.57
252 211 3.36 125 149 6.44
| www.editorialmanager.com/nare/default.asp
4 Nano Res.
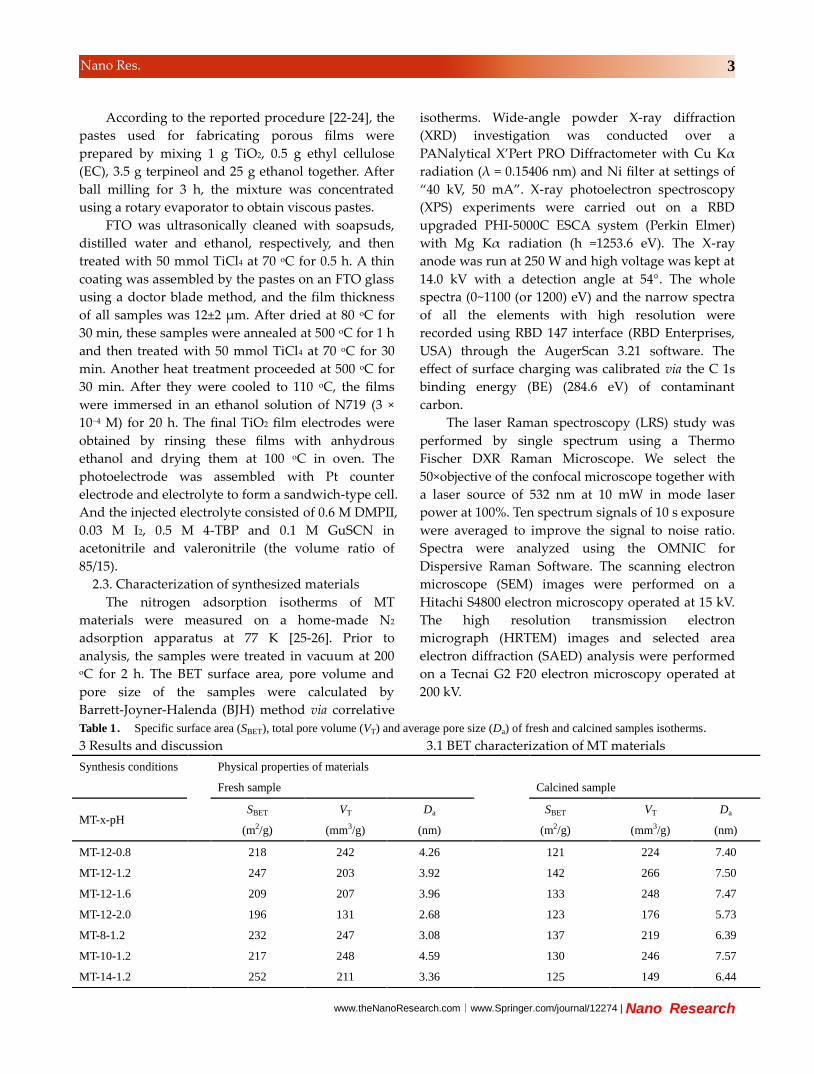
Figure 1 (a) N2 adsorption isotherms and (b) pore
diameter distribution of (A) fresh and (B) calcined MT-12-0.8,
MT-12-1.2, MT-12-1.6, MT-12-2.0, MT-8-1.2, MT-10-1.2 and
MT-14-1.2.
The N2 adsorption isotherms and the
corresponding pore size distributions of fresh MT
materials were shown in Fig. 1A. The isotherms of
samples synthesized at different conditions could be
classified as type-IV isotherm (Fig. 1A), which
indicated that these samples were typical
mesoporous materials. The maximum of the pore
size distribution for MT materials (Fig. 1A(b))
slightly declined with increasing pH and parabolicly
changed with the rise of concentration of P123, the
peak at x = 10. When samples were calcined at 550 oC
for 2 h, the isotherms of samples still maintained as
type-IV (Fig. 2A). And the property difference among
different calcined MT materials was in consonance
with fresh materials, which denoted that these
samples were high-temperature stable. Table 1
summarized physical properties for both fresh and
calcined MT materials prepared at different
conditions. For fresh samples, the values of specific
surface area (SBET) remained more or less at 200 m2/g,
which were about 4 times larger than fresh P25
nanoparticle [27]. All the average pore sizes (Da)
were higher than 2 nm that was the minimum size
for mesoporous materials. As reported by Kresge et
al. [28], when mesoporous materials were calcined,
the SBET of materials decreased as well as the Da
increased evidently. Based on comprehensive
consideration of SBET and Da, it was indicated that the
physical properties of MT-10-1.2, MT-12-1.2 and
MT-12-1.6 were more suitable for support of dye
molecules.
3.2 XRD and LRS analysis of materials
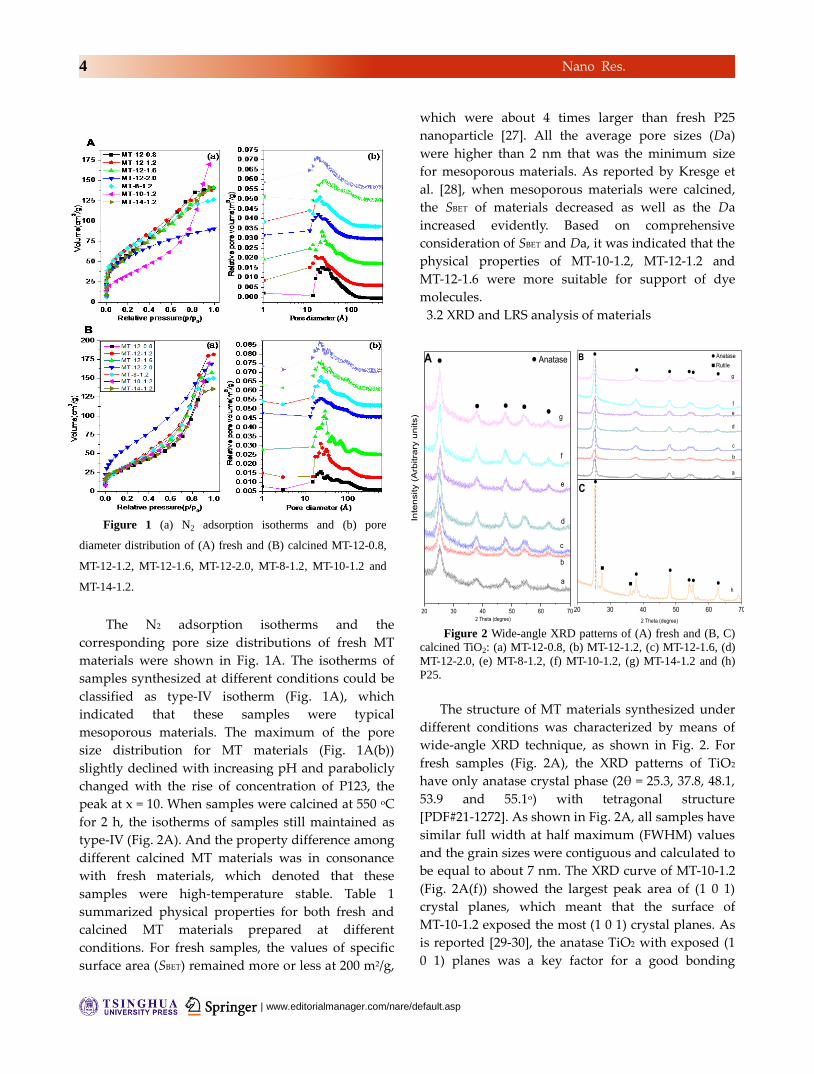
Figure 2 Wide-angle XRD patterns of (A) fresh and (B, C)
calcined TiO2: (a) MT-12-0.8, (b) MT-12-1.2, (c) MT-12-1.6, (d)
MT-12-2.0, (e) MT-8-1.2, (f) MT-10-1.2, (g) MT-14-1.2 and (h)
P25.
The structure of MT materials synthesized under
different conditions was characterized by means of
wide-angle XRD technique, as shown in Fig. 2. For
fresh samples (Fig. 2A), the XRD patterns of TiO2
have only anatase crystal phase (2θ = 25.3, 37.8, 48.1,
53.9 and 55.1o) with tetragonal structure
[PDF#21-1272]. As shown in Fig. 2A, all samples have
similar full width at half maximum (FWHM) values
and the grain sizes were contiguous and calculated to
be equal to about 7 nm. The XRD curve of MT-10-1.2
(Fig. 2A(f)) showed the largest peak area of (1 0 1)
crystal planes, which meant that the surface of
MT-10-1.2 exposed the most (1 0 1) crystal planes. As
is reported [29-30], the anatase TiO2 with exposed (1
0 1) planes was a key factor for a good bonding
20 30 40 50 60 7020 30 40 50 60 70
g
f
e
d
c
b
a
B
Inte
nsity (
Arb
itra
ry u
nits)
Anatase
C
h
Rutile
2 Theta (degree)
g
f
e
d
c
b
2 Theta (degree)
AnataseA
a
www.theNanoResearch.com∣www.Springer.com/journal/12274 | Nano Research
5 Nano Res.
interaction between the TiO2 and ruthenium-based
dye molecules, which, shows low surface energies,
enables the dye molecules to form high density
monolayer chemisorption on the particle surface and
the electrons in dye molecules to inject into
semiconductor highly efficiently. Moreover,
according to the analysis of BET, the SBET property of
MT-10-1.2 was also excellent relatively. After the
samples were calcined in air for 3 h at 550 oC, and
then calcined under the same conditions of
assembling photoanode, there were still the
diffraction peaks of anatase crystal phase and the
MT-10-1.2 peak area of (1 0 1) planes was still the
largest (Fig. 2B). And the grain sizes of calcined
samples increased by about 10 nm. For comparison,
the XRD pattern of commercial P25, calcined under
the same conditions of assembling photoanode, was
also shown in Fig. 2C. Obviously, the FWHM of MT
samples were much wider than that of P25, and the
grain sizes of MT samples were smaller compared to
those of P25.
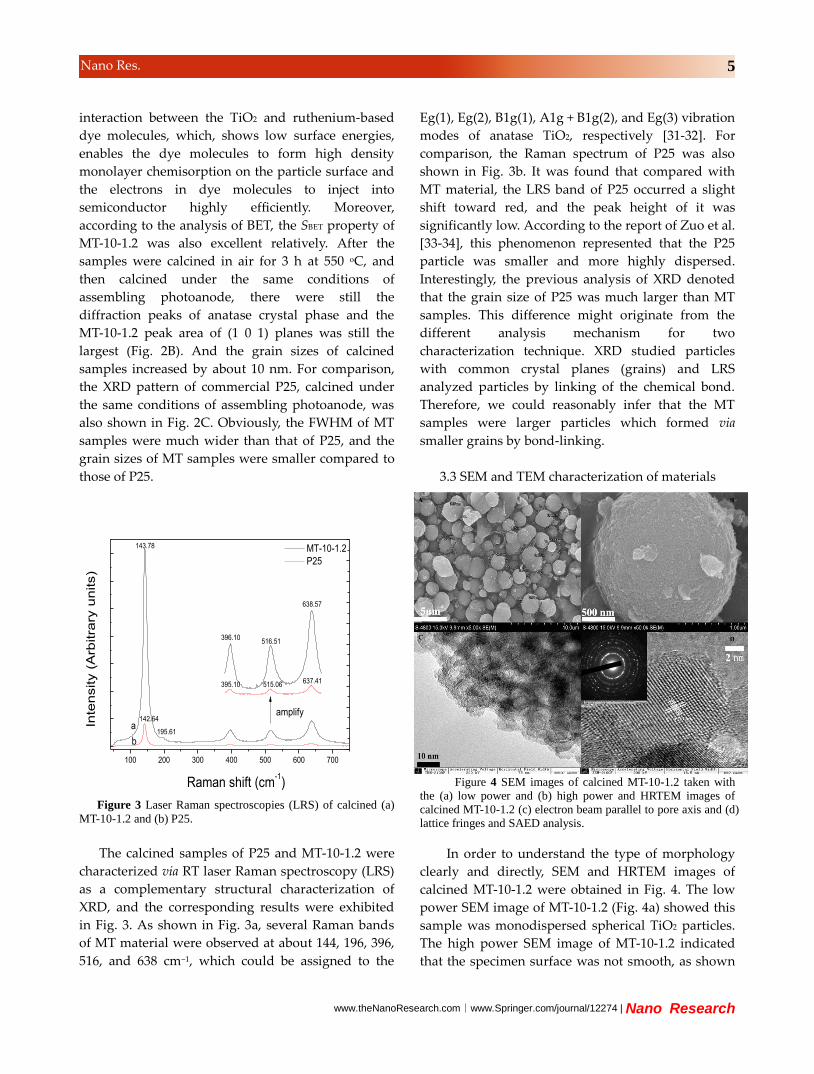
Figure 3 Laser Raman spectroscopies (LRS) of calcined (a)
MT-10-1.2 and (b) P25.
The calcined samples of P25 and MT-10-1.2 were
characterized via RT laser Raman spectroscopy (LRS)
as a complementary structural characterization of
XRD, and the corresponding results were exhibited
in Fig. 3. As shown in Fig. 3a, several Raman bands
of MT material were observed at about 144, 196, 396,
516, and 638 cm−1, which could be assigned to the
Eg(1), Eg(2), B1g(1), A1g + B1g(2), and Eg(3) vibration
modes of anatase TiO2, respectively [31-32]. For
comparison, the Raman spectrum of P25 was also
shown in Fig. 3b. It was found that compared with
MT material, the LRS band of P25 occurred a slight
shift toward red, and the peak height of it was
significantly low. According to the report of Zuo et al.
[33-34], this phenomenon represented that the P25
particle was smaller and more highly dispersed.
Interestingly, the previous analysis of XRD denoted
that the grain size of P25 was much larger than MT
samples. This difference might originate from the
different analysis mechanism for two
characterization technique. XRD studied particles
with common crystal planes (grains) and LRS
analyzed particles by linking of the chemical bond.
Therefore, we could reasonably infer that the MT
samples were larger particles which formed via
smaller grains by bond-linking.
3.3 SEM and TEM characterization of materials
Figure 4 SEM images of calcined MT-10-1.2 taken with
the (a) low power and (b) high power and HRTEM images of
calcined MT-10-1.2 (c) electron beam parallel to pore axis and (d)
lattice fringes and SAED analysis.
In order to understand the type of morphology
clearly and directly, SEM and HRTEM images of
calcined MT-10-1.2 were obtained in Fig. 4. The low
power SEM image of MT-10-1.2 (Fig. 4a) showed this
sample was monodispersed spherical TiO2 particles.
The high power SEM image of MT-10-1.2 indicated
that the specimen surface was not smooth, as shown
100 200 300 400 500 600 700
195.61
Inte
nsity (
Arb
itra
ry u
nits)
Raman shift (cm-1)
637.41515.06395.10
638.57
516.51396.10
142.64
MT-10-1.2
P25
143.78
a
b
amplify
| www.editorialmanager.com/nare/default.asp
6 Nano Res.
in Fig. 4b, and constructed by massive nano-particles,
which was in consistent with the analysis of XRD and
LRS. In order to assess the internal structure of
MT-10-1.2, HRTEM images of sample were measured
and revealed in Fig. 4c. It was shown that there were
circular holes in this sample and the diameter is
approximately 7 nm, which pointed out that the
mesoporous structure is present in this sample and
the pore size accorded with the analysis of BET. The
high power HRTEM images (Fig. 4d) showed the size
of the crystal lattices of the sample was found to be
approximately 0.353 nm which was similar to the
calculated value of SAED fringes (the inset of Fig. 4d)
via reciprocity reciprocal. The above results
suggested that these crystal lattices belonged to (1 0 1)
crystal plane of anatase [4].
3.4 XPS analysis of materials
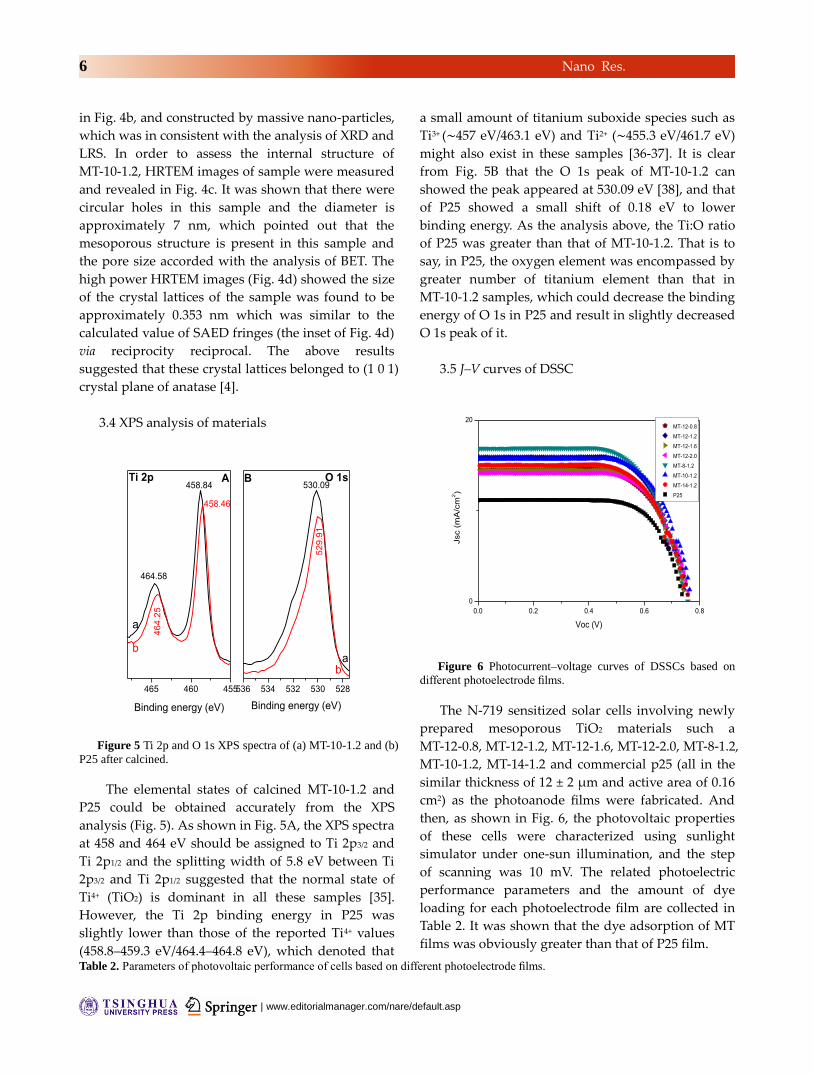
Figure 5 Ti 2p and O 1s XPS spectra of (a) MT-10-1.2 and (b)
P25 after calcined.
The elemental states of calcined MT-10-1.2 and
P25 could be obtained accurately from the XPS
analysis (Fig. 5). As shown in Fig. 5A, the XPS spectra
at 458 and 464 eV should be assigned to Ti 2p3/2 and
Ti 2p1/2 and the splitting width of 5.8 eV between Ti
2p3/2 and Ti 2p1/2 suggested that the normal state of
Ti4+ (TiO2) is dominant in all these samples [35].
However, the Ti 2p binding energy in P25 was
slightly lower than those of the reported Ti4+ values
(458.8–459.3 eV/464.4–464.8 eV), which denoted that
a small amount of titanium suboxide species such as
Ti3+ (∼457 eV/463.1 eV) and Ti2+ (∼455.3 eV/461.7 eV)
might also exist in these samples [36-37]. It is clear
from Fig. 5B that the O 1s peak of MT-10-1.2 can
showed the peak appeared at 530.09 eV [38], and that
of P25 showed a small shift of 0.18 eV to lower
binding energy. As the analysis above, the Ti:O ratio
of P25 was greater than that of MT-10-1.2. That is to
say, in P25, the oxygen element was encompassed by
greater number of titanium element than that in
MT-10-1.2 samples, which could decrease the binding
energy of O 1s in P25 and result in slightly decreased
O 1s peak of it.
3.5 J–V curves of DSSC
0.0 0.2 0.4 0.6 0.8
0
20
MT-12-0.8
MT-12-1.2
MT-12-1.6
MT-12-2.0
MT-8-1.2
MT-10-1.2
MT-14-1.2
P25
Jsc (
mA
/cm
2)
Voc (V)
Figure 6 Photocurrent–voltage curves of DSSCs based on
different photoelectrode films.
The N-719 sensitized solar cells involving newly
prepared mesoporous TiO2 materials such a
MT-12-0.8, MT-12-1.2, MT-12-1.6, MT-12-2.0, MT-8-1.2,
MT-10-1.2, MT-14-1.2 and commercial p25 (all in the
similar thickness of 12 ± 2 μm and active area of 0.16
cm2) as the photoanode films were fabricated. And
then, as shown in Fig. 6, the photovoltaic properties
of these cells were characterized using sunlight
simulator under one-sun illumination, and the step
of scanning was 10 mV. The related photoelectric
performance parameters and the amount of dye
loading for each photoelectrode film are collected in
Table 2. It was shown that the dye adsorption of MT
films was obviously greater than that of P25 film.
Table 2. Parameters of photovoltaic performance of cells based on different photoelectrode films.
536 534 532 530 528
530.09B
Binding energy (eV)
ab
O 1s
52
9.9
1
465 460 455
458.46
464.58
46
4.2
5
A
Binding energy (eV)
a
b
Ti 2p458.84
According to the BET results, the SBET values of MT
materials, compared with P25, were much larger,
which could provide more sites for the adsorption of
dye molecules. And the larger area for the dye
adsorption could lead to more “active sites” for
photoelectric conversion, which would be helpful for
the generation of higher photocurrent for DSSCs.
This can be demonstrated by the results from J-V
curves that the photocurrents of the cells based on
MT films are all greater than that of P25-based cell
(Fig. 6). However, it was also shown in Fig. 6 that the
trend of photocurrent values of different MT
materials was not in consistent with that of their SBET
values or dye adsorption amounts, which can also be
observed in Table 2. For example, the
MT-10-1.2-based solar cell showed the highest
photocurrent but the corresponding dye adsorption
amount was not the greatest, which denoted that
there were other factors affecting the photocurrent of
MT based cells. According to the previous
discussions on XRD pattern of MT materials (Fig. 2A),
the surfaces of MT-10-1.2 exposed the most (1 0 1)
crystal planes among all MT materials. It is known
that for DSSCs, the electrons in dye molecules
injected into semiconductor more efficient in (1 0 1)
planes of TiO2, which could lead to greater
photocurrent of cells [29-30]. Therefore, the high
photocurrent property of MT films was the
common-effect of specific surface structure and
crystal structure. Furthermore, generally, the DSSC
which showed higher photocurrent would exhibit
lower photovoltage for similar photoanodes [6].
However, interestingly, the solar cells with MT
materials as photoanode, compared with P25
material, revealed higher photocurrent and
photovoltage, simultaneously. So some special
structural characteristics of MT materials must be
suitable for DSSC.
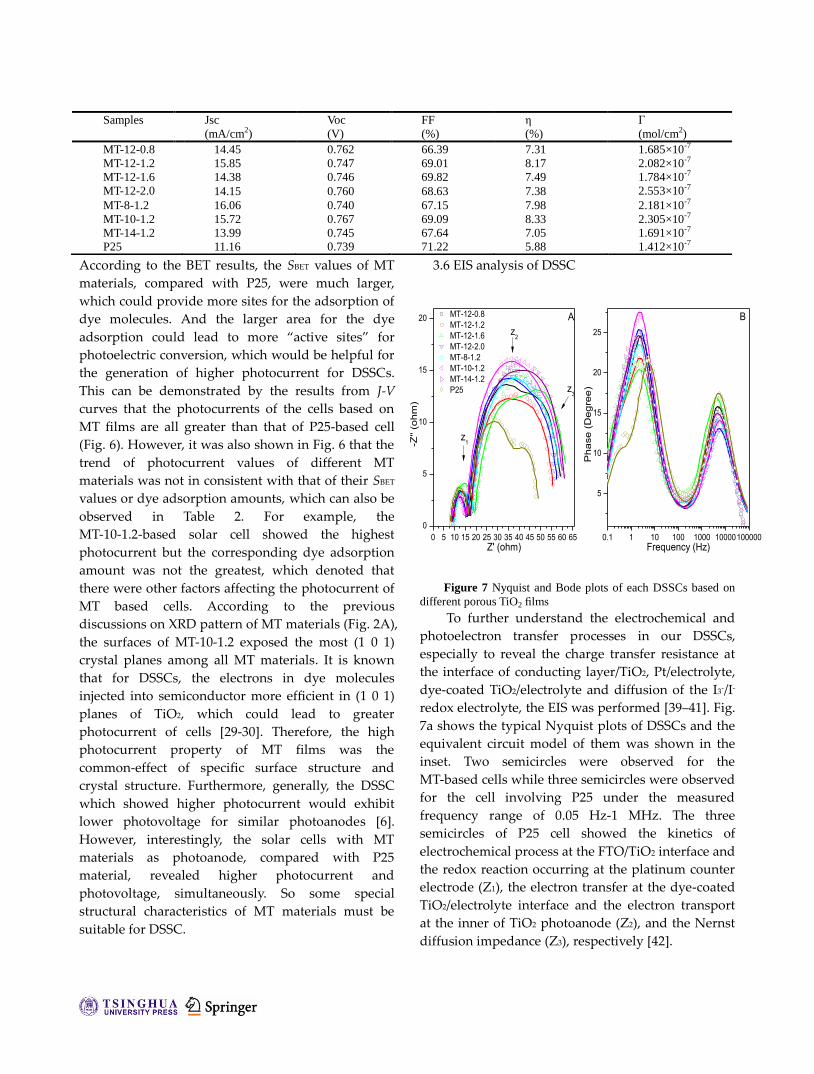
3.6 EIS analysis of DSSC
Figure 7 Nyquist and Bode plots of each DSSCs based on
different porous TiO2 films
To further understand the electrochemical and
photoelectron transfer processes in our DSSCs,
especially to reveal the charge transfer resistance at
the interface of conducting layer/TiO2, Pt/electrolyte,
dye-coated TiO2/electrolyte and diffusion of the I3-/I-
redox electrolyte, the EIS was performed [39–41]. Fig.
7a shows the typical Nyquist plots of DSSCs and the
equivalent circuit model of them was shown in the
inset. Two semicircles were observed for the
MT-based cells while three semicircles were observed
for the cell involving P25 under the measured
frequency range of 0.05 Hz-1 MHz. The three
semicircles of P25 cell showed the kinetics of
electrochemical process at the FTO/TiO2 interface and
the redox reaction occurring at the platinum counter
electrode (Z1), the electron transfer at the dye-coated
TiO2/electrolyte interface and the electron transport
at the inner of TiO2 photoanode (Z2), and the Nernst
diffusion impedance (Z3), respectively [42].
Samples
Jsc
(mA/cm2)
Voc
(V)
FF
(%)
η
(%)
Γ
(mol/cm2)
MT-12-0.8 14.45 0.762 66.39 7.31 1.685×10⁻⁷
MT-12-1.2 15.85 0.747 69.01 8.17 2.082×10⁻⁷
MT-12-1.6 14.38 0.746 69.82 7.49 1.784×10⁻⁷
MT-12-2.0 14.15 0.760 68.63 7.38 2.553×10⁻⁷
MT-8-1.2 16.06 0.740 67.15 7.98 2.181×10⁻⁷
MT-10-1.2 15.72 0.767 69.09 8.33 2.305×10⁻⁷
MT-14-1.2 13.99 0.745 67.64 7.05 1.691×10⁻⁷
P25 11.16 0.739 71.22 5.88 1.412×10⁻⁷
0 5 10 15 20 25 30 35 40 45 50 55 60 65
0
5
10
15
20
0.1 1 10 100 1000 10000100000
5
10
15
20
25
MT-12-0.8
MT-12-1.2
MT-12-1.6
MT-12-2.0
MT-8-1.2
MT-10-1.2
MT-14-1.2
P25
-Z''
(oh
m)
Z' (ohm)
A
z1
z2
z3
Ph
ase
(D
eg
ree
)
Frequency (Hz)
B
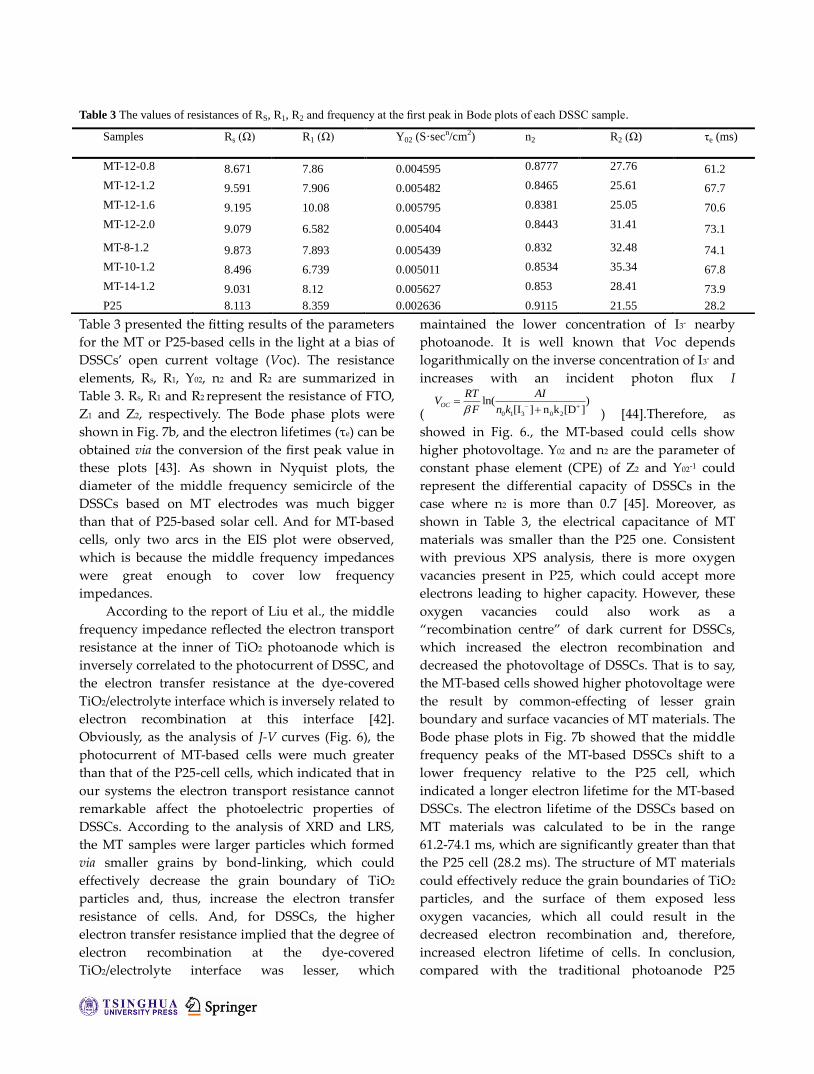
Table 3 The values of resistances of RS, R1, R2 and frequency at the first peak in Bode plots of each DSSC sample.
Table 3 presented the fitting results of the parameters
for the MT or P25-based cells in the light at a bias of
DSSCs’ open current voltage (Voc). The resistance
elements, Rs, R1, Y02, n2 and R2 are summarized in
Table 3. Rs, R1 and R2 represent the resistance of FTO,
Z1 and Z2, respectively. The Bode phase plots were
shown in Fig. 7b, and the electron lifetimes (τe) can be
obtained via the conversion of the first peak value in
these plots [43]. As shown in Nyquist plots, the
diameter of the middle frequency semicircle of the
DSSCs based on MT electrodes was much bigger
than that of P25-based solar cell. And for MT-based
cells, only two arcs in the EIS plot were observed,
which is because the middle frequency impedances
were great enough to cover low frequency
impedances.
According to the report of Liu et al., the middle
frequency impedance reflected the electron transport
resistance at the inner of TiO2 photoanode which is
inversely correlated to the photocurrent of DSSC, and
the electron transfer resistance at the dye-covered
TiO2/electrolyte interface which is inversely related to
electron recombination at this interface [42].
Obviously, as the analysis of J-V curves (Fig. 6), the
photocurrent of MT-based cells were much greater
than that of the P25-cell cells, which indicated that in
our systems the electron transport resistance cannot
remarkable affect the photoelectric properties of
DSSCs. According to the analysis of XRD and LRS,
the MT samples were larger particles which formed
via smaller grains by bond-linking, which could
effectively decrease the grain boundary of TiO2
particles and, thus, increase the electron transfer
resistance of cells. And, for DSSCs, the higher
electron transfer resistance implied that the degree of
electron recombination at the dye-covered
TiO2/electrolyte interface was lesser, which
maintained the lower concentration of I3- nearby
photoanode. It is well known that Voc depends
logarithmically on the inverse concentration of I3- and
increases with an incident photon flux I
( 0 1 3 0 2
ln( )[I ] n k [D ]
OC
RT AIV
F n k
) [44].Therefore, as
showed in Fig. 6., the MT-based could cells show
higher photovoltage. Y02 and n2 are the parameter of
constant phase element (CPE) of Z2 and Y02-1 could
represent the differential capacity of DSSCs in the
case where n2 is more than 0.7 [45]. Moreover, as
shown in Table 3, the electrical capacitance of MT
materials was smaller than the P25 one. Consistent
with previous XPS analysis, there is more oxygen
vacancies present in P25, which could accept more
electrons leading to higher capacity. However, these
oxygen vacancies could also work as a
“recombination centre” of dark current for DSSCs,
which increased the electron recombination and
decreased the photovoltage of DSSCs. That is to say,
the MT-based cells showed higher photovoltage were
the result by common-effecting of lesser grain
boundary and surface vacancies of MT materials. The
Bode phase plots in Fig. 7b showed that the middle
frequency peaks of the MT-based DSSCs shift to a
lower frequency relative to the P25 cell, which
indicated a longer electron lifetime for the MT-based
DSSCs. The electron lifetime of the DSSCs based on
MT materials was calculated to be in the range
61.2-74.1 ms, which are significantly greater than that
the P25 cell (28.2 ms). The structure of MT materials
could effectively reduce the grain boundaries of TiO2
particles, and the surface of them exposed less
oxygen vacancies, which all could result in the
decreased electron recombination and, therefore,
increased electron lifetime of cells. In conclusion,
compared with the traditional photoanode P25
Samples
Rs (Ω)
R1 (Ω) Y02 (S·secn/cm2) n2 R2 (Ω) τe (ms)
MT-12-0.8 8.671 7.86 0.004595 0.8777 27.76 61.2
MT-12-1.2 9.591 7.906 0.005482 0.8465 25.61 67.7
MT-12-1.6 9.195 10.08 0.005795 0.8381 25.05 70.6
MT-12-2.0 9.079 6.582 0.005404 0.8443 31.41 73.1
MT-8-1.2 9.873 7.893 0.005439 0.832 32.48 74.1
MT-10-1.2 8.496 6.739 0.005011 0.8534 35.34 67.8
MT-14-1.2 9.031 8.12 0.005627 0.853 28.41 73.9
P25 8.113 8.359 0.002636 0.9115 21.55 28.2
www.theNanoResearch.com∣www.Springer.com/journal/12274 | Nano Research
Nano Res.
material, the structural characteristics of MT
materials could afford the DSSCs with greater
photocurrent and photovoltage, simultaneously.
4 Conclusions
The MT materials were synthesized by
hydrothermal procedure using P123 as template and
titanium isopropoxide as titanium source. A series of
DSSCs were assembled by using doctor coating
methods with these materials. The BET, XRD, LRS,
XPS, SEM and HRTEM techniques were employed to
characterize the fresh and calcined materials and the
J-V curves and EIS were used to analyze the DSSCs.
The results showed that the MT materials presented
excellent structural properties and the SBET values of
them were even four times higher than that of P25,
which could contribute to enhanced photocurrent of
cells. XRD analysis showed that the MT materials
were pure anatase phase and MT-10-1.2 exposed the
most (1 0 1) crystal planes, which was also propitious
to enhanced photocurrent of cells. Combined results
from XRD and LRS indicated that the MT materials
were a series of large particles composed of
numerous small nanocrystal grains via connection of
chemical bondings. SEM and HRTEM images of
samples further verified these studies. This structure
decreased the grain boundary among TiO2 particles
and, consistent with the analysis of EIS, indicated
that MT-based cells could show higher middle
frequency impedances than P25 cells, which leads to
increase the photovoltage of cells. XPS results
revealed that, for MT materials, the amount of
titanium suboxide species was less than that for P25.
These titanium suboxide species could increase the
amount of “recombination centre” of dark current for
DSSCs, which also decreased photovoltage of cells.
Overall, compared to P25, The MT-based DSSCs
presented higher photoelectric conversion efficiency
by increasing photocurrent and photovoltaic,
simultaneously. The highest photoelectric conversion
efficiency of the cells involving MT materials reached
8.33% which, compared to that of P25-based solar cell
(5.88%), increased by 41.7%.
Acknowledgements
This work is supported by Doctoral Program of Higher
Education of China (No. 20120032120011), National
Natural Science Foundation of China (No. 21076147,
No 21476162) and China International Science and
Technology Project (No. 2012DFG41980).
References [1] Green, M. A.; Emery, K.; Hishikawa, Y.; Warta W.; Dunlop,
E. D. Solar Cell Efficiency Tables (Version 40). Prog.
Photovoltaics 2012, 20, 606-614.
[2] Green, M. A. Silicon solar cells: evolution, high-efficiency
design and efficiency enhancements. Semicond. Sci.
Technol. 1993, 8, 1-12.
[3] Branker, K.; Pathak, M. J. M.; Pearce, J. M. A review of
solar photovoltaic levelized cost of electricity. Renew. Sust.
Energ. Rev. 2011, 15, 4470-4482.
[4] Grätzel, M.; Dye-sensitized solar cells. J. Photochem.
Photobiol. C: Photochem. Rev. 2003, 4, 145-153.
[5] Kuang, D.; Brillet, J.; Chen, P.; Takata, M.; Uchida, S.;
Miura, H.; Sumioka, K.; Zakeeruddin, S.; Gratzel, M.
Application of highly ordered TiO2 nanotube arrays in
flexible Dye-Sensitized Solar Cells. ACS Nano 2008, 2,
1113-1116.
[6] Oregan, B.; Grätzel, M. A low-cost, high-efficiency solar
cell based on dye-sensitized colloidal TiO2 films. Nature
1991, 353, 737-740.
[7] Cahen, D.; Hodes, G.; Grätzel, M.; Guillemoles, J. F.; Riess,
I. Nature of Photovoltaic Action in Dye-Sensitized Solar
Cells. J. Phys. Chem. B 2000, 104, 2053-2059.
[8] Palomares, E.; Clifford, J. N.; Haque, S. A.; Lutz, T.;
Durrant, J. R. Control of charge recombination dynamics in
Dye Sensitized Solar Cells by the use of conformally
deposited metal oxide blocking layers. J. Am. Chem. Soc.
2003, 125, 475-482.
[9] Chen, S. G.; Chappel, S.; Diamant, Y.; Zaban, A.
Preparation of Nb2O5 coated TiO2 nanoporous electrodes
and their application in dye-sensitized solar cells. Chem.
Mater. 2001, 13, 4629-4634.
[10] Diamant, Y.; Chen, S. G.; Melamed, O.; Zaban, A.
Core−Shell nanoporous electrode for dye sensitized solar
cells: the effect of the SrTiO3 shell on the electronic
properties of the TiO2 Core. J. Phys. Chem. B 2003, 107,
1977-1981.
[11] Diamant, Y.; Chappel, S.; Chen, S. G.; Melamed, O.;
Zaban, A. Core–shell nanoporous electrode for dye
sensitized solar cells: the effect of shell characteristics on
the electronic properties of the electrode. Coord. Chem. Rev.
2004, 248, 1271-1276.
[12] Fujihara, K.; Kumar, A.; Jose, R.; Ramakrishna, S.; Uchida,
S. Spray deposition of electrospun TiO2 nanorods for
dye-sensitized solar cell. Nanotechnology, 2007, 18,
365709.
[13] Feng, X. J.; Shankar, K.; Varghese, O. K.; Paulose, M.;
Latempa, T. J.; Grimes, C. A. Vertically aligned single
crystal TiO2 nanowire arrays grown directly on transparent
conducting oxide coated glass: synthesis details and
applications. Nano Lett. 2008, 8, 3781-3786.
[14] Liu, B.; Aydil, E. S. Growth of oriented single-crystalline
rutile TiO2 nanorods on transparent conducting substrates
| www.editorialmanager.com/nare/default.asp
Nano Res.
for dye-sensitized solar cells. J. Am. Chem. Soc. 2009, 131,
3985-3990.
[15] Gong, D.; Grimes, C. A.; Varghese, O. K.; Hu, W. C.;
Singh, R. S.; Chen, Z.; Dickey, E. C. Preparation of
self-organized titania nanotubes electrode and its
electrochemical properties. J. Mater. Res. 2001, 16,
3331-3334.
[16] Mor, G. K., Varghese, O. K., Paulose, M., Shankar, K.,
Grimes, C. A. A review on highly ordered, vertically
oriented TiO2 nanotube arrays: Fabrication, material
properties, and solar energy applications. Sol. Energy Mater.
Sol. Cells, 2006, 90, 2011-2075.
[17] Kim, Y. J.; Lee, M. H.; Kim, H. J.; Lim, G.; Choi, Y. S.;
Park, N. G.; Kim, K.; Lee, W. I. Formation of highly
efficient dye-sensitized solar cells by hierarchical pore
generation with nanoporous TiO2 spheres. Adv. Mater.,
2009, 21, 3668-3673.
[18] Koo, H. J.; Kim, Y. J.; Lee, Y. H.; Lee, W. I.; Kim, K.;
Park, N. G. Nano-embossed hollow spherical TiO2 as
bifunctional material for high-efficiency dye-sensitized
solar cells. Adv. Mater. 2008, 20, 195-199.
[19] Yang, P.; Zhao, D.; Margolese, D. I.; Chmelka, B. F.;
Stucky, G. D. Generalized syntheses of large-pore
mesoporous metal oxides with semicrystalline frameworks.
Nature 1998, 396, 152-155.
[20] Nedelcu, M.; Guldin, S.; Orilall, M. C.; Lee, J.; Huttner, S.;
Crossland, E. J. W.; Warren, S. C.; Ducati, C.; Laity, P. R.;
Eder, D.; Wiesner, U.; Steiner, U.; Snaith, H. J. Monolithic
route to efficient dye-sensitized solar cells employing
diblock copolymers for mesoporous TiO2. J. Mater. Chem.
2010, 20, 1261-1268.
[21] Kim, D. S.; Jeon, J.; Shin, K. Preparation of hierarchical
TiO2 films with uniformly or gradually changed pore size
for use as photoelectrodes in dye-sensitized solar cells.
Micropor. Mesopor. Mat. 2013, 181, 61-67.
[22] Peng, X.; Feng, Y. Q.; Meng, S. X.; Zhang, B. Preparation
of hierarchical TiO2 films with uniformly or gradually
changed pore size for use as photoelectrodes in
dye-sensitized solar cells. Electrochim. Acta 2014, 115,
255-262.
[23] Gao, Y.; Feng, Y. Q.; Zhang, B.; Zhang, F.; Peng, X.; Liu,
L.; Meng, S. X. Double-N doping: a new discovery about
N-doped TiO2 applied in dye-sensitized solar cells. RSC
Adv. 2014, 4, 16992-16998.
[24] Yang, Y. B.; Peng, X.; Chen, S.; Lin, L. P.; Zhang, B.;
Feng, Y. Q. Performance improvement of dye-sensitized
solar cells by introducing a hierarchical compact layer
involving ZnO and TiO2 blocking fimls. Ceram. Int. 2014,
40, 15199-15206.
[25] Liu, B. S.; Zhang, Y.; Liu, J. F.; Tian, M.; Zhang, F. M.; Au,
C. T.; Cheung, A. S.-C. Characteristic and mechanism of
methane dehydroaromatization over Zn-Based/HZSM-5
catalysts under conditions of atmospheric pressure and
supersonic jet expansion. J. Phys. Chem. C 2011, 115,
16954-16962.
[26] Zhang, Y.; Liu B. S.; Zhang, F. M. Formation of
(FexMn2−x)O3 solid solution and high sulfur capacity
properties of Mn-based/M41 sorbents for hot coal gas
desulfurization. J. Hazard. Mater., 2013, 248-249, 81-88.
[27] Zhang, Y. L. Nanoporous polymer monoliths as adsorptive
supports for robust photocatalyst of Degussa P25. J.
Colloid Interf. Sci. 2009, 339(2), 434-438.
[28] Kresge, C. T. Ordered mesoporous molecular sieves
synthesized by a liquid-crystal template mechanism.
Nature 1992, 359, 710-712.
[29] Lin, J. J.; Zhao, L.; Heo, Y. N.; et al. Mesoporous anatase
single crystals for efficient Co(2+/3+)-based dye-sensitized
solar cells. Nano Energy 2015, 11, 557-567.
[30] Park, N. G.; van de Lagemaat, J.; Frank, A. J. Comparison
of dye-sensitized rutile- and anatase-based TiO2 solar cells.
J. Phys. Chem. B 2000, 104, 8989-8994.
[31] Liu, Z. M.; Yi, Y.; Li, J. H.; Woo, S. I.; Wang, B. Y.; Cao,
X. Z.; Li, Z. X. A superior catalyst with dual redox cycles
for the selective reduction of NOx by ammonia. Chem.
Commun. 2013, 49, 7726-7728.
[32] Kolen’ko, Y. V.; Kovnir, K. A.; Gavrilov, A. I.; Garshev, A.
V.; Meskin, P. E.; Churagulov, B. R.; Bouchard, M.;
Colbeau-Justin, C.; Lebedev, O. I.; Van Tendeloo, G.;
Yoshimura, M. Structural, textural, and electronic
properties of a nanosized mesoporous ZnxTi1-xO2-x solid
solution prepared by a supercritical drying route. J. Phys.
Chem. B 2005, 109, 20303-20309.
[33] Buciuman, F.; Patcas, F.; Cracium, R.; Zahn, D. R. T.
Vibrational spectroscopy of bulk and supported manganese
oxides. Phys. Chem. Chem. Phys. 1999, 1, 185.
[34] Zuo, J.; Xu, C.; Liu, Y.; Qian, Y. Crystallite size effects on
the Raman spectra on Mn3O4. Nanostruct. Mater, 1998, 10,
1331.
[35] Moulder, J. F.; Stickle, W. F.; Sobol, P. E.; Bomben, K. D.
Handbook of X-ray Photoelectron Spectroscopy,
Perkin-Elmer Corp, Eden Prairie, MN, 1992.
[36] Huo, K.; Wang, H.; Zhang, X.; Cao, Y.; Chu, P. K.
Heterostructured TiO2 Nanoparticles/Nanotube Arrays: In
Situ Formation from Amorphous TiO2 Nanotube Arrays in
Water and Enhanced Photocatalytic Activity.
ChemPlusChem 2012, 77, 323-329.
[37] Fu, Y. Q.; Du, H.; Zhang, J.; Huang, W. M. XPS
characterization of surface and interfacial structure of
sputtered TiNi films on Si substrate. Mater. Sci. Eng. A
2005, 403, 25-31.
[38] Jang, I.; Song, K.; Park, J. H.; Oh, S. G. Enhancement of
dye adsorption on TiO2 surface through hydroxylation
process for dye-sensitized solar cells. Bull. Korean. Chem.
Soc. 2013, 34, 2883-2888.
[39] J. Bisquert, Chemical capacitance of nanostructured
semiconductors: its origin and significance for
nanocomposite solar cells. Phys. Chem. Chem. Phys. 2003,
5, 5360-5364.
[40] Han, L. Y.; Koide, N.; Chiba Y.; Mitate, T. Modeling of an
equivalent circuit for dye-sensitized solar cells. Appl. Phys.
Lett. 2004, 84, 2433-2435.
[41] Lu, X. J.; Mou, X. L.; Wu, J. J.; Zhang, D. W.; Zhang, L.
L.; Huang, F. Q.; Xu F. F.; Huang, S. M. Improved
performance dye-sensitized solar cells using Nb-doped
TiO2 electrodes: efficient electron injection and transfer.
Adv. Funct. Mater., 2010, 20, 509-515.
www.theNanoResearch.com∣www.Springer.com/journal/12274 | Nano Research
Nano Res.
[42] Liu, W. Q. Wide frequency range diagnostic impedance
behavior of the multiple interfaces charge transport and
transfer processes in dye-sensitized solar cells. Electrochim.
Acta 2013, 88, 395-403.
[43] Adachi, M.; Sakamoto, M.; Jiu, J. T.; Ogata, Y.; Isoda, S.
Determination of Parameters of Electron Transport in
Dye-Sensitized Solar Cells Using Electrochemical
Impedance Spectroscopy. J. Phys. Chem. B 2006, 110,
13872-13880.
[44] Wang, Q.; Moser J. E.; Grätzel, M. Electrochemical
impedance spectroscopic analysis of dye-sensitized solar
cells. J. Phys. Chem. B, 2005, 109, 14945-14953.
[45] van de Lagemaat, J.; Park N. G.; Frank, A. J. Influence of
electrical potential distribution, charge transport, and
recombination on the photopotential and photocurrent
conversion efficiency of dye-sensitized nanocrystalline
TiO2 solar cells: a study by electrical impedance and
optical modulation techniques. J. Phys. Chem. B 2000, 104,
2044-2052.