preparation and characterization of mof-pes ultrafiltration membranes
TRANSCRIPT
Preparation and characterization of MOF-PES ultrafiltrationmembranes
Arcadio Sotto,1 Gisela Orcajo,1 Jes�us Mar�ıa Arsuaga,1 Guillermo Calleja,1 Junkal Landaburu-Aguirre2
1Department of Chemical and Environmental Technology, Rey Juan Carlos University, Madrid, Spain2Mass and Heat Transfer Process Laboratory, Department of Process and Environmental Engineering, P.O. Box 4300, FI-90014,University of Oulu, FinlandCorrespondence to: A. Sotto (E - mail: [email protected])
ABSTRACT: Fouling is one of the main disadvantages of membrane processes. Fouling can be mitigated by incorporating inorganic
particles into the membrane. Composite membranes containing the inorganic fillers show higher pore size, porosity, and hydrophilic
character than the neat PES membrane, which contributes to a better permeability. In this research, PES ultrafiltration membranes
are prepared using both commercial and synthesized metal-organic framework materials (MOF) as well as ZnO particles as fillers.
Among the different fillers used, MOF particles produce a better effect on the permeability of the membrane than ZnO particles. The
synthesized Zn/Co-MOF-74-type materials have good structural stability in the polymeric matrix and the MOF-PES membrane main-
tains its performance after a series of cycles of BSA water solution. Tested MOF-PES membrane also shows higher BSA rejections and
permeate flux than the neat PES membrane, demonstrating that it is possible to enhance the flux without losing the selectivity of the
membrane. VC 2014 Wiley Periodicals, Inc. J. Appl. Polym. Sci. 2015, 132, 41633.
KEYWORDS: porous materials; properties and characterization; surfaces and interfaces; polycarbonates
Received 24 July 2014; accepted 14 October 2014DOI: 10.1002/app.41633
INTRODUCTION
Membrane fouling is one the main disadvantages of the
pressure-driven membrane processes applied to wastewater
treatment.1 Membrane fouling can be caused by mineral precip-
itation,2 attachment of colloids and dissolved organics3,4 and
growth of microbes on the membrane surface.5 As a conse-
quence, permeate flux is reduced and salt passage through the
membrane increases, decreasing the overall membrane process
performance. As a consequence the membrane efficiency is
reduced, being the water recovery level below the optimum. In
addition, both the energy demand and the overall operational
cost of the process increase.6 These fouling mechanisms can be
reversible or irreversible. Reversible fouling is caused by the for-
mation of a cake layer (deposition) or concentration polariza-
tion (gel formation) of materials at the membrane surface. They
can be removed by an appropriate physical washing such as
backwashing or surface washing. Irreversible fouling, however, is
caused by permanent adsorption and/or pore blockage by spe-
cies present in the liquid. In order to improve the fouling tend-
ency of membranes, research studies have focused on the
introduction of hydrophilic layers, the reduction of surface
roughness and the improvement of surface charge.7 Another
important development in antifouling pressure-driven mem-
branes is the incorporation of nanoscale inorganic particles into
the membrane. The use of nanoparticles in the synthesis of
membranes can improve their performance by decreasing the
degree of membrane fouling, and therefore increasing the per-
meate flux.8,9 The hydrophobicity of both organic pollutants
and the membrane surface (polymeric material) favors the pres-
ence of hydrophobic interactions in the surface-pollutant inter-
face, which promotes the formation of a fouling layer onto the
membrane surface and in the inner pore walls of the membrane
structure.10 The addition of hydrophilic fillers into the mem-
brane composition mitigates the formation and progress of
fouling phenomena taking into account the hydrophilic charac-
ter of nanomaterials proposed as dopants.11 Among these nano-
materials, TiO2, SiO2, ZrO2, Al2O3, and Ag were found to
improve anti-fouling performance of membranes. The increased
hydrophilic character of the membranes containing Al2O3,
reduces the chance of absorbing hydrophobic matter,12 thus
preventing colloidal and organic fouling. Membranes combined
with silver benefit from the bactericidal activity of silver nano-
particles. Silver composite thin films have a less compact struc-
ture and a rougher surface than the pure polyamide films.
These membranes were shown to have a great anti-biofouling
performance, but the release of silver is likely to influence the
long-lasting antibacterial and biofouling resistant performance.13
The environmental risk associated to the use of nanomaterials
and the integrity of membrane functions are additional issues
associated to the use of nanoparticles in aqueous environments.14
VC 2014 Wiley Periodicals, Inc.
WWW.MATERIALSVIEWS.COM J. APPL. POLYM. SCI. 2015, DOI: 10.1002/APP.4163341633 (1 of 9)
It has been previously demonstrated that the weight percent of
nanoparticles is reduced after the permeation tests.15 This indi-
cates that the nanoparticles would leach out during the test
because of the weak interaction with the membrane matrix. In
addition, it has been previously reported that nano-ZnO has low
water stability being decomposed to toxic Zn21,16,17 which creates
a risk for the ecosystem. This may limit the applicability of nano-
ZnO particles in membrane processes.
Membrane stability could be improved by increasing the inter-
face compatibility between nano-fillers and the polymeric
matrix. For this purpose, a new class of materials consisting of
inorganic moieties linked together by organic bridges, called
Metal-Organic Framework (MOF), can be good alternatives
compared to the commonly used metal oxides, so that using
MOF materials in ultrafiltration membranes seem to be a prom-
ising area of research. MOF materials show intrinsic properties
that could favor the membrane performance: (1) they are con-
stituted by metal or metal clusters bounded to multifunctional-
ized organic molecules such as amines, pyridines, carboxylates,
sulphonates, and phosphonates, providing a wide variety of
crystalline porous materials, (2) they can have different porous
structures that can act as molecular sieves, and (3) they have
extraordinary surface area and free pore volume. In other
words, by selecting the suitable components, a especific MOF
structure with the desired physico-chemical properties can be
designed.18 Concerning MOF stability, K€usgens et al.19 studied
the water adsorption of MOFs, showing that commercial ZIF-8
has a remarkable chemical stability towards water, maintaining
the MOF framework structure after a heating treatment in water
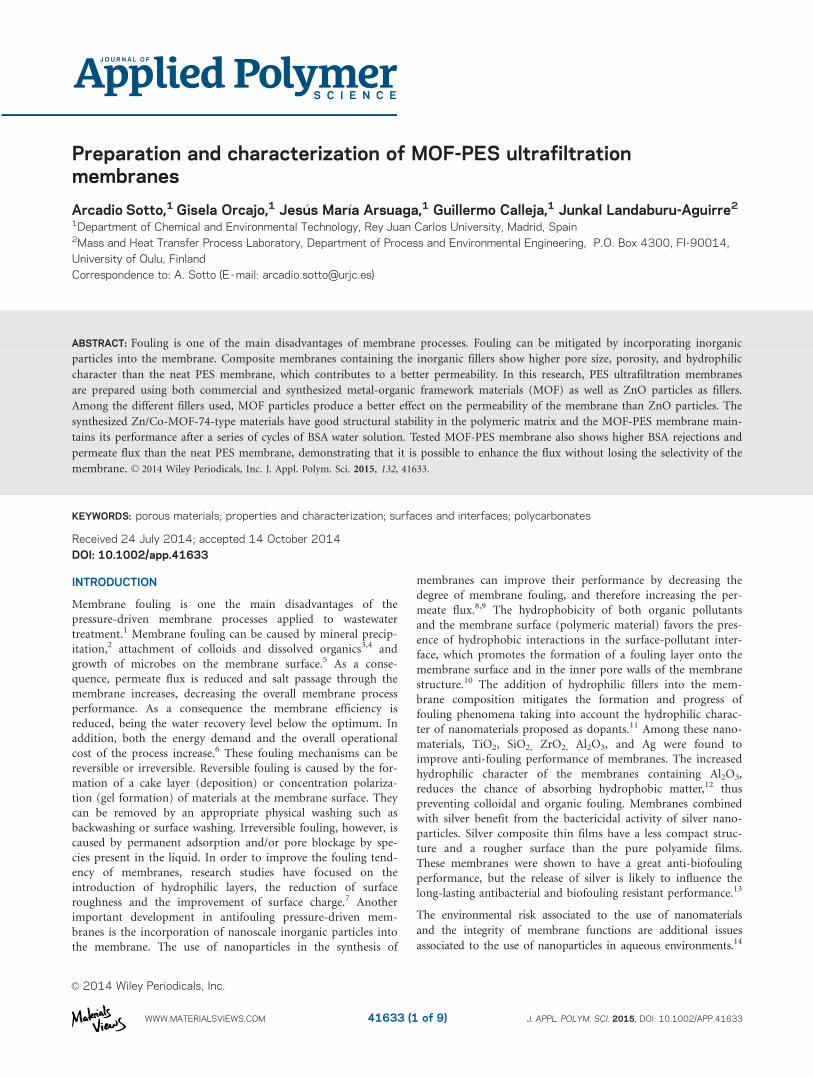
Figure 1. Two-dimensional view of the honeycomb-like
Me2(dhtp) (CH3OH) structure. [Color figure can be viewed in the online
issue, which is available at wileyonlinelibrary.com.]
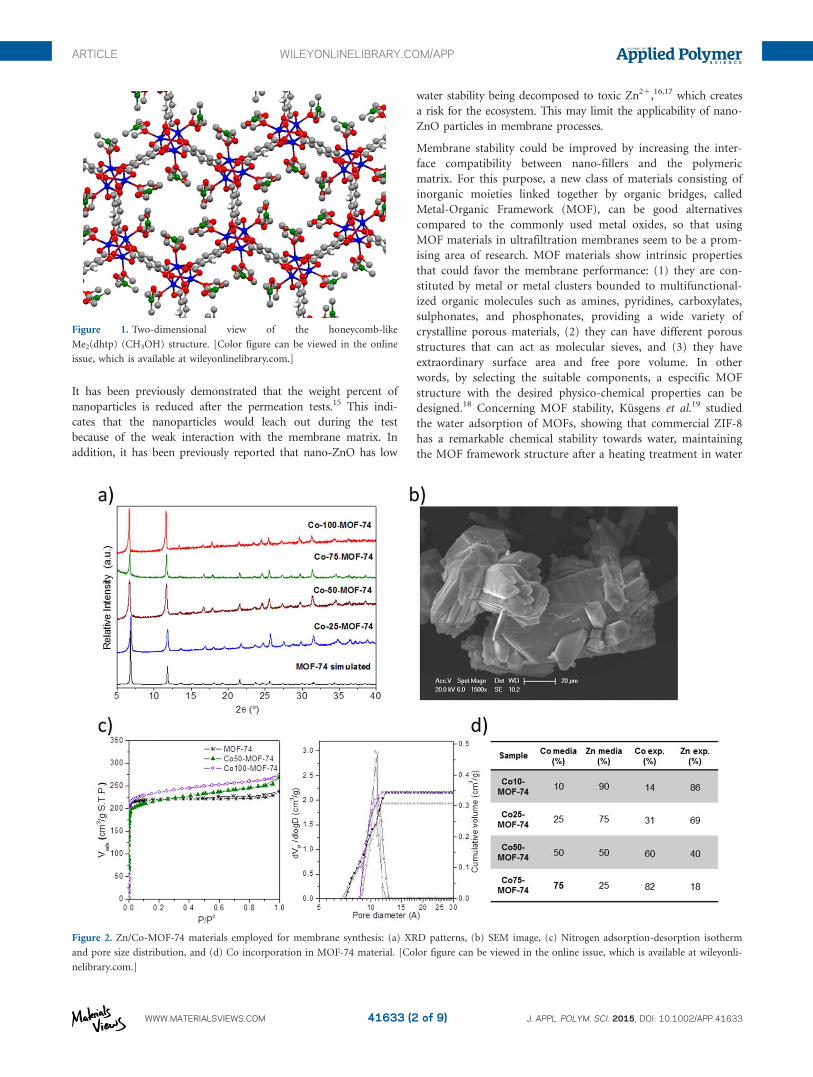
Figure 2. Zn/Co-MOF-74 materials employed for membrane synthesis: (a) XRD patterns, (b) SEM image, (c) Nitrogen adsorption-desorption isotherm
and pore size distribution, and (d) Co incorporation in MOF-74 material. [Color figure can be viewed in the online issue, which is available at wileyonli-
nelibrary.com.]
ARTICLE WILEYONLINELIBRARY.COM/APP
WWW.MATERIALSVIEWS.COM J. APPL. POLYM. SCI. 2015, DOI: 10.1002/APP.4163341633 (2 of 9)
for 24 h at 323 K. This stability reinforces the potential applica-
tion of polymer-MOF mixture matrix membranes for water
purification.
During the last decade several groups have focused their efforts
on the preparation of three-dimensional honeycomb-like metal–
organic frameworks using 2,5-dihydroxyterephthalic acid
(H2dhtp) as an organic linker (Figure 1). The use of this linker
in the presence of different divalent metal ions such as Zn21,
Mg21, Ni21, Fe21, Co21 has resulted in the MOF-74 struc-
ture,20–25 with exposed and unsaturated metal sites, which are
available for interacting with any particular substrate. Mixed-
metal MOF-74 structures that contain simultaneously Zn21 and
Co21 metal ions have been developed by our group,26 demon-
strating that the coexistence of both transition metal ions in the
MOF-74 framework enhances the interaction with some partic-
ular adsorbate molecules.
In this article, the addition of tailor made Zn/Co- MOF -74
particles and commercial ZIF-8 metal organic framework par-
ticles to ultrafiltration membrane is studied. The main goal is
to evaluate the effect of MOF fillers on the membrane morphol-
ogy and performance, as well as to compare the behavior of
synthesized Zn/Co-MOF-74 particles and ZIF-8 particles as well
as the commonly used ZnO particles.
EXPERIMENTAL
Synthesis and Characterization of MOF Nanocrystals
Zn- and Co- containing MOF-74 materials were prepared fol-
lowing the procedure published elsewhere,26 in which 2,5-dihy-
droxybenzene-1,4-dicarboxylic acid (H2dhtp, from Sigma-
Aldrich S.L.), tetrahydrated zinc nitrate and/or hexahydrated
cobalt nitrate (Fluka) were added over N,N-dimethylformamide
(DMF, from Scharlab S.L.) under stirring. Once these reagents
were dissolved, de-ionized water was added to form a clear
solution of molar composition: 1H2DHBDC: 2.9 (Zn-Co) : 523
DMF : 107H2O. This mixture was heated up to 100�C for 20 h
to yield needle shaped crystals. After decanting the hot mother
liquor and washing with DMF, the solid product was immersed
in methanol for 6 days. During this period of time the solvent
was renewed three times after solid decanting. Methanol was
finally removed under high vacuum (<1027 bar) at 150�C,
yielding a porous material with MOF-74 structure.
MOF phase identification was carried out by X-ray powder dif-
fraction (XRD) using a PHILIPS X‘PERT diffractometer with
Cu Ka radiation. Nitrogen adsorption–desorption isotherms at
2196�C were measured using an AutoSorb equipment (Quan-
tachrome Instruments). The pore surface area was calculated by
using the Brunauer–Emmett–Teller (BET) model. The pore vol-
ume and diameter were estimated by non-local DFT
calculations.
The metal oxide and MOF particle size distributions were deter-
mined by using digital imaging and analysis processing from
the Scanning Electron Microscopy images (SEM, XL-30, Philips,
Eindhoven, the Netherlands).
Preparation and Characterization of MOF-PES Ultrafiltration
Membranes
Polyethersulfone (PES) supplied by BASF (Germany) was
employed as the base polymer. 1-Methyl-2-pyrrolidone (NMP,
99.5%) provided by Sharlab (Spain) was used as the polymer
solvent. The support layer (Viledon FO2471) used for the PES
membrane manufacturing was obtained from Freudenberg
(Weinheim, Germany).
Neat and doped membranes were prepared using phase inver-
sion induced by immersion precipitation technique. PES poly-
mer (at 20 wt %) was dissolved in NMP. Doped membranes
were prepared by dispersing 0.4 g of filler particles in 79.6 mL
of solvent for 3 h by mechanical stirring at 200 rpm and room
temperature. Subsequently, 20 g of polymer to the particle/sol-
vent solution was added and stirred for 24 h at 500 rpm and
40�C. After formation of an homogenous solution, the films
were cast with 200 lm thickness with a filmograph on nonwo-
ven polyester as a support layer. The membrane films were
immersed in the non-solvent bath (distilled water at 20�C) for
precipitation. The membrane was afterwards repeatedly washed
with distilled water to remove the remaining solvent. For each
polymer solution composition, five identical membrane sheets
were made and tested to obtain an average value of flux and
solute rejection.
The hydrophilicity of membrane skin surface was determined
on the basis of a water contact angle system (DSA 10 Mk2
Kr€uss, Germany) equipped with video capture at room temper-
ature. A water droplet was placed on a dry, flat and homogene-
ous membrane surface and the contact angle between water and
membrane was measured was observed. The average contact
angle for distilled water was determined for six measurements
on the different membrane surfaces.
The morphologies of membranes cross-section were observed by
SEM. The membranes were cut in pieces of small sizes and fro-
zen with liquid nitrogen, to produce a crio-fracture on the cross
section. The samples were dried and kept in vacuum conditions,
and then were gold sputtered (13–15 nm thickness). The surface
pore size distribution of the membranes was characterized by
Field Emission Gun Scanning Electron Microscope (FEGSEM,
FEI, the Netherlands). Membrane specimens were sputtered
with platinum (5 nm thickness).
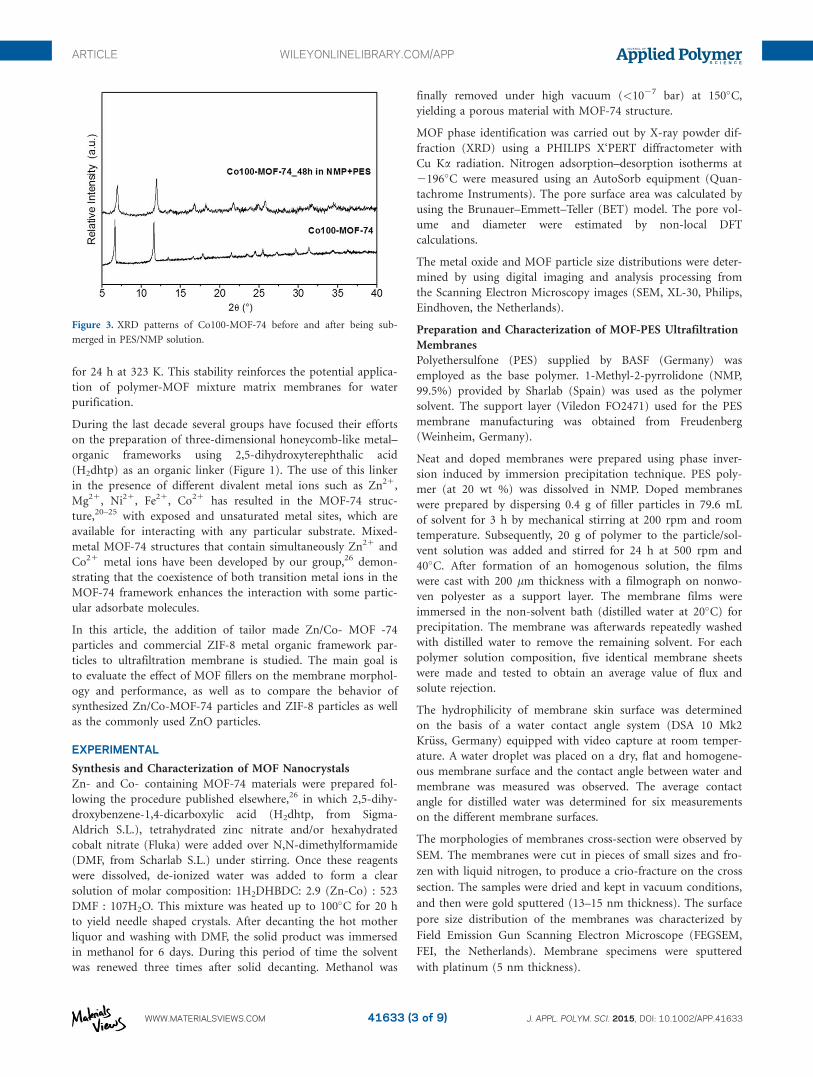
Figure 3. XRD patterns of Co100-MOF-74 before and after being sub-
merged in PES/NMP solution.
ARTICLE WILEYONLINELIBRARY.COM/APP
WWW.MATERIALSVIEWS.COM J. APPL. POLYM. SCI. 2015, DOI: 10.1002/APP.4163341633 (3 of 9)

The overall membrane porosity (Pr,%) was calculated as a func-
tion of the membrane weight using the following equation:
Prð%Þ5Ww2Wd
Sdq
� �3100 (1)
where Ww and Wd are the membrane weight of at equilibrium
in swollen and dry state, respectively; S the membrane area; d
the membrane thickness and q the water density. The mem-
branes were immersed in water during 24 h prior to measure-
ment of swelling state. The porosity data were the average of
four measurements with four samples of each membrane.
Ultrafiltration Experiments
The prepared membranes were characterized for water flux
using a cross-flow filtration set-up.27 A constant feed composi-
tion was achieved by recycling the retentate and permeate
stream to the feed tank. In a typical run, membranes were com-
pacted using Milli-Q water for 2 h at 3 bar until there was no
further variation in permeate flux, then the water flux was
recorded. In this way the influence of compaction during filtra-
tion experiments could be avoided. After compaction, the pure
water permeability was determined by measuring the pure water
flux during 2 h at 25�C.
In order to study the effect of membrane fouling, the mem-
branes were tested in a cross-flow filtration equipment in
recycle mode fed with 200 mg/L of BSA. The permeate flux and
rejection of all membranes were determined at 2 bar transmem-
brane pressure at 25�C. Concentration polarization was mini-
mized by using a cross-flow velocity of 4.5 m/s. This feed
Figure 4. SEM images of membranes cross-section. [Color figure can be viewed in the online issue, which is available at wileyonlinelibrary.com.]
ARTICLE WILEYONLINELIBRARY.COM/APP
WWW.MATERIALSVIEWS.COM J. APPL. POLYM. SCI. 2015, DOI: 10.1002/APP.4163341633 (4 of 9)
velocity corresponds to a Reynolds number of 30,000, which is
far in the turbulent region.
RESULTS AND DISCUSSION
Synthesis and Characterization of MOF Nanocrystals
The most relevant characterization data of synthesized Zn/Co-
MOF-74 materials is depicted in Figure 2. For all materials with
different Zn/Co ratios [Figure 2(a)], powder X-ray diffraction
patterns showed the typical reflections of MOF-74 phase,20
characteristic of the three-dimensional coordination structure
with a honeycomb topology that contains 1-D broad channels
(Figure 1). SEM micrograph [Figure 2(b)] revealed the expected
large needle-shaped crystals for all materials synthesized, similar
to those previously published.26 The porosity of the MOF-74-
type materials was measured by nitrogen adsorption/desorption
at 2196�C [Figure 2(c)]. The type I isotherms revealed a per-
manent microporosity with a BET specific surface area around
1000 m2/g, a pore volume of 0.5 cm3/g and an average pore
diameter of ca. 11 A. The thermogravimetric analysis in N2
atmosphere (not shown) indicates the decomposition of the
organic moiety of the sample above 250�C for all obtained
materials. This fact is a clear evidence of the thermal stability of
the MOF-74 framework at high temperatures.
Before preparing the MOF-PES membranes, the stability of
MOF-74 structure in the synthesis media of the polymeric
membrane was studied, by submerging the Co100-MOF-74
material in a PES/NMP solution during 48 h at room tempera-
ture. As it can be observed in the XRD patterns (Figure 3), the
treated material shows structural stability of the MOF frame-
work under the membrane synthesis conditions. A direct XRD
analysis of the MOF-matrix membrane would be useless since
the amount of MOF in the membrane is very low, being under
the detection limit of this technique.
Morphological Characterization of MOF-PES Ultrafiltration
Membranes
The morphology of manufactured membranes was explored by SEM
technique, observing the cross-section of membranes (Figure 4).
As shown, the membranes show a typical macrovoid-like struc-
ture in its morphology due to the formation of polymer-lean
phase zones into the polymeric solution configuration during the
phase inversion process.28 The main relevant differences observed
in the morphology of doped membranes compared to the neat
PES membrane are a decrease of skin membrane layer thickness
and an enhanced connectivity and uniformity of pores along the
membrane structure. As a consequence of these morphological
changes, it is expected to observe an increase of water transport
through the membrane, i.e., a higher membrane permeability.
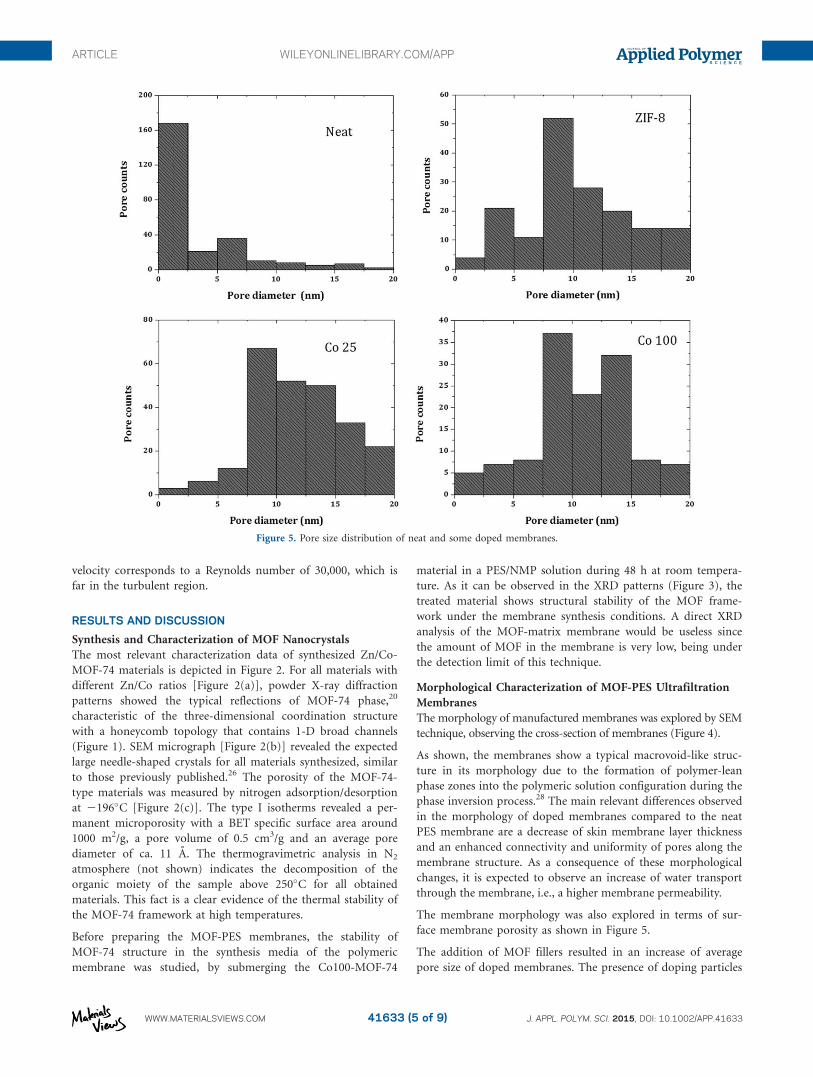
The membrane morphology was also explored in terms of sur-
face membrane porosity as shown in Figure 5.
The addition of MOF fillers resulted in an increase of average
pore size of doped membranes. The presence of doping particles
Figure 5. Pore size distribution of neat and some doped membranes.
ARTICLE WILEYONLINELIBRARY.COM/APP
WWW.MATERIALSVIEWS.COM J. APPL. POLYM. SCI. 2015, DOI: 10.1002/APP.4163341633 (5 of 9)
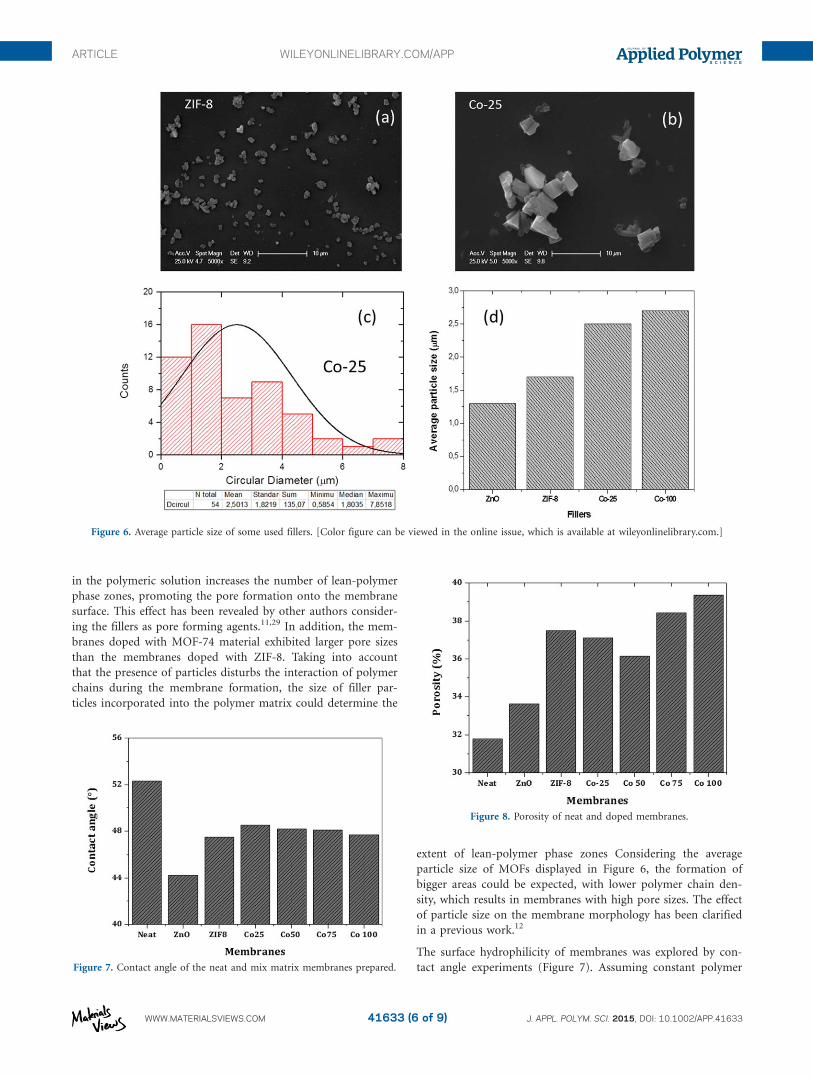
in the polymeric solution increases the number of lean-polymer
phase zones, promoting the pore formation onto the membrane
surface. This effect has been revealed by other authors consider-
ing the fillers as pore forming agents.11,29 In addition, the mem-
branes doped with MOF-74 material exhibited larger pore sizes
than the membranes doped with ZIF-8. Taking into account
that the presence of particles disturbs the interaction of polymer
chains during the membrane formation, the size of filler par-
ticles incorporated into the polymer matrix could determine the
extent of lean-polymer phase zones Considering the average
particle size of MOFs displayed in Figure 6, the formation of
bigger areas could be expected, with lower polymer chain den-
sity, which results in membranes with high pore sizes. The effect
of particle size on the membrane morphology has been clarified
in a previous work.12
The surface hydrophilicity of membranes was explored by con-
tact angle experiments (Figure 7). Assuming constant polymer
Figure 6. Average particle size of some used fillers. [Color figure can be viewed in the online issue, which is available at wileyonlinelibrary.com.]
Figure 7. Contact angle of the neat and mix matrix membranes prepared.
Figure 8. Porosity of neat and doped membranes.
ARTICLE WILEYONLINELIBRARY.COM/APP
WWW.MATERIALSVIEWS.COM J. APPL. POLYM. SCI. 2015, DOI: 10.1002/APP.4163341633 (6 of 9)

and filler concentrations during preparation of doped mem-
branes, the observed differences of the contact angles should be
attributed to the effect of the fillers on the casting solution. The
neat PES membrane exhibited the most hydrophobic surface.
The incorporation of hydrophilic fillers near the membrane skin
layer decreased the contact angles of water droplets deposited
onto the membrane surface. This effect could be explained by
the higher affinity of metal oxide and metal clusters of MOFs to
water, strengthening the interaction between them and hence
the membrane surface wetting. In addition, when pore diameter
increases (Figure 5), more water can be absorbed by the mem-
brane structure during the contact angle experiments. The low-
est contact angle observed for the ZnO doped membrane can
be associated to the highest metal content of this filler type in
comparison with the absolute metal content in MOFs particles.
The membrane porosity was also investigated by water-uptake
experiments as shown in Figure 8. In general, the incorporation
of particles promoted an increase of free volume into the mem-
brane structure. In comparison with metal oxide (ZnO) the
addition of MOFs into the membrane structure showed a more
pronounced effect on the membrane porosity. It is difficult to
relate these results with the macrovoid configuration of the
polymer matrix observed for the tested membranes (Figure 4);
however, the presence of less dense top layer and better connec-
tivity between the surface and inner pores of MOFs doped
membrane could increase the water absorption by the
membrane.
Membrane Permeation
Ultrafiltration experiments were carried out to study the perme-
ation performance of the synthesized membranes. Pure water
membrane flux was measured when the membrane performance
reached the stationary state on flux Figure 9 shows the mem-
brane permeation potential in terms of pure water flux.
The addition of particles to membranes enhances the water flux
through them, due to the increased hydrophilic character of the
PES membranes when adding the fillers. As previously
explained, the higher affinity of metal oxide and metal clusters
of MOFs for water increases the hydrophilicity of the membrane
and consequently the pure permeate flux also increases. Com-
paring the pure water flux among the membranes with MOF
materials, it can be observed that the membrane containing Co-
100-MOF 74 material shows the highest water permeate flux,
possibly due tothe higher porosity of the membrane. As
observed in Figure 8, the membrane with Co-100-MOF 74
shows the largest porosity leading to a higher permeability.
In order to explore the selectivity and fouling performance of
the membranes, permeation experiments for 200 mg/L BSA
solution were conducted at 2 bar of transmembrane pressure as
shown in Figure 10.
In all cases the doped membranes exhibited higher fluxes than
the neat PES membrane, increasing the rejection as result of
MOF particle incorporation. This last effect is very interesting
considering the desired balance between permeation and selec-
tivity of membranes. Considering the steric interaction between
the membrane and the solute, it is common to observe a reverse
trend between permeation and rejection as a result of increased
membrane average pore size. In this study, adsorption of BSA
molecules onto the surface and inner structure of membranes is
prevented by the hydrophilic character of doping particles, lead-
ing to higher values of flux and rejection. The undesired hydro-
phobic interactions that take place between the model foulant
(BSA) and the polymeric material are mitigated by the
Figure 9. Membranes permeability determined at 2 bar of transmembrane
pressure.
Figure 10. (a) Permeate flux and (b) rejections for BSA aqueous solution obtained using prepared membranes.
ARTICLE WILEYONLINELIBRARY.COM/APP
WWW.MATERIALSVIEWS.COM J. APPL. POLYM. SCI. 2015, DOI: 10.1002/APP.4163341633 (7 of 9)
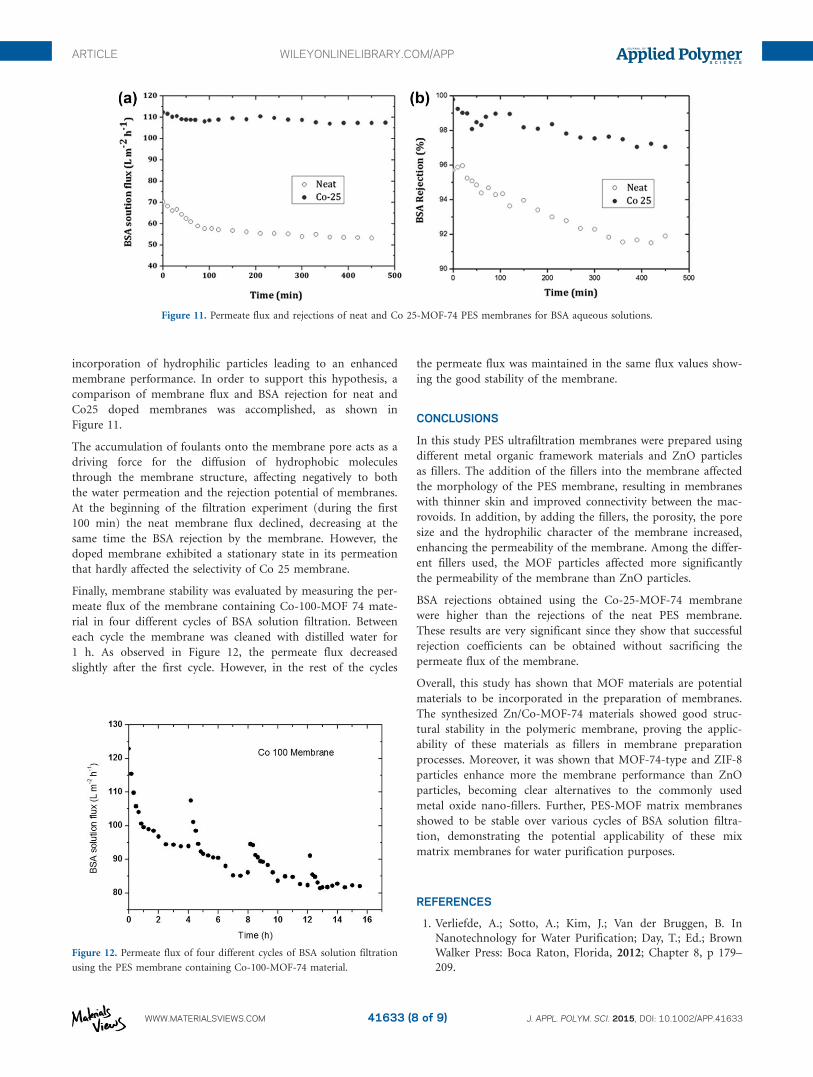
incorporation of hydrophilic particles leading to an enhanced
membrane performance. In order to support this hypothesis, a
comparison of membrane flux and BSA rejection for neat and
Co25 doped membranes was accomplished, as shown in
Figure 11.
The accumulation of foulants onto the membrane pore acts as a
driving force for the diffusion of hydrophobic molecules
through the membrane structure, affecting negatively to both
the water permeation and the rejection potential of membranes.
At the beginning of the filtration experiment (during the first
100 min) the neat membrane flux declined, decreasing at the
same time the BSA rejection by the membrane. However, the
doped membrane exhibited a stationary state in its permeation
that hardly affected the selectivity of Co 25 membrane.
Finally, membrane stability was evaluated by measuring the per-
meate flux of the membrane containing Co-100-MOF 74 mate-
rial in four different cycles of BSA solution filtration. Between
each cycle the membrane was cleaned with distilled water for
1 h. As observed in Figure 12, the permeate flux decreased
slightly after the first cycle. However, in the rest of the cycles
the permeate flux was maintained in the same flux values show-
ing the good stability of the membrane.
CONCLUSIONS
In this study PES ultrafiltration membranes were prepared using
different metal organic framework materials and ZnO particles
as fillers. The addition of the fillers into the membrane affected
the morphology of the PES membrane, resulting in membranes
with thinner skin and improved connectivity between the mac-
rovoids. In addition, by adding the fillers, the porosity, the pore
size and the hydrophilic character of the membrane increased,
enhancing the permeability of the membrane. Among the differ-
ent fillers used, the MOF particles affected more significantly
the permeability of the membrane than ZnO particles.
BSA rejections obtained using the Co-25-MOF-74 membrane
were higher than the rejections of the neat PES membrane.
These results are very significant since they show that successful
rejection coefficients can be obtained without sacrificing the
permeate flux of the membrane.
Overall, this study has shown that MOF materials are potential
materials to be incorporated in the preparation of membranes.
The synthesized Zn/Co-MOF-74 materials showed good struc-
tural stability in the polymeric membrane, proving the applic-
ability of these materials as fillers in membrane preparation
processes. Moreover, it was shown that MOF-74-type and ZIF-8
particles enhance more the membrane performance than ZnO
particles, becoming clear alternatives to the commonly used
metal oxide nano-fillers. Further, PES-MOF matrix membranes
showed to be stable over various cycles of BSA solution filtra-
tion, demonstrating the potential applicability of these mix
matrix membranes for water purification purposes.
REFERENCES
1. Verliefde, A.; Sotto, A.; Kim, J.; Van der Bruggen, B. In
Nanotechnology for Water Purification; Day, T.; Ed.; Brown
Walker Press: Boca Raton, Florida, 2012; Chapter 8, p 179–
209.
Figure 11. Permeate flux and rejections of neat and Co 25-MOF-74 PES membranes for BSA aqueous solutions.
Figure 12. Permeate flux of four different cycles of BSA solution filtration
using the PES membrane containing Co-100-MOF-74 material.
ARTICLE WILEYONLINELIBRARY.COM/APP
WWW.MATERIALSVIEWS.COM J. APPL. POLYM. SCI. 2015, DOI: 10.1002/APP.4163341633 (8 of 9)
2. Waly, T.; Kennedy, M. D.; Witkamp, G. T-J.; Amy, G.;
Schippers, J. C. Desalination 2012, 284, 279.
3. Tang, C. Y.; Chong, T. H.; Fane, A. G. Adv. Colloid Interface Sci.
2011, 164, 126.
4. Lee, S.; Choi, J.-S.; Lee, C.-H. Desalination 2009, 238, 109.
5. Kim, D.; Jung, S.; Sohn, J.; Kim, H.; Lee, S. Desalination
2009, 238, 43.
6. Nguyen, T.-V.; Pendergast, M. T. M.; Phong, M. T.; Jin, X.; Peng, F.;
Lind, M. L.; Hoek, E. M. V. Desalination 2014,338, 1.
7. Tang, C. Y.; Chong, T. H.; Fane, A. G. Adv. Colloid Interface Sci.
2011, 164, 126.
8. Sotto, A.; Boromand, A.; Zhang, R.; Luis, P.; Arsuaga, J. M.;
Kim, J.; Van der Bruggen, B. J. Colloid Interface Sci. 2011,
363, 540.
9. Kim, S. H.; Kwak, S.-Y.; Sohn, B.-H.; Park, T. H. J. Membr.
Sci. 2003, 211, 157.
10. Qu, F.; Liang, H.; Zhou, J.; Nan, J.; Shao, S.; Zhang, J.; Li,
G. J. Membr. Sci. 2014, 449, 58.
11. Hoek, E. M. V.; Ghosh, A. K.; Huang, X.; Liong, M.; Zink,
J. Desalination 2011, 283, 89.
12. Arsuaga, J. M.; Sotto, A.; del Rosario, G.; Mart�ınez, A.; Molina,
S.; Teli, S. B.; de Abajo, J. J. Membr. Sci. 2013, 428, 131.
13. Mollahosseini, A.; Rahimpour, A.; Jahamshahi, M.; Peyravi,
M.; Khavarpour, M. Desalination 2012, 306, 41.
14. Crock, C. A.; Rogensues, A. R.; Shan, W.; Tarabara, V. V.
Water Res. 2013, 47, 3984.
15. Taurozzi, J. S.; Arul, H.; Bosak, V. Z.; Burban, A. F.; Voice, T. C.;
Bruening, M. L.; Tarabara, V. V. J. Membr. Sci. 2008, 325, 58.
16. Reed, R. B.; Ladner, D. A.; Higgins, C. P.; Westerhoff, P.;
Ranville, J. F. Environ. Toxicol. Chem. 2012, 31, 93.
17. Li, Q. L.; Mahendra, V.; Lyon, D. Y.; Brunet, L.; Liga, M. V.;
Li, D.; Alvarez, P. J. J. Water Res. 2008, 42, 4591.
18. Furukawa, H.; Cordova, K. E.; O’Keeffe, M.; Yaghi, O. M.
Science 2013, 341, 974.
19. K€usgens, P.; Rose, M.; Senkovska, I.; Fr€ode, H.; Henschel,
A.; Siegle, S.; Kaskel, S. Microporous Mesoporous Mat. 2009,
120, 325.
20. Rosi, N.; Kim, J.; Eddaoudi, M.; Chen, B.; O’Keeffe, M.;
Yaghi, O. M. J. Am. Chem. Soc. 2005, 127, 1504.
21. Rowsell, J.; Yaghi, O. M. J. Am. Chem. Soc. 2006, 128, 1304.
22. Bhattacharjee, S.; Choi, J.-S.; Yang, S.-T.; Choi, S.; Kim, J.;
Ahn, W.-S. J. Nanosci. Nanotechnol. 2010, 10, 135.
23. Dietzel, P.; Morita, Y.; Blom, R.; Fjellv, H. Angew. Chem. Int.
Ed. 2005, 44, 6354.
24. Dietzel, P.; Panella, B.; Hirscher, M.; Blom, R.; Fjellv, H.
Chem. Commun. 2006, 959.
25. Dietzel, P. D. C.; Johnsen, R. E.; Blom, R.; Fjellvag, H.
Chem. Eur. J. 2008, 14, 2389.
26. Botas, J. A.; Calleja, G.; S�anchez-S�anchez, M.; Orcajo, G. Int.
J. Hydrogen Energy 2011, 36, 10834.
27. Arsuaga, J. M.; Sotto, A.; L�opez-Mu~noz, M. J.; Braeken, L. J. Membr.
Sci. 2011, 372, 380.
28. Boom, R. M.; Wlenk, I. M.; van den Boomgaard, Th.;
Smolders, C. A. J. Membr. Sci. 1992, 73, 277.
29. Vatampour, V.; Esmaeili, M.; Farahani, M. H. D. A. J. Membr.
Sci. 2014, 466, 70.
ARTICLE WILEYONLINELIBRARY.COM/APP
WWW.MATERIALSVIEWS.COM J. APPL. POLYM. SCI. 2015, DOI: 10.1002/APP.4163341633 (9 of 9)