preferential water flow through corn canopy and soil water dynamics across rows
TRANSCRIPT
Preferential Water Flow Through Corn Canopy and Soil Water Dynamics Across RowsI. C. Paltineanu and J. L. Starr*
ABSTRACTSmall-scale and spatially dependent variation in real-time soil water
dynamics, caused largely by agricultural practices, is not well under-stood. Objectives of this study were (i) to quantify the preferentialstemflow vs. throughfall of water under rainfall and sprinkler irrigationduring the closed corn (Zea mays L.) canopy period and from senes-cence to harvest, and (ii) to quantify in real time the correspondingrow and interrow soil water dynamics under multiple annual no-tillageand plow-tillage corn experiments. Water redistribution through thecorn canopy was studied for a 2-yr period, with stemflow measuredby placing flexible polyethylene bags on plants, and throughfall byplacing jars between corn rows. Soil water dynamics was studied fora 3-yr period, with multisensor capacitance probes and a monitoringsystem at five-row and interrow positions for each tillage. Highlysignificant (P < 0.001) linear positive relationships were found be-tween both stemflow (.V,) and average throughfall (7V) to rainfall. Aninverse third-order relationship was found between the ratio of .SY//Vand rainfall. Real-time soil water dynamics data showed that thesmaller rainfall events ( 1 5 mm) resulted in a significant (/' < 0.05)water infiltration advantage for the no-tillage in-row position com-pared with the no-tillage interrow positions and compared with theplow-tillage in-row position. These results were consistent with thestemflow vs. throughfall data obtained under the closed corn canopy.Real-time soil water dynamics vs. rainfall intensity at different soillayers showed the importance of rainfall and sprinkler irrigation redis-tribution induced by the canopy, type of tillage, and position acrosscorn rows.
R;CENT DEVELOPMENT of different monitoring systemsfor studying real-time soil water content over large
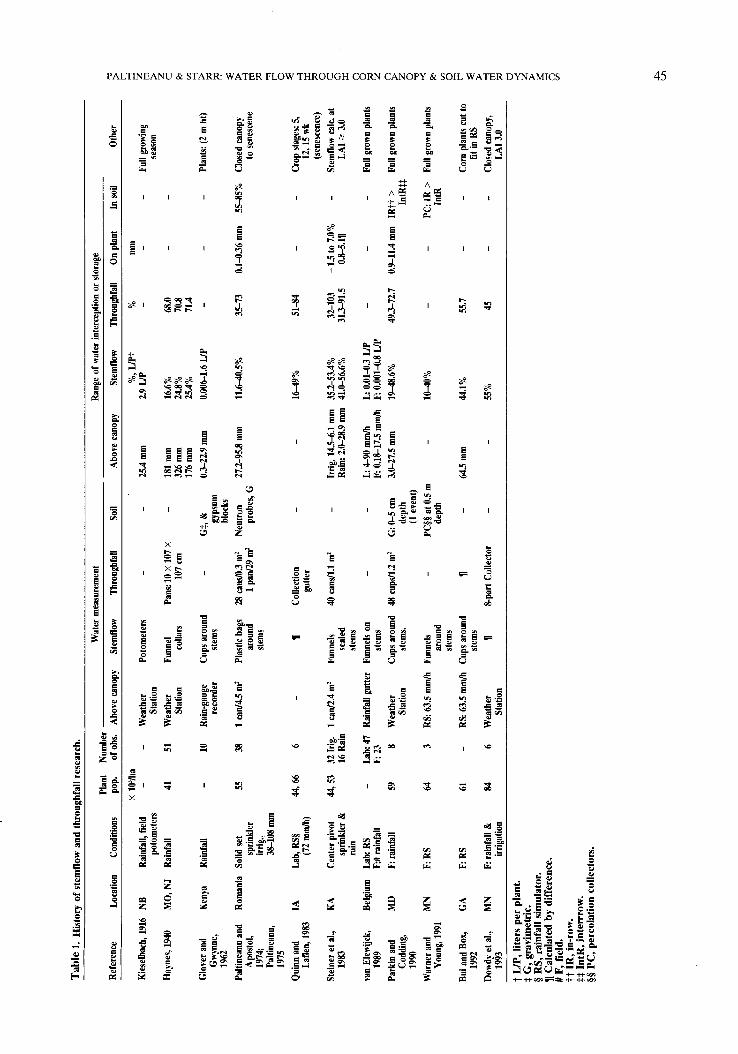
areas, as well as concern for the fate of water and chemi-cals under no-till vs. conventionally tilled corn, requirereevaluation of water partitioning through the corn can-opy and the corresponding movement into the soil pro-file. Water redistribution through corn canopies hasbeen studied for more than 80 years in North America,Europe, and Africa with different objectives, methodol-ogies, and instrumentation (Table 1). Kiesselbach(1916) reported measurements of direct corn stemflowusing potometers under the rainfall conditions of Ne-braska. Several experimenters have attempted directstemflow measurement by placing different homemadecollection cups or funnels around the base of the cornplants (Haynes, 1940; Glower and Gwynne, 1962;Steiner at al., 1983; van Elewijck, 1989; Parkin and Cod-ling, 1990; Warner and Young, 1991; Bui and Box, 1992).In one study, flexible plastic bags were placed at thebase of corn plants in the field, and accumulated waterwas extracted with a large syringe after sprinkler irriga-tion applications (Paltineanu and Apostol, 1974; Palti-
I.C. Paltineanu and J.L. Starr, USD A-ARS, Environmental ChemistryLab., Beltsville, MD 20705-2350; I.C. Paltineanu, Paltin Int. Inc., 6309Sandy St., Laurel, MD 20707. Received 30 Mar. 1998. *Correspondingauthor ([email protected]).
Published in Soil Sci. Soc. Am. J. 64:44-54 (2000).
neanu, 1975). Water collected as direct corn stemflowvaried greatly, generally ranging from 12 to 57% ofthe water collected at the crop canopy, under differentrainfall or sprinkler irrigation occurrences (Table 1).Direct measurements of throughfall have been per-formed by placing water-collection cans across cornrows and large pans between corn rows (Haynes, 1940;Paltineanu and Apostol, 1974; Paltineanu, 1975; Quinnand Laflen, 1983; Steiner et al., 1983; Parkin and Cod-ling, 1990; Dowdy et al., 1993). Water collected as aver-age throughfall between the corn rows also variedgreatly, generally ranging from 35 to 84% of water col-lected at the crop canopy (Table 1). Direct measure-ments of water remaining on the plants after sprinklerirrigation represented 0.1 to 0.36 mm, under an applica-tion rate of 6 mm h"1 (Paltineanu and Apostol, 1974;Paltineanu, 1975). In another study, plant-interceptedwater was calculated by difference and found to rangefrom 0.5 to 7.0 mm under center-pivot sprinkler irriga-tion (Steiner et al., 1983). Only a few studies reporteda complete water balance in the soil-plant-atmospheresystem using discrete soil water content measurementsby neutron thermalization and/or gravimetric methodsdown to 150 cm (Paltineanu and Apostol, 1974; Palti-neanu, 1975) and down to 90 cm (Shanholtz and Young,1994). Spatial (across corn rows) and temporal distribu-tion (every 1-2 d) of soil water content in the tilledlayer (0-20 cm) of a corn crop was studied by van Wes-enbeek and Kachanoski (1988), using permanentlyplaced time domain reflectometry (TDR) transmission-line probes. Waddell and Weil (1996) studied waterredistribution in soil weekly, under ridge-till and no-tillcorn, using tensiometers (15-90 cm depths) placed atthe in-row and non-traffic interrow positions.
This review shows the lack of information on theinteractive dynamics of water redistribution throughcorn canopies and associated preferential patterns ofwater movement into and through the soil. New technol-ogies now provide the capability for observing the dy-namics of water movement into the soil profile in realtime. Thus the objectives of this study were (i) to quan-tify the preferential stemflow vs. throughfall of waterunder rainfall and sprinkler irrigation during the closedcorn canopy period and from senescence to harvest,and (ii) to quantify in real time (10-min intervals) thecorresponding row and interrow soil water dynamics(5-55 cm) under multiple annual no-tillage and plow-tillage corn experiments.
MATERIALS AND METHODSField experiments were conducted on a Mattapex silt loam
(fine-silty, mixed, active, mesic Aquic Hapludult) soil at theBeltsville Agricultural Research Center, Beltsville, MD. The
Abbreviations: LAI, leaf area index; TDR, time domain reflectometry.
44
Tab
le 1
. H
istor
y of
ste
mflo
w a
nd th
roug
hfal
l res
earc
h.
Refe
renc
e Lo
catio
n
Kies
elbac
h, 19
16
NB
Hayn
es, 1
940
MO,
NJ
Glov
er a
nd
Keny
aGw
ynne
,19
62Pa
ltine
anu
and
Rom
ania
Apos
tol,
1974
;Pa
ltine
anu,
1975
Quin
n an
d IA
Lafle
n, 19
83
Stein
er e
t al.,
KA19
83
van
Elew
ijck,
Belg
ium
1989
Park
in a
nd
MD
Codd
ing,
1990
War
ner a
nd
MN
Youn
g, 19
91
Bui a
nd B
ox,
GA19
92Do
wdy
et al.
, M
N19
93t
L/P
, lite
rs p
er p
lant
.t
G, g
ravi
met
ric.
§ R
S, ra
infa
ll si
mul
ator
.
Cond
ition
s
Rain
fall,
field
poto
mete
rsRa
infa
ll
Rain
fall
Solid
set
sprin
kler
irrig
.,38
-108
mm
Lab,
RS§
(72
mm/h)
Cent
er p
ivot
sprin
kler
&ra
inLa
b: RS
F:# ra
infa
llF:
rainf
all
F:RS
F:RS
F: ra
infall
&irr
igati
on
Plan
t Nu
mbe
rpo
p. of
obs
.
x lO
Vha
- 41
51 10
55
38
44,6
6 6
44, 5
3 32
Irig
.16
Rai
n
Lab:
47F:
2359
8
64
3
61 84
6
Wate
r mea
sure
men
t
Abov
e ca
nopy
Wea
ther
Stati
onW
eath
erSt
ation
Rain
-gau
gere
cord
er
1 ca
n/4.5
m2
_
1 ca
n/2.4
m!
Rain
fall
gutte
r
Wea
ther
Stati
on
RS: 6
3.5 m
m/h
RS: 6
3.5 m
m/h
Wea
ther
Stati
on
Stem
flow
Poto
mete
rs
Funn
el colla
rs
Cups
aro
und
stem
s
Plas
tic b
ags
arou
ndste
ms 11
Funn
els seale
dste
ms
Funn
els o
nste
ms
Cups
aro
und
stem
s.
Funn
els arou
ndste
ms
Cups
aro
und
stem
s 11
Thro
ughf
all
Soil
Abov
e ca
nopy
25.4
mm
Pans
: 10
x 10
7 x
- 18
1 m
m10
7 cm
32
6 mm
176m
mG
t, &
0.3
-22.9
mm
gyps
umbl
ocks
28 ca
ns/0.
3 m2
Neut
ron
27.2-
95.8
mm
1 pa
n/29
m2
prob
es, G
Colle
ction
gutte
r
40 c
ans/1
.1 m
2 -
Irrig
. 14.5
-6.1
mm
Rain:
2.0-
28.9
mm
- L:
4-90
mm/
hF:
0.18
-17.5
mm
/h48
cups
/1.2
m!
G: 0
-5 cm
3.0
-27.5
mm
dept
h(1
even
t)PC
§§ at
0.5
mde
pth
H -
64.5
mm
8-pa
rt Co
llecto
r
Rang
e of
wate
r int
erce
ptio
n or
stor
age
Stem
flow
%, L
/Pt
2.9 L
/P
16.6%
24.8%
25.4%
0.006
-1.6
L/P
11.6-
40.5%
16-4
9%
35.2-
53.4%
41.0-
56.6%
L: 0
.01-0
.3 L
/PF:
0.00
1-0.8
L/P
19-4
8.6%
10-4
0%
44.1%
55%
Thro
ughf
all
% - 68.0
70.8
71.4 _
35-7
3
51-&
4
32-1
0331
.3-91
.5
-
49.3-
72.7
- 55.7 45
On p
lant
In so
il Ot
her
mm
Full
grow
ing
seas
on_
Plan
ts: (2
m h
t)
0.1-0
36 m
m
55-8
5%
Clos
ed c
anop
yto
sene
scen
e
Crop
stag
es: 5
,12
, 15
wk(se
nesc
ence
)-1
.5 to
7.0%
-
Stem
flow
calc.
at
0.8-5.
111
LAI
a 3.
0
Full
grow
n pl
ants
0.9-1
1.4 m
m
IRft
> Fu
ll gr
own
plan
tsIn
tRft
PC: I
R >
Full
grow
n pl
ants
IntR
Com
plan
ts cu
t to
fit in
RS
Clos
ed c
anop
y,LA
I 3.0
H C
alcu
late
d by
diff
eren
ce.
> 3 m z R? H 73 7? § 73 >fl B̂ 73 0 C O ffi O o z o z 0 •o 2 I/O o r 3 3 73 O ? s o#
F, f
ield
.ft
IR
, in-
row
.tt
Int
R, i
nter
rrow
.§§
PC
, per
cola
tion
colle
ctor
s.
46 SOIL SCI. SOC. AM. J., VOL. 64, JANUARY-FEBRUARY 2000
UJo
1
ROWS & INTERROWPOSITIONS. . .
R2.5 WHEEL TRAFFICR3.0 INRGW • -
• R3.S NON-TRAFFICR4.0 INROW ' •
R4.5 WHEEL TRAFFIC
I—— ———
• R2.5 WHEEL TRAFFIC• * R3.0 INROW • •• R3.5 NON-TRAFFIC
- •• R4.0 INROW • •
• R4.5 WHEEL TRAFFICUJ JJJ UJ ill J_|_| ill ijTT1 TT1TT1 ftl Tn TT1T
10 15
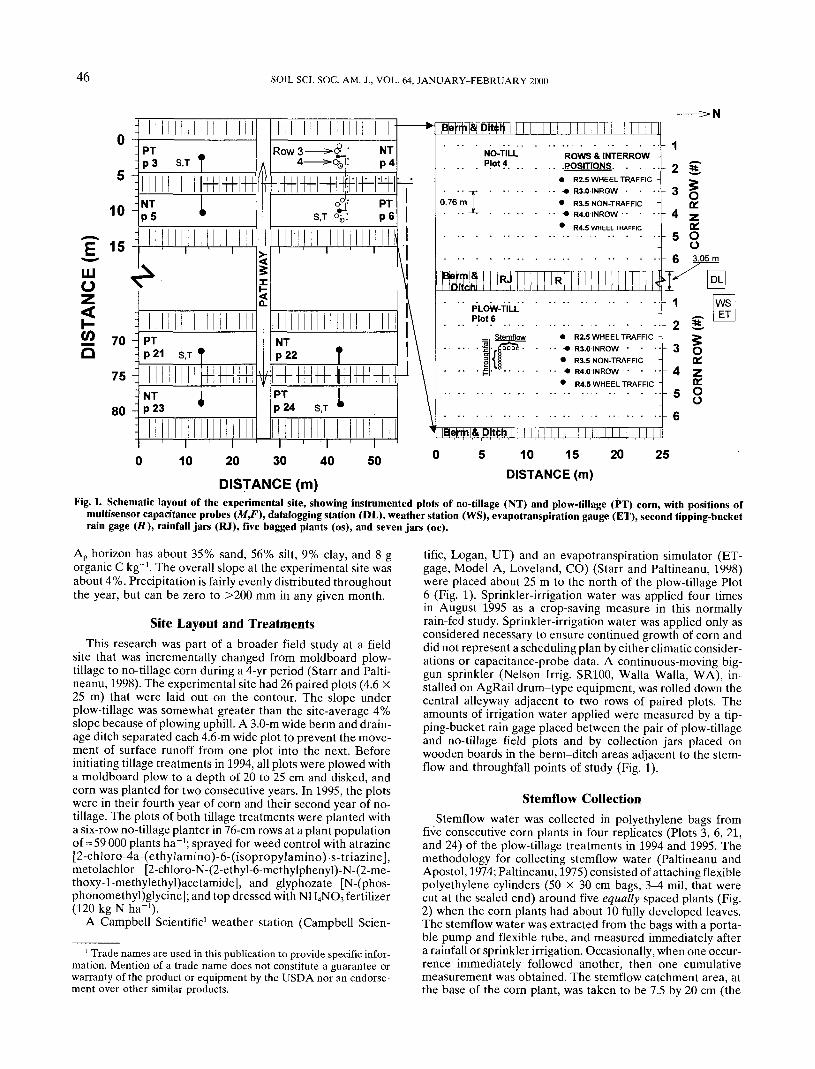
DISTANCE (m) DISTANCE^,Fig. 1. Schematic layout of the experimental site, showing instrumented plots of no-tillage (NT) and plow-tillage (PT) corn, with positions of
multisensor capacitance probes (Mf), datalogging station (DL), weather station (WS), evapotranspiration gauge (ET), second tipping-bucketrain gage («), rainfall jars (RJ), five bagged plants (os), and seven jars (oc).
Ap horizon has about 35% sand, 56% silt, 9% clay, and 8 gorganic C kg"1. The overall slope at the experimental site wasabout 4%. Precipitation is fairly evenly distributed throughoutthe year, but can be zero to >200 mm in any given month.
Site Layout and TreatmentsThis research was part of a broader field study at a field
site that was incrementally changed from moldboard plow-tillage to no-tillage corn during a 4-yr period (Starr and Palti-neanu, 1998). The experimental site had 26 paired plots (4.6 X25 m) that were laid out on the contour. The slope underplow-tillage was somewhat greater than the site-average 4%slope because of plowing uphill. A 3.0-m wide berm and drain-age ditch separated each 4.6-m wide plot to prevent the move-ment of surface runoff from one plot into the next. Beforeinitiating tillage treatments in 1994, all plots were plowed witha moldboard plow to a depth of 20 to 25 cm and disked, andcorn was planted for two consecutive years. In 1995, the plotswere in their fourth year of corn and their second year of no-tillage. The plots of both tillage treatments were planted witha six-row no-tillage planter in 76-cm rows at a plant populationof=59 000 plants ha"1; sprayed for weed control with atrazine[2-chloro-4a-(ethylamino)-6-(isopropylamino)-s-triazine],metolachlor [2-chloro-N-(2-ethyl-6-methylphenyl)-N-(2-me-thoxy-l-methylethyl)acetamide], and glyphozate [N-(phos-phonomethyl)glycine]; and top dressed with NH4NO3 fertilizer(120 kg N ha"1).
A Campbell Scientific1 weather station (Campbell Scien-
1 Trade names are used in this publication to provide specific infor-mation. Mention of a trade name does not constitute a guarantee orwarranty of the product or equipment by the USDA nor an endorse-ment over other similar products.
tific, Logan, UT) and an evapotranspiration simulator (ET-gage, Model A, Loveland, CO) (Starr and Paltineanu, 1998)were placed about 25 m to the north of the plow-tillage Plot6 (Fig. 1). Sprinkler-irrigation water was applied four timesin August 1995 as a crop-saving measure in this normallyrain-fed study. Sprinkler-irrigation water was applied only asconsidered necessary to ensure continued growth of corn anddid not represent a scheduling plan by either climatic consider-ations or capacitance-probe data. A continuous-moving big-gun sprinkler (Nelson Irrig. SR100, Walla Walla, WA), in-stalled on AgRail drum-type equipment, was rolled down thecentral alleyway adjacent to two rows of paired plots. Theamounts of irrigation water applied were measured by a tip-ping-bucket rain gage placed between the pair of plow-tillageand no-tillage field plots and by collection jars placed onwooden boards in the berm-ditch areas adjacent to the stem-flow and throughfall points of study (Fig. 1).
Stemflow CollectionStemflow water was collected in polyethylene bags from
five consecutive corn plants in four replicates (Plots 3, 6, 21,and 24) of the plow-tillage treatments in 1994 and 1995. Themethodology for collecting Stemflow water (Paltineanu andApostol, 1974; Paltineanu, 1975) consisted of attaching flexiblepolyethylene cylinders (50 X 30 cm bags, 3̂ 1 mil, that werecut at the sealed end) around five equally spaced plants (Fig.2) when the corn plants had about 10 fully developed leaves.The Stemflow water was extracted from the bags with a porta-ble pump and flexible tube, and measured immediately aftera rainfall or sprinkler irrigation. Occasionally, when one occur-rence immediately followed another, then one cumulativemeasurement was obtained. The Stemflow catchment area, atthe base of the corn plant, was taken to be 7.5 by 20 cm (the

PALTINEANU & STARR: WATER FLOW THROUGH CORN CANOPY & SOIL WATER DYNAMICS 47
Fig. 2. Photo showing collection of stemflow in bagged plants andthroughfall in jars. Arrows point to water level in two bags.
average distance between plants). The leaf area index (LAI)was measured with a LI-COR 3100 leaf-area meter (LI-COR,Lincoln, NE) on 1 Aug. 1994 and 23 Aug. 1995, from threeequally spaced plants in four plots (3, 6, 21, 24) on the samerow as the stemflow measurements.
Throughfall CollectionThroughfall was measured at 0.5 to 1 m from the stemflow
locations (Fig. 1). Seven glass jars (7.5-cm opening) wereplaced side-by-side on a wooden board (Fig. 2), perpendicularto, and between, Rows 3 and 4 where corn plants were equallyspaced in both rows. The end jars were positioned 5 cm fromthe stems of the corn plants in Rows 3 and 4. Oil was addedto each jar to prevent evaporation after rainfall or irrigation.Water volumes were measured in each jar with eachthroughfall event. This close-pack arrangement of sample jarsresulted in direct sampling of 55% of the 7.5- by 76-cm in-terrow rectangle.
Soil Water MonitoringTen of 16 EnviroSCAN (Sentek Pty, Kent Town, South
Australia) multisensor capacitance probes were installedshortly after planting corn in 2 of the 26 field plots (Fig. 1)for three consecutive years (1995-1997). The other six probeswere placed at the non-traffic interrow position in six plotsas part of a separate study on spatial variability (Starr andPaltineanu, 1998). Probes were placed at different locationswithin the plots each year, with sensors always placed at depthsof 10, 20, 30, and 50 cm on each probe. Probes were placedin each tillage replicate at the in-row positions (R3, R4) and
30 -
25 -
U. 15 -
10 -
July 19 to October 11949-1997, n = 13421994-1997. n = 93
0 10 7020 30 40 50
RAINFALL (mm)Fig. 3. Summer rainfall distributions at Beltsville, MD, from 1949-
1997 and for 1994-1997.
at the wheel-traffic interrow positions (R2.5, R4.5); and anon-replicated probe was placed at the non-traffic interrowposition (R3.5). After completing probe installation andhookup to the datalogging station, as described by Starr andPaltineanu (1998), water contents were recorded at each sen-sor on 10-min intervals. The zone of major influence of thesensors represents a cylinder of soil, =10 cm along the axis ofthe probe, in a 10-cm ring around its PVC access pipe (Palti-neanu and Starr, 1997). The four sensing-depth intervals forthis probe configuration were 5- to 15-, 15- to 25-, 25- to 35-, and45- to 55-cm. Water content at each sensor may be expressed aseither a volumetric percentage or as a depth of water (mmper 10-cm soil depth).
TerminologyThe terms stemflow and throughfall commonly represent
dynamic flow of water (volume/area/time). However, for thepast 80 years, scientists have been measuring total accumu-lated volumes of rainfall or irrigation water coming from dif-ferent capture areas (the corn canopy for stemflow and theopenings of rainfall cans or pans for water throughfall betweencorn rows), divided by arbitrarily chosen redistribution areas.Redistribution in the soil profile of water coming via stemflowor throughfall has generally been studied by discrete soil watermeasurements at arbitrarily chosen time intervals (days,weeks), or before and after rainfall or sprinkler irrigations.We converted all measurements to cumulated water units ofheight (mm) for incoming rainfall or irrigation, evapotranspi-ration, canopy-redistributed water at the soil surface as stem-flow or throughfall, and in the soil as water storage in discrete10-cm layers and cumulatively in the soil profile (5-35 or5-55 cm).
Table 2. Amounts of sprinkler irrigation recorded near measurement positions of stemflow (S,) and throughfall (TF), and capacitanceprobes (CAP) in 1995.
Measuredbetween plots
3 and 5
4 and 6
21 and 23
22 and 24
MeasuredNEAR
CAPSf, TfCAPSf, TpCAPSTEMCAPSp, Tf
Day of year
213
19.020.617.521.S36.242.050.252.2
216
36.235.929.735.0
___-
234
45.250.623.137.341.448.825.332.5
241
34.835.332.135.929.836.223.129.6
Total
135.2142.4102.4129.7107.4127.098.6
114.3
Distancebetween pointsf
3
7
5
7
t Distance from CAP to stemflow and throughfall collections.
48 SOIL SCI. SOC. AM. J., VOL. 64, JANUARY-FEBRUARY 2000
250
200 -
EE
I150 -
100 -LLJ
50 -
0
40 -
Iooa:
30 -
20 -
10 -
STEMFLOWo 1994 Rain• 1995 RainV 1995 Irrigation
——— SF = 3.9 + 3.04 R_ _ SF = 6.0 + 3.27 (R,I)
THROUGHFALLo 1994 Rain• 1995 RainV 1995 Irrigation
——— TF = -0.9 + 0.44 R_ _ TF = -0.7 + 0.42 (R,I)
30
JjQ.2 go_1u.m
. te
10 20 30 40 50 60
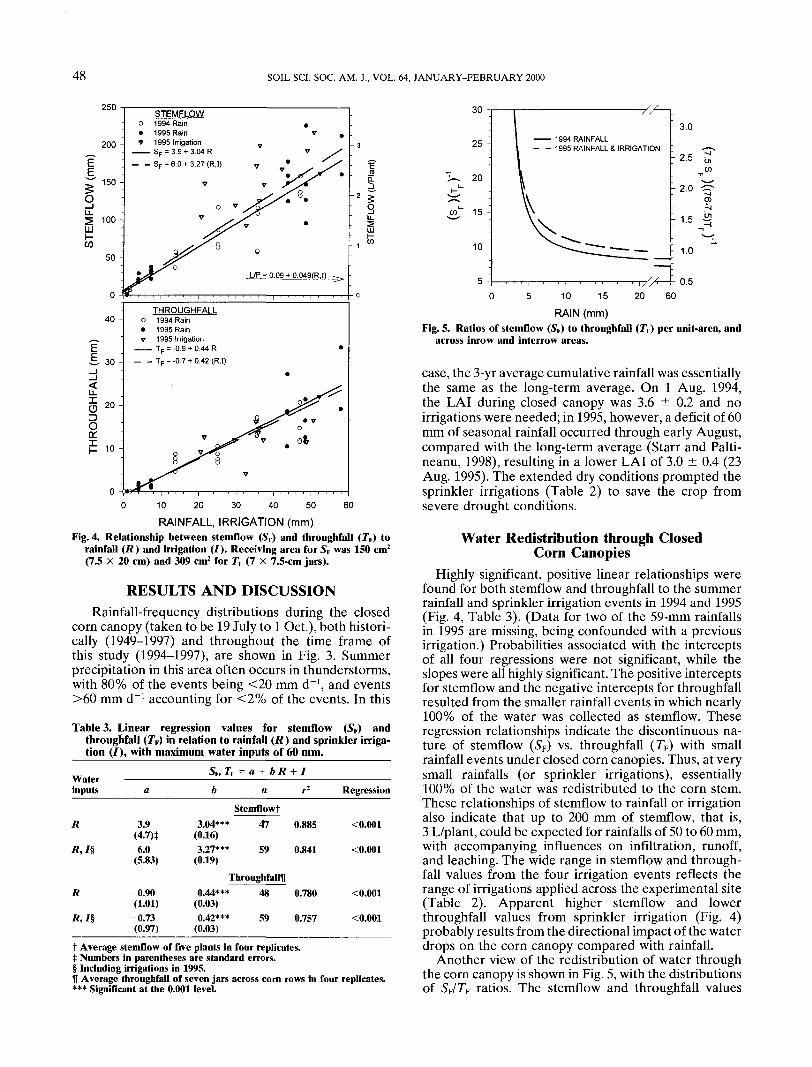
RAINFALL, IRRIGATION (mm)Fig. 4. Relationship between stemflow (5F) and throughfall (JF) to
rainfall (R) and irrigation (/). Receiving area for Sf was 150 cm2
(7.5 x 20 cm) and 309 cm2 for Tr (1 x 7.5-cm jars).
RESULTS AND DISCUSSIONRainfall-frequency distributions during the closed
corn canopy (taken to be 19 July to 1 Oct.), both histori-cally (1949-1997) and throughout the time frame ofthis study (1994-1997), are shown in Fig. 3. Summerprecipitation in this area often occurs in thunderstorms,with 80% of the events being <20 mm d"1, and events>60 mm d"1 accounting for <2% of the events. In this
Table 3. Linear regression values for stemflow (.S'F) andthroughfall (7F) in relation to rainfall (R) and sprinkler irriga-tion (/), with maximum water inputs of 60 mm.
Waterinputs
SF, JF = fl + 6 R
Regression
R 3.9 3.04***(0.16)
Stemflowf47 0.885 <0.001
«,/§ 6.0(5.83)
3.27***(0.19)
59 0.841 <0.001
ThroughfalinR
«,/§
-0.90(1.01)
-0.73(0.97)
0.44***(0.03)0.42***
(0.03)
48
59
0.780
0.757
<0.001
<0.001
t Average stemflow of five plants in four replicates.I Numbers in parentheses are standard errors.§ Including irrigations in 1995.H Average throughfall of seven jars across corn rows in four replicates.*** Significant at the 0.001 level.
25 -
20 -
co 15 -
10 -
——— 1994 RAINFALL- - 1995 RAINFALLS, IRRIGATION
- 3.0
r 2 5
- 2.0
- 1.5
- 1.0
- 0.50 5 10 15 20 60
RAIN (mm)Fig. 5. Ratios of stemflow (.S\) to throughfall (TV) per unit-area, and
across inrow and interrow areas.
case, the 3-yr average cumulative rainfall was essentiallythe same as the long-term average. On 1 Aug. 1994,the LAI during closed canopy was 3.6 ± 0.2 and noirrigations were needed; in 1995, however, a deficit of 60mm of seasonal rainfall occurred through early August,compared with the long-term average (Starr and Palti-neanu, 1998), resulting in a lower LAI of 3.0 ± 0.4 (23Aug. 1995). The extended dry conditions prompted thesprinkler irrigations (Table 2) to save the crop fromsevere drought conditions.
Water Redistribution through ClosedCorn Canopies
Highly significant, positive linear relationships werefound for both stemflow and throughfall to the summerrainfall and sprinkler irrigation events in 1994 and 1995(Fig. 4, Table 3). (Data for two of the 59-mm rainfallsin 1995 are missing, being confounded with a previousirrigation.) Probabilities associated with the interceptsof all four regressions were not significant, while theslopes were all highly significant. The positive interceptsfor stemflow and the negative intercepts for throughfallresulted from the smaller rainfall events in which nearly100% of the water was collected as stemflow. Theseregression relationships indicate the discontinuous na-ture of stemflow (SF) vs. throughfall (TF) with smallrainfall events under closed corn canopies. Thus, at verysmall rainfalls (or sprinkler irrigations), essentially100% of the water was redistributed to the corn stem.These relationships of stemflow to rainfall or irrigationalso indicate that up to 200 mm of stemflow, that is,3 L/plant, could be expected for rainfalls of 50 to 60 mm,with accompanying influences on infiltration, runoff,and leaching. The wide range in stemflow and through-fall values from the four irrigation events reflects therange of irrigations applied across the experimental site(Table 2). Apparent higher stemflow and lowerthroughfall values from sprinkler irrigation (Fig. 4)probably results from the directional impact of the waterdrops on the corn canopy compared with rainfall.
Another view of the redistribution of water throughthe corn canopy is shown in Fig. 5, with the distributionsof SF/TF ratios. The stemflow and throughfall values
PALTINEANU & STARR: WATER FLOW THROUGH CORN CANOPY & SOIL WATER DYNAMICS 49
1994 1995 1994 1995CLOSED CANOPY SENESCENCE
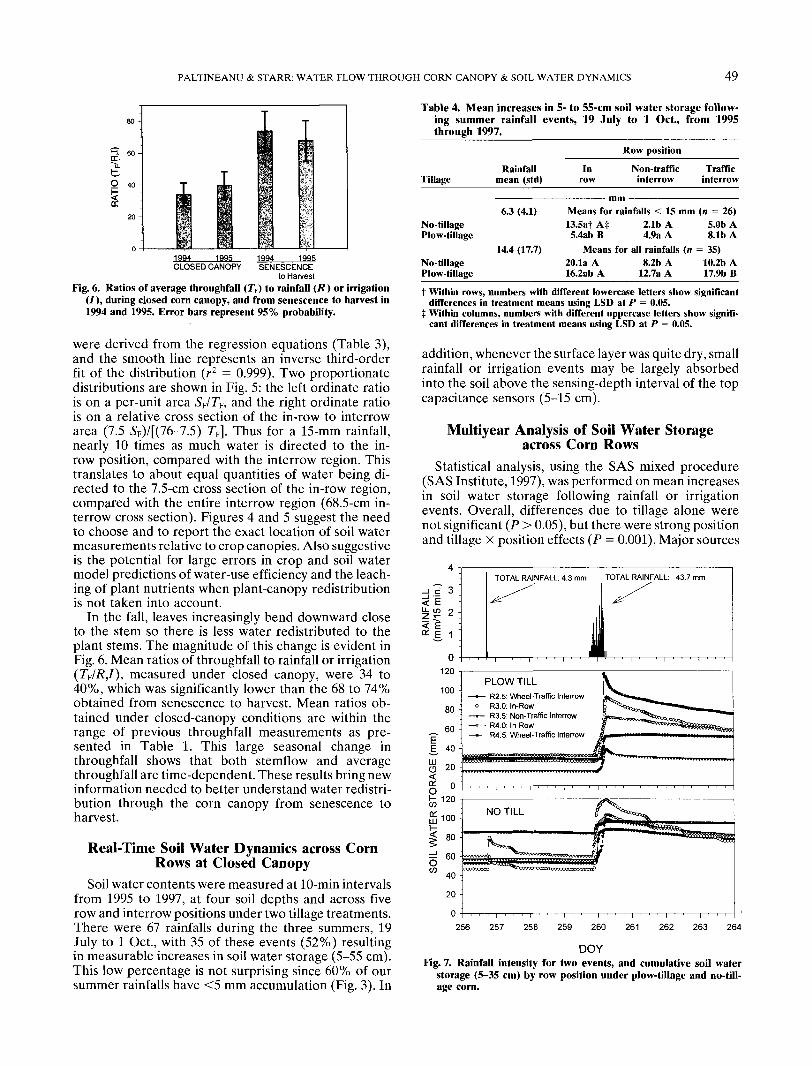
to HarvestFig. 6. Ratios of average throughfall ('/',) to rainfall (R) or irrigation
(/), during closed corn canopy, and from senescence to harvest in1994 and 1995. Error bars represent 95% probability.
were derived from the regression equations (Table 3),and the smooth line represents an inverse third-orderfit of the distribution (r2 = 0.999). Two proportionatedistributions are shown in Fig. 5: the left ordinate ratiois on a per-unit area SF/Tf, and the right ordinate ratiois on a relative cross section of the in-row to interrowarea (7.5 Sp)/[(76-7.5) TF]. Thus for a 15-mm rainfall,nearly 10 times as much water is directed to the in-row position, compared with the interrow region. Thistranslates to about equal quantities of water being di-rected to the 7.5-cm cross section of the in-row region,compared with the entire interrow region (68.5-cm in-terrow cross section). Figures 4 and 5 suggest the needto choose and to report the exact location of soil watermeasurements relative to crop canopies. Also suggestiveis the potential for large errors in crop and soil watermodel predictions of water-use efficiency and the leach-ing of plant nutrients when plant-canopy redistributionis not taken into account.
In the fall, leaves increasingly bend downward closeto the stem so there is less water redistributed to theplant stems. The magnitude of this change is evident inFig. 6. Mean ratios of throughfall to rainfall or irrigation(Tf/R,I), measured under closed canopy, were 34 to40%, which was significantly lower than the 68 to 74%obtained from senescence to harvest. Mean ratios ob-tained under closed-canopy conditions are within therange of previous throughfall measurements as pre-sented in Table 1. This large seasonal change inthroughfall shows that both stemflow and averagethroughfall are time-dependent. These results bring newinformation needed to better understand water redistri-bution through the corn canopy from senescence toharvest.
Real-Time Soil Water Dynamics across CornRows at Closed Canopy
Soil water contents were measured at 10-min intervalsfrom 1995 to 1997, at four soil depths and across fiverow and interrow positions under two tillage treatments.There were 67 rainfalls during the three summers, 19July to 1 Oct., with 35 of these events (52%) resultingin measurable increases in soil water storage (5-55 cm).This low percentage is not surprising since 60% of oursummer rainfalls have <5 mm accumulation (Fig. 3). In
Table 4. Mean increases in 5- to 55-cm soil water storage follow-ing summer rainfall events, 19 July to 1 Oct., from 1995through 1997.
TillageRainfall
mean (std)In
row
Row position
Non-trafficinterrow
Trafficinterrow
No-tillagePlow-tillage
No-tillagePlow-tillage
6.3 (4.1)
14.4 (17.7)
Means for rainfalls < 15 mm13.5at A|5.4ab B
Means20.1a A16.2ab A
2.1b A4.9a A
for all rainfalls (n8.2b A
12.7a A
(n = 26)5.0b A8.1b A
= 35)10.2b A17.9b B
t Within rows, numbers with different lowercase letters show significantdifferences in treatment means using LSD at P = 0.05.
t Within columns, numbers with different uppercase letters show signifi-cant differences in treatment means using LSD at P = 0.05.
addition, whenever the surface layer was quite dry, smallrainfall or irrigation events may be largely absorbedinto the soil above the sensing-depth interval of the topcapacitance sensors (5-15 cm).
Multiyear Analysis of Soil Water Storageacross Corn Rows
Statistical analysis, using the SAS mixed procedure(SAS Institute, 1997), was performed on mean increasesin soil water storage following rainfall or irrigationevents. Overall, differences due to tillage alone werenot significant (P > 0.05), but there were strong positionand tillage X position effects (P = 0.001). Major sources
4
3 :
2 ;
o -K120
100
80
„ 60E.§ 40
e> 20
fe1 2 0
gj 100
S 80
6 6 °05 40
20
TOTAL RAINFALL: 4.3 mm TOTAL RAINFALL: 43.7mm
PLOW TILL- R2.5: Wheel-Traffic Interrow
R3.0: In-Row- R3.5: Non-Traffic Interrow
- R4.0: In-Row- R4.5: Wheel-Traffic Interrow
256 257 258 259 260 261 262 263 264
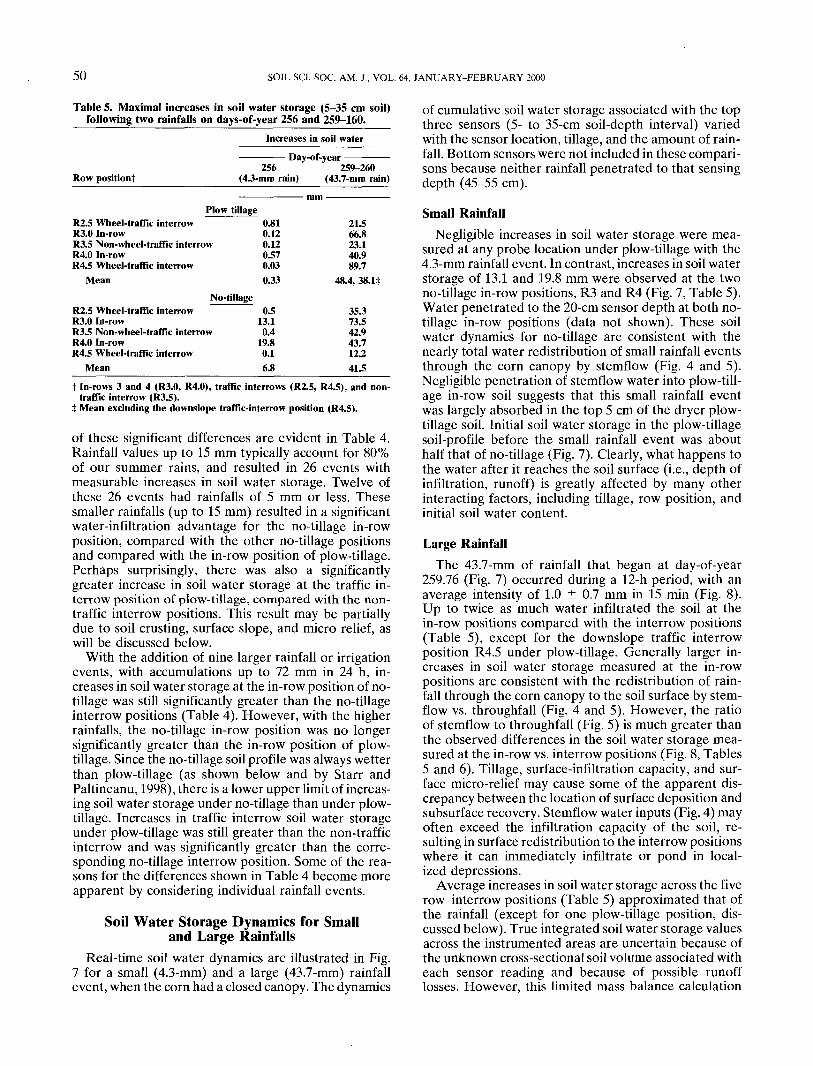
DOYFig. 7. Rainfall intensity for two events, and cumulative soil water
storage (5-35 cm) by row position under plow-tillage and no-till-age corn.
50 SOIL SCI. SOC. AM. I., VOL. 64, JANUARY-FEBRUARY 2000
Table 5. Maximal increases in soil water storage (5-35 cm soil)following two rainfalls on days-of-year 256 and 259-160.
Increases in soil water
Row positionf2S6
(4.3-mm rain)
- Day-of-year -259-260
(43.7-mm rain)
Plow tillageR2.5 Wheel-traffic interrowR3.0 In-rowR3.5 Non-wheel-traffic interrowR4.0 In-rowR4.5 Wheel-traffic interrow
Mean
No-tillageR2.5 Wheel-traffic interrowR3.0 In-rowR3.S Non-wheel-traffic interrowR4.0 In-rowR4.5 Wheel-traffic interrow
Mean
0.810.120.120.570.030.33
0.513.10.4
19.80.16.8
21.566.823.140.989.7
48.4, 38.11:
35.373.542.943.712.241.5
t In-rows 3 and 4 (R3.0, R4.0), traffic interrows (R2.5, R4.5), and non-traffic interrow (R3.5).
I Mean excluding the downslope traffic-interrow position (R4.5).
of these significant differences are evident in Table 4.Rainfall values up to 15 mm typically account for 80%of our summer rains, and resulted in 26 events withmeasurable increases in soil water storage. Twelve ofthese 26 events had rainfalls of 5 mm or less. Thesesmaller rainfalls (up to 15 mm) resulted in a significantwater-infiltration advantage for the no-tillage in-rowposition, compared with the other no-tillage positionsand compared with the in-row position of plow-tillage.Perhaps surprisingly, there was also a significantlygreater increase in soil water storage at the traffic in-terrow position of plow-tillage, compared with the non-traffic interrow positions. This result may be partiallydue to soil crusting, surface slope, and micro relief, aswill be discussed below.
With the addition of nine larger rainfall or irrigationevents, with accumulations up to 72 mm in 24 h, in-creases in soil water storage at the in-row position of no-tillage was still significantly greater than the no-tillageinterrow positions (Table 4). However, with the higherrainfalls, the no-tillage in-row position was no longersignificantly greater than the in-row position of plow-tillage. Since the no-tillage soil profile was always wetterthan plow-tillage (as shown below and by Starr andPaltineanu, 1998), there is a lower upper limit of increas-ing soil water storage under no-tillage than under plow-tillage. Increases in traffic interrow soil water storageunder plow-tillage was still greater than the non-trafficinterrow and was significantly greater than the corre-sponding no-tillage interrow position. Some of the rea-sons for the differences shown in Table 4 become moreapparent by considering individual rainfall events.
Soil Water Storage Dynamics for Smalland Large Rainfalls
Real-time soil water dynamics are illustrated in Fig.7 for a small (4.3-mm) and a large (43.7-mm) rainfallevent, when the corn had a closed canopy. The dynamics
of cumulative soil water storage associated with the topthree sensors (5- to 35-cm soil-depth interval) variedwith the sensor location, tillage, and the amount of rain-fall. Bottom sensors were not included in these compari-sons because neither rainfall penetrated to that sensingdepth (45-55 cm).
Small RainfallNegligible increases in soil water storage were mea-
sured at any probe location under plow-tillage with the4.3-mm rainfall event. In contrast, increases in soil waterstorage of 13.1 and 19.8 mm were observed at the twono-tillage in-row positions, R3 and R4 (Fig. 7, Table 5).Water penetrated to the 20-cm sensor depth at both no-tillage in-row positions (data not shown). These soilwater dynamics for no-tillage are consistent with thenearly total water redistribution of small rainfall eventsthrough the corn canopy by stemflow (Fig. 4 and 5).Negligible penetration of stemflow water into plow-till-age in-row soil suggests that this small rainfall eventwas largely absorbed in the top 5 cm of the dryer plow-tillage soil. Initial soil water storage in the plow-tillagesoil-profile before the small rainfall event was abouthalf that of no-tillage (Fig. 7). Clearly, what happens tothe water after it reaches the soil surface (i.e., depth ofinfiltration, runoff) is greatly affected by many otherinteracting factors, including tillage, row position, andinitial soil water content.
Large RainfallThe 43.7-mm of rainfall that began at day-of-year
259.76 (Fig. 7) occurred during a 12-h period, with anaverage intensity of 1.0 ± 0.7 mm in 15 min (Fig. 8).Up to twice as much water infiltrated the soil at thein-row positions compared with the interrow positions(Table 5), except for the downslope traffic interrowposition R4.5 under plow-tillage. Generally larger in-creases in soil water storage measured at the in-rowpositions are consistent with the redistribution of rain-fall through the corn canopy to the soil surface by stem-flow vs. throughfall (Fig. 4 and 5). However, the ratioof stemflow to throughfall (Fig. 5) is much greater thanthe observed differences in the soil water storage mea-sured at the in-row vs. interrow positions (Fig. 8, Tables5 and 6). Tillage, surface-infiltration capacity, and sur-face micro-relief may cause some of the apparent dis-crepancy between the location of surface deposition andsubsurface recovery. Stemflow water inputs (Fig. 4) mayoften exceed the infiltration capacity of the soil, re-sulting in surface redistribution to the interrow positionswhere it can immediately infiltrate or pond in local-ized depressions.
Average increases in soil water storage across the fiverow-interrow positions (Table 5) approximated that ofthe rainfall (except for one plow-tillage position, dis-cussed below). True integrated soil water storage valuesacross the instrumented areas are uncertain because ofthe unknown cross-sectional soil volume associated witheach sensor reading and because of possible runofflosses. However, this limited mass balance calculation
PALTINEANU & STARR: WATER FLOW THROUGH CORN CANOPY & SOIL WATER DYNAMICS
4
51
-J c 3 :
II \
DATE: 9/15-16/95RAINFALL: 43.7mm
MEAN RATE: 1.0 mm/15 min.Std.: 0.7 mm/15 min
100 :
80
60 \
PLOW TILL ""*"""-— -
R3.5 Non-Traffic InterRowR4 In-RowR4.5 Traffic InterRow
0 4 8 12 16
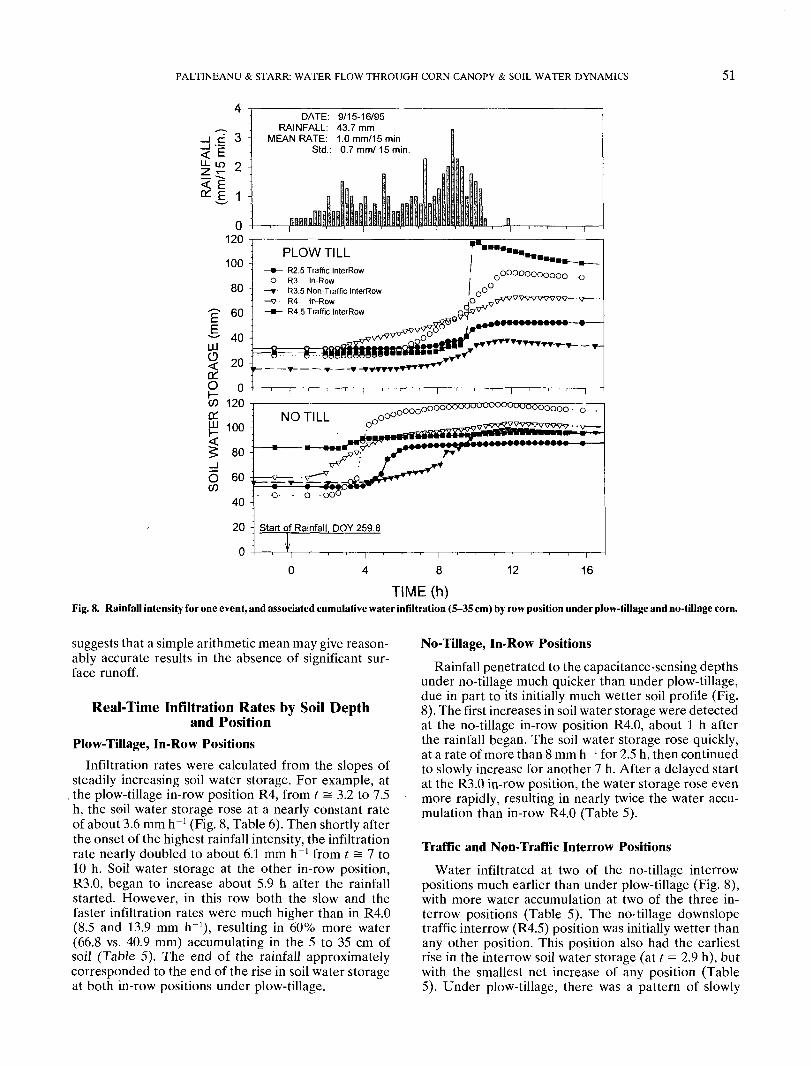
TIME (h)Fig. 8. Rainfall intensity for one event, and associated cumulative water infiltration (5-35 cm) by row position under plow-tillage and no-tillage corn.
suggests that a simple arithmetic mean may give reason-ably accurate results in the absence of significant sur-face runoff.
Real-Time Infiltration Rates by Soil Depthand Position
Plow-Tillage, In-Row PositionsInfiltration rates were calculated from the slopes of
steadily increasing soil water storage. For example, at. the plow-tillage in-row position R4, from t = 3.2 to 7.5h, the soil water storage rose at a nearly constant rateof about 3.6 mm h"1 (Fig. 8, Table 6). Then shortly afterthe onset of the highest rainfall intensity, the infiltrationrate nearly doubled to about 6.1 mm h"1 from t = 1 to10 h. Soil water storage at the other in-row position,R3.0, began to increase about 5.9 h after the rainfallstarted. However, in this row both the slow and thefaster infiltration rates were much higher than in R4.0(8.5 and 13.9 mm h"1), resulting in 60% more water(66.8 vs. 40.9 mm) accumulating in the 5 to 35 cm ofsoil (Table 5). The end of the rainfall approximatelycorresponded to the end of the rise in soil water storageat both in-row positions under plow-tillage.
No-Tillage, In-Row PositionsRainfall penetrated to the capacitance-sensing depths
under no-tillage much quicker than under plow-tillage,due in part to its initially much wetter soil profile (Fig.8). The first increases in soil water storage were detectedat the no-tillage in-row position R4.0, about 1 h afterthe rainfall began. The soil water storage rose quickly,at a rate of more than 8 mm h"1 for 2.5 h, then continuedto slowly increase for another 7 h. After a delayed startat the R3.0 in-row position, the water storage rose evenmore rapidly, resulting in nearly twice the water accu-mulation than in-row R4.0 (Table 5).
Traffic and Non-Traffic Interrow PositionsWater infiltrated at two of the no-tillage interrow
positions much earlier than under plow-tillage (Fig. 8),with more water accumulation at two of the three in-terrow positions (Table 5). The no-tillage downslopetraffic interrow (R4.5) position was initially wetter thanany other position. This position also had the earliestrise in the interrow soil water storage (at t - 2.9 h), butwith the smallest net increase of any position (Table5). Under plow-tillage, there was a pattern of slowly

52 SOIL SCI. SOC. AM. J., VOL. 64, JANUARY-FEBRUARY 2000
Table 6. Slow then fast infiltration rates associated with the 12-hrainfall on 15-16 Sept. 1995, and time (after start of rainfall)of initial rise in soil water storage.
Row position tInitialrise
Plow-tillageR2.5 Wheel-traffic interrowR3.0 In-rowR3.5 Non-wheel-traffic interrowR4.0 In-rowR4.5 Wheel-traffic interrow
NoR2.5 Wheel-traffic interrowR3.0 In-rowR3.5 Non-wheel-traffic interrowR4.0 In-rowR4.5 Wheel-traffic interrow
7.95.96.13.26.6
-tillage3.92.64.10.92.9
Infiltration rate
Initial Next
4.6 11.78.5 13.91.8 7.33.6 6.12 227J
9.7 1511.5 18.52.8 10.34.1 8.27.3 0.5
t In-rows 3 and 4 (R3.0, R4.0), traffic interrows (R2.5, R4.5), and non-traffic interrow (R3.5).
$ Suspected result of surface flow into cracked surface soil.
increasing soil water storage at all three interrow posi-tions for the first 9.5 h after the initiation of rainfall. Atthat time, coincident with the greatest rainfall intensity,all five plow-tillage positions showed an increased rateof water infiltration. Evidence will be presented belowfor overland flow into soil cracks at the downslope,plow-tillage, traffic interrow position.
Soil Water Dynamics by Depth and PositionThe sequential timing and pattern of water movement
to successive soil depths resulting from the 43.7-mm
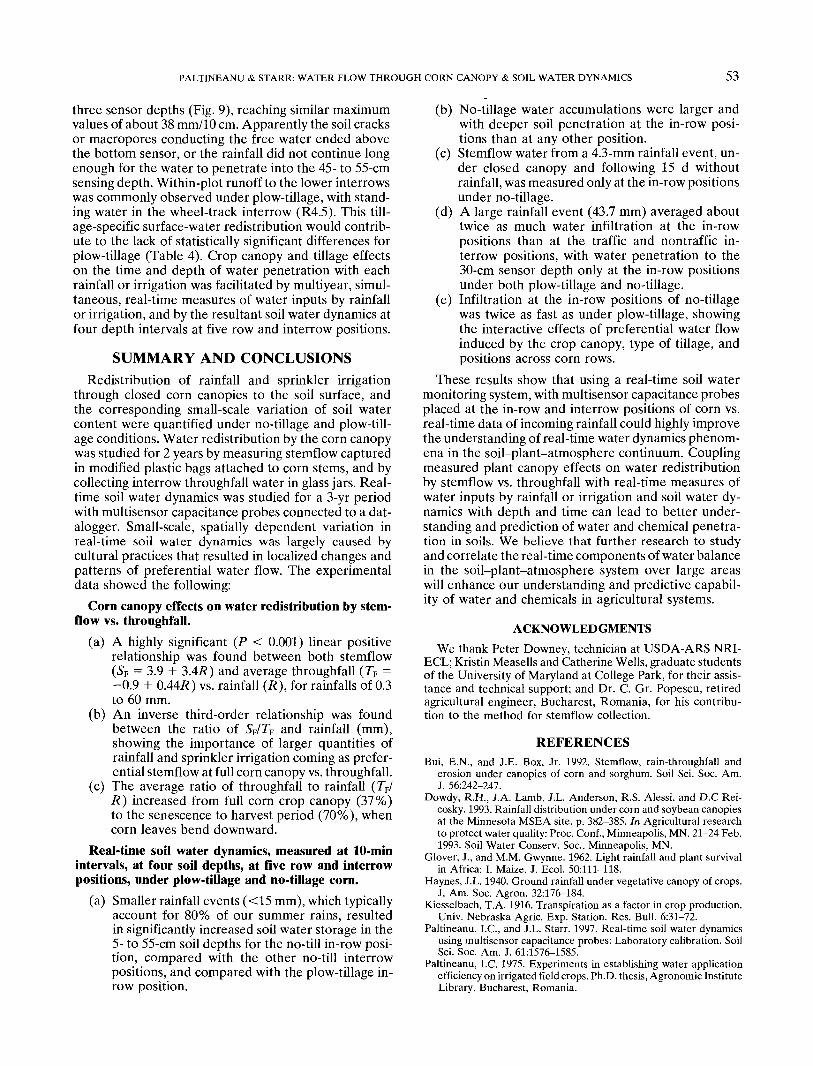
rainfall is shown in Fig. 9. Rainfall redistributed throughthe corn canopy to the in-row positions of no-tillageresulted not only in earlier infiltration (Fig. 8, Table 6),but also in deeper penetration than in any interrowposition (Fig. 9). Rapid rise in soil water storage alsooccurred at the no-tillage traffic interrow position R2.5,starting about 2 h later than at the two in-row positions(Fig. 8). The near-abrupt increase from the 10- to the20-cm sensors at R2.5 occurred when the soil watercontent at the 10-cm sensor depth quickly rose from 23to 30% (i.e., mm/10 cm). Rapid increases in soil waterstorage also occurred at three other positions when thesoil water storage approached 30 mm/10 cm, suggestinga transition to filling of mesopores, if not macropores.Lack of water penetration below 25 cm in the trafficinterrows may reflect the higher density of the soil layernear the bottom of the plow layer (Starr et al., 1995).Volumetric soil water content at the 50-cm depth wasessentially unaffected by this rainfall event, but wasgreatly affected by tillage, and to a lesser amount byrow-interrow position, varying between 20 and 32 mm/10 cm of soil (i.e., 0.2-0.32 m3 m~3).
The abrupt increase in soil water storage at the down-slope interrow position R4.5 in plow-tillage (Fig. 9) wascoincident with a rapid increase in rainfall intensity (Fig.8). Runoff water was often observed to accumulate inthe downslope wheel-track depressions of R4.5 underplow-tillage. Increased rainfall intensity on the slopingsoil probably resulted in surface ponding and flow intothe cracked plow-tillage soil. Evidence for this specula-tion is the abrupt increase in soil water storage of about75 mm (Fig. 7), with simultaneous penetration to the top
TRAFFICINTERROW IN-ROW
NON-TRAFFICINTERROW IN-ROW
TRAFFICINTERROW
R2.5I10 cm (5-15 cm)20cm (15-25 cm)
— 30 cm (25-35 cm)50 cm (45-55 cm)
10 cm (5-15 cm)20cm (15-25 cm)30 cm (25-35 cm)50 cm (45-55 cm)
0 4 8 1 2 0 4 8 1 2 0 4 8 1 2 0 4 8 1 2 0 4 8 1 2
TIME (h)Fig. 9. Soil water dynamics at four sensor depths, at each in-row (R3, R4) and interrow position (R2.5, R3.5, R4.5), following onset of a 43.7-
nim rainfall event.
PALTINEANU & STARR: WATER FLOW THROUGH CORN CANOPY & SOIL WATER DYNAMICS 53
three sensor depths (Fig. 9), reaching similar maximumvalues of about 38 mm/10 cm. Apparently the soil cracksor macropores conducting the free water ended abovethe bottom sensor, or the rainfall did not continue longenough for the water to penetrate into the 45- to 55-cmsensing depth. Within-plot runoff to the lower interrowswas commonly observed under plow-tillage, with stand-ing water in the wheel-track interrow (R4.5). This till-age-specific surface-water redistribution would contrib-ute to the lack of statistically significant differences forplow-tillage (Table 4). Crop canopy and tillage effectson the time and depth of water penetration with eachrainfall or irrigation was facilitated by multiyear, simul-taneous, real-time measures of water inputs by rainfallor irrigation, and by the resultant soil water dynamics atfour depth intervals at five row and interrow positions.
SUMMARY AND CONCLUSIONSRedistribution of rainfall and sprinkler irrigation
through closed corn canopies to the soil surface, andthe corresponding small-scale variation of soil watercontent were quantified under no-tillage and plow-till-age conditions. Water redistribution by the corn canopywas studied for 2 years by measuring stemflow capturedin modified plastic bags attached to corn stems, and bycollecting interrow throughfall water in glass jars. Real-time soil water dynamics was studied for a 3-yr periodwith multisensor capacitance probes connected to a dat-alogger. Small-scale, spatially dependent variation inreal-time soil water dynamics was largely caused bycultural practices that resulted in localized changes andpatterns of preferential water flow. The experimentaldata showed the following:
Corn canopy effects on water redistribution by stem-flow vs. throughfall.
(a) A highly significant (P < 0.001) linear positiverelationship was found between both stemflow(SF = 3.9 + 3AR) and average throughfall (TF =-0.9 + 0.44/?) vs. rainfall (R), for rainfalls of 0.3to 60 mm.
(b) An inverse third-order relationship was foundbetween the ratio of Sf/TF and rainfall (mm),showing the importance of larger quantities ofrainfall and sprinkler irrigation coming as prefer-ential stemflow at full corn canopy vs. throughfall.
(c) The average ratio of throughfall to rainfall (TF/R) increased from full corn crop canopy (37%)to the senescence to harvest period (70%), whencorn leaves bend downward.
Real-time soil water dynamics, measured at 10-minintervals, at four soil depths, at five row and interrowpositions, under plow-tillage and no-tillage corn.
(a) Smaller rainfall events (<15 mm), which typicallyaccount for 80% of our summer rains, resultedin significantly increased soil water storage in the5- to 55-cm soil depths for the no-till in-row posi-tion, compared with the other no-till interrowpositions, and compared with the plow-tillage in-row position.
(b) No-tillage water accumulations were larger andwith deeper soil penetration at the in-row posi-tions than at any other position.
(c) Stemflow water from a 4.3-mm rainfall event, un-der closed canopy and following 15 d withoutrainfall, was measured only at the in-row positionsunder no-tillage.
(d) A large rainfall event (43.7 mm) averaged abouttwice as much water infiltration at the in-rowpositions than at the traffic and nontraffic in-terrow positions, with water penetration to the30-cm sensor depth only at the in-row positionsunder both plow-tillage and no-tillage.
(e) Infiltration at the in-row positions of no-tillagewas twice as fast as under plow-tillage, showingthe interactive effects of preferential water flowinduced by the crop canopy, type of tillage, andpositions across corn rows.
These results show that using a real-time soil watermonitoring system, with multisensor capacitance probesplaced at the in-row and interrow positions of corn vs.real-time data of incoming rainfall could highly improvethe understanding of real-time water dynamics phenom-ena in the soil-plant-atmosphere continuum. Couplingmeasured plant canopy effects on water redistributionby stemflow vs. throughfall with real-time measures ofwater inputs by rainfall or irrigation and soil water dy-namics with depth and time can lead to better under-standing and prediction of water and chemical penetra-tion in soils. We believe that further research to studyand correlate the real-time components of water balancein the soil-plant-atmosphere system over large areaswill enhance our understanding and predictive capabil-ity of water and chemicals in agricultural systems.
ACKNOWLEDGMENTSWe thank Peter Downey, technician at USDA-ARS NRI-
ECL; Kristin Measells and Catherine Wells, graduate studentsof the University of Maryland at College Park, for their assis-tance and technical support; and Dr. C. Gr. Popescu, retiredagricultural engineer, Bucharest, Romania, for his contribu-tion to the method for stemflow collection.
54 SOIL SCI. SOC. AM. J., VOL. 64, JANUARY-FEBRUARY 2000
Paltineanu, I.C., and I. Apostol. 1974. Possibilities of using the neutronmethod for water application efficiency studies in sprinkler andfurrow irrigation, p. 477-506. In Proc. Symp. Isotope and RadiationTechniques in Soil Physics and Irrigation Studies, Vienna. 1-5 Oct.1973. IAEA, Vienna.
Parkin, T.B., and E.E. Codling. 1990. Rainfall distribution under acorn canopy: Implications for managing agrochemicals. Agron.J. 82:1166-1169.
Quinn, N.W., and J.M. Laflen. 1983. Characteristics of raindropthroughfall under corn canopy. Trans. ASAE 26:1445-1450.
SAS Institute. 1997. SAS/STAT Software: Changes and enhancementsthrough release 6.12. SAS Inst., Gary, NC.
Shanholtz, V.O., and T.M. Younos. 1994. A soil water balance modelfor no-tillage and conventional till systems. Agric. Water. Man-age. 26:155-168.
Starr, J.L., and I.C. Paltineanu. 1998. Soil water dynamics usingmultisensor capacitance probes in non-traffic interrows of plow-and no-till corn. Soil Sci. Soc. Am. J. 62:114-122.
Starr, J.L., I.C. Paltineanu, and D.J. Timlin. 1995. Temporal in situ
changes of soil properties as affected by tillage, position and plants.p. 139-140. In Kearney Found. Int. Conf. Proc., Davis, CA. Sept.1995. Kearney Found. Soil Sci., Davis, CA.
Steiner, J.L., E.T. Kanemasu, and R.N. Clark. 1983. Spray losses andpartitioning of water under center pivot sprinkler system. Trans.ASAE 26:1128-1134.
van Elecwijck, L. 1989. Stemflow on maize: A stemflow equationand the influence of rainfall intensity on stemflow amount. SoilTech. 2:41 (̂8.
van Wesenbeeck, I., and R.G. Kachanoski. 1988. Spatial and temporaldistribution of soil water in the tilled layer under a corn crop. SoilSci. Soc. Am. J. 52:363-368.
Waddell, J.A., and R.R. Weil. 1996. Water distribution in soil underridge-till and no-till corn. Soil Sci. Soc. Am. J. 60:230-237.
Warner, G.S., and R.A. Young. 1991. Measurement of preferentialflow beneath mature corn. In T.J. Gish and A. Shirmohammadi(ed.) Preferential flow. Proc. Nat. Symp., Chicago. 16-17 Dec. 1991.ASAE, St. Joseph, MI.