preface - jicaopen_jicareport.jica.go.jp/pdf/11954930_01.pdf · preface in response to a ......
TRANSCRIPT


PREFACE
In response to a request from the Government of Republic of Zambia, the Government of Japan
decided to conduct the Study on Geological Mapping and Mineral Information Service Project
for Promotion of Mining Industry in the Republic of Zambia, and the Study was implemented
by the Japan International Cooperation Agency (JICA).
JICA selected and dispatched a study team headed by Mr.Masaharu Marutani of Mitsui Mineral
Development Engineering Co., Ltd.(MINDECO), and consist of MINDECO and Nikko
Exploration and Development Co.,Ltd. to Zambia between Jan. 2007 and June.2009.
The team held discussions with the officials concerned of the Government of Zambia and
conducted field surveys at the study area. Upon returning to Japan, the team conducted further
studies and prepared this final report.
I hope that this report will contribute to further sustainable development of mining sector in
Zambia with investment promotion and to the enhancement of friendly relationship between our
two countries.
Finally, I wish to express my sincere appreciation to the officials concerned of the Government
of Zambia for their close cooperation extended to the study.
July 2009
Seiichi Nagatsuka
Deputy Vice President
Japan International Cooperation Agency

Seiichi NAGATSUKA Vice President Japan International Cooperation Agency
Letter of Transmittal
It is with great pleasure that we submit to you this final report on the Study on Geological Mapping and Mineral Information Service Project for Promotion of the Mining Industry in the Republic of Zambia. Under contract with your organization, this study was carried out by Mitsui Mineral Development Engineering Co. Ltd. (MINDECO) for 30 months, from January 2007 to July 2009. This report is an overview of the study, which was conducted to provide and organize information about the geology and mineral resources of Zambia in order to attract more investment in that country’s mining sector. To help achieve this goal, the results of the study will be publicly released, both in Zambia and in other countries, and the capacity development of the Geological Survey Department, an agency of the Ministry of Mines and Minerals Development, will be enhanced. The ultimate goal of this study is to provide information on the geology and mineral resources of Zambia to promote investment in that country’s mining sector. Even after the completion of the study, we would like to encourage the Geological Survey Department to continue to address investment promotion. For this purpose, during the study we undertook a series of collaborative tasks with our GSD counterparts such as conducting geological field surveys and creating geological and mineral resource maps. It is our hope that the GSD will be able to sufficiently apply the results of capacity development derived from this study to its future work. In closing, we would like to express our sincere gratitude to your organization, the Japanese Ministry of Foreign Affairs, and the Japanese Ministry of Economy, Trade and Industry for yours and their support and guidance with this project. We would also like to thank all related organizations such as the Zambian Government, the Ministry of Mines and Minerals Development, and the Geological Survey Department, as well as the Japanese Embassy in Zambia and the JICA Zambia Office for their assistance and support in carrying out this study. July 2009 Masaharu Marutani Team Leader Study on Geological Mapping and
Mineral Information Service Project for Promotion of the Mining Industry in the Republic of Zambia


i
Final Report Geological Mapping and Mineral Information Service Project For Promotion of Mining Industry in the Republic of Zambia
Content
Page
Chapter 1 Overview of Study
1.1 Background of Study ···································································································· 1
1.2 Purpose of Study···········································································································1
1.3 Target Area of Study ·····································································································2
1.4 Method and Content of Study ························································································2
1.5 Site Study ·····················································································································4
1.6 Geological Field Survey································································································6
1.7 Steering Committee ······································································································7
Chapter 2 Current Investment Climate and Situation of the Mining Industry
2.1 Overview···················································································································· 17
2.2 Role of Mining Sector································································································· 17
2.3 Mining Policy ············································································································· 20
2.4 Mining Administration ································································································ 20
2.5 Geological Survey Department···················································································· 22
2.6 Mining Legislation ····································································································· 23
2.6.1 Mines and Minerals Development Act ·································································· 23
2.6.2 Investment Law···································································································· 24
2.6.3 Tax Regime ·········································································································· 26
2.7 Current Status of Mining Activities ············································································· 27
2.8 Reserves of Mineral Resources ··················································································· 28
2.9 Current State of Exploration and Development ···························································· 30
2.9.1 Approval of Licenses···························································································· 30
2.9.2 Exploration and Development Projects ································································· 30
2.10 International Assistance ···························································································· 35
Chapter 3 Geoinformation
3.1 Current Status of Geoinformation················································································ 37

ii
3.2 Revision of Geological Maps ······················································································ 39
Chapter 4 GIS Database
4.1 Current Situation and Evaluation of GIS Database······················································· 43
4.1.1 Database in GSD·································································································· 43
4.1.2 Database in MDD································································································· 44
4.2 Revisions of Database and GIS ··················································································· 45
4.3 Current Situation and Issues of Website······································································· 63
Chapter 5 Geological Survey
5.1 Overview···················································································································· 65
5.2 Results of the Surveys································································································· 66
5.2.1 Satellite Image Analysis and Results of the Preliminary Survey ···························· 66
5.2.2 Results of the Reconnaissance Survey ·································································· 70
5.2.3 Results of the Geological Survey ········································································ 73
5.2.3.1 Stratigraphy··································································································· 74
5.2.3.2 Geological Structure ······················································································ 97
5.2.3.3 Mineralization ······························································································· 104
5.2.3.4 Dating Analysis ····························································································· 108
5.2.4 Geochemical Survey····························································································· 118
5.2.4.1 Stream Sediments Geochemical Survey ·························································· 118
5.2.4.2 Soil Geochemical Survey ··············································································· 121
5.2.5 Summary of the Mineralizations ··········································································· 126
5.2.5.1 Stratigraphy, Geochronology and comparison with the Copperbelt area··········· 126
5.2.5.2 Mineralization ······························································································· 127
Reference ····················································································································· 129

iii
List of Tables
Table 1.5.1 List of Team Members ··················································································· 4
Table 1.6.1 Geological Field Surveys ··············································································· 7
Table 1.7.1 Members of the Steering Committee ······························································ 8
Table 2.2.1 Japanese Imports of Non-ferrous Metals from Zambia ·································· 19
Table 2.4.1 Roles of MMMD ························································································· 21
Table 2.4.2 Actual Expenditures and Budget of MMMD ················································· 22
Table 2.7.1 Production of Copper and Cobalt at Major Mines in Zambia························· 27
Table 2.7.2 Major Copper Mines in Zambia ··································································· 28
Table 2.8.1 Resources and Reserves of Major Copper Mines in Zambia ·························· 29
Table 2.8.2 Resources and Reserves of Major Development Projects ······························ 29
Table 2.8.3 Resources of Major Exploration Projects······················································ 29
Table 2.8.4 Resources of Other Major Minerals······························································ 30
Table 2.9.1 Number of Licenses Issued ·········································································· 30
Table 2.9.2 Outline of Exploration and Development Projects ········································ 31
Table 2.10.1 Recent Cases of International Assistance in the Zambian Mining Sector ····· 36
Table 3.2.1 List of Geological Source Maps ··································································· 40
Table 4.1.1 Record of GIS Database in GSD ·································································· 43
Table 4.1.2 Thematic Layers in GIS Database of Mineral Resources ······························· 44
Table 4.2.1 Table 4.2.1 Number of Mineral Occurrences in Each Sheet and Sorted
Sheet Number, in Descending Order r ························································· 46
Table 4.2.2 Review of records ····················································································· 48
Table4.2.3 Duplicates for coordinates ····································································· 49
Table 4.2.4 Cases of large discrepancies between Latitude/Longitude and UTM coordinate values ·········································································· 50
Table4.2.5 Coordinates of mineral occurrence areas discerned from topographic maps ···················································································· 50
Table 5.1.1 Contents of Each Geological Survey ···························································· 66
Table 5.2.1 Results of Outcrop Observations at the Preliminary Survey ·························· 67
Table 5.2.3 3-1 Mineral Occurrences in the Survey Area ·············································· 104
Table 5.2.3 4-1 The Results of EPMA Dating Analysis (1)·············································110
Table 5.2.3 4-2 The Results of EPMA Dating Analysis (2)·············································114
Table 5.2.3 4-2 The Results of EPMA Dating Analysis (3)·············································115
Table 5.2.3 4-2 The Results of EPMA Dating Analysis (4)·············································117
Table 5.2.4 1-1 Method and Detection Limit of Geochemistry ·······································119
Table 5.2.4.1-2 Descriptive statistics of stream sediment samples ································· 120
Table 5.2.4.2-2 Descriptive statistics of soil samples ················································· 125
Table 5.2.5-1 Requirement quality of silica stones for Industrial applications ··············· 128
List of Figures
Fig. 2.2.1 Zambian GDP by Economic Activity ······························································ 17
Fig. 2.2.2 Zambia’s Exports and Imports by Commodity ················································ 18
Fig. 2.2.3 Zambia’s Exports and Imports by Country ······················································ 18
Fig. 2.2.4 Trade between Japan and Zambia ··································································· 19
Fig. 2.4.1 Organization Chart of MMMD and GSD ························································ 20

iv
Fig. 2.8.1 Copper and Cobalt Reserves by Country························································· 29
Fig. 3.1.1 Current Status of 1:100,000 Geological Mapping············································ 37
Fig. 3.2.1 Geological Source Maps ················································································ 41
Fig. 4.2.1 Overview of the Content and Scope of the Work ············································· 45
Fig. 4.2.2 1/250,000 Sheets Divided into 1/50,000 Topographic Maps ···························· 47
Fig. 4.2.3 GUI of the mineral resource database ···················································· 52
Fig. 4.2.4 2,270 mineral occurrences exported from existing function ·············· 55
Fig. 4.2.5 After investigation of data consistency, remained 1,111 mineral occurrences ······················································ 56
Fig. 4.2.6 Copper occurrences ···················································································· 57
Fig. 4.2.7 Lead occurrences ························································································ 58
Fig. 4.2.8 Zinc occurrences ························································································· 59
Fig. 4.2.9 1/1 million geological map ········································································ 60
Fig. 4.2.10 Specific geological unit and Copper occurrence ··································· 61
Fig. 4.2.11 Example of operation windows of GIS software ··································· 62 Fig. 5.1.1 Survey Area ··································································································· 65
Fig. 5.2.1 Multi-Shading Images and Locations of Outcrops··········································· 68
Fig. 5.2.2 ASTER False Color Imagery ·········································································· 69
Fig. 5.2.3 Reconnaissance Survey Route ········································································ 70
Fig. 5.2.3.1-1 Schematic Stratigraphic Column of the Survey Area ································· 74
Fig. 5.2.3.1-2 Geologic Map of the Survey Area····························································· 75
Fig. 5.2.3.1-3 Geologic Setting of the Survey Area Based on
Geologic Map of Southeast Africa ··························································· 76
Fig. 5.2.3.1-4 Granitoids································································································ 77
Fig. 5.2.3.1-5 Foliated Porphyroblastic Structure in Granitic-gneiss ······························· 78
Fig. 5.2.3.1-6 Rock Fragments in Granitoids ·································································· 78
Fig. 5.2.3.1-7 Outcrop of Migmatite··············································································· 79
Fig. 5.2.3.1-8 Foliated Recrystallized Muscovite in Massive Psammitic Schist
Psammitic schist with veins····································································· 80
Fig. 5.2.3.1-9 Psammitic Gneiss with Microfolds ··························································· 81
Fig. 5.2.3.1-10 Outcrop of Biotite gneiss and Microfolds ··············································· 81
Fig. 5.2.3.1-11 Muscovite schist ···················································································· 82
Fig. 5.2.3.1-12 Cross -lamination Structure of the Mporokoso Group Sigmoidal and
en Echelon Fractures ··············································································· 83
Fig. 5.2.3.1-13 Conglomerate of the Mporokoso Formation ············································ 84
Fig. 5.2.3.1-14 Grayish Sandstone ················································································· 87
Fig. 5.2.3.15 Large-scale outcrop of purple to grey siltstone and
Weathered micaceous siltstone with a muddy layer ······························ 88
Fig. 5.2.3.1-16 Lens-shaped pegmatite in metasediments················································ 92 Fig. 5.2.3.1-17 Observation of Chalabesa Pit·································································· 94
Fig. 5.2.3.1-18 Observation of Kopa Pit ········································································· 95
Fig. 5.2.3.1-19 Observation of Njeke Pit ········································································ 96
Fig. 5.2.3 2-1 Rose Diagram of Bedding and Foliation Directions (1030NE sheet area) ·· 97
Fig. 5.2.3 2-2 Multi-shading Image Generated from SRTM DEM(1030NE sheet area) ···· 99
Fig. 5.2.3 2-3 Multi-shading Image Generated from SRTM DEM(1030SE sheet area) ··· 100

v
Fig. 5.2.3 2-4 Multi-shading Image Generated from SRTM DEM(1130NE sheet area) ·· 101
Fig. 5.2.3 2-5 Rose Diagram of Bedding Directions (1130NE sheet area)······················ 102
Fig. 5.2.3 2-6 Multi-shading Image Generated from SRTM DEM(1130SE sheet area) ··· 103
Fig. 5.2.3 2-7 Rose Diagram of Bedding Directions (1130NE sheet area)······················ 103
Fig. 5.2.3 3-1 Location of Mineral Occurrences ··························································· 104
Fig. 5.2.3 3-2 Metavolcanic rock at Mukanga Mineral Occurrence, and
Quartz Vein in Quartzite at Samba Lubemba Mineral Occurrence··········· 105
Fig. 5.2.3 3-3 Quartz Ridge at Lower Reaches of Mukanga River ································· 106
Fig. 5.2.3 4-1 U-Th-Pb Monazite Ages and Zircon Ages of Basement Complex ············ 111
Fig. 5.2.3 4-2 U-Th-Pb Detrital Monazite Ages and
Detrital Zircon Ages of Muva Supergroup·········································· 112
Fig. 5.2.3 4-3 U-Th-Pb Monazite Ages and Zircon Ages of Samples
in 1030SE Sheet area··········································································· 114
Fig. 5.2.3 4-4 U-Th-Pb Zircon Ages of Samples in 1130NE Sheet area ························· 115
Fig. 5.2.3 4-5 U-Th-Pb Monazite Ages and Zircon Ages of Samples in 1130SE
Sheet area and electronic microscopic photo with dating results of
detrital Monazite of RC003 ··································································· 117
Fig. 5.2.4 1-1 Location of Stream Sediments Sampling················································· 118
Fig. 5.2.4 1-2 Distribution of Stream Sediments Geochemistry ····································· 121
Fig. 5.2.4 2-1 Schematic Soil Profile············································································ 122
Fig. 5.2.4.2-2 Example of “Soil Sampling Sheet” Format ············································· 122
Fig. 5.2.4.2-3 Location of Soil Geochemistry Samples ················································· 122
Fig. 5.2.4 2-4 Distribution of Soil Geochemistry ·························································· 124
Fig. 5.2.5-1 Schematic section of the Zambian Copper Belt Type Cu mineralization ····· 126

Abbreviation English
AIST National Institute of Advanced Science andTechnology
ASTER Advanced Spaceborn Thermal Emission ReflectionRadiometer
BGS British Geological SurveyC/P CounterpartCAD Computer Aided DesignCMZ Chamber of Mines of ZambiaDB DatabaseEBZ Export Board of ZambiaEPMA Electron Probe MicroAnalyzer
ERIPTA Economic Recovery and Investment ProjectTechnical Assistance
EU European UnionFOB Free on BoardGa Giga-annumGDP Gross Domestic ProductGIS Geographical Information SystemGPS Global Positioning SystemGSD Geological Survey DepartmentHRA Human Resources and Administration
ICP-AES Inductively Coupled Plasma - Atomic EmissionSpectrometry
ICP-MS Inductively Coupled Plasma - Mass SpectrometryINDABA INDABAIPPA Investment Promotion and Protection AgreementJOGMEC Japan Oil, Gas and Metals National CorporationLAN Local Area NetworkM/M Minutes of MeetingMa Mega-annumMDD Mining Development DepartmentMFEZ Multi-Facility Economic ZonesMIGA Multilateral Investment Guarantee AgencyMMMD Ministry of Mines and Mineral DevelopmentMSD Mines Safety DepartmentMSDP Mining Sector Diversification ProgrammeNASA National Aeronautics and Space AdministrationNTMS Non-traditional Mining SectorsPDAC Prospectors and Developers Association of CanadaPGE Platinum Group ElementsS/W Scope of WorkSADC Southern African Development CommunitySEDB Small Enterprises Development BoardSEED Support to Economic Expansion and DiversificationSHRIMP Sensitive High Resolution Ion Microprobe
SRTM/DEM Shuttle Rader Topographic Mission - DigitalElevation Model
List of Abbreviation
vi

Abbreviation English
List of Abbreviation
UAE United Arab EmiratesUTM Universal Transverse MercatorWGS84 World Geodetic System 1984 DatumZAMCOM Zambian Institute Mass Communication ZAWA Zambia Wildlife AuthorityZCCM Zambia Consolidated Copper MinesZDA Zambia Development AgencyZESCO Zambia Electricity Supply CorporationZIC Zambia Investment CentreZPA Zambia Privatisation Agency
vii

1
Chapter 1 Overview of the Study
1.1 Background of the Study
Zambia is rich in mineral resources such as copper and cobalt, and mining is one of its most
important industries. Mining has a major impact on the country’s economy, as seen in the 1990s
when the price of copper was depressed and the Zambia Consolidated Copper Mines (ZCCM) went
into decline, leading to economic stagnation. However, with the privatization of ZCCM in 2000 and
the rapid rise of copper prices that began in 2003, the mining sector has been revitalized, with copper
mines being reopened and new copper mines being developed.
But Zambia has more than just copper and cobalt – it also has very high potential for such minerals
as lead, zinc, gold, and nickel. In terms of providing steady employment and acquiring hard currency,
the mining sector is quite important in Zambia, and its development should make a significant
contribution toward reducing poverty in that country.
From the late 1950s to the 1970s, geological surveys were conducted with assistance from the
United Kingdom, and in the 1990s they were conducted with assistance from the EU, World Bank,
and others. As a result of these surveys, 1:100,000 geological maps were compiled, covering 58% of
the country. However, no detailed surveys have been made of the remaining 42%, so it is not
possible at this time to evaluate the mineral potential of the latter area.
Information on Zambian mineral resources is being managed by the Geological Survey Department
(hereafter GSD) of the Ministry of Mines and Mineral Development (hereafter MMMD). However,
because of GSD’s limited capacity, there is no integrated management of data obtained from
geological, geochemical, and physical surveys, and there is no system that can provide effective
administrative services. In order to promote mine development through private sector investments,
GSD will have to take a leading role in facilitating private investments and developing and
disclosing necessary information on mineral resources.
Against this backdrop, the Zambian Government requested the Government of Japan to implement
the “Study on Geological Mapping and Mineral Information Service Project for the Promotion of the
Mining Industry” in 2005. In response to this request, the Japan International Cooperation Agency
(hereafter JICA) signed a scope of work agreement for the study with MMMD in December, 2006.
1.2 Purposes of the Study
The main purposes of the present study are to promote investment in the Zambian mining sector by
developing information related to the geology and mineral resources of Zambia and disclosing it

2
inside and outside the country, and to enhance the capacity of GSD, which plays a leading role in
mineral resources development. At the same time, the study is designed to transfer technology to
GSD for conducting geological and mineral resource surveys. Specifically, this entails the following:
1) Revising the existing 1:1,000,000 geological and mineral resource maps and explanations
for the entire country.
2) Compiling 1:100,000 geological maps and explanations of target areas from the results of
field geological surveys and analysis and interpretation of satellite and other images.
3) Revising and developing the GIS database for mineral resource development.
4) Transmitting mineral resource information through domestic and international seminars.
5) Nurturing human resources at GSD to support the above activities.
1.3. Target Area of Study
The target area for the study is the entire country of Zambia. However, the target of the 1:100,000
geological map compilation (“geological survey areas”) will be 4 districts in Northern Province of
Zambia located between 10º and 12ºS and 30º 30’and 31º E.
1.4 Method and Content of Study
This survey was divided into 3 phases: Phase A, involving preparation for the compilation of
geological maps; Phase B, involving the actual compilation of geological maps; and Phase C,
involving the development of resource information for promoting investment.
In Phase A (preparation for the compilation of geological maps), there was a review of geological
and mineral resource information, and preparations of revisions were made to 1:1,000,000
geological and mineral resource maps. At the same time, field geological surveys, satellite image
analyses and image interpretation were conducted in geological survey areas, and preparations were
made to compile 1:100,000 geological maps.
In Phase B (compilation of geological maps), revisions of 1:1,000,000 geological and mineral
resource maps and explanations continued, field geological surveys were conducted in geological
survey areas, 1:100,000 geological maps in the northern 2 districts were compiled. Hereafter, a GIS
database, including the obtained geological and analytical data, will be revised and developed.
In Phase C (development of resource information for promoting investment), the 1:1,000,000
geological and mineral resource maps and explanations, and the 1:100,000 geological maps in the
southern 2 districts and explanations will be completed, and a series of geological maps will be

3
prepared. The study results will be presented and information on Zambian mineral resources will be
provided at investment promotion seminars in Zambia and Japan, and at international events such as
the INDABA exposition in South Africa and the PDAC convention in Canada, in order to promote
investment.
The samples collected during the field surveys over the course of the 3 phases will be subjected to
chemical analyses. The results will be statistically interpreted to enhance the capacity of and transfer
analysis technology to the counterparts. These samples will also be subjected to mineral tests and
used as materials for constructing deposit models.
It should be noted here that even after the study has been completed, capacity will be further
developed through on-the-job training, seminars, and personal instruction so that the GSD will be
able to continue to compile geological maps and develop resource information. The main items of
the survey will be as follows:
Phase A: Preparations for Compiling Geological Maps
Understanding the current state of the mining sector in Zambia and reviewing existing
geological and mineral resource information
Revising existing 1:1,000,000 geological and mineral resource maps and explanations
Undertaking preliminary field geological surveys in the geological survey areas for
compiling 1:100,000 geological maps
Analyzing satellite images and interpreting other images of the geological survey areas
Phase B: Compilation of Geological Maps
Undertaking field surveys, compiling 1:100,000 geological maps and explanations
Undertaking chemical analyses of samples taken during field surveys, conducting mineral
tests
Revising and developing a GIS database related to mineral resource development,
including geological and analytical data obtained from geological surveys
Phase C: Development of Resource Information for Promoting Investment
Completing 1:1,000,000 geological and mineral resource maps and explanations
Completing 1:100,000 geological maps and explanations
Presenting research results in investment promotion seminars in Zambia and Japan, and at
international events such as INDABA and PDAC
Nurturing human resources who can continue the above tasks even after the present
survey has ended.

4
1.5 Site Study
(1) Implementation of the Study
The first site study was carried out from 24 February to 8 March, 2007 (13 days), the first part
of the second study lasted from 10 June to 6 July, 2007 (27 days), the second part of the
second study – from 8 August to 29 November, 2007 (114 days). The third study was
conducted from 29 June to 25 November, 2008 (150 days), the fourth study was undertaken
from 6 January to 15 February, 2009 (41 days). The fifth study lasted from 26 February to 7
March, 2009 (10 days). The sixth study was implemented from 25 May to 4 June, 2009
(11days). The JICA study team completed the site study as scheduled.
One senior staff member joined the team from the National Institute of Advanced Science and
Technology (AIST) in the second (2) site study.
(2) Study Team Members
The assignments and study periods for each member were as follows (Table 1.5.1):
Table 1.5.1 List of Team Members
Name Assignment First Site StudySecond Study
(part 1)Second Study
(part 2)
Marutani, Masaharu Leader/
Investment promotion24.2.2007
to 8.3.2007 10.6.2007
to 3.7.2007
14.8.2007 to 6.9.2007 7.11.2007
to 26.11.2007
Hirose, Kazuyo Geology A 24.2.2007
to 8.3.2007 10.6.2007
to 6.7.2007 8.8.2007
to 29.11.2007
Inoue, Toshio Geology B 24.2.2007
to 8.3.2007 10.6.2007
to 6.7.2007 8.8.2007
to 29.11.2007
Watanabe, Hidehisa GIS database - 10.6.2007
to 29.6.2007 19.8.2007
to 25.9.2007
Fujii, Noboru Coordinator - 12.6.2007
to 27.6.2007 -
Name Assignment Third Site Study Fourth Site Study Fifth Site Study Sixth Site Study
Marutani, Masaharu Leader/
Investment promotion
29.6.2008 to 31.7.2008 13.9.2008
to 15.11.2008
15.1.2009 to 15.2.2009
- 25.5.2009
to 4.6.2009
Tsushima, Norio Geology A 29.6.2008
to 15.11.200813.1.2009
to 15.2.2009 - -
Takebe, Akimitsu Geology B 29.6.2008
to 15.11.200813.1.2009
to 15.2.2009 26.2.2009
to 7.3.2009 25.5.2009
to 4.6.2009
Watanabe, Hidehisa GIS database
29.6.2008 to 25.7.2008 6.11.2008
to 25.11.2008
6.1.2009 to 30.1.2009
- -
Management supervisor
Name Assignment Second Study
(part 2) Sixth Site Study
Ehara, Yushiki Planning/Coordination 18.11.2007
to 25.11.2007 25.5.2009
to 2.6.2009
Watanabe, Yasushi Geological Survey Plan18.11.2007
to 25.11.2007 -

5
(3) Minutes from Meetings with the Zambian Side
The Japanese Team had three meetings with the Steering Committee, which represented the Zambian
side in the “Study on Geological Mapping and Mineral Information Service Project for the
Promotion of the Mining Industry in the Republic of Zambia”, and reached agreements on the
following (minutes presented in Appendix I-1, I-2 and I-3):
a. The First Steering Committee meeting (5 March, 2007)
The contents of the Inception Report and study schedule;
Overview of domestic and international seminars;
Approval of the Inception Report
b. The Second Steering Committee meeting (9 July, 2008)
Confirmation and adoption of the minutes of the First Steering Committee
meeting
Summary of the Interim Report, and approval of the Report
Results of field program in 2007
Project program in 2008 and Investment promotion programs
c. The Third Steering Committee meeting (29 January, 2009)
Summary of the Draft Final Report, and approval of the Report with comments of
the Zambian side.
Further investment promotion programs
(4) Organization of the Workshop and Lecture
A workshop was held for the purpose of technology transfer, with the following schedule:
Database, GIS and Remote Sensing Workshop (Appendix I-4)
23 August, 2007 at the Conference room of ZAMCOM
The GIS database expert and remote sensing expert from the Team explained about the
basics of the database and vector data type. The experts also talked about the principles
of remote sensing and gave some examples of remote sensing analysis, and provided
technical instruction. In attendance were a total of 20 participants from GSD.
Special lecture on apatite: a possible source of rare earth elements (Appendix I-5)
20 November 2007 at the Conference room of the GSD
Dr. Y. Watanabe of the Geological Survey of Japan, AIST, explained about the demand
for rare earth elements in the world, several types of deposits from which rare earth
elements are extracted and the possibility for rare earth production from apatite. In
attendance were a total of 10 participants from GSD.
Practical Workshop of GIS and GPS (Appendix I-6)
10 July, 2008 at the Conference room of ZAMCOM
The GIS database expert and two senior geologists from the Team explained about the

6
basics of GIS, and showed how to create a geological map with Arcview, and digitize a
geological map with TNT Mips, and talked about the GPS data processing method and
gave some examples of geological field surveys. In attendance were a total of 13
participants from GSD.
Seminar on Geological Mapping (Appendix I-7)
11 November, 2008 at the Conference room of ZAMCOM
Two senior geologists from the Team and a geologist from the GSD explained about
the results of the geological field survey, the analytical results of the geochemical
survey and comprehensive analysis, and presented four new sheets of 1:100,000
geological maps. There were 16 participants from the GSD in attendance.
Draft Final Seminar (Appendix I-8)
27 January, 2009 at the Amalila conference room of the Taj Pamodzi Hotel
The results of this study were presented by the leader, two senior geologists and a
GIS expert from the Team, together with a senior geologist from the GSD. They
presented a summary of the study, the results of the geologic dating, the analytical
results of the geochemical survey, the GIS database, and comprehensive analysis. A
total of 39 participants including 16 participants from the GSD and 4 participants
from MMMD headquarters were in attendance. The seminar deepened their
understanding of the role and results of the study.
(5) International Seminar
Seminar for Promoting Investment in Zambia (Appendix I-9)
16 December, 2008 at the Toyo Conference Room of the Japan Oil, Gas and Metals
National Corporation (JOGMEC)
In order to give potential Japanese investors a good understanding of the investment
climate and mineral resources potential of the Zambian mining sector, an investment
seminar was held in Tokyo under the auspices of the Zambian Embassy, JICA, and
JOGMEC. The Zambian government was represented by the Director and a senior
officer of the ZDA, and the Director and two senior officers of the GSD. There were
a total of 60 participants, including representatives of leading Japanese trading
companies, major banks and mining companies, and governmental mining related
organizations and institutes.
Mining INDABA (Appendix I-10)
9 February to 12 February, 2009 at the Cape Town International Convention Centre
At Mining INDABA 2009, the Team set up a Zambian display booth to explain about
the investment climate in the mining sector and the mineral resources potential for
international investors, and to promote investment in exploration in Zambia.
7
Representatives included the Director and a senior geologist from GSD, a senior
privatization officer from ZDA, and the Team Leader and two senior geologists from
the Team. A total of 300 people from mining, exploration, banking, and investment
companies visited the Zambian booth.
PDAC (Appendix I-10)
1 March to 4 March, 2009 at the Metro Toronto Convention Centre
At PDAC 2009, the Team also set up a Zambian booth to explain about the
investment climate in the mining sector and mineral resources potential for
international investors, and to promote investment in exploration in Zambia. The
Representatives included the Director and a chief geologist from GSD, and a senior
geologist from the Team. A total of 200 people from mining, exploration, banking,
and investment companies visited the Zambian booth.
Investment Seminar in Zambia
During the 6th site survey, a seminar will be set up in late May, 2009.
The Team Leader and a senior geologist will represent the Team at the Copperbelt
Mining, Agricultural and Commercial Show in Kitwe city in Copperbelt province, and
will explain about the results of the study to people from mining and exploration
companies at the MMMD booth.
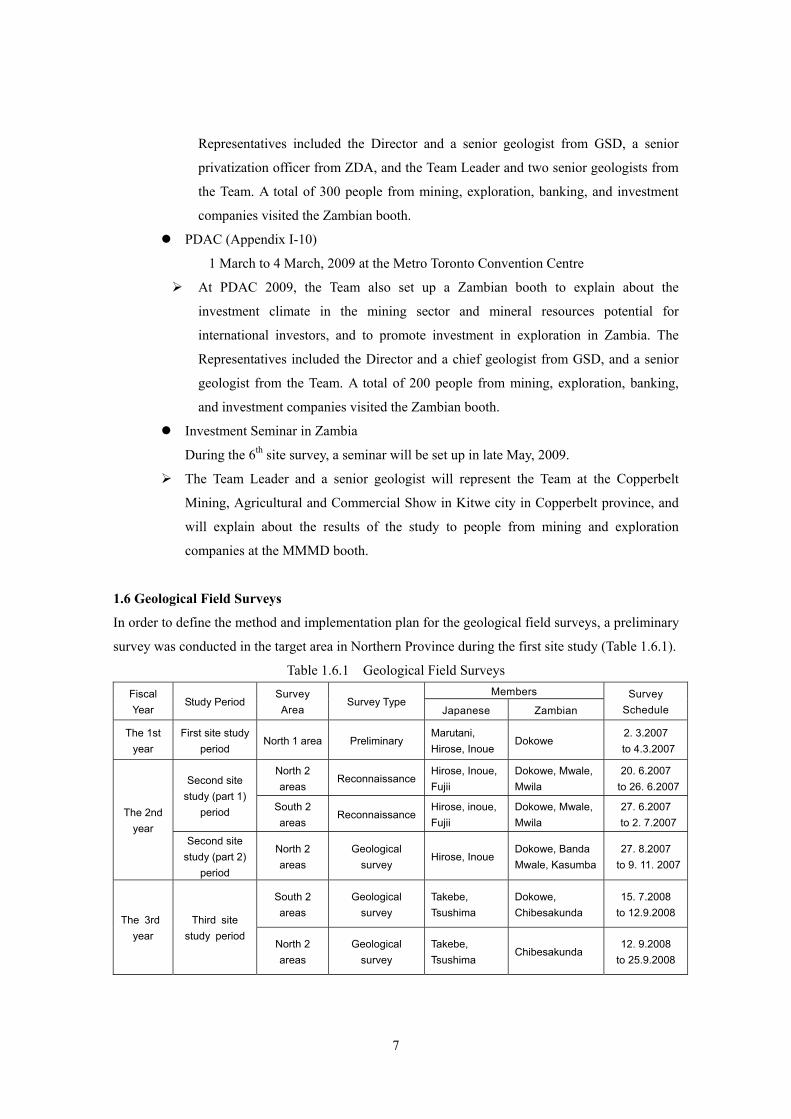
1.6 Geological Field Surveys
In order to define the method and implementation plan for the geological field surveys, a preliminary
survey was conducted in the target area in Northern Province during the first site study (Table 1.6.1).
Table 1.6.1 Geological Field Surveys
Members Fiscal
Year Study Period
Survey
Area Survey Type
Japanese Zambian
Survey
Schedule
The 1st
year
First site study
period North 1 area Preliminary
Marutani,
Hirose, Inoue Dokowe
2. 3.2007
to 4.3.2007
North 2
areas Reconnaissance
Hirose, Inoue,
Fujii
Dokowe, Mwale,
Mwila
20. 6.2007
to 26. 6.2007Second site
study (part 1)
period South 2
areas Reconnaissance
Hirose, inoue,
Fujii
Dokowe, Mwale,
Mwila
27. 6.2007
to 2. 7.2007The 2nd
year Second site
study (part 2)
period
North 2
areas
Geological
survey Hirose, Inoue
Dokowe, Banda
Mwale, Kasumba
27. 8.2007
to 9. 11. 2007
South 2
areas
Geological
survey
Takebe,
Tsushima
Dokowe,
Chibesakunda
15. 7.2008
to 12.9.2008 The 3rd
year
Third site
study periodNorth 2
areas
Geological
survey
Takebe,
Tsushima Chibesakunda
12. 9.2008
to 25.9.2008

8
Based on the implementation plan, reconnaissance geological surveys were carried out in four target
areas during the first part of the second site study. In the second part of the second site study,
1:100,000 scale geological field surveys were implemented in two northern survey areas. In the third
site study, 1:100,000 scale geological field surveys were carried out in two southern survey areas.
The survey group was composed of JICA study team members and counterparts from GSD. Several
technologies for survey methods and drawing of route maps were transferred to the counterparts
through the geological field surveys.
1.7 Steering Committee
The Members of the Steering Committee, consisting of representatives of GSD, MDD and MSD, are
shown in Table 1.7.1.
Table 1.7.1 Members of the Steering Committee
Name Title, Organization
Chairman Mr. Kennedy Liyungu Director, Geological Survey Department
Member Mr. Charles Dindiwe Chief Mining Engineer, Mineral development Department
Member Mr. B. Chewe Ag. Snr Inspector of Explosives, Mines Safety Department
1.8 Nurturing human resources
1.8.1 Skill levels of the counterpart (C/P) members at the beginning of this study
1) Field geological survey techniques
Listings of items for geological field surveys were not uniform because the lack of a standard
form.
The counterparts’ ability to use handy GPS receivers in field surveys was mainly restricted to
the positioning function. They did not have sufficient know-how to effectively incorporate GPS
measurement results into GIS.
2) Editing of geological maps
Although C/Ps had learned basic methods for using GIS software, they had not achieved a level
that was sufficient for creating publishable maps (lack of experience).
3) GIS database
The registered mineral resource database was not sufficiently understood by the GSD database
engineer.
Two-thirds of registered mineral occurrences data had a significant lack of supplementary
information (ex. coordinate data)
In data searches, there were difficulties in finding the data that were being sought (problems
with the data output format)

9
4) Providing information on Zambia’s resources
GSD personnel had no experience in providing information to investors at international
conferences, etc.
GSD personnel had insufficient experience in discussing pertinent topics with investors.
1.8.2 Technology transfers made through the study and their results
The following technology transfers were conducted through the site study for the purpose of
improving C/Ps’ skill levels mentioned above.
Technology transfer through the Practical Workshop
Technology transfer through geological field surveys
Technology transfer through field data processing and reporting
Assistance with the Seminar for Promoting Investment in Zambia (Tokyo) geared toward
Japanese investors
Assistance with promotional activities at international conferences (INDABA, PDAC)
Assistance with providing information at a domestic seminar in Zambia (Copperbelt Show)
Technology transfer for revising the GIS database
The details of transfers and their results are described below.
(1) Technology transfer through the Practical Workshop
a) GIS Course for Geologists
“Geology A” of the study team made the following presentation about GIS software, using
Arcview as an example.
Basics of GIS
Explanations were given about the definition of GIS and specific examples, data format of GIS,
and projective methods.
Creation of a geological map using Arcview
Explanation about the procedure for using GIS to create a geological map from field survey data.
Applications of GIS to geological surveys
Explanations were given about importing previous geological information and field survey results,
and conducting data analyses using GIS software.
Practical training
In addition to lectures, counterpart engineers got practical experience by receiving hands-on
software training on actual PCs at the GSD.
b) Methods for processing GPS data in the outdoor (field) survey

10
Geology B Team Members gave a presentation about methods for using a handy GPS receiver.
There was an explanation about how coordinate data for the planned survey points, the plan for
taking samples, etc., were uploaded into a GPS receiver and the procedure by which the data
were used for field navigation.
There was a presentation about the method for downloading GPS data into a PC.
The presenter explained about downloading point coordinates, reconnaissance survey route data,
etc., obtained with a GPS receiver into a PC, while keeping in mind the incorporation of field
survey data into GIS
Demonstration
GPS was operated in an actual setting outside the presentation hall, and a demonstration was given
of how data were processed in a PC.
c) Overview of TNT Mips and Methods for Use
The GIS Database Team made the following presentation on GIS software, using TNT Mips as an
example.
Method for displaying spatial information
The Team explained about the basics of TNT Mips, method for installing software, creating a data
structure, and method for displaying spatial information with TNT Mips.
Digitization of geological maps
The Team explained the procedure required for creating digital geological maps, including
inputting geological map data using TNT Mips, assigning coordinates, and creating vector data.
(2) Technology transfer in the geological field survey
The following types of technology transfers were made during the field survey in Northern Province
Effective field study planning
Every day, road and topographical information, locations of rivers that might be obstacles, etc.,
were extracted from satellite image data, and plans for an effective survey route for the next day
were formulated based on the estimated distribution of outcrops. Technology transfer was made
regarding the procedure.
Methods for using GPS
Technology transfer was also made regarding methods for uploading next-day survey plans onto
GPS and downloading acquired coordinate data into a PC.
Introduction of outcrop lists, sheets for taking samples for geochemical surveys
Technology transfer involved introducing formatted outcrop lists and sheets for taking samples for
geochemical surveys and methods for systematically acquiring and arranging geological

11
observation information.
Methods for managing sample IDs
In order to prevent discrepancies in sampling, technology was transferred for serializing sample
IDs, and a ticket system was introduced (in which sample IDs are entered on the list sheet
beforehand and inserted as a ticket into the sample bag when the sample is collected; this can
prevent unintentional redundancy of numbers, mistakes in transfer, etc.
3. Technical transfer for collecting and processing field geological survey data
Here, the technology transfer involved creating route maps, compiling data, and creating
geological maps.
A cooperative effort was made to prepare survey reports and create an instruction manual for
geological maps
(4) Assistance with the Seminar for Promoting Investment in Zambia (Tokyo)
The seminar held in Tokyo was attended by one representative each from GSD and ZDA, who gave
presentations on the investment climate in the Zambian mining sector and the country’s mineral
resource potential. This seminar produced the following results:
It demonstrated that Japanese companies are highly interested in the Zambian mining sector:
more than 60 representatives from Japanese trading companies, banks, mining companies,
and government organizations attended the seminar.
Through the presentations, Japanese participants were able to get more than a general
overview of Zambia—for example, they learned much about the country’s strengths, such as
political and social stability, and a highly accommodating attitude toward attracting
investment.
Reference materials distributed to attendees included the Zambian Mining Journal
Supplement and an investment promotion CD.
Discussions with attendees provided the counterparts with a clear understanding of the
information that Japanese companies require (such as specific conditions, infrastructure,
etc.).
The seminar provided a way for the Zambian side and Japanese companies to begin directly
exchanging information.
(5) Support for providing information at international conferences (INDABA, PDAC)
By engaging in discussions with investors at INDABA, PDAC and collecting information from
related government organizations from other countries, the participating counterparts were able to

12
obtain the following perspectives
They became aware of the importance of continuously providing information for promoting
investment
They became aware of the specific types of information that investors demand.
They became aware that providing opportunities for junior companies, major companies and
finance organizations to get together is very effective for promoting the development of the
Zambian mining industry.
Visitors to the booth were given a copy of the Zambian Mining Journal Supplement and
attendees were given an investment promotion CD. There was also disclosure of the results of
the present development survey.
(6) Assistance at a domestic seminar in Zambia (Copperbelt Show)
There was a booth with exhibits at the Copperbelt Show held in Kitwe, which provided the
following results:
In addition to mining and investment companies, the booth attracted visitors from related
Japanese companies. This was an excellent opportunity to present visitors with the results of
the present development study.
This was also an opportunity to introduce the revisions made to the 1:1,000,000 geological
and mineral resource maps to people involved with the Mopani Mine, the Konkola Mine, and
the mining association.
An explanation of the results of the present survey could be made directly to Deputy Minister Beene
of the Ministry of Mines and Minerals Development. Due to the success of the Mining Journal
Zambia Supplement, the Deputy Minister expressed the desire to have a revised edition published at
the next opportunity.
(7) Technology transfer related to the GIS database structure
The following results were obtained by transferring database structure technology to the people in
charge of the GSD database:
Problem points related to the quality of the data stored in the mineral resources database (such
as missing data, errors such as overlapping, etc.) were discussed so that everyone at GSD would
be aware of them.
Regarding data reliability, conditions were created to encourage discussion within GSD.
The counterparts learned that GIS is a tool for displaying and evaluating simple data, and they
were able understand how important the data in GIS is. As a result, the GSD side recognized the
need to continuously maintain, update, and ensure the quality of GIS data.
Counterparts were also able to learn about methods for acquiring GIS data, etc., owned by other
organizations.

13
By changing the format of the data registered in GIS, it became possible to make flexible
searches and evaluations.
1.8.3 Important points for future improvement
1) Geological surveys
Use of PCs and GPS in geological field surveys and processing data in the field.
Acquiring practical experience for processing survey results, such as converting geological
study data to GIS
Thoroughness in entering data on outcrop and sampling sheets
Accumulation of practical experience with methods for using GPS equipment (ex data
uploading to GPS receivers)
Enhancing skills for using GIS software
2) Creating geological maps
Enhancing skills for creating diagrams, etc., for printed manuscripts using software programs
such as GIS and CAD.
3) GIS database
Learning how to reevaluate the contents of the mineral resource database (discovering and
fixing data errors, continuous maintenance and management of the database, etc.) and
techniques for ensuring their quality.
At the present time, it is not clear who exactly is in charge of or responsible for managing
geological information. In order to meticulously ensure the quality of the data, there must be a
clear understanding of who is in charge/responsible for this information (constructing a
management system).
4) Provision of information on Zambia’s resources
Please refer to the following section for suggestions for promoting investment in Zambia’ mining
sector, including the provision of resource information
1.9 Suggestions for promoting investment
The following is a recommendation for ways to promote investment in the Zambian mining sector:
(1) Building an exploration report system
Every quarter, the Zambian government, through the MDD of the MMMD, releases reports on the
amount of copper, cobalt, etc., that was produced in active mines. However, there is still insufficient
effort being made to report on the activities of mines, exploration companies, etc., operating under

14
the Mining Law, such as yearly length of boring, amount of tunnels and shafts, proven reserves and
grade, and the amount of money invested in exploration. For the government, it is difficult to get
basic statistical values for exploration work and a clear understanding of the amount of proven
reserves broken down by mineral type. These basic statistical values provide objective criteria for
judging the ability of the government’s mining policies to improve the lives of the citizens, and are
also basic values that will have an effect on future revenue generation (tax collection) in national
long-term development plans and elsewhere. In the future, it will be necessary to construct and
meticulously manage and operate a system for reporting on the amount of exploration work.
(2) Provision of investor-oriented information on a regular basis
Although various methods and media may be used for providing and conveying mining
information to the outside, those which are feasible for the Zambian government are listed
below. We believe that it will be important for the MMMD (especially GSD) to form a close
working relationship with ZDA to address this issue.
The latest information about the Zambian mining sector should be provided to investors
through such media as web sites, e-mail and periodicals.
Regular updating of web site
The GSD web site that is currently accessible to the public should be updated regularly to provide
the latest information. In addition to information that is already available to the public on the web
site, large amounts of the following types of information should also be provided:
Latest information on exploration projects in Zambia
Legal system, mining law, tax system (especially royalties)
Changes, etc., in procedures for acquiring concessions
Infrastructure information
Public release of maps showing the state of concession acquisition
Maps should be publicly released on the web site and in other media so that investors can quickly
gain an understanding of the state of concession acquisition in Zambia
Synopses (available areas, etc.): Should be provided free of charge
Detailed information: Provided for a fee
Introduction of supporting companies related to the Zambian mining sector
Information should be made available about mining-related companies that provide necessary
support services for resource development in Zambia, such as mining consultants (geological
surveys, physical prospecting, boring, etc.), engineering companies, infrastructure survey
companies, law firms (for advice on procedures related to direct investment), and so on, and help

15
junior and major mining companies that are involved with examining development proposals,
exploration and development, to access these supporting companies.
Promoting exploration activities by junior exploration companies
Junior exploration companies conduct surveys at or near the grass roots level and take on the
riskiest part of global resource development. By being listed on stock exchanges in Canada,
Australia, New Zealand, etc., these companies can procure exploration funds, which are essentially
“risk capital”, from ordinary investors. If the results of exploration work are successful and a
junior company discovers an excellent deposit, it can sell its rights to a mining company, and the
junior company and its investors can reap capital gains. The mining company can proceed to the
construction and operational stages for this via such means as feasibility studies. Therefore, getting
junior exploration companies as involved as possible in exploration activities is important for
promoting mining investment.
To promote exploration, the exploration reporting system described earlier will be used to provide
information on the activities of junior exploration companies that are conducting exploration work
in Zambia, and will be closely tied to providing junior exploration companies with the information
that they need. In addition, it will also be able to link to information geared toward junior
exploration company investors (mining companies, etc.) from the GSD web site, and act as a
portal to the GSD, providing access to quarterly and annual reports. For investors visiting GSD to
gather information, the system can provide an introduction to junior exploration companies. By
providing such information, this system will be helping to support exploration work and identify
issues in exploration and development.

17
Chapter 2 Current Investment Climate and Situation of the Mining Industry
2.1Overview
The current Zambian mining policy was implemented in 1995. Although mining administration has
been centralized into the Ministry of Mines and Minerals Development, its performance is still
lackluster due to a shortage of manpower. Efforts should be made to attract foreign investment using
provisions of the Mines and Minerals Act and the Investment Act. Management of mineral resources
data is systemized, but its update, addition and utilization are issues to be addressed in the future.
Nurturing of human resources is another task that should be done to promote the mining sector.
Mining activities in Zambia mainly involve foreign-owned enterprises extracting copper from mines
that were privatized by ZCCM. Exploration is implemented by foreign companies with copper-gold
and copper-nickel as targets. However, mineral potential has not been evaluated in many regions
because there is lack of basic geological information such as geological maps. This in turn hinders
further exploration. Zambian mining law is more competitive than that of neighboring countries in
terms of mining rights, license areas and royalties.
2.2 Role of the Mining Sector
The 2007 GDP of Zambia was US$11 billion. The annual GDP growth rate is 6.2%. The main
industries of Zambia include farming, mining,
manufacturing, construction, tourism, and services,
and their respective shares of the 2007 GDP were
13%, 8%, 10%, 11%, 3% and 52% (Fig. 2.2.1).
Since 2006, Zambian trade has been in a surplus, with
exports surpassing imports. This is largely the result
of increased prices of Zambia’s main export minerals
such as copper and cobalt in recent years (Fig. 2.2.2).
Imports include machinery, petroleum, vehicles,
electronic equipment, and iron and steel.
The make-up of Zambia’s trading partners for exports and imports is vastly different. Partners for
exports include European countries such as the UK and Switzerland which are the destination for
45% of Zambia’s exports, followed by countries such as South Africa and Congo of the Southern
African Development Community (SADC), which receive 18% of Zambia’s exports. South Africa is
the source of 46% of Zambia’s imports, followed by other SADC countries (11%) such as Zimbabwe
and Tanzania, and UAE (10%) (Fig. 2.2.3).
Fig. 2.2.1 Zambian GDP by Economic Activity
(Source: MIF Statistical Appendix 2007)
Services52%
Tourism3%
Mining8%
Manufacturing10%
Electricity, gas& water
3%
Construction11%
Agriculture13%
GDPat Market Prices
US$ 11 billion

18
Fig. 2.2.2 Zambia’s Exports and Imports by Commodity (2007)
(Source: Zambian Central Statistical Office)
Fig. 2.2.3 Zambia’s Exports and Imports by Country (2006)
(Source: Zambian Central Statistical Office)
Zambian trade with Japan is at a surplus for Zambia. Specifically, in 2007 Zambia’s exports to Japan
totaled 14.8 billion yen (125 million US dollars), while its imports from Japan totaled 3 billion yen
(25 million US dollars). Furthermore, in value terms more than 90% of Zambia’s exports to Japan
are mine products such as cobalt, electrical copper, crude copper, and copper concentrates. In
contrast, more than 70% of Japan’s exports to Zambia are in the form of used automobiles and other
vehicles, with used telephone equipment, and construction equipment such as bulldozers making up
much of the remainder (Fig. 2.2.4).
Sugar2%
Cereal2%
Others12%
Machinery7%
Metalliferousores6%
Metals71%
ExportUS$ 4.6 billion
(FOB base)
Machinery22%
Others38%
Fertilizers3%
Telecommunications3%
Vehicles9%
Electrical machinery5%
Metalliferous ores3% Iron and steel
5%
Petroleum12%
(CIF base)
ImportUS$ 4.0 billion
Thailand7%
China7%
Others16%India
3%
OtherEuropeancountries
3%
UK3%South Africa
11%Other SADC4% Congo
3%
Egypt4%
Japan0%
Switzerland39%
(FOB base)
ExportUS$ 3.8 billion UAE
10%
Japan2%
South Africa46%
OtherEuropeancountries
6%
Zimbabwe6%
Other SADC3%
Tanzania2%
China3%
Others15%
UK4%
India3%
(CIF base)
ImportUS$ 3.0 billion

19
Fig. 2.2.4 Trade between Japan and Zambia (2007)
(Source: Trade Statistics of Japan)
Table 2.2.1 shows statistical information on the main non-ferrous metals that Japan imports from
Zambia. In 2007, Japan imported 12,763t of cobalt ingots (mattes, etc.), of which 988t were
supplied by Zambia. Zambia is the 5th largest supplier of cobalt to Japan, behind Finland (4,575t),
Australia (2,695t), Canada (1997t), and Norway (1,134t).
In 2007, Japan imported a total of 20,735t of crude copper, of which 2,553t was imported from
Zambia. Zambia is the 4th largest supplier of crude copper to Japan, behind the Philippines (7,487t)、
Indonesia (5,008t) and Chile (3,038t). In the same year, Japan imported 102,273t of electrical
copper, of which 3,600t came from Zambia. Zambia is the 6th largest supplier of electrical copper
to Japan, behind Chile (44,924t), Indonesia (16,830t), Peru (11,643t), the Republic of Korea
(10,900t), and the Philippines (4,727). Additionally, Japan imported 8,000t of copper concentrates
from Zambia.
Table 2.2.1 Japanese Imports of Non-ferrous Metals from Zambia
(Trade Statistics of Japan, 2007)
Importedfrom Zambia
(A)
Totalimported toJapan (B)
Percentage(A)/(B)
RankImportedamount
(million \)
Importedamount
(million US$)Cobalt mattes and others (t)
988 12,763 7.7% 5 6,688 56
Unrefined copper (t)
2,353 20,735 11.3% 4 2,093 18
Refined copper (t)
3,600 102,273 3.5% 6 3,022 25
Copper concentrate (Kt)
8 5,051 0.2% 12 1,748 15
Total 13,551 114
Others10%
Cars and othermotor vehichels
73%Telephone basestations
10%
Bulldozers andmachinery
7%
ExportJPY 3.0 billionUS$ 25 million
(FOB base)
Cobalt46%
Refinedcopper
20%
Tobacco7%
Unrefinedcopper
14%
Copperconc.12%
Others1%
ImportJPY 14.8 billionUS$ 125 million
(CIF base)

20
2.3 Mining Policy
The key objectives of the Government's Mining Policy, published in 1995, are as follows:
To make the private sector the principal producer and exporter of mineral products through
the establishment of a privatization programme.
To promote the private sector initiative in the development of new mines in order to increase
and diversify mineral and mineral-based products and exports.
To promote the development of a small-scale mining industry.
To promote the development of gemstone mining and facilitate market liberalization.
To promote the exploration and exploitation of industrial minerals and energy minerals and
to encourage the establishment of a ferrous metal industry.
To reduce the danger of ecological damage arising from mining operations as well as
potential damage to the health of workers and local residents from air, water, and soil
pollution.
To promote the local processing of raw minerals into finished products for added value.
The policy is aimed in particular at encouraging private investment in exploration and in the
development of new mines. In addition to returning the major copper mines to the private sector,
thus encouraging cost-effective management and greater exploitation of the enormous copper
resources, the policy seeks to direct attention to the exploitation of the very diverse range of
metalliferous deposits, industrial minerals, gemstones, and energy resources that exist in Zambia.
2.4 Mining Administration
Mining administration is under the jurisdiction of the Ministry of Mines and Mineral Development
(MMMD), which consists of a Geological Survey Department (GSD), Mines Development
Department (MDD), Mines Safety Department (MSD) and Human Resource and Administration
(HRA) (Fig.3.4.1).
Minister
Vice MinisterPermanent Secretary
Vice Minister(Small Scale Mines) (Large Scale Mines)
Technical Records Analysis Laboratory
Human Resourceand Administration
Department
Geological SurveyDepartment
MinesDevelopmentDepartment
Mines SafetyDepartment
Administration Regeonal Mapping Economic Geology Geophysical Survey
Fig. 2.4.1 Organization Chart of MMMD and GSD

21
MMMD is responsible for all activities of the mining sector, including implementation of
improvements based on the mining policies adopted in 1995 by the government.
The primary roles of GSD are to provide geological, geophysical, and geochemical data on a
country-wide basis, to prospect on behalf of the Government, to act as a national depository of all
information relating to the geology of Zambia, and to provide support and advisory services to the
public. The Department also administers prospecting licenses, mineral processing license, geological
and mining consultancy and mineral laboratory permits.
Key responsibilities for MDD are the issuance of all mining licenses, together with mining
operations to ensure that development is in line with approved programmes of operations and in
accordance with the Mines and Minerals Act. The Department also issues Gemstone Sales
Certificates.
MSD is divided into four technical sections - Mining, Explosives, Machinery and Environment -
which enforce the relevant legislative and statutory instruments, formulate new legislation and
regulations, evaluate all aspects of safety in mining operations, and offer technical advice and
training in their respective fields. Roles of individual departments are indicated in Table 2.4.1.
Table 2.4.1 Roles of MMMD
Institution Roles
Ministry Mines and Mineral Development
- Sector Leadership - Mining Policy formulation and guidance - Mobilize funds and other resources - Overall responsibility for human resources - Investment promotion
Geological Survey Department
- Geological mapping of the country - Enforcement of Mines and Minerals Act - Provide geo-science information to local and foreign investors (e.g.
mineralogical, geochemical, geophysical, etc.) - Geo-analysis of samples (analytical services)
Mines Development Department
- Mining registry - Survey of Ministry Rights - Provide extension services to the Miners through the regional mining bureaus - Licensing - Enforcement of Mines and Minerals Act
Mines Safety Department
- Enforcement of Mining Safety Regulations on all operating mines. - Enforcement of the Explosives Act - Licensing of handlers of explosives - Issuance of manufacturing and blasting licenses
(Source: MMMD Homepage)
The budget for the MMMD has been growing year-by-year; for example, the budget for 2007, at
42.2 billion Kwacha (about 11.7 million US dollars), is roughly triple the 2006 budget (Table 2.4.2).

22
Much of this increase is going to fund disaster prevention associated with the activation of mining
operations and field surveys associated with oil exploration and amendment of the Mines and
Minerals Development Act.
Table 2.4.2 Actual Expenditures and Budget of MMMD
2004 (Results)
2005 (Results)
2006 (Results)
2007 (Results)
2008 (Approved Estimates)
Headquarters (million ZK) 4,434 6,320 3,792 5,055 12,554GSD (million ZK) 2,250 3,091 4,474 11,332 17,124MDD (million ZK) 968 1,905 2,699 3,088 7,570MSD (million ZK) 1,318 3,865 2,062 3,471 4,944Ministry Total (million ZK) 8,970 15,181 13,027 22,946 42,192Exchange rate (ZK/$) 4,782 4,516 3,603 4,053 3,600Total (thousand US$) 1,875 3,362 3,616 5,661 11,720
(Source: HRA)
2.5 Geological Survey Department (GSD)
The GSD was established in 1950, and is currently comprised of the following six units:
Administration, Regional Mapping, Economic Geology, Geophysical Survey, Technical Records,
and the Analysis Laboratory (Fig.2.3.1). There are around 50 employees, including 12 geological
engineers, 1 geophysical exploration specialist, and 2 chemical engineers.
The roles of the GSD are to 1) advise the MMMD about geological and mineral resource matters, 2)
produce geological and mineral resource maps covering the entire country, 3) supervise the activities
of exploration companies, 4) manage all geology and mineral resources-related information, provide
information to domestic and international investors, and promote investment in the mining sector, 5)
conduct chemical analyses of samples, and 6) provide a wide range of geology-related services.
The GSD budget for 2008 is 17 billion Kwachas (4.8 million US dollars). In 2008, the sum of 12
billion Kwachas (about 3.5 million US dollars) was added to the normal operating budget of 5
billion Kwachas (about 1.3 million US dollars) to pay for special petroleum surveys. This increase
more than trebled the normal operating budget. The special petroleum surveys are being treated as a
temporary outlay. About 40% of normal operating expenses are used to pay salaries and wages, 20%
is used for office maintenance, and the remaining 40% is used for work related to surveys and
studies (such as travel expenses, vehicle maintenance, fuel, supplies, etc.). However, there is not a
steady source of survey funding.
GSD is equipped with a chemical analysis laboratory and a metallurgical laboratory, but the
equipment and apparatuses have become so old and decrepit that they are nearly all unusable.
Furthermore, GSD has no boring machine. In 2007, extra money was received from the government
for the petroleum surveys, and this money was used to purchase several new 4WD vehicles and

23
other equipment.
2.6 Mining Legislation
2.6.1 Mines and Minerals Development Act
In line with the Mining Policy, the Government of Zambia enacted new legislation in 2008 - the
Mines and Minerals Development Act No.7 of 2008 - which greatly simplifies licensing procedures,
places minimum reasonable constraints on prospecting and mining activities, and creates a very
favorable investment environment. A framework for responsible development has also been created
through the publication of the Environmental Protection and Pollution Control Regulations in 1997.
Legislation has provided the following basic assurances for foreign investors:
Secure title to mining rights
Economic stability
Retention of foreign exchange (currency)
Right to market mine products
Right to assign (trade) mining rights
Freedom to conduct commercial operations
The cadastral unit of MDD consists of concession maps, and a mining company ledger system.
Investors can do ‘one-stop shopping’ for exploration rights, mining rights, and so on. All investors
are guaranteed technical and legal safety with mining rights, and the procedure for obtaining mining
rights is being simplified. Both mining and exploration companies can own 100% of rights they have
received. Fees for approving and renewing (annually) exploration rights and mining rights are
reasonable, making investment in this sector more attractive.
For all minerals except petroleum, Zambian law divides rights that can be given for prospecting and
development into 7 categories (Appendix II-1, II-2 and II-3).
Initial large-scale prospecting licenses are granted for a 2-year period, and can be renewed twice,
each time for two years. Furthermore, the Ministry can extend these licenses for another year at its
discretion, meaning that it is possible to have a total of 7 years of prospecting licenses. The upper
limit of each prospecting license is 1,000 km2 and a cumulative of 5,000 km2. The area must be
reduced by 50% each time a prospecting license is renewed.
In the case of large-scale mining license, licenses can be issued to mine operators for 25 years of
operations and exploration. If reserves are expected to last longer than that, it may be possible to

24
renew these licenses for another 25 years. The upper limit of a mining license is 250 km2. In addition
to excavation and investment plans, plans must also be submitted for environmental preservation and
for employing Zambian citizens in mining-related operations.
Small-scale prospecting permits cover a maximum area of 10km2 and are only good for one 2-year
period (no renewals allowed). Small-scale mining licenses are for a maximum of 400 hectares. They
are good for 10 years, but may not be renewed.
Gemstone licenses are divided into small scale and large scale. The large scale licences are greater
than 4 km2 up to maximum of 250 km2. While a small scale gemstone license up to maximum of 4
km2. Both gemstone licenses are granted for a 10-year period, but they may be renewed every 10
years thereafter. Artisan mining rights are issued to local residents and cover a maximum of 6.6
hectares. They are good for 2 years but may not be renewed.
The following is a brief list of some of the features of mining law in Zambia:
Mining licenses are issued according to the scale of the operation (large-scale and
small-scale).
There are 3 types of large-scale operations: large-scale prospecting licenses,
large-scale mining licenses and large-scale gemstone licenses. For small-scale
operations, there are 4 types of licences: small-scale prospecting permits, small-scale
mining licenses, small-scale gemstone licenses, and artisan mining rights.
Mining licenses are not classified by the type(s) of mineral(s).
Large-scale prospecting licenses are normally for a maximum of 6 years.
Large-scale mining licenses are issued for 25-year periods, and may be renewed.
Mining license can be transferred.
On the other hand, while they are not mining rights in Zambia, reconnaissance permits can be
granted to conduct reconnaissance. Such permits make it possible to enter an area that is not covered
by mining rights, and conduct preliminary surveys of mineral occurrence areas through physical
surveys, geochemical surveys, photogeology and/or surface reconnaissance, and/or conduct aerial
surveys. Permits are valid for 90 days.
2.6.2 Investment Law
Investments in Zambia are regulated by the Zambia Development Act No. 11 of 2006 (the ZDA Act).
The ZDA Act offers a wide range of incentives in the form of tax incentives, non-fiscal incentives,
exemptions & concessions for companies. The Act provides for investment thresholds that investors

25
have to meet to qualify for fiscal and non-fiscal incentives. There are five categories of investors
who can be considered under the ZDA Act.
The first is that of investors who invest not less than US$ 10 million in an identified sector or
product. This category of investors is entitled to negotiation with the Government for additional
incentives other than those they might already qualify for under the ZDA Act.
The second category is that of investors who invest not less than US$500,000 in the Multi Facility
Economic Zones (MFEZ) and /or in a sector or product provided for as a priority sector or product
under the ZDA Act. This category, in addition to being entitled to the general incentives, is entitled
to the following incentives:
Zero percent tax rate on dividends for 5 years from year of first declaration of dividends.
Zero percent tax on profits for 5 years from the first year profits are made. For year 6 to 8,
only 50 percent of profits are taxable and years 9 and 10, only 75 percent of profits are
taxable.
Zero percent import duty rate on raw materials, capital goods, machinery including trucks
and specialised motor vehicles for five years.
Deferment of VAT on machinery and equipment including trucks and specialised motor
vehicles.
The third category of investors relates to investors who are designated as micro or small enterprises
under the ZDA Act. Like the second category, this category is also, in addition to the applicable
general incentives, entitled to the following incentives:
For an enterprise in an urban area the income shall be exempt from tax for the first three (3)
years.
For an enterprise in a rural area the income shall be exempt from tax for the first five (5)
years.
The fourth category is that of investors who invest less than US $500,000 in a sector or product
provided for as a priority sector or product under the ZDA Act. This category is only entitled to
general incentives.
The fifth and last category is that of investors who invest any amount in a sector or product not
provided for as a priority sector or product under the act. This category of investors is also only
entitled to general incentives provided under the various pieces of legislation.

26
General incentives are incentives available to investors investing in various sectors of the economy.
These incentives are provided for under the pieces of legislation falling under the Zambia Revenue
Authority, namely the Customs and Excise Act, Income Tax Act and Value Added Tax Act.
The ZDA provides facilitation services to its clients. In this regard, the ZDA facilitates registered
investors to:
Acquire land;
Obtain water, electric power, transport, and communication services and facilities required
for their investments;
Regularize their immigration status;
Acquire other licences required to operate a business in any particular sector; and
Access any other after care assistance that may be required.
Investors who invest in Zambia enjoy the following guarantees:
Free repatriation of profits & dividends without restriction
Business cannot be compulsorily acquired by Government, except by act of parliament in
extreme circumstances
Protection against non-commercial risks, as Zambia is a signatory of multilateral investment
guarantee agency (MIGA and Africa trade Insurance Agency).
Impartial forum for resolving disputes
Investors can enter into Investment Promotion and Protection Agreements (IPPA) with the
Government.
2.6.3 Tax Regime
Zambia has a favorable tax regime for mining. Corporate tax is set at 25% of profits, while
manufacturing companies are taxed at a rate of 35% of profits. There is a complete exemption from
customs duty at the exploration stage. All mining equipment and machinery imported for mining
purposes can be exempted from customs duty throughout the life of a project. Companies that do not
show a profit during the exploitation (mining) stage have 10-year carry forward losses for tax
purposes. Furthermore, there is a favorable tax regime for exports.
Royalties were calculated at 0.6% of net back value of mineral products. In the Law, "net back
value" means the market value of minerals free-on-board at the point of export from Zambia or, in
the case of consumption within Zambia, less the cost of smelting and refining or other processing
costs, and the cost of transport, including insurance and handling charges, from the mining area to
the point of export or delivery within Zambia.

27
However, given the steep increases in the prices of copper and cobalt in recent years, the corporate
tax on these mine products rose from 25% to 30% in April 2008, and royalties rose from 0.6% to
3.0%. These trends in the tax rate are occurring against a backdrop of rising prices and rising profits
for mining companies, but because the Zambian royalty rate of 0.6% was noticeably lower than the
world standard of 2.5%, opinion polls showed that the portion of these profits that was being
returned to this resource country was not sufficient.
The tax regime for mining activities in Zambia compares favorably with other mining countries,
including other African countries (Appendix II-4). Accordingly, Zambia’s tax regime and tax rates
are internationally competitive.
2.7 Current Status of Mining Activities
The Zambian mining sector has been recovering sharply with the recently rising price of metals in
the international market spurred by increased demand for metals in Asia, especially China.
In the 1970’s, copper production in Zambia reached its peak (700,000 tonnes in 1972). Subsequently,
falling copper metal prices caused annual production to drop to 200,000 tons in the late 1990’s. The
privatization of Zambia Consolidated Copper Mine (ZCCM) began in 1996, and foreign capital
flowed in from investors such as Glencore (Switzerland) and First Quantum Minerals (FQM, Canada
- Australia). Consequently, copper production has increased since 2000, reaching a level of 570,000
tons in 2007 (Table 2.7.1).
Table 2.7.1 Production of Copper and Cobalt at Major Mines in Zambia
Company Mine Commodity Unit 2002 2003 2004 2005 2006 2007Copper tons 174,413 144,816 135,420 94,422 118,578 154,304Cobalt tons 2,039 1,157 210 19 -
Konkola Copper tons 47,597 50,347 43,552 45,358 18,901Other Copper tons - - 12,712 23,824 4,299
Copper tons 97,966 134,391 56,459 61,918 60,234 162,530Cobalt tons 1,786 2,045 2,128 1,777 1,437 1,788
Mufulira Copper tons - - 78,093 70,801 80,530Copper tons 7,548 6,887 5,247 5,699 9,718 12,636Cobalt tons 88 0 - - -
Bwana Mkubwa Bwana Mkubwa Copper tons 7,499 29,471 41,605 49,081 50,647 25,069NFC Africa Chambishi Copper tons 0 6,300 19,432 19,789 22,603 24,185
Copper tons - - - 17,632 22,793 20,832Cobalt tons - - - 3,652 3,212 2,672
Kansanshi Kansanshi Copper tons - - - 79,626 127,316 165,994
Copper tons 335,023 372,212 392,520 468,150 515,619 565,550
Cobalt tons 3,913 3,202 2,338 5,448 4,649 4,460Total
Chibuluma
(Source: Mines Development Department)
Chibuluma mines
Luanshya CopperMines
Chambishi
Nchanga
NkanaMopani coppermines pls
Konkola coppermines plc
With the high prices of copper in recent years, copper production expected to reach 700,000 tons in
2008 has been planned to exceed 900,000 tons in 2009. However, since September 2008 a major

28
financial crisis has caused demand and prices to fall significantly and this is bound to have a
negative impact on future production.
Currently, seven companies are producing cooper ore, copper concentrate, and/or cobalt in the
Copper Belt. The Zambian government holds 20-30% shares in these mining companies through
ZCCM Investment Holdings. The companies investing in major copper mines are shown in Table
2.7.2.
Table 2.7.2 Major Copper Mines in Zambia
Zambia Company Mines Controlling Company CountryMopani Copper Mines Plc(MCM)
Nkana and MufuliraMines
Glencore (Swiss 73.1%) /First Quantum (FQM 16.9%) /ZCCM (GRZ 10%)
Switzerland /Canada-Australia /Zambia
Konkola Copper Mines Plc(KCM)
Konkola, KonkolaDeep and North,Nchanga
Vedanta(51%) / Zambia CopperInvestment (28.4%) / ZCCM (20.6%)
UK / Luxemburg/Zambia
Bwana Mkubwa Mining Ltd(BMML)
Bwana Mkubbwa /Lonshi
FQM (100%) Canada-Australia
Chibuluma Mines Ltd. Chibuluma Southand West
Metorex / ZCCM South Africa /Zambia
Non Ferrous Metals AfricaMining plc (NFC).
Chambishi NFC(85%) / ZCCM (15%) China / Zambia
J and W Luanshya, Baluba J and W (85%) / ZCCM (15%) Switzerland / ZambiaKansanshi Mine Kansanshi FQM (80%) /
ZCCM (20%)Canada-Australia /Zambia
Lumwana Mine Lumwana Equinox (100%) Australia(Source: MMMD)
From 1999 to 2005, the Zambian mining sector received more than 1.4 billion dollars in foreign
investments. This money was used to develop copper mines, build smelters and cobalt processing
plants, and develop a new mine (by FQM Co.) at Kansanshi. In addition, the Indian company
Vedanta attracted world attention when it announced the Konkola Deep Mining Project (investment
of US$ 674 million, extraction of 7.5 million tons of 3.8% grade copper ore per year by 2009).
2.8 Reserves of Mineral Resources
Zambia’s position in the international markets is as a resource and production country. According to
Mineral Commodity Summaries 2008, there are 490 million tons of known copper reserves in the
world, of which 19 million tons are in Zambia. That places Zambia as Number 10 in copper reserves
in the world, with a 4% share. In addition, there are 7 million tons of known cobalt reserves in the
world, of which 270,000 tons are in Zambia. This makes Zambia the world’s 4th largest source of
cobalt reserves, also with a 4% share (Fig. 2.8.1).

29
(World Cobalt Reserves Total 7,000Kt)
United States, 33, 0%
China, 72, 1%Canada, 120, 2%
New Caledonia, 230,3%
Russia, 250, 4%
Zambia, 270, 4%
Brazil, 29, 0%
Morocco, 20, 0%
Others, 130, 2%
Australia, 1,400, 20%
Cuba, 1,000, 14% Congo, 3,400, 50%
Congo
Australia
Cuba
Zambia
Russia
New Caledonia
Canada
China
United States
Brazil
Morocco
Others
Fig. 2.8.1 Copper and Cobalt Reserves by Country
Because reserves of operating mines in Zambia are not reported to the GSD, it is not possible to get
an accurate understanding of reserves at individual mines. The data on reserves and resources and
grades listed below were taken from individual interviews conducted by the Study Team or acquired
from Internet web sites.
Table 2.8.1 Resources and Reserves of Major Copper Mines in Zambia
Ore Mt Cu Mt Cu % Co Kt Co % Ore Mt Cu Mt Cu % Co Kt Co %OP 160 2.4 1.5 na na na na na na naUG 60 1.2 2.0 na na na na na na na
Konkola 240 9.1 3.8 na na na na na na naTotal 460 12.7 2.8 na na na na na na naNkana 252 5.8 2.3 217.0 0.1 55 1.1 2.04 63 0.11Mufulira 64 1.5 2.3 88.0 0.1 9 0.4 4.00 25 0.28Total 316 7.3 2.3 305.0 0.1 64 1.5 2.29 88 0.14
Chibuluma mines Chibuluma na na na na na 8 0.3 4.3 2.3 0.03Bwana Mkubwa Bwana Mkubwa na na na na na na na na na naNFC Africa Chambishi 127 2.8 2.2 - - 102 2.2 2.21 - -Luanshya Copper Mines Chambishi na na na na na na na na na naKansanshi Kansanshi 433 5.0 1.16 na na na na na na na
1,336 27.8 2.1 305 0.1 174 4 2.3 90 0.13
OP: open pit, UG: underground, na: not available, -: zero
Mopani Copper Mines
Total
Konkola Copper Mines
Company MineReserves
Nchanga
Resources
Table 2.8.2 Reserves and Resources of Major Development Projects
Ore Mt Cu Mt Cu % Co Kt Co % U3O8 Kt U3O8 % Ni Kt Ni % Pd t Pd g/t Pt t Pt g/tLumuwana 321.0 2.3 0.7 48.0 0.0 4.1 0.1 - - - - - -Munali 6.7 0.01 0.17 4.4 0.07 - - 82.4 1.23 3.6 0.53 1.5 0.23
Ore Mt Cu Mt Cu % Co Kt Co % U3O8 Kt U3O8 % Ni Kt Ni % Pd t Pd g/t Pt t Pt g/tLumuwana 417.0 2.5 0.6 - - 0.02 0.1 - - - - - -Munali 10.3 0.02 0.2 7.2 0.07 - - 123.6 1.2 6.2 0.6 3.1 0.3
Resources
ProjectReserves
Project
Table 2.8.3 Resources of Major Exploration Projects
Ore Mt Cu Mt Cu % U3O8 Kt U3O8 % Au t Au g/tMukushi 18.5 0.2 0.8 - - - -Cheowa 6.5 0.1 1.1 - - 2.0 0.3Churundu 14.0 - - 4.3 0.0 - -Luiri Hill 5.0 - - - - 15.0 3.0
ResourcesProject
(World Copper Reserevs Total 490Mt)
Russia, 20, 4%
Australia, 24, 5%
China, 26, 5%
Poland, 30, 6%
Peru, 30, 6%
Mexico, 30, 6%
Zambia, 19, 4%
Kazakhstan, 14, 3%
Canada, 9, 2%
Others, 65, 13%
United States, 35, 7%
Indonesia, 35, 7%
Chile, 150, 32%
Chile
United States
Indonesia
Mexico
Peru
Poland
China
Australia
Russia
Zambia
Kazakhstan
Canada
Others

30
Table 2.8.4 Resources of Other Major Minerals
Ore Mt Zn Kt Zn % Pb Kt Pb % Fe % CaF2 % P2O5 %
Kabwe 4.5 108.0 2.4 54.0 1.2 - - -Bob, Mumbwa 0.3 32.0 11.6 - - -Mpongo 0.2 10.0 6.4 1.5 1.0 - - -Nyimba 2.1 82.0 3.9 - - -Total 7.0 232.0 3.3 55.5 1.2
Iron ore 940 - - - - 30 - 68 - -Fluorite 6.1 - - - - - 84 -Phosphate 470 - - - - - - 2.5 - 4.6
Resources
(after GSD Memoir No.6)
Project
2.9 Current State of Exploration and Development
2.9.1 Approval of Licenses
With the privatization of the mining sector, numerous licenses for prospecting and mining have been
applied for and granted, and mining activities are proceeding. Table 2.9.1 provides a quantitative
confirmation of the vitalization of the Zambian mining industry. Since 2004, at least 20 large-scale
mining licenses have been issued every year.
As reported in Section 2.10, the Cadastral Unit of MDD has completed both the “hard” and “soft”
aspects of the Concession Management System as part of World Bank/SEED and EU/MSDP projects,
the system for issuing licenses has been improved, and the process has been made more transparent.
A trial run of the new system has been conducted for 10 months, from 1 July 2007 to 1 May 2008,
during which time the issuance of concessions has been suspended. Practice called for 600
overlapping concessions to be straightened out during the trial run.
Table 2.9.1 Number of Licenses Issued 2000 2001 2002 2003 2004 2005 2006 2007 2008* Cumulative
Total PLLS 15 22 9 13 20 39 38 66 7 229 LML 3 6 1 1 2 0 13 2 1 29 PP 7 16 24 49 48 44 31 61 9 289 SSML 12 27 29 44 47 18 48 95 10 330 GL 68 74 83 64 57 20 10 10 1 387 AMR 63 104 95 116 117 96 91 57 4 743
(As of 27 Oct., 2008; Source: Cadastral Unit)
PLLS: Large-scale Prospecting License SSML: Small-scale Mining License
LML: Large-scale Mining License GL: Gemstone License
PP: Small-scale Prospecting Permit AMR: Artisanal Mining Right
2.9.2 Exploration and Development Projects
With the recently rising prices of metals and crude oil, investment in exploration has increased for
metal resources, such as copper, gold, nickel and uranium, as well as diamonds. Although production

31
and exploration activities have been concentrated in the Copperbelt and North Western provinces, as
much as 70% of Zambian territory is covered by various prospecting licenses. Mineral development
and exploration projects in Zambia are outlined in Table 2.9.2 and shown in detail in Appendix II-5,
and main projects are described below:
Table 2.9.2 Overview of Exploration and Development Projects
Company Commodity Project name Location Stage1 Equinox Minerals (Australia-Canada) Copper Lumwana 65km west of Solwezi Mine construction
Uranium Feasibility Study
2 Albidon (Australia) Nickel Munali 60km south of Lusaka Start of production
3AIM Resources (Australia)/BHP Billiton (Australia-UK)
Copper, gold Mumbwa West Central of Zambia Exploration
4CGA Mining (Australia)/African Eagle (UK)
Copper Mkushi265km northeast ofLusaka
Exploration
5 ICS Copper Systems (Canada) Copper Mokambo15km from Mufulira,Copperbelt
Advanced exploration
6African Eagle Resources (UK)/Phelps Dodge Mining (Zambia)
Copper NdolaSurround the BuwanaMkubwa mine
Exploration
7African Eagle Resources (UK)/Copperbelt Minerals
Copper Mikambo 90km northeast of Ndola Exploration
8 African Eagle Resources (UK) Copper, goldSasareEagle eye
450km east of Lusaka Exploration
9 African Eagle Resources (UK) Copper, gold Lunga320km northwest ofLusaka
Exploration
10Zambezi Resources (Australia)/ Glencore Inernational (Swizterland)
Copper, gold Cheowa120km southeast ofLusaka
Pre-feasibility
11 Zambezi Resources (Australia) Copper, gold Chongwe 100km east of Lusaka Exploration
12 Caledonia Mining (Canada) Cobalt, copper NamaNorthwest of KonkolaCopper mine
Advanced exploration
13 Caledonia Mining (Canada)Copper,cobalt, gold
Kadola West of Kapiri Mposhi Exploration
14 TEAL Exploration & Mining (Canada) Copper Konkola North Copperbelt FS
15 Luiri Gold (Canada) Gold Luiri Hill 120km west of Lusaka Exploration
16 Zambezi Resources (Australia) Gold Chakwenga 200km east of Lusaka Exploration
17 Denison Mines (Canada) Uranium Mutanga 200 km south of Lusaka Exploration
18African Energy Resources (Australia)/Albidon (Australia)
UraniumNjame North,Chirundu
85km south of Lusaka Pre-feasibility
19African Energy Resources (Australia)/Albidon (Australia)
Uranium Kariba Valley 80km south of Lusaka Exploration
20Lithic Metal & Energy (Australia)/Zambezi Resources (Australia)
Uranium Oryx80km southeast ofLusaka
Exploration
21Lithic Metal & Energy (Australia)/Zambezi Resources (Australia)
Uranium Mpande60km southeast ofLusaka
Exploration
22 Lithic Metal & Energy (Australia) Nickel Mitaba Hill100km southeast ofLusaka
Exploration
23Alberg Mining and Exploration (SouthAfrica) /ZCCM-IH (20%)
Zinc, lead Kabwe Central of Zambia Re-open
24 Allied Energy (USA) Tin, tantalite Starfield Southern Zambia Production
25Motapa Diamond (subsidiary of BHPBilliton) /Caledonia Mining (Canada)
Diamond Mulonga Plain Western Zambia Exploration
26 Spirit of the River (Canada) Diamond Western Zambia Exploration
(1) Development Projects
1) Lumwana Copper Project
The Lumwana copper project is located in the North Western province of Zambia, 220km
west-northwest of the Copperbelt city of Chingola, and 60km west-southwest of the provincial
capital Solwezi. The project covers 1,355km2 and includes two major deposits, Chimiwungo and
Malundwe, the smaller and less-studied Lubwe deposit, and a number of other copper occurrences.

32
The deposits were discovered in the early 1960’s. Equinox Minerals Ltd (Australia-Canada) has
taken 100% ownership in the project, which is one of the world’s largest undeveloped copper
projects.
Malundwe and Chimiwungo, the main, large, low-grade copper deposits, are hosted within the
eastern lobe of the Mwombezi Dome. The copper mineralization at Lumwana is hosted almost
entirely within high-grade metamorphosed, intensively mylonitesed, recrystallised quartz-kyanite
schists with disseminated sulfides dominated by chalcopyrite and bornite.
Measureed and Indicated Reserves total 321 million tons, averaging 0.73% Cu (2.3 million tons of
contained copper) and 0.015% Co (48 thousand tons of contained cobalt). Additional inferred
resources total 417 million tons, averaging 0.6% Cu (more than 2.5 million tons of contained
copper).
Lumwana is estimated to contain Probable Reserves of 3.3 million tons at 0.123% U3O8 and Inferred
Resources of 2.4 million tons at 0.078% U3O8, within discrete zones which could be mined
separately from the copper ore.
Construction of the mine started in late 2006. Building it has cost about US$760 million. It had been
scheduled for commissioning in mid-2008. However, it is now expected to be produced copper
concentrate during December 2008 due to the project delay associated with a transformer fire in June
2008. Full production is anticipated to be reached in 2009.
Equinox will mine an average of 20 million tons per year to produce an average of 122,000t of
copper per year over the 37-year mine life. Because of higher head grades during the first six years
of operation, the mine will initially produce an average of 169,000 tons of copper per year. China’s
Chambishi copper smelter has agreed to process 230,000 tons of copper concentrate per year (55%
of the planned output) from Lumwana under a new five-year deal. Concentrates will be smelted and
refined into metal at smelters either in Zambia, South Africa and/or offshore. Negotinations are
underway with a number of regional smelters, such as Palabora Mining Co. of South Africa,
Ongopolo Miming of Namibia, and Mopani Mines of Zambia.
2) Munali Nickel Project
The Munali nickel project is located approximately 60km south of Lusaka. The Enterprise deposit
was discovered in 1969 and the project is 100% owned by Albidon Ltd. A bankable feasibility study
was completed in 2006, and initial site work commenced in September 2006. Underground
development intersected the Enterprise Orebody in January 2008, and extraction of ore began the

33
same month. The first nickel concentrate was processed and delivered to the storage shade on 27
June 2008.
Probable Reserves at Enterprise have been calculated at 6.7 million tons, with 1.23% Ni, 0.17% Cu,
0.07% Co, 0.53g/t Pd, and 0.23g/t Pt. The Probable Reserves contain over 82,00t of Ni, 11,7000t of
Cu, 4,400t of Co, 114,400 ounces of Pd, and 50,400 ounces of Pt. The project is designed to produce
approximately 8,500 tons per annum of nickel in concentrate from a 9,000,000 tons per annum
underground mining operation. The current reserves base for Enterprise is sufficient for a 10 year
mine life.
In December 2006, Jinchuan Group, China’s largest nickel refiner, agreed to invest US$100 million
in the Munali Nickel project and has signed an off-take agreement for the nickel production.
Saleable Ni-Cu-Co-PGE concentrate is currently being stockpiled ahead of collection for smelting
by Jinchuan.
In addition to the resource drilling at Enterprise, a systematic approach to drilling at the Munali
Intrusion has been adopted. This had success with the discovery of the Voyager prospect
approximately 750m north of Enterprise. The geological setting of the mineralization intersecting
along the southwestern side of the Munali Intrusion is consistent, with the same controls on nickel
sulfides over the entire length of the intrusion (over 2,5km).
Current published Indicated and Inferred Resources of the deposits at a revised cutoff grade of 0.6%
Ni are as follows:
Enterprise deposit: 9.1Mt @ 1.23% Ni, 0.2% Cu, 0.07% Co, 0.6g/t Pd, 0.3g/t Pt.
Voyager deposit: 1.2 Mt @ 0.9% Ni, 0.1% Cu, 0.05% Co, 0.7g/t Pd, 0.4g/t Pt.
Total Resources: 10.3Mt @ 1.2% Ni, 0.2% Cu, 0.07% Co, 0.6g/t Pd, 0.3g/t Pt.
(2) Exploration Projects
1) Mkushi Copper Project
The Mkushi copper project area is located 265km by road northeast of the capital Lusaka and 160km
southeast of Ndola. The project area contains a chain of at least seven known copper deposits along
the 15km long Mtuga shear zone. Discovered in 1922, the Mkushi copper deposits were firstly
mined at Mtuga and Munshiwemba by underground workings, and then developed as an open pit
operation in the 1960’s.
A resource estimate dating from 1990 reported that a global resource of 30 million tons at 1.2%

34
copper could still exist on the property containing more than 350,000 tons of copper. African Eagle
Resources (AFE; UK) acquired a Prospecting License at the project in 2002. AFE has completed
more than 55 diamond and percussion drill holes for a drilling total approaching 10,000m. The
Inferred Resource in February, 2008 was 10.7 million tons at a grade of 1.11% Cu. The definitive
feasibility study is scheduled for completion in fourth quarter 2008.
In 2006, CGA Mining Limited (Australia) entered into an agreement with AFE for a joint venture in
the Mkushi project. CGA has acquired a 51% interest in the project, with AFE retaining a 49%
interest in the project.
2) Mumbwa Copper Gold Project
The Mumbwa copper-gold project is located in west central Zambia. The Mumbwa licence area
covers approximately 1,325 km2 with an exploration strategy that is modelled around an iron oxide
copper-gold (IOCG) style deposit similar to Olympic Dam in South Australia.
AIM Resources (Australia) entered into a joint venture agreement with BHP Billiton (Australia-UK)
in late 2004 enabling AIM to earn up to a 70% interest in the project over a 4-year period. AIM is on
track in terms of its budgetary commitments and onsite activity to fulfil the joint venture obligations.
Billiton explored the Mumbwa license area during the mid to late 1990's. The Kitumba region
contains a large low-grade copper or copper-gold bearing, breccia system. The mineralization at
Mumbwa is associated with large–scale highly variable magmatic-hydrothermal iron oxide breccia
complexes that display evidence of multiple brecciation.
Interpretation culminated in a total of 23 anomalies being identified by the Falcon survey of
8,725km, of which 11 priority drill targets were indentified for drilling. AIM has planned the next
phase of drilling, which commenced in January 2008. It has completed 16 drill core holes totalling
8,000m.
3) Mutanga Uranium Project
The Mutanga Project is located in the south, approximately 200 km south of Lusaka. The Mutanga
Project (formerly called the Kariba uranium project) consists of a single prospecting license covering
1,893 km2. The project is 100% owned by Denison Mines Crop. (Canada). There are two main
deposits, Mutanga and Dibwe, and a number of exploration areas. Both deposits are shallow and
amenable to open pit mining and alkali leach processing for extraction. A scoping study by the
previous owner, Omega Corp Limited, identified an historical mineral resource estimate of 13.7

35
million pounds U3O8.
The scoping study is currently being updated and a feasibility study is targeted for completion in
2009. An intensive 47,000 meters reverse and diamond drill exploration is underway in an attempt to
more accurately define the controls of the mineralization at Mutanga and Dibwe, to update the
classification of indicated resources, and to explore for both of the known mineralization proximal to
the proposed open pits and along the strike. When full production is reached, Mutanga should
produce an estimated 1.5 million pounds of uranium oxide per year.
2.10 International Assistance
To promote sustainable development, the EU provides international assistance for mining activities
through its Mining Sector Diversification Programme (MDSP), which is designed to promote
sustainable development of the non-traditional mining sectors (NTMS) for gemstones, industrial
minerals (excluding copper and cobalt), construction materials, and so on. This assistance is being
provided in the form of a 16.5 million euro loan. In addition to this loan, workshops are being held,
technical assistance is being provided in the fields of geology, mining, and dressing, and technical
guidance is being provided for company management and marketing, among other things.
In addition, the World Bank is seeking to expand the tourism and gemstone sectors with a 24 million
dollar loan provided through the Support to Economic Expansion and Diversification (SEED)
Project. Moreover, the Concession Management System has been upgraded in an effort to avoid
redundant licensing of concessions by improving the investment climate, promoting economic
development, and reducing the scale of mines. The Concession Management System project has
been undertaken in conjunction with EU/MSDP to computerize MDD’s concession management,
digitize maps and diagrams, and improve and upgrade equipment. It has been completed in 2007.
The 2007 budget for the gemstone sector was 1.8 million dollars, of which 400,000 dollars was used
for concession management.
Other types of technical cooperation include the World Bank’s Economic Recovery and Investment
Project Technical Assistance (ERIPTA) program, which was assisting in the creation of 1:100,000
geological maps of western provinces and the NE part of the Northern provinces for GSD, and joint
exploration for emeralds with the Czech Geological Survey in Copperbelt province. In addition,
JICA is providing technical assistance for the present study (see Table 2.10.1).

36
Table 2.10.1 Recent Cases of International Assistance in the Zambian Mining Sector
Organization/country Type Target Project EU Loan
TA* NTMS
MMMD MSDP (2002/2008)
TA GSD Geological mapping (1996/2001) Loan Gemstone SEED (2005/2009)
World Bank
Loan Mining Copperbelt Environment Project Czech Republic TA GSD Emerald prospecting (2001)
Japan TA GSD Geological mapping and mineral information services (2007-2009)
*TA: Technical Assistance
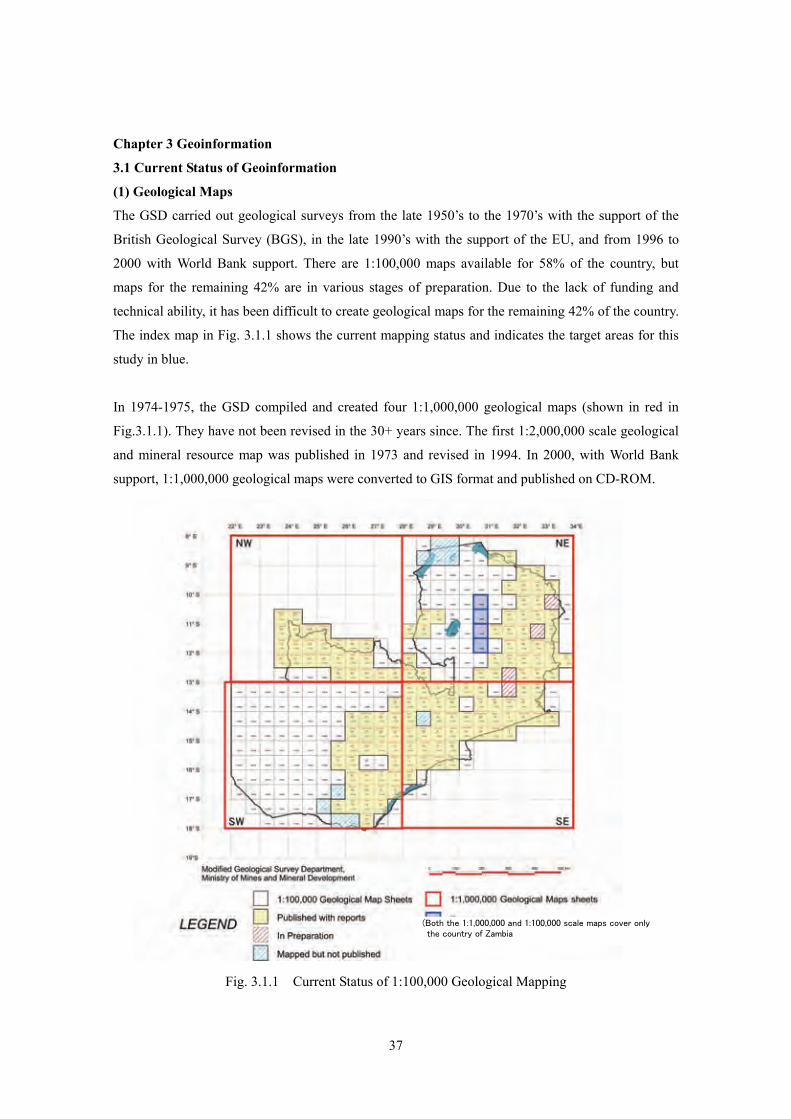
37
Chapter 3 Geoinformation
3.1 Current Status of Geoinformation
(1) Geological Maps
The GSD carried out geological surveys from the late 1950’s to the 1970’s with the support of the
British Geological Survey (BGS), in the late 1990’s with the support of the EU, and from 1996 to
2000 with World Bank support. There are 1:100,000 maps available for 58% of the country, but
maps for the remaining 42% are in various stages of preparation. Due to the lack of funding and
technical ability, it has been difficult to create geological maps for the remaining 42% of the country.
The index map in Fig. 3.1.1 shows the current mapping status and indicates the target areas for this
study in blue.
In 1974-1975, the GSD compiled and created four 1:1,000,000 geological maps (shown in red in
Fig.3.1.1). They have not been revised in the 30+ years since. The first 1:2,000,000 scale geological
and mineral resource map was published in 1973 and revised in 1994. In 2000, with World Bank
support, 1:1,000,000 geological maps were converted to GIS format and published on CD-ROM.
Fig. 3.1.1 Current Status of 1:100,000 Geological Mapping
(Both the 1:1,000,000 and 1:100,000 scale maps cover only the country of Zambia

38
GIS conversion of 1:100,000 scale geological maps began a few years ago, but with the staff lacking
equipment and technical skills, only minimal details have been entered into the database.
Specifically, only ore deposits, occurrences, locations, and ore deposit types have been entered.
There is still no basic information on such attributes as geological stratigraphy, parent rock,
structural minerals, deposit scale, and grade. Further, since corresponding explanations have not
been entered, this information cannot be considered sufficient for investors to evaluate promising
areas.
Status of geological maps is summarized as follows:
- 1:2,000,000 1 map (Geological and Mineral Occurrence Map)
- 1:1,000,000 4 maps
- 1:500,000 1 map (Metamorphic map of Zambia)
- 1:250,000 5 maps (Mwinilunga, Petauke, Ntambu, Chipata, Lusaka and Rufunsa areas)
- 1:100,000 113 maps
(2) Geochemical Prospecting Data
Most of the geochemical prospecting data were collected during 1:100,00 geological surveys until
the 1970’s, and the GSD has a total of about 30,000 data. These data are divided into 2 types:
MapInfo format and OASIS montage.
1) Standard collected data
The data were obtained from about 27,000 samples which were collected from stream sediments
during the 1:100,000 geological surveys. About 24,000 of these data were collected in the
1970’s and 7 elements of each sample were analyzed by atomic absorpsion spectrometer at the
GSD. The remaining 3,000 data were collected during the World Bank’s ERIPTA project until
2000 and 40 elements were analyzed.
2) 3’grid data
3,000 strean sediments were collected in 3’×3’ grids (approx. 5km2) and 7 elements were
analyzed by atomic absorption spectrometer.
These data are controlled by the OASIS montage and can be displayed by type of mineral
commodity in an arbitrary region. The data are used as a layer of Mapinfo.
(3) Geophysical Data
There are several 1:50,000 aeromagnetic maps and one 1:2,000,000 Bouguer gravity anomaly map
covering the whole territory of Zambia. Spatial interpolation is conducted for aeromagnetic data,
after they are digitized and converted into 250m grids. Radioactive elements of U, Th and K are
marked in 1:50,000 distribution maps.

39
(4) Reports and Books in Library
There are approximately 2,000 reports and books in the library of the GSD, but there are almost no
books published after 1970. The document list is incomplete and kept on cards in alphabetical order.
The reports are classified by country. In January 2006, registration of a book list was started using
CDS/ISIS version 1.5, and 846 data had been input into the list as of 28 February, 2007.
However, books and reports are not searched well due to the incomplete book list. The staff of the
GSD have little opportunity to obtain the latest geoinformation because the library does not
subscribe to scientific and mining journals.
(5) Prospecting Reports of Private Companies
Mining and exploration companies submit to the GSD quarterly and annual reports in which
prospecting results are reported by license. These reports are registered and kept in digitized format
in a technical record unit. Geological reports accompanied with applications for exploration licenses
are handled by the technical record unit. As a result of rising metal prices, prospecting projects have
increased significantly, and submitted reports increased from 71 in 2004 to 110 in 2006, a rise of
more than 50%.
The yearly number of digitizations is about 100; anything above that could not be handled
adequately by the current number of personnel.
(6) Drilling Data
There is no drilling data in the GSD. Rather, these data are kept in the Chamber of Mines of
Zambia (CMZ) which is an organization of private mining companies that is located in Kalulishi city
in Copperbelt province. Previously, ZCCM had controlled all the cores of drill holes, but after
ZCCM was dissolved, the CMZ has controlled all the cores. There are only a few dozen employees
of CMZ, and columnar sections of drill holes are not digitized. In addition, it takes time to find
appropriate cores for analysis.
3.2 Revision of Geological Maps
The revision of 1:1,000,000 geological maps has been discussed with senior staff of the GSD. The
following is a list of some of the main revisions that have been made so far:
Revision of the northeastern area of Zambia: - comparison with thirty 1:100,000 geological
maps.
Revision of the northwestern area of Zambia: - comparison with eleven 1:100,000
geological maps, and with the 1:250,000 geological map of the Mwinilunga area.
The 1:1,000,000 geological maps are composed of 35 geological units. During the revision of

40
geological maps, these geological units were used as a basis for making corrections. Formations and
rocks depicted on 1:100,000 geological maps have been compared with stratigraphic and rock facies
features depicted by the 35 geological units on the 1:1,000,000 geological maps. Geological maps
used for the revision of the 1:1,000,000 geological maps are listed in Table 3.2.1, and shown in Fig.
3.2.1. Details of these geological maps are listed in Appendix III-1. Appendix III-2 represents a
correlation of symbols between 1:1,000,000 geological maps and 1:100,000 geological maps.
Table 3.2.1 List of Geological Source Maps
Report No. Quarter Degree Sheet Map name Published year
84 0932NW Chozi 1995
84 0932NE Nakonde 1995
86 0931SE Makasa 1995
85 0932SW Mututa Hills 1995
85 0932SE Kalungu 1995
93 0933SW Mafinga Hills 1994
92 1032NW Mulilansolo Mission 1994
92 1032NE Isoka 1994
95 1031SE Ilondola Mission 1998
79 1032SW Chinsali 1994
79 1032SE Mutangoshi Hills 1994
113 1033SW, SE Muyombe and Luwumbu river unpublished
64 1131NE Shiwa Ng'andu 1998
76 1132EW Luswa River 1994
57 1133NW Chama 1994
81 1131SE Katibunga Mission 1994
82 1132SW Mtofwe 1994
62 1132SE and 1133SW Chikwa and Lake Beu 2000
78 1231NE Nabwalya 1994
74 1232NW Lumimba Mission 1994
71 1232NE Lumezi River 1998
71 1233NW Lundazi 1998
105 1231SW Mupamadzi River 1997
91 1232SW Mwanya 1997
50 1232SE and 1233SW Lukusuzi 1998
35 1332NW Machinje Hills 1992
49 1332NE Chimwala 2000
13 1331SE Lusandwa River 1964
42 1332SW Mtetezi River 1992
41 1332SE Chipata 1975
43 1224NW West Lunga River 1994
44 1224NE Kabompo Dome 1992
40 1225NW Kabompo Gorge 1992
83 1225NE and 1125SE MwombezhiDome and Jiwundu Swamp 1998
90 1225SE Matebo 2000
90 1226SW Luma River 2000
36 1226NW Solwezi 1992
80 1226NE St Francis Mission 1994
80 1226SE St Francis Mission 1994
65 1227SW Luswishi Dome 1994
66 1227SE Chingola 1994
1:250,000 SC-35-13 Mwinilunga 2000
The GSD published 1:100,000 geological maps of the northeastern area of the country with
consultation from BGS in 1993-1995 with World Bank support, and in 1996-1998 (some parts up to

41
2000) with the support of the EU. The GSD published 1:100,000 geological of the northwestern area
with BGS consultation in 1992-1994 and 1996-2000 with support from the EU, and in 1993-1995
with support from the World Bank.
Fig. 3.2.1 Geological Source Maps
The main modifications to the existing 1:1,000,000 geological maps that were made during the
revision work in this study are as follows:
Quartzite-pelite sequences of the Muva Supergroup shown in geological unit 16 in the
northeastern area were incorporated into Upper Shale of the Muva Supergroup shown in
geological unit 20.
Meta-quartzites shown as geological unit 8 and Lower Quartzite of the Muva Supergroup
shown as 17 in the northeastern area were incorporated into Upper Quartzite of the Muva
Supergroup shown as geological unit 19.
A part of Lower Quartzite of the Muva Supergroup shown in 17 in the northeastern area was
incorporated into Upper Shale of the Muva Supergroup appearing in geological unit 20.
Boundaries between granites (geological unit 5) and the Mulungwizi Gneiss group
(geological unit 12) occurring in the eastern district of Kalungu in the northeastern area
have been clarified.
Undifferentiated Mine Series of the Katanga Supergroup shown in geological unit 21 in the
northwestern area has been incorporated into the Mwashia Group of the Katanga
Supergroup shown in geological unit 24.
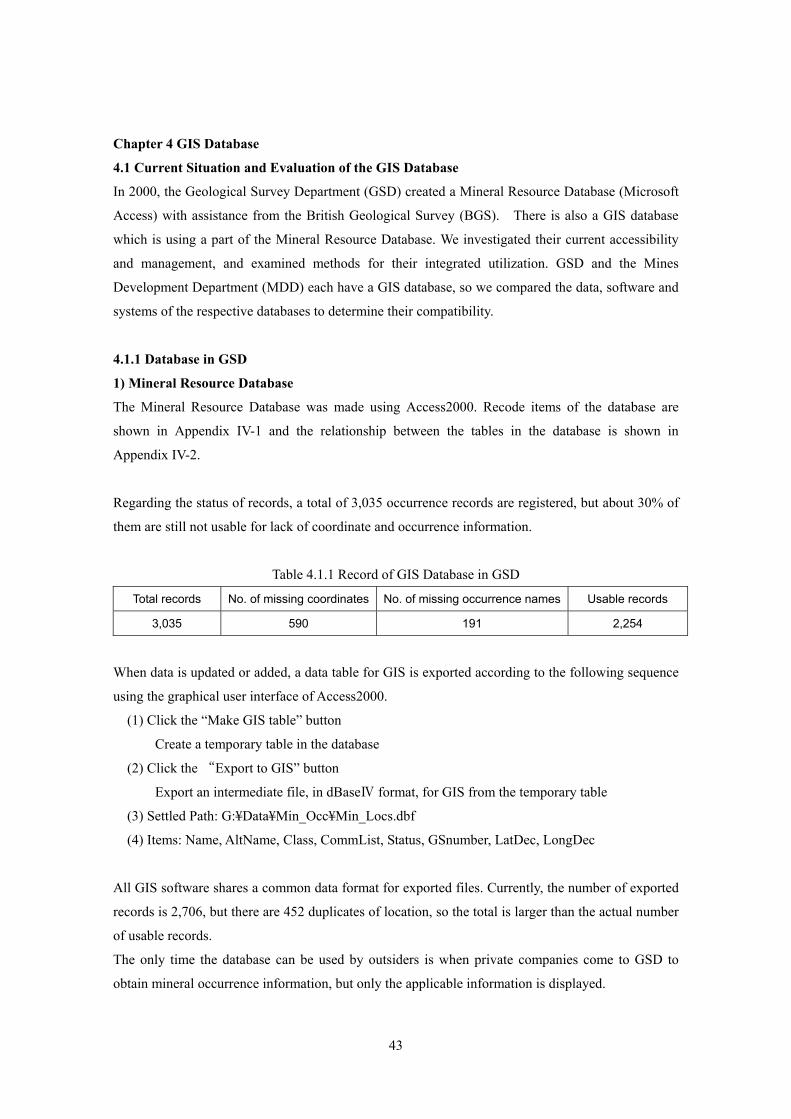
43
Chapter 4 GIS Database
4.1 Current Situation and Evaluation of the GIS Database
In 2000, the Geological Survey Department (GSD) created a Mineral Resource Database (Microsoft
Access) with assistance from the British Geological Survey (BGS). There is also a GIS database
which is using a part of the Mineral Resource Database. We investigated their current accessibility
and management, and examined methods for their integrated utilization. GSD and the Mines
Development Department (MDD) each have a GIS database, so we compared the data, software and
systems of the respective databases to determine their compatibility.
4.1.1 Database in GSD
1) Mineral Resource Database
The Mineral Resource Database was made using Access2000. Recode items of the database are
shown in Appendix IV-1 and the relationship between the tables in the database is shown in
Appendix IV-2.
Regarding the status of records, a total of 3,035 occurrence records are registered, but about 30% of
them are still not usable for lack of coordinate and occurrence information.
Table 4.1.1 Record of GIS Database in GSD
Total records No. of missing coordinates No. of missing occurrence names Usable records
3,035 590 191 2,254
When data is updated or added, a data table for GIS is exported according to the following sequence
using the graphical user interface of Access2000.
(1) Click the “Make GIS table” button
Create a temporary table in the database
(2) Click the “Export to GIS” button
Export an intermediate file, in dBaseⅣ format, for GIS from the temporary table
(3) Settled Path: G:¥Data¥Min_Occ¥Min_Locs.dbf
(4) Items: Name, AltName, Class, CommList, Status, GSnumber, LatDec, LongDec
All GIS software shares a common data format for exported files. Currently, the number of exported
records is 2,706, but there are 452 duplicates of location, so the total is larger than the actual number
of usable records.
The only time the database can be used by outsiders is when private companies come to GSD to
obtain mineral occurrence information, but only the applicable information is displayed.

44
2) GIS Database of Mineral Resources
The GIS database has a hierarchical data structure in MapInfo (Ver.5). Thematic layers are shown in
Table 4.1.2. A Mineral Occurrences layer was created using the intermediate file, in dBaseⅣ format.
Table 4.1.2 Thematic Layers in GIS Database of Mineral Resources
Themantic Subject Layer name TypeBoundary Border Polygon
Provinces PolygonDistricts PolygonConstituency Polygon
Populated area Principal City PointPoly PolygonTown Pointvillege Point
Infrastracture Airport PointLandmark PointHydro powerstation PointPower line LineRailway LineRoads_majore LineRoads_minore Line
Drainage Lake PolygonM_rivers LineRevers Line
Geology 1/1million Geol_1M PolygonFaults_1M LineDykes_1M LineKimberlite_1M Point
Geology(Copper belt)1/1million Cpr_belt PolygonCpr_fault Line
Mineral Occurrence min_locs PointHydro_Au PolygonAlluv_Au Polygon
As with the above database, the only time th mineral resources database can be used by outsiders is
when private companies come to GSD to obtain mineral occurrence information, but only the
applicable information is displayed.
4.1.2 Database in MDD
A mining concession database is being created in MDD. The database has a hierarchical data
structure in ArcView (Ver.3.2). Large-scale and small-scale concession areas are registered.
Attributes include the following basic information on licenses:
Holder, Location, Pll_No, Type, No., Year_Grant, Status, Grant_Date, Ex_Date, Comment.
The present method of utilization is inputting applied concession information and checking for
redundant information about existing concession areas.

45
4.2 Revisions of Database and GIS
We checked existing geological information and related GIS data, and organized information to be
integrated into the GIS database. We plan to support the acquisition of basic knowledge and
integrated operation of a database and a GIS rather than handle data from a variety of sources using a
variety of techniques.
It is important to make good use of the current system and we give top priority to maintaining
mineral occurrence information. A total of 3,035 occurrence records are registered, but about 30% of
these records are still not usable for lack of coordinate and occurrence information. Therefore, our
first task is to acquire and maintain these data. For GIS, we think that the counterparts could create
and import digital data, so it is better to master database searches and display techniques.
1) Working procedure
Each program will be carried out in stages according to the benchmark setting for two years. An
overview of the content and scope of the work is shown in Fig. 4.2.1
Mineral resource DB
Usable
data
Incomplete
(Revise)
Addition
(Extension)
Intermediate
file
Mineral
Resource GIS
(MapInfo)
GIS data addition
Topography
Geology
National Park
Power station・Power line
Satellite imagery
Prospecting data
etc.
Output Input
Input
Display
Extract information
for specific condition
Working scope
of this survey
Fig. 4.2.1 Overview of the Content and Scope of the Work
2) Mineral Resource Database (Access)
a) Acquisition of Missing Data
In order to use the mineral occurrences data in the mineral resource GIS, data must be acquired on

46
No. Sheet NumMineral
occurrencesSum of
occurrencesPerformance
1 1528 65 65 15.5%
2 1527 53 118 28.1%3 1328 23 141 33.6%4 1325 22 163 38.8%5 1529 20 183 43.6%6 1627 18 201 47.9%7 1330 16 217 51.7%8 1228 15 232 55.2%9 1232 15 247 58.8%
10 1526 15 262 62.4%11 1128 14 276 65.7%12 1324 14 290 69.0%13 1331 14 304 72.4%14 1628 12 316 75.2%15 1726 11 327 77.9%16 1429 10 337 80.2%17 1326 9 346 82.4%18 1029 8 354 84.3%19 1329 7 361 86.0%20 1332 7 368 87.6%21 1626 7 375 89.3%22 1727 6 381 90.7%23 1227 5 386 91.9%24 1327 5 391 93.1%25 1233 4 395 94.0%26 1224 3 398 94.8%27 1231 3 401 95.5%28 1530 3 404 96.2%29 1132 2 406 96.7%30 1226 2 408 97.1%31 1230 2 410 97.6%32 1725 2 412 98.1%33 1028 1 413 98.3%34 1033 1 414 98.6%35 1124 1 415 98.8%36 1125 1 416 99.0%37 1127 1 417 99.3%38 1129 1 418 99.5%39 1131 1 419 99.8%
40 1225 1 420 100.0%
Table 4.2.1 Number of Mineral Occurrences in Each
Sheet and Sorted Sheet Number, in Descending Order
locations for which no coordinate records currently exist. For 191 of the records with no occurrence
name, it is necessary to verify the information.
b) Addition of new data after YR 2000
The items shown in Appendix IV-1 that are to be input to the database will be extracted from various
reports and added.
c) Initial work
Work has started on finding coordinate records for missing location data. To know the characteristics
of the location information in the records, it has been reclassified into the following three categories:
Category 1: The sheet number is known: 420
Category 2: There is no sheet number, but the Province or District name is known: 95
Category 3: No information at all is available: 75
A sheet number is a grid number of a 1/250,000 scale topographic map which is expressed by
meshes of 1 by 1 degree (lat. X long.).
Geographical coordinates are being
determined according to the description of
“Locality” in the database. The number of
mineral occurrences in each sheet and
sorted sheet number by descending
number of occurrences are shown in Table
4.2.1. In order to undertake the work
efficiently and encourage the
counterpart’s participation, the work has
been carried out from category 1 to 3.
In this case, sheets which contain the two
richest occurrences have been selected,
1528 and 1527. Actual work was done
using one 1/250,000 sheet divided into
sixteen 1/50,000 topographic maps (Fig.
4.2.2).

47
A1 A2 B1 B2 A1 A2 B1 B2 A1 A2 B1 B2 A1 A2 B1 B2
A3 A4 B3 B4 A3 A4 B3 B4 A3 A4 B3 B4 A3 A4 B3 B4
C1 C2 D1 D2 C1 C2 D1 D2 C1 C2 D1 D2 C1 C2 D1 D2
C3 C4 D3 D4 C3 C4 D3 D4 C3 C4 D3 D4 C3 C4 D3 D4
A1 A2 B1 B2 A1 A2 B1 B2 A1 A2 B1 B2 A1 A2 B1 B2
A3 A4 B3 B4 A3 A4 B3 B4 A3 A4 B3 B4 A3 A4 B3 B4
C1 C2 D1 D2 C1 C2 D1 D2 C1 C2 D1 D2 C1 C2 D1 D2
C3 C4 D3 D4 C3 C4 D3 D4 C3 C4 D3 D4 C3 C4
A1 A2 B1 B2 A1 A2 B1 B2 A1 A2 B1 B2
A3 A4 B3 B4 A3 A4 B3 B4 A3 A4 B3 B4
C1 C2 D1 D2 C1 C2 D1 D2 C1 C2 D1 D2
C3 C4 D3 D4 C3 C4 D3 D4 C3
15271526 1528 1529
1426
1626
1427 1428 1429
1627 1628
Fig. 4..2..2 1/250,000 Sheets Divided into 1/50,000 Topographic Maps
d) Switch of the work plan
While we have been carrying out the initial work, we have recognized problems of consistency with
recorded information. For instance, there are differences between the descriptions of location of
mineral occurrences (locality, distance and direction from a place etc) and sheet number that express
the coordinates. It was difficult to determine which information should be given priority. We
started the initial work with the assumption that the contents in the mineral resource database are
correct. However we have determined that it is necessary to reconsider the way this work is
undertaken.
For a government agency, it is not desirable to offer inaccurate information for new future
investment. Therefore, the GSD staff should work to guarantee the quality of and maintain the
existing data, rather than trying to focus on understanding the database system or inputting new data.
It is counterproductive to display inaccurate information on GIS.
Therefore, we decided to review not only occurrence names and coordinates but also all data in the
mineral resource database to check consistency and identify problems.
(1) Review of records
We have reviewed the number of recorded information.
Registered occurrence records : 3,034
Records with coordinates : 2,444 ; Records with no coordinates : 590

48
Records of occurrence with no commodity : 177
Table 4.2.2 Review of records
with coordinates (2,444) No coordinates (590)
commodity Yes No Yes No
Yes 2,227 26 587 4 occurrence name
No 44 147 ― ―
Registered commodity records : 3,740
(2) Review of reference sources
It is necessary to have a clear, identifiable source to verify the reliability of the information. For
that reason, we have checked reference information for registered records. Only 1/10 of the
records had an identifiable source and almost all of them (about 340) are limited to initial
registrations. It is difficult to identify all of reference sources in short period, so the
investigation will require a concerted effort for several years.
There are 320 records for development, but 97% of them are limited to referenced mineral
occurrence sites.
Registered occurrence records with reference source : 322 out of 3,034 records
Registered commodity records with reference source : 687 out of 3,740 records
(3) Confirmation of contents
According to the review and confirmation of contents, the following items have been
recommended for discussion. A partial list of items is shown in Appendix IV-3.
Duplicate registrations for Occurrence name and coordinates
Same coordinates and same or similar “Occurrence name” : 195 sets (412 records)

49
Table4.2.3 Duplicates for coordinates
Same commodity (174) Diff. commodity (21)
Case 1 127 set 17 set
(same occ. name) (40/127) (4/17)
Case 2 39 set 4 set
Case 3 8 set ―
Case 1:Latitude/Longitude same, UTM same
Case 2:Latitude/Longitude same, UTM different
Case 3:Latitude/Longitude different,UTM same
In Case 1, there are 40 completely identical occurrence name registration sets within the same
commodity, and 4 registration sets among different commodities.
Duplicate registrations for Occurrence Locality
Occurrence name is different but the description of “Locality” is the same : 64 sets
Need reexamination (from “Comments” )
Based on the information in the “Comments” column, the following six categories have been
created to determine the reliability of contents.
There is a total of 635 records including 78 records with no coordinates and 191 records with no
occurrence name.
i. No detailed information : 49 records
(No coordinates : 32; no occurrence name : 0)
ii. Descriptions are almost the same : 82 records
(No coordinates : 36; no occurrence name : 0)
iii. Coordinates are discerned from topographic maps : 180 records
(No coordinates : 0; no occurrence name : 16)
iv. No economic interest : 28 records
(No coordinates : 8; no occurrence name : 0)
v. Same Comments but no Locality : 260 records
(No coordinates : 0; no occurrence name : 172)
vi. Comments left blank and no information : 36 records
(No coordinates : 2; no occurrence name : 3)

50
Wrong sheet number
The number of a sheet that denotes a grid on a 1/250,000 scale topographic map, is wrong: 8
cases
Discrepancies in coordinate values Latitude/Longitude – UTM (WGS84)
In wild area of Zambia, there are few domiciles and no place names, so coordinate information
is extremely important. We have confirmed that are there no discrepancies between
Latitude/Longitude and UTM using coordinate transformation calculations.
Table 4.2.4 shows the number of registrations for which there were especially large
discrepancies (d), for each UTM zone. In one of these cases, there was not even one match
between Latitude/Longitude and UTM coordinate values. Accordingly, these coordinate values
could have been obtained separately or were incorrectly entered. It appears that no investigation
has been conducted so far, so a recheck is necessary.
Table 4.2.4 Cases of large discrepancies between
Latitude/Longitude and UTM coordinate values
UTM zone 150m≦ d <500m 500m≦ d No Occ. name
Zone34 ( 11 record) 1 ― ―
Zone35 (1717 record) 419 46 6
Zone36 ( 716 record) 20 6 185
Total (2444 record) 440 52 191
Field investigation survey
It is necessary to conduct an investigative survey for the following 770 records that are missing
accurate location information:
Occurrence with no coordinates : 590 records
Occurrence coordinates are discerned from topographic maps : 180 records
Table4.2.5 Coordinates of mineral occurrence areas
discerned from topographic maps
UTM zone From map 150m≦ d
Zone34 ( 11 record) ― ―
Zone35 (1717 record) 113 17
Zone36 ( 716 record) 67 2
Total (2444 record) 180 19

51
Ranking of data quality
This time, 1,923 of 3,034 occurrence records were selected for reevaluation. However, because
the investigation was carried out only to check consistency with the data in the database, this
does not guarantee the contents of the remaining 1,111 records.
The reliability and importance of the information according to geological re-estimation should
be ranked after the data are checked by GSD staff.
(4) Management of contents
We recommend constructing a framework in GSD for mineral resource management with a
full-time chief economic geologist and a database engineer, even though GSD is currently facing
an understaffing situation. It will take much time and labor to finish all of the work mentioned
above.
However since GSD is a geological contents provider, GSD staff will have to undertake the
work on their own without outside help.
(5) Addition of new data
The most recent information is in the report “Memoir No.6 The Geology and Mineral Resources
of Zambia 2000”. To add new data to the mineral resource database, it will be necessary to
extract information applicable to the registration items shown in Appendix IV-1 from the report.
As mentioned earlier, the reliability of contents is quite important. Therefore, data quality will
have to be checked before they can be entered into the database.
3) Mineral Resource GIS
This system is currently used to display all mineral occurrences in an area specified by a user. An
area can be a province, district, or user-specified polygon. It is recommended that users master the
search query function so that they can easily find the information that they wish to obtain, for
example, specific minerals in specific geological units, mineral occurrences existing around specific
geological structures, and so on.
As a prerequisite to do this, basic data related to mines and mineral occurrences other than
geological information must be collected.
a) Basic data collection
Work has started on collecting the following types of data for the GIS database.

52
Topographic data: DEM of SRTM3 Version2 distributed by NASA.
Mine data: From Mines Development Department (MDD), Shape format. The file format of
mining concession data controlled by MDD is Shape, so that it will be possible to
import the data to the GIS of GSD in the future.
National Park/ Protective Zone data: From Zambia Wildlife Authority (ZAWA)
Power Station/Power line data: From Zambia Electricity Supply Corporation (ZESCO)
Magnetism data: In GSD
Gravity data: In GSD
b) Extraction of specific information
Until recently, it had been hard to display specific mineral occurrences on GIS, because the
mineral resource database didn’t have a function that could export occurrence data in a suitable
transfer format for GIS operation.
Therefore we have added another function to the database that enables mineral occurrence data to
be exported in a suitable format to a selectable display for GIS.
Fig. 4.2.3 GUI of the mineral resource database
In the existing data export method, output file format (dBase IV), folder saved and drive (G:) in PC
are fixed and has little flexibility. For this reason, we have adopted an Excel file format and
included a choice of destination folders for saving files to improve the usability.
Additional function

53
A comparison of the exported records from the database of No.21 mineral occurrence was made
between Table 4.2.6 (using only previously existing functions) and Table 4.2.7 (using added
functions). Three commodities (Manganese, Copper, Zinc) are registered at this occurrence,
although only two records were exported, as differences in commodity classes, not the commodity
itself. Moreover, since the three commodities are expressed as a string in the database field
(Comm_list), it is hard to display each on GIS. Therefore, the export function was modified to
express each one individually with existing information. The yellow colored columns in Table 4.2.7
indicate the added items.
Table 4.2.6 Export results using only previously existing functions
Field Items Exported Record 1 Exported Record 2 Exported Record 3Number 21 21Name LUAPULA AREA LUAPULA AREAAltName BUKANDA, CHIMPATIKA, BUKANDA, CHIMPATIKA,Class Ferrous metals Base metalsCommList Manganese, Copper, Zinc Manganese, Copper, ZincStatusGSnumberLatDec -10.5 -10.5LongDec 29.08333333 29.08333333Lat 103000 103000Long 290500 290500
Table 4.2.7 Export results using added functions
Field Items Exported Record 1 Exported Record 2 Exported Record 3Number 21 21 21Name LUAPULA AREA LUAPULA AREA LUAPULA AREAAlternative_name BUKANDA, CHIMPATIKA, BUKANDA, CHIMPATIKA, BUKANDA, CHIMPATIKA,Full_Class Ferrous metals Base metals Base metalsCommList Manganese, Copper, Zinc Manganese, Copper, Zinc Manganese, Copper, ZincCCode MN CU ZNCommodity Manganese Copper ZincCommodity_type FE BM BMStatusGSnumberImportance U U UUTMZone 35 35 35UTMEast 728018 728018 728018UTMNorth 8838653 8838653 8838653LatDec -10.5 -10.5 -10.5LongDec 29.08333333 29.08333333 29.08333333
Individual commodity could be displayed on GIS by importing these data as CAD format.
2,270 mineral occurrences exported from existing functions overlaid on 1/1,000,000 geological
boundary maps are shown in Fig. 4.2.4 using TNTmips 2007:73 which was recently installed in the

54
PCs at GSD. The remaining 1,111 mineral occurrences are shown in Fig. 4.2.5.
Plot images of only Copper, Lead and Zinc occurrences from among the 1,111 mineral occurrences
are shown in Fig. 4.2.6, Fig. 4.2.7 and Fig. 4.2.8, respectively.
A 1/1,000,000 geological map is shown in Fig. 4.2.9. As an example, an image displaying a specific
geological unit (Undiff granite gneiss) and Copper occurrence is shown in Fig. 4.2.10.
Examples of operation windows of GIS software (TNTmips 2007:73) are shown in Fig.4.2.11.
b) Free GIS Software
The counterpart asked us to recommend free GIS software, so we compared several and
recommended the following. They are also all open source software. This free software should be
adequate unless users require the highly specialized functions included in commercial software.
These software programs need no initial and update costs, but there is no technical support available
and users must take all responsibility for their utilization of the free software and results obtained
there from.
Name Developer
GRASS GIS 6.2.2 GRASS Development Team
Quantum GIS 0.8.1 QGIS Development Team
ILWIS 3.4 52° North

55
Fig.4.2.4 2,270 mineral occurrences exported from existing function
(on 1/1 million geological boundary map)

56
Fig.4.2.5 After investigation of data consistency, remained 1,111 mineral occurrences
(on 1/1 million geological boundary map)
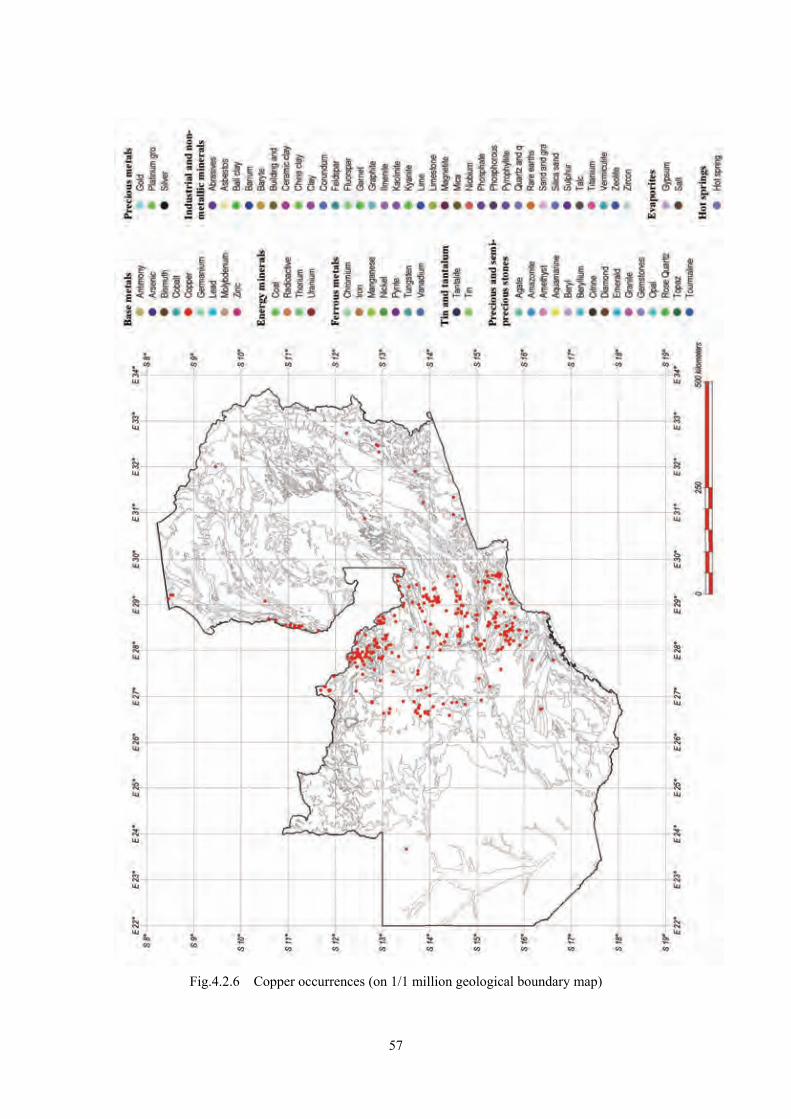
57
Fig.4.2.6 Copper occurrences (on 1/1 million geological boundary map)

58
Fig.4.2.7 Lead occurrences (on 1/1 million geological boundary map)

59
Fig.4.2.8 Zinc occurrences (on 1/1 million geological boundary map)

60
Fig. 4.2.9 1/1 million geological map

61
Fig. 4.2.10 Specific geological unit (Undiff granite gneiss) and Copper occurrence
(on 1/1 million geological map)

62
Fig.4.2.11 Example of operation windows of GIS software (TNTmips 2007:73)

63
4.3 Current Situation of and Issues with the Website
We checked the current situation of disclosure of geological information and response to requests
from GSD. The address of the GSD web site is:
http://www.zambiageosurvey.gov.zm/
The top page of the GSD site is shown in Appendix IV-4. This site was opened last May, but it still
does not provide enough information about GSD. A web site contractor developed the site, but the
counterpart wants to train someone who can manage the web site at GSD instead of outsourcing, so
that GSD can add and update information freely by themselves. Currently there is no one who has
that skill at GSD, so some of the counterparts would like for JICA and other international
organizations to provide support for human resource development in Lusaka.
4.4 Knowledge sharing and Management
Various types of data (reports, imagery, analyzed results, etc) are generally stored in each person’s
PC. For that reason, if a PC is in a room that is closed, no one can access its data. Therefore, we
recommend the installation of a local area network (LAN) in GSD as intelligence infrastructure.
Moreover, the public data server needs to be set to allow all GSD staff to be able to share various
data. However it is necessary to employ or train a network administrator for stable operation of the
system.
Currently, there are PCs that are infected with computer viruses. If the LAN is operated under this
type of situation, there is a risk that the whole system might crash. Therefore, antivirus software
must first be installed in all PCs, including the public data server, and be kept up to date for the
stable maintenance and operation of the network system.