predominant-period site classification for response spectra
TRANSCRIPT
Ⓔ
Predominant-Period Site Classification for Response
Spectra Prediction Equations in Italy
by Carola Di Alessandro,* Luis Fabian Bonilla, David M. Boore,Antonio Rovelli, and Oona Scotti
Abstract We propose a site-classification scheme based on the predominant periodof the site, as determined from the average horizontal-to-vertical (H/V) spectral ratiosof ground motion. Our scheme extends Zhao et al. (2006) classifications by addingtwo classes, the most important of which is defined by flat H/V ratios with amplitudesless than 2. The proposed classification is investigated by using 5%-damped responsespectra from Italian earthquake records. We select a dataset of 602 three-componentanalog and digital recordings from 120 earthquakes recorded at 214 seismic stationswithin a hypocentral distance of 200 km. Selected events are in the moment-magnitude range 4:0 ≤ Mw ≤ 6:8 and focal depths from a few kilometers to 46 km.We computed H/V ratios for these data and used them to classify each site into one ofsix classes. We then investigate the impact of this classification scheme on empiricalground-motion prediction equations (GMPEs) by comparing its performance with thatof the conventional rock/soil classification. Although the adopted approach results inonly a small reduction of the overall standard deviation, the use of H/V spectral ratiosin site classification does capture the signature of sites with flat frequency-response, aswell as deep and shallow-soil profiles, characterized by long- and short-period reso-nance, respectively; in addition, the classification scheme is relatively quick andinexpensive, which is an advantage over schemes based on measurements of shear-wave velocity.
Online Material: Tables of parameters defining the groundmotion prediction equa-tions, and figures of H/V spectral ratios, intraevent residuals, and spectral amplitudes.
Introduction
Ground-motion prediction equations (GMPEs) are a fun-damental tool in seismic hazard assessment. For the samemagnitude and distance, however, variations due to site con-ditions can be very large and must be properly taken intoaccount in deriving coefficients of the GMPEs. Many recentGMPEs use the value of shear-wave velocity in the uppermost30 m (VS30) to assign sites to a few classes. Table 1 gives thedefinitions of two commonly used sets of classes from theAmerican classes (Building Seismic Safety Council, 2000)and the European classes of Eurocode 8 (European Commit-tee for Standardization (CEN), 2004). These velocity-basedclassifications do have some problems, not the least of whichis the limited availability of near-surface shear-wave modelsat strong-motion sites in many countries. In addition, the costof obtaining the information can be quite high, especially if
based on borehole measurements. A more affordable alter-native is velocity profiles inferred from dispersion curves,but they are strictly applicable to 1D situations (see Xia et al.,2002; Di Giulio et al., 2006; Boore and Asten, 2008;Sandıkkaya et al., 2010). Even if VS30 values are available,however, the site classes based on these values do not capturethe role of the thickness of soft sediments (Steidl, 2000),nor do they capture site resonances in narrow-period bands.The limitation of VS30 classes is particularly relevant in deepbasins where predictions based on VS30 may overestimateground-motion amplitudes at short periods and underesti-mate long periods (Park and Hashash, 2004). Including thedepth of the uppermost resonant layer in site classificationhas been recently proposed by Rodríguez-Marek et al.(2001) and Pitilakis et al. (2006). Cadet et al. (2010) inves-tigate whether combining VS30 and the fundamental reso-nance frequency (f0) is a better way of characterizingsites than using VS30 alone. The fundamental frequency of
*Now at: Pacific Earthquake Engineering Research Center (PEER) 325Davis Hall, University of California–Berkeley, Berkeley, California94720-1792.
680
Bulletin of the Seismological Society of America, Vol. 102, No. 2, pp. 680–695, April 2012, doi: 10.1785/0120110084

the resonant layer has been used as well by Luzi et al. (2011)to propose a site classification for Italian stations.
An alternative to VS30-based classes was proposed byZhao et al. (2006), based only on the site predominant periodinferred from H/V spectral ratios. This criterion is used inJapan for the seismic design of highway bridges (Japan RoadAssociation, 1980 and its 1990 revision).
Fukushima et al. (2007) applied Zhao’s classificationscheme to a database composed primarily of European earth-quakes with a partial contribution of near-source Californianand Japanese earthquakes; the stations that provided the datahad originally been classified as rock or soil. While Fukush-ima et al. (2007) were able to unambiguously classify 64% ofthe total stations, they expressed some concerns on whetherthere were enough stations that represented the classes thatamplify intermediate periods. More recently, a study per-formed by Ghasemi et al. (2009) tested the feasibility of
Zhao’s classification scheme on Iranian strong-motion sta-tions, attempting three different automatic classificationmethods but maintaining the same period-range subdivisionamong the various site classes.
In this paper, we adopt the site-classification methodused by Zhao et al. (2006) and Fukushima et al. (2007) witha few changes. The main difference is the introduction of anew class characterized by flat H/V spectral ratios with am-plitudes less than 2. This new class helps in the recognitionof reference rock sites. We apply our site classification to thestrong-motion stations of the Italian Accelerometric Network(Rete Accelerometrica Nazionale, [RAN]), managed by theItalian Department of Civil Protection (Dipartimento Prote-zione Civile [DPC]). In addition to assigning a predominant-period class to each recording site, we also classify each siteas rock or soil, based on available geotechnical and geolo-gical information. The available information for the stationcharacterization presents different refinement levels: it variesfrom measurements of VS at 102 sites (45 using cross-hole ordown-hole invasive measurements and 57 using noninvasivemethods) in the best cases (Di Capua et al., 2011), to sub-jective characterization based on geological considerations inthe worst cases. Our study is part of a research project, spon-sored by the DPC (see Acknowledgments) to investigatealternatives to the conventional VS30 criteria, with the goalof providing a more homogeneous description of geotechni-cal and geophysical features at each station to be included asmetadata in the strong-motion database of the Italian Accel-erometric Archive (ITACA; see Data and Resources).
In this paper we first present the proposed site-classification scheme and use the scheme to classify manysites in Italy that recorded earthquake motions. We thenevaluate the new model by applying regression analysis inorder to derive GMPEs and to study the interevent and intrae-vent residuals as well as the standard deviations. Comparison
Table 1Classification Criteria Based on VS30 and Soil Properties*
Average Shear-Wave Velocity (VS30) (m=s)
Class NEHRP EUROCODE 8
A >1500 >800
B 760–1500 360–800C 360–760 180–360D 180–360 <180
E <180 Surface alluvium layerwith VS values of typeC or D and thicknessbetween 5 and 20 m,underlain by stiffermaterial withVS > 800 m=s
*Comparison between the European Seismic Code classes ofEurocode 8 (European Committee for Standardization [CEN], 2004)and the NEHRP scheme (Building Seismic Safety Council, 2000).
Table 2Comparison among the Class Definition Criteria Adopted for the Predominant-Period
Classifications in Zhao et al. (2006), Fukushima et al. (2007), and This Study*
Zhao et al. (2006) Fukushima et al. (2007) Our Proposal
Site Description Site Description Site Description
SC-I Tg < 0:2 s SC-1 Tg < 0:2 s CL-I Tg < 0:2 sSC-II 0:2 s ≤ Tg < 0:4 s SC-2 0:2 s ≤ Tg < 0:6 s CL-II 0:2 s ≤ Tg < 0:4 sSC-III 0:4 s ≤ Tg < 0:6 s SC-3 0:6 s ≤ Tg CL-III 0:4 s ≤ Tg < 0:6 sSC-IV 0:6 s ≤ Tg SC-4 Tg not identifiable
and originalrock site
CL-IV 0:6 s ≤ Tg
– – SC-5 Tg not identifiableand originalsoil site
CL-V Tg not idenfiable(flat H/V andamplitude <2)
– – – – CL-VI Broad amplification/multiple peaks @Tg < 0:2 s
– – – – CL-VII Tg not identifiable(multiple peaks overentire period range)
*Tg is the site natural period (in seconds) as inferred from the H/V spectral ratios.
Predominant-Period Site Classification for Response Spectra Prediction Equations in Italy 681
with predicted spectra based both on the predominant periodand commonly used classification criteria in which siteclasses are based on general geology (e.g., rock or soil) oron VS30 are also shown. Finally, we discuss to what extentrecorded data from the 6 April 2009 L’Aquila earthquake arematched by our proposed GMPEs (these recordings were notincluded in the original dataset used to derive our GMPEs andare used only for verification purposes); we find that the siteclass variations for the L’Aquila earthquake are consistentwith those predicted from our GMPEs. This suggests thatthe site-classification scheme is stable and useful.
Proposed Site Classification
Zhao et al. (2006) and Fukushima et al. (2007) proposeda classification criterion based on the predominant period ofeach station identified through the average H/V spectral ratio
of the 5%-damped response spectra. In this paper, we apply asimilar classification criterion to the Italian dataset.
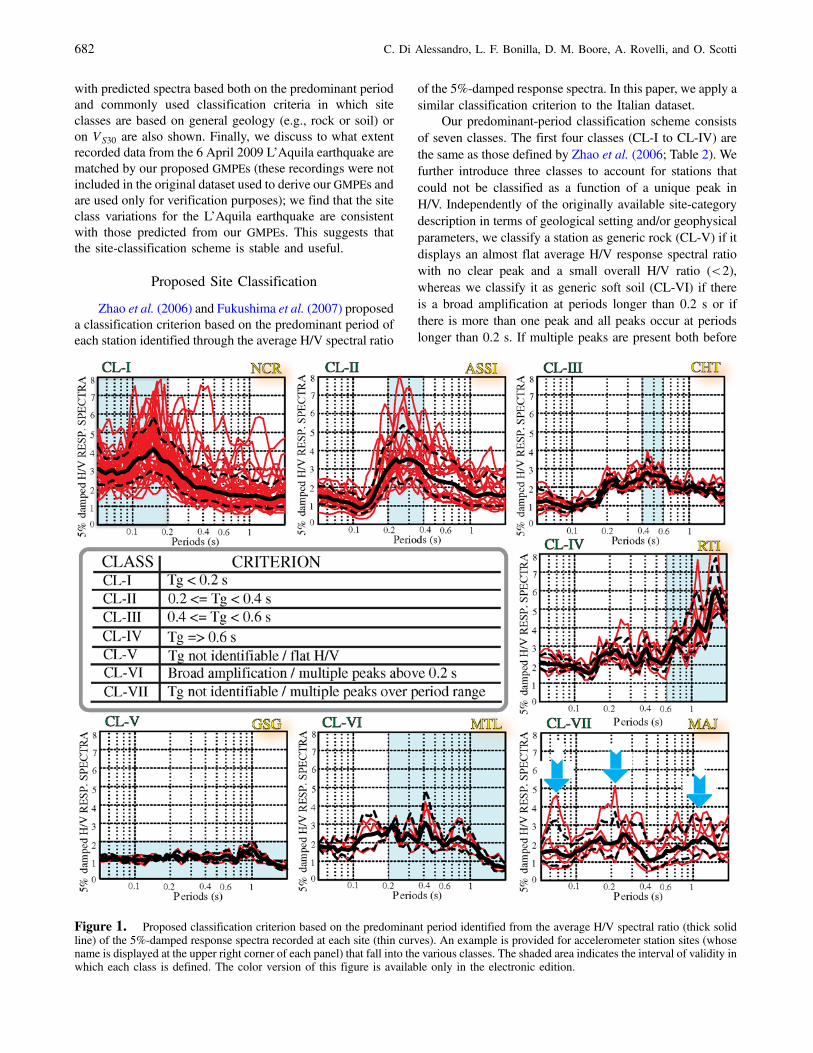
Our predominant-period classification scheme consistsof seven classes. The first four classes (CL-I to CL-IV) arethe same as those defined by Zhao et al. (2006; Table 2). Wefurther introduce three classes to account for stations thatcould not be classified as a function of a unique peak inH/V. Independently of the originally available site-categorydescription in terms of geological setting and/or geophysicalparameters, we classify a station as generic rock (CL-V) if itdisplays an almost flat average H/V response spectral ratiowith no clear peak and a small overall H/V ratio (<2),whereas we classify it as generic soft soil (CL-VI) if thereis a broad amplification at periods longer than 0.2 s or ifthere is more than one peak and all peaks occur at periodslonger than 0.2 s. If multiple peaks are present both before
Figure 1. Proposed classification criterion based on the predominant period identified from the average H/V spectral ratio (thick solidline) of the 5%-damped response spectra recorded at each site (thin curves). An example is provided for accelerometer station sites (whosename is displayed at the upper right corner of each panel) that fall into the various classes. The shaded area indicates the interval of validity inwhich each class is defined. The color version of this figure is available only in the electronic edition.
682 C. Di Alessandro, L. F. Bonilla, D. M. Boore, A. Rovelli, and O. Scotti

and after the 0.2-s period threshold, the station cannot beunambiguously classified and therefore it is referred to asunclassifiable (CL-VII). Figure 1 shows examples of stationsthat were classified according to our proposed classificationscheme.
In addition to the classifications based on the predomi-nant period, we also used the geologic information to placeeach site into one of two classes based on the European clas-sification of Eurocode 8 (European Committee for Standar-dization [CEN], 2004), where we have lumped A and B andC and D classes together: AB and CD (VS30 ≥ 360 m=s andVS30 < 360 m=s, respectively (see Table 3). The few sites ofclass E, as defined in Eurocode 8 (European Committee forStandardization [CEN], 2004), were included in the ABcategory. In this way, each site has been classified on thebasis of its predominant period and of its resemblance to rock(AB) or soil (CD).
Data Used
We study the proposed site classes by using the availabledigital and digitized analog accelerograms of Italian earth-quakes from 1972 to 2004 collected in ITACA strong-motiondatabase (Luzi et al., 2008; Pacor et al., 2011). Additionalaccelerometric signals for selected recent (2005–2008)events withMw > 4:0 were also included. We supplementedthe accelerograms with a small percentage (4%) of broad-band velocity-sensor seismograms (converted to accelerationtime series via differentiation for the computation ofresponse spectra). The addition of ground motions derivedfrom broadband seismograms helps to better constrainground motions at distances larger than 100 km, where someGMPEs (e.g., Sabetta and Pugliese, 1996; Bindi et al., 2010)in use for the Italian territory are not applicable, because ofthe small number of accelerograms available at those dis-tances before the April 2009 L’Aquila earthquake.
After the removal of some stations that were suspectedof having soil-structure interaction (S4 project-DeliverableD8, 2009), the time series and Fourier spectra were carefullyinspected to make sure that the strongest part of the motionswas well recorded and that the signal/noise ratio was greaterthan a factor of 3 in the frequency range 0.5 to 20 Hz. Thefinal dataset consists of 602 three-component digital andanalog recordings from 120 earthquakes recorded at 214
seismic stations within hypocentral distances of 200 km. Themoment magnitudes (Mw) range from 4.0 to 6.8. The largestevents have focal depths in the range of 5 to 32 km; only oneearthquake was deeper (46 km), and it was included in theanalysis because its spectral ordinates were consistent inshape and amplitude with those from the shallower earth-quakes. Some of the smaller events were at depths less thana few kilometers. The distribution of the records versus mag-nitude and hypocentral distance is shown in Figure 2.
About 50% of the dataset are from the Friuli, Irpinia,Umbria–Marche, and Molise earthquakes, whose main-shocks had Mw magnitudes of 6.4 (Pondrelli et al. 2001),6.8 (Cocco and Rovelli, 1989), 6.0 (Ekström et al., 1998),and 5.7 (Chiarabba et al., 2005), respectively.
All signals were preprocessed to remove the pre-eventmean from the whole record (the zeroth-order correction asdefined in Boore et al., 2002; the whole-record mean wasused if no pre-event portion was available). A Butterworthfourth-order acausal high-pass filter was then applied to sig-nals after cosine tapering and zero-padding both at the begin-ning and the end (Boore, 2005; Boore and Bommer, 2005).The length of the zero-padding depends on the order of thefilter and on the cutoff frequency according to Converse andBrady (1992). We did not apply low-pass filtering becausethe Italian accelerometric stations used in this study do nothave low kappa values (Rovelli et al., 1988), and thereforeresponse spectra at periods around 0.05 s should not be con-trolled by higher frequency ground motions (Douglas andBoore, 2011; Akkar et al., 2011).
In order to maintain a consistent filtered dataset and toreduce the influence of the filter cutoff on the usable fre-quency range, we chose to use response spectra for periodsless than 2 s. This choice is consistent with the recommen-dations by Akkar and Bommer (2006) on the factors thatcontrol the useful period range of processed recordings. In
Table 3Simplified Classification Adopted in This Paper*
Combined SoilClasses
Average Shear-WaveVelocity (VS30)
EUROCODE 8Classes
NEHRPClasses
AB VS30 ≥ 360 m=s A, B, and E B + CCD VS30 < 360 m=s C and D D + E
*Correspondence of the simplified combined soil classification ABand CD with the standard classifications based on VS30 for EuropeanSeismic Code classes (European Committee for Standardization[CEN], 2004) and NEHRP scheme (Building Seismic SafetyCouncil, 2000).
CL-ICL-IICL-IIICL-IVCL-VCL-VICL-VII
10010
4
4.5
5
5.5
6
6.5
7
Hypocentral distance (km)
Mom
ent M
agni
tude
Figure 2. Distribution of moment magnitude and hypocentraldistance for the selected dataset. Different symbols correspond tothe predominant-period classification scheme proposed in thisstudy. The color version of this figure is available only in the elec-tronic edition.
Predominant-Period Site Classification for Response Spectra Prediction Equations in Italy 683
particular, 2 s corresponds to the 70% of the minimum cutoffperiod used in the filters (Abrahamson and Silva, 1997;Spudich et al., 1999). Although Paolucci et al. (2008)demonstrated that digital accelerograms provide reliable re-sponse spectra up to longer periods, the choice of a 2-s upperlimit is conservative and conditioned by the use of manyanalog records (including analog records is necessary if thelargest magnitude events in Italy are included in our dataset,as these events were only recorded on analog instruments).
Results of Classifying Italian Strong-Motion Stations
We assigned a classification based on the predominantperiod for all 214 selected stations. We used the completedataset for the regression computation, but we considered asubset of 111 stations that recorded more than one eventfor statistical purposes (see Tables 4, 5, and Fig. 3a,b). Thedetermination of the predominant period of each station wasmade after computing the average H/V spectral ratio over theevents recorded at the station (or over the two horizontal com-ponents treated as independent in the case of stations that onlyrecorded a single event). We used ratios of response spectrarather than Fourier spectra (as inYamazaki andAnsary, 1997),because they do not need subjectively chosen smoothing. Thedominant period was determined using the identification pro-cedure proposed by Zhao et al. (2004), based on a quadraticfunction fit to the H/V spectral ratios at three samples aroundthe peak. At the end of this process, we visually inspected theresults, and we manually classified some stations for whichZhao’s identification procedure gave ambiguous results.
The statistics of the classifications are summarized inTables 4 and 5, which show cross-tabulation of the stationsinto the two sets of site classes. Most rock-like AB sites cor-respond to the new categories CL-I and CL-II, although someare in the more soil-like classes CL-IVand CL-VI. Similarly,soil-like CD sites fall into all but the CL-V classes, with theCL-IV class being the most common. Note that we were ableto classify 79 sites out of 91 AB sites and 18 sites out of 20
CD sites using the predominant-period criterion (87% in to-tal, Table 4). The percentage of successful classifications interms of numbers of records is similar (89%, Table 5).
We computed the geometric mean H/V response spectralratio and its standard deviation for each site class (Fig. 3a,b).The shape of the mean H/V response spectral ratios are com-parable to the results obtained by Zhao et al. (2006) for datafrom Japanese stations (see their fig. 3a,b), at least for thecommon classes: the periods of the peaks in the mean spectralratios are consistent with what they found, that is around0.15 s, 0.25 s, 0.4 s, and 1.0 s for CL-I, CL-II, CL-III, andCL-IV sites, respectively (of course, given that entries in eachclass are based on the predominant period, it is no surprise thatthe peaks of the mean ratios are consistent with the site classdefinitions). As expected on the basis of the class definitions,class CL-Vexhibits an almost flat meanH/V response spectralratio, as we expect for generic rock sites, while class CL-VIdisplays a broader mean H/V response spectral ratio shapewithout predominant peaks. The standard deviations havereasonably small values, ranging from0.2 in natural logarithmscale for class CL-Vup to about 0.4 for all the other classes butCL-IV (Fig. 3b). The standard deviation for the latter class isabout 0.7 at 0.9-s period. The analysis of the skewness revealsthat this high standard deviation value is due to few sitescharacterized by very high H/V spectral ratios, up to 16,for stations located in basins such as the Aterno Valley andthe Po and Garigliano Plains, both characterized by hundredsof meters of alluvial sediments (see De Luca et al., 2005, andMalagnini et al., 1993, respectively). Apart from class CL-IV,in the remaining classes there is a substantial reduction of ourstandard deviations (20%–40%) compared with the results byZhao et al. (2006) and Fukushima et al. (2007), both of whomused a larger dataset. For the sake of example, in the class thatamplifies at short periods, our study finds standard deviationbelow 0.4 in natural logarithm scale, whereas both Zhao et al.(2006) and Fukushima et al. (2007) find peak values around0.5. A similar behavior is noted for the class that amplifies at
Table 4Cross-Tabulation of Stations into the Two Sets of Site Classes
Number of Stations
Site Class CL-I CL-II CL-III CL-IV CL-V CL-VI CL-VII TOT
AB 19 19 16 11 11 3 12 91CD 3 2 2 9 0 2 2 20Total 22 21 18 20 11 5 14 111
Table 5Cross-Tabulation of Records into the Two Sets of Site Classes
Number of Records
Site Class CL-I CL-II CL-III CL-IV CL-V CL-VI CL-VII TOT
AB 142 90 72 45 73 12 58 492CD 13 23 7 46 0 14 7 110Total 155 113 79 91 73 36 65 602
684 C. Di Alessandro, L. F. Bonilla, D. M. Boore, A. Rovelli, and O. Scotti

intermediate periods, where our study finds values below0.35, whereas both Zhao and Fukushima finds values onthe order of 0.5–0.6.
The variations of the H/V spectral ratios between differ-ent magnitude and distance ranges are generally not signifi-cant. (Ⓔ More results are given in Figs. S1 and S2, and inTables S2 and S3, available in the electronic supplement tothis paper.)
Application of the Proposed Site Classifications
Our evaluation of the proposed site classifications isbased on ground-motion prediction equations fit to the data,both with the new site classes and with the simplified rock/
soil classification. Figure 2 shows a scatterplot for the dis-tribution of data from different predominant-period classeswith respect to moment magnitude and hypocentral distance.A subjective analysis of this figure indicates a relatively uni-form distribution of data with respect to moment magnitudeand hypocentral distance, where no significant trends can berecognized. This assertion is not based on formal statisticaltests, but we feel comfortable asserting that each site class iswell represented in the database for a wide range of magni-tudes and distances; therefore there should be no bias inderiving the coefficients for the magnitude and distancedependencies in our GMPE. We adopted a similar functionalform proposed by Fukushima et al. (2007), that is
log10 Sa�T� � a�T� � b�T�M� c�T�M2 � d�T�R� log10fR� e�T�10fMg � Sj�T�δj; (1)
where Sa�T� is the elastic absolute response spectral accel-eration for 5% damping. The functional form in equation (1)includes magnitude saturation at close distances and a quad-ratic magnitude dependence of the motions at a fixed dis-tance. Sa�T� was computed from the 602 selected recordsas the geometric mean of the two horizontal components.In equation (1), a, b, c, d, e, and Sj are period-dependentregression coefficients. f is a period-independent regressioncoefficient, and M and R are moment magnitude and hypo-central distance (in kilometers), respectively. The suffix jcorresponds either to the AB and CD classes or to the sevensite classes proposed in this study based on the predominantperiod. A summation of all site classes, except for AB or CL-I classes, which are taken to be the reference conditions forthe site response terms Sj�T�, is assumed in the term Sj�T�δj,and δj is a dummy variable, which is equal to 1 if data areobserved at j-th site category and 0 otherwise.
Fukushima et al. (2003) used a selection procedure intheir dataset in order to exclude small magnitude events atlarger distances. We checked this effect in our dataset andrealized that such winnowing does not make a strong differ-ence in terms of overall results and standard deviation.Therefore, in order to keep as much data as possible, we didnot apply any winnowing as a function of distance andmagnitude.
Details of the coefficient computation and comparisonwith other existing predictive equations at regional and globalscale using different site-classification criteria are discussed inthe Appendix. The appendix shows a satisfactory agreementwith predictions of other regressions that used much largerdatasets; wewant to stress, however, that the main goal of thisstudy is not the publication of a new GMPE with a limited re-gional applicability but a check of our new classificationscheme comparing its prediction performance with a conven-tional classificationwhen the same data and same statistics areused. (ⒺCoefficients of equation (1) are available in the elec-tronic supplement to this paper.)
10.11
1.2
1.4
1.6
1.8
2
2.2
2.4
2.6
2.8
3(a)
(b)
Period (s)
H/V
Res
pons
e S
pect
ral R
atio
Sta
ndar
d D
evia
tion
(Ln)
0.1
0.2
0.3
0.4
0.5
0.6
0.7
0.8
10.1 Period (s)
SCIVSCIII
SCV - orig.ABSCVI - orig.CDSCVII - unknown
SCISCII
Average H/V Response Spectral Ratios
Standard Deviations
Figure 3. (a) Geometric mean H/V response spectral ratio foreach site class proposed in this study, and (b) standard deviations innatural logarithm units. The color version of this figure is availableonly in the electronic edition.
Predominant-Period Site Classification for Response Spectra Prediction Equations in Italy 685
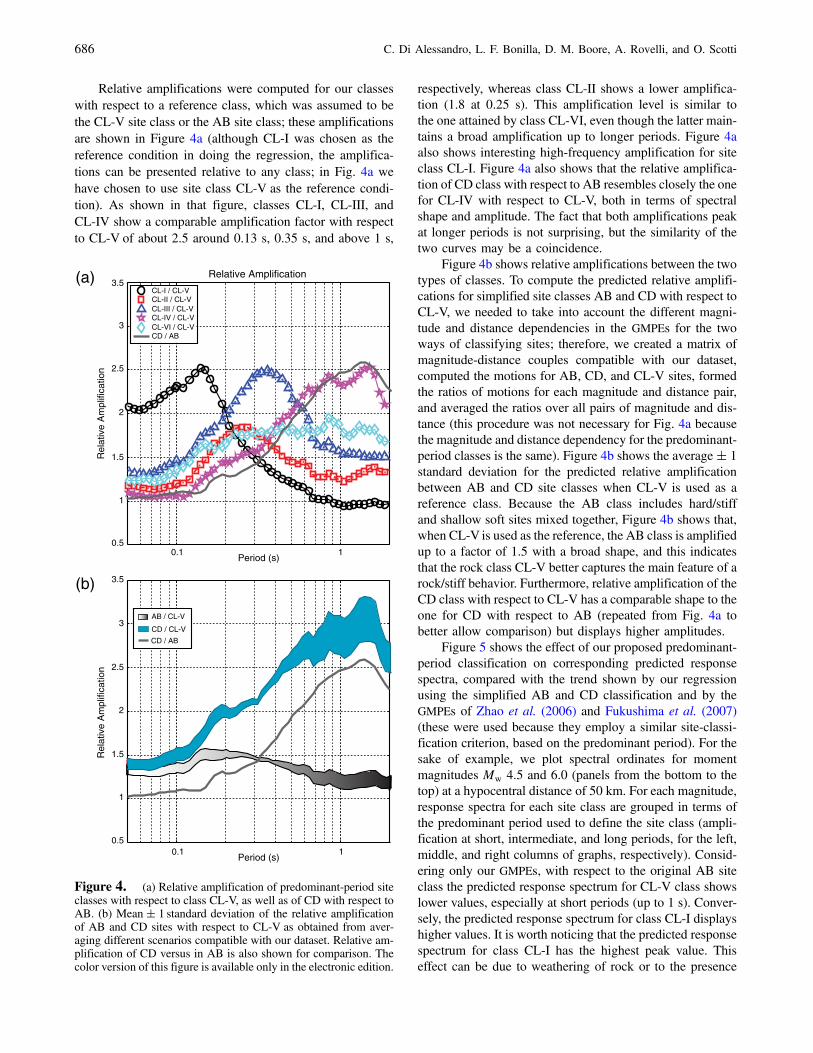
Relative amplifications were computed for our classeswith respect to a reference class, which was assumed to bethe CL-V site class or the AB site class; these amplificationsare shown in Figure 4a (although CL-I was chosen as thereference condition in doing the regression, the amplifica-tions can be presented relative to any class; in Fig. 4a wehave chosen to use site class CL-V as the reference condi-tion). As shown in that figure, classes CL-I, CL-III, andCL-IV show a comparable amplification factor with respectto CL-V of about 2.5 around 0.13 s, 0.35 s, and above 1 s,
respectively, whereas class CL-II shows a lower amplifica-tion (1.8 at 0.25 s). This amplification level is similar tothe one attained by class CL-VI, even though the latter main-tains a broad amplification up to longer periods. Figure 4aalso shows interesting high-frequency amplification for siteclass CL-I. Figure 4a also shows that the relative amplifica-tion of CD class with respect to AB resembles closely the onefor CL-IV with respect to CL-V, both in terms of spectralshape and amplitude. The fact that both amplifications peakat longer periods is not surprising, but the similarity of thetwo curves may be a coincidence.
Figure 4b shows relative amplifications between the twotypes of classes. To compute the predicted relative amplifi-cations for simplified site classes AB and CD with respect toCL-V, we needed to take into account the different magni-tude and distance dependencies in the GMPEs for the twoways of classifying sites; therefore, we created a matrix ofmagnitude-distance couples compatible with our dataset,computed the motions for AB, CD, and CL-V sites, formedthe ratios of motions for each magnitude and distance pair,and averaged the ratios over all pairs of magnitude and dis-tance (this procedure was not necessary for Fig. 4a becausethe magnitude and distance dependency for the predominant-period classes is the same). Figure 4b shows the average� 1
standard deviation for the predicted relative amplificationbetween AB and CD site classes when CL-V is used as areference class. Because the AB class includes hard/stiffand shallow soft sites mixed together, Figure 4b shows that,when CL-V is used as the reference, the AB class is amplifiedup to a factor of 1.5 with a broad shape, and this indicatesthat the rock class CL-V better captures the main feature of arock/stiff behavior. Furthermore, relative amplification of theCD class with respect to CL-V has a comparable shape to theone for CD with respect to AB (repeated from Fig. 4a tobetter allow comparison) but displays higher amplitudes.
Figure 5 shows the effect of our proposed predominant-period classification on corresponding predicted responsespectra, compared with the trend shown by our regressionusing the simplified AB and CD classification and by theGMPEs of Zhao et al. (2006) and Fukushima et al. (2007)(these were used because they employ a similar site-classi-fication criterion, based on the predominant period). For thesake of example, we plot spectral ordinates for momentmagnitudes Mw 4.5 and 6.0 (panels from the bottom to thetop) at a hypocentral distance of 50 km. For each magnitude,response spectra for each site class are grouped in terms ofthe predominant period used to define the site class (ampli-fication at short, intermediate, and long periods, for the left,middle, and right columns of graphs, respectively). Consid-ering only our GMPEs, with respect to the original AB siteclass the predicted response spectrum for CL-V class showslower values, especially at short periods (up to 1 s). Conver-sely, the predicted response spectrum for class CL-I displayshigher values. It is worth noticing that the predicted responsespectrum for class CL-I has the highest peak value. Thiseffect can be due to weathering of rock or to the presence
AB / CL-V
CD / CL-V
CD / AB
CL-I / CL-VCL-II / CL-VCL-III / CL-VCL-IV / CL-VCL-VI / CL-VCD / AB
10.10.5
1
1.5
2
2.5
3
3.5(a)
(b)
Period (s)
Rel
ativ
e A
mpl
ifica
tion
10.10.5
1
1.5
2
2.5
3
3.5
Period (s)
Rel
ativ
e A
mpl
ifica
tion
Relative Amplification
Figure 4. (a) Relative amplification of predominant-period siteclasses with respect to class CL-V, as well as of CD with respect toAB. (b) Mean� 1 standard deviation of the relative amplificationof AB and CD sites with respect to CL-V as obtained from aver-aging different scenarios compatible with our dataset. Relative am-plification of CD versus in AB is also shown for comparison. Thecolor version of this figure is available only in the electronic edition.
686 C. Di Alessandro, L. F. Bonilla, D. M. Boore, A. Rovelli, and O. Scotti

of thin soft layers with strong impedance contrast (usuallyreferred to as class E in Eurocode 8 (European Committee forStandardization (CEN), 2004). The high amplitude of classCL-1 as defined in Fukushima et al. (2007) was also noticedby those authors; given that their data were mostly from thewestern Eurasia area, whereas ours are from Italy, the simi-larity in the results suggests that the high-frequency CL-Iamplification could be a global feature. With respect to theoriginal CD site class, the predicted response spectrum forclass CL-IV is smaller but maintains a very similar shape.It is typically bimodal, with the longer period lobe thatincreases in importance as magnitude increases.
In terms of comparisons between GMPEs, Figure 5 in-dicates that there is satisfactory agreement in the spectralshape of all the GMPEs based on the predominant periodin H/V spectral ratios, although there are some differences inamplitudes. The comparison with the Zhao et al. (2006) andthe Fukushima et al. (2007) GMPEs shows fairly good agree-ment at Mw 6.0, whereas our predicted spectral amplitudes(SA) tend to be somewhat lower atMw 4.5. We are aware thatmagnitude uncertainty in small magnitude events may alsoplay a role about the observed discrepancy for Mw 4.5 com-parisons. However, all these variations are less than a factorof 2 and do not exceed the usual uncertainty of 0.3 (log base10). This is an interesting result if we consider the smallernumbers in the Italian dataset, of the order of hundreds ofrecords against thousands of records in Zhao et al. (2006).
The most noticeable amplitude differences are confinedwithin the classes that amplify at short periods. For instance,at Mw 6.0, the amplitudes of SA for our class CL-I are com-parable to those for Fukushima et al.’s CL-1 but are largerthan Zhao et al.’s SA for SC-I; in contrast, the latter is inbetter agreement with our curves for class CL-V at the sameMw 6.0. The peculiar high amplitude at short periods forclass CL-I is also evident when comparing predicted spectrawith other non-predominant-period-based GMPEs (theseresults are shown in the Appendix).
In order to help judge the impact of the new site classi-fication on predicted response spectra, we evaluated whetherand to what extent we can achieve a reduction of uncertaintyin ground-motion prediction. Overall standard deviationobtained using predominant-period classification and origi-nal AB-CD site classes in log10 logarithms are compared inFigure 6a. Figure 6a also shows the inter- and intraeventterms deviation as derived from the regression analysis.Although there is a reduction at short periods when usingthe period-based site classes, it is small (but comparable tothat found by Fukushima et al. [2007], as shown in Fig. 6b).Achieving only a small reduction in the variance with the useof more complex site classes is not unexpected and is not adefinitive test of the efficacy of a site-classification scheme.In studying a relative small number of motions, Boore (2004)found that the overall variance of individual observationsabout predicted values decreased only slightly in going from
LONG PER. AMPL.INTERMEDIATE PER. AMPL.SHORT PER. AMPL.
10-1
100
Periods (s)
CL-ISC-1 (Fukushima)SC-I (Zhao)CL-VSC -4 (Fukushima)
10-1
100
Periods (s)
CL-IICL-IIISC -2 (Fukushima)SC -II (Zhao)SC -III (Zhao)
10-1
100
Periods (s)
CL-IVSC -3 (Fukushima)SC -IV (Zhao)CL-VISC -5 (Fukushima)
AB CD
101
102
SA
(cm
/s2 )
100
101
SA
(cm
/s2 )
Mw
6.0
Mw
4.5
Figure 5. Predicted response spectra for the classification proposed in this study, compared to Zhao et al. (2006) and Fukushima et al.(2007), whose nomenclature of the site classes is described in Table 2. Spectral ordinates are for moment magnitudesMw 4.5 and 6.0 (panelsfrom top to the bottom) at hypocentral distance 50 km. Predicted spectra according to Zhao et al. (2006) were evaluated for earthquakescenario with focal depths less than 15 km and for unspecified fault type. “PER. AMPL.” is the abbreviation for period amplification; siteclasses that amplify at short periods or have a rock-like behavior are shown in the left panel, site classes that amplify at intermediate periods orhave a shallow-soil–like behavior are shown in the central panel, and site classes that amplify at long periods or have a deep-soil–like behavior are shown in the right panel. The color version of this figure is available only in the electronic edition.
Predominant-Period Site Classification for Response Spectra Prediction Equations in Italy 687

no classifications to classifications based on continuousVS30, with the largest reduction coming from a rock/soil clas-sification to a National Earthquake Hazard Reduction Pro-gram (NEHRP) classification. The more complex schemes,however, did remove systematic trends in the residuals.
In addition, we notice in Figure 6 that the aleatoryvariation tends to decrease at longer periods, which is in con-trast to what Fukushima et al. (2007) found with their regres-sion. With either site-classification scheme, our standarddeviations are higher than those found in a number of otherstudies. Others have observed this feature of Italian strong-motion data (e.g., Scasserra et al., 2009; Bindi et al., 2010).Cauzzi and Faccioli (2008) have suggested that the relativelyhigh values of standard deviation at shorter periods couldpossibly be related to the scatter introduced by site-relatedamplification effects.
Relative Differences in Amplifications fromthe GMPEs and from Recordings of the
L’Aquila Earthquake
We completed the computation of the coefficients inequation (1) before the occurrence of the 6 April 2009,Mw 6.3 L’Aquila earthquake in central Italy (Chiarabba et al.,2009; Çelebi et al., 2010). It was a normal faulting earth-quake that ruptured a 10 × 25 km2 fault oriented along theApennine trend beneath the town of L’Aquila (Cirella et al.,2009; Anzidei et al., 2009; Atzori et al., 2009). Fifty-fouraccelerometers were triggered, with hypocentral distancesfrom 11 to 277 km. These records gave us the opportunityto investigate how the newly recorded ground motions com-pare with the predicted values using the predominant-periodsite classification, including a test on the performance of the
site correction terms. Eighteen of the stations that recordedthe L’Aquila earthquake had been previously classified in ourstudy; we used the L’Aquila recordings to assign site classesat 36 other stations.
Figure 7 shows the residuals from the L’Aquila earth-quake for the different site classes. We grouped the residualsaccording to their hypocentral distance (within or beyond100 km, respectively), and we show results in terms of peak
0
0.05
0.1
0.15
0.2
0.25
0.3
0.35
0.4
0.45
0.5(a) (b)
0.1 1.0Period (s)
Sta
ndar
d D
evia
tion
(Log
10)
STANDARD DEVIATIONS
Total error (Predominant Period Classification)Total error (Original AB/CD site Classification)Intra-event error σInter-event error τ
0.1 1.0Period (s)
ITA08 (Bindi et al., 2008)Fukushima et al. 2007 (Pred. Per. Class.)Fukushima et al. 2007 (Rock / Soil Class)
Figure 6. (a) Overall standard deviation obtained using predominant-period classification and original simplified AB and CD site classesin decimal logarithms. Inter and intraevent terms are also shown for the predominant-period classification scheme. (b) Overall standarddeviations from Bindi et al. (2010) and Fukushima et al. (2007) in the same units as stated previously are also provided for comparison.The curve for Fukushima et al. (2007) referring to their original rock/soil classification has been kindly provided by the author and allows usto evaluate the reduction in standard deviation those authors achieved when adopting predominant-period classification, analogous to whatwe show in panel (a).
Residuals at Stations <= 100 km Residuals at Stations > 100 km
−1
−0.5
0
0.5
−1
−0.5
0
0.5
−1
−0.5
0
0.5
−1
−0.5
0
0.5
−1
−0.5
0
0.5
−1
−0.5
0
0.5
PGA
0.2 s
1.0 s
PGA
0.2 s
1.0 s
I II III IV V VI VII I II III IV V VI VII
Figure 7. Residuals of PGA and spectral ordinates at 0.2- and1.0-s periods during the 6 April 2009,Mw 6.3 L’Aquila earthquake.In the panels showing the residuals of predominant-period classes,cross and open circle symbols are used to distinguish stations withsource back-azimuth affected by antidirective and directive effects(i.e., whose source-to-station azimuth measured clockwise fromnorth is in the range 57°–187° and 200°–330°, respectively). Thecolor version of this figure is available only in the electronic edition.
688 C. Di Alessandro, L. F. Bonilla, D. M. Boore, A. Rovelli, and O. Scotti

ground acceleration (PGA) and spectral ordinates at twoselected periods (0.2 and 1.0 s). In Figure 7 crosses and opencircle symbols distinguish stations whose source-to-stationazimuth measured clockwise from north is in the range of57°–187° and 200°–330°, respectively. We borrow theseranges from Ameri et al. (2009), who, in common with otherstudies (Pino and Di Luccio, 2009; Bindi, Pacor, et al., 2009;Chioccarelli and Iervolino, 2010), found increasing groundmotion southeast of the epicenter and decreasing motion forstations in the opposite direction (this pattern might be due todirectivity associated with the propagation of the mainshockrupture). For the purpose of our study, the most importantfindings from Figure 7 are the similarities in the mean resi-duals for each class, thus suggesting that the site effectcorrections are proper, as they are not producing class-to-class differences in the residuals. The overall negative resi-duals for this peculiar earthquake are not of concern, andthey have been already reported in other papers that studiedthe event (e.g., Ameri et al., 2009; Akinci et al., 2010; Çelebiet al., 2010).
Finally, the average residuals computed for the L’Aquilaearthquake are similar to the interevent residuals at Mw 6.3from our GMPE regression analysis (see Fig. A1), so we canargue that adding the 6 April 2009 L’Aquila earthquake tothe dataset used to compute the regression coefficients wouldhave had little effect on the regression results.
Conclusions and Discussion
In this paper we present a new site-classification schemefor Italian stations, based on the predominant period of thesite, as derived from the average horizontal-to-vertical (H/V)spectral ratios of ground motion. This classification schemeis the same as proposed by Zhao et al. (2006), with theaddition of two classes that account for cases not includedin Zhao et al. classes. One (which we call CL-V) is definedas a site for which H/V does not exhibit any predominantpeaks, with an overall H/V ratio less than 2; the other(CL-VI) also has broad amplifications or multiple peaks inthe average H/V ratio at periods larger than 0.2 s. In addition,we include another class (CL-VII) not included in Zhao et al.(2006): a catchall class for any site that cannot be placed inthe other sites. We then use the new scheme to classifystations in Italy that recorded strong motions, and we thenderived GMPEs for these motions (GMPEs were also derivedusing a simple rock/soil classification scheme).
Despite the relatively small reduction of standard devia-tion at shorter periods when we use the predominant-periodclassification, our scheme has the advantage of recognizingwell-distinguished behavior of the proposed classes, both interms of relative amplification with respect to rock site(i.e., AB or CL-V sites) and of predicted spectral shape.
The newCL-V site is useful to classify rock stations to beused as reference sites in site-response studies and in thedevelopment of GMPEs. Neither Zhao et al. (2006) norFukushima et al. (2007) included a comparable classification.
As a matter of fact, when they were unable to identify apredominant period they used the available geological infor-mation to distinguish generic rock or generic soil classes.Figure 4 confirms the validity of our classification criterion:when CL-V is used as reference, the relative amplificationtends to unity at short periods for CL-II to CL-VI and at longperiods for CL-I.
The predominant-period classification shows interestingresults also for class CL-I (predominant period of less than0.2 s in H/V). The motions for this class have large ampli-fication at short periods relative to CL-V. Zhao et al. (2006)assumed that their SC-I is consistent with a stiff class in ageology-based classification. The cross reference betweensite geologic conditions and predominant-period classifica-tion in our study suggests that rock weathering can play arole in high-frequency amplifications observed at rock sites.Also complications in surface topography can amplifyground motions at stiff sites (Pischiutta et al., 2011). Simi-larly, thin-soft-layer sites (e.g., class E of Eurocode 8 [EC8]from the European Committee for Standardization [CEN],2004) can also fall in CL-I, contributing to large amplitudes.Weathered rock and class E are quite pervasive and difficultto avoid in practice, and conventional classification criteriaare not able to simply recognize them.
Sites with deep-soil profiles (such as CL-IV sites, forinstance) are easily recognized in our approach, which alsooffers the advantage of providing quick and inexpensive sitecharacterization without the necessity of performing timeconsuming and invasive analysis.
As the predominant-period classification implicitly con-tains both velocity and thickness of the upper resonant layersin its definition, it may be intrinsically better than using VS30
alone. In this sense it is consistent, at least in spirit, withcriteria that require the depth of soft upper layers in the siteclassification, as proposed by Rodríguez-Marek et al. (2001),Lang and Schwarz (2006), Pitilakis et al. (2006), and Cadetet al. (2010).
We also noted that many Italian stations are affected bytopographic effects that produce amplification over a broadrange of periods (Pischiutta et al., 2011); for this reason thereis not a straightforward correlation between site classificationbased on VS30 and our predominant-period-based classifica-tion (for example, a number of EC8 sites A are distributedrelatively uniformly over all of our classes).
A requirement in the application of our method is that agood mean estimate of the predominant period at a given siteis available. Because of the inherent variability in H/V due tosuch things as angle of incidence and source back-azimuth, anumber of recordings at a specific site should be used toobtain stable mean H/V.
Another potential limitation is that we use the predomi-nant period rather than the fundamental period for the wholesediment cover, and therefore the classification based on theproposed method could be controlled by large impedancecontrast at shallow depths rather than deeper velocity varia-tions. Class CL-VI deals with this, at least partially, because
Predominant-Period Site Classification for Response Spectra Prediction Equations in Italy 689
it allows for classification of sites for which several signifi-cant impedance contrasts in the underlying velocity structurelead to multiple peaks at periods longer than 0.2 s. For en-gineering applications the higher frequency resonances dueto shallow impedance contrasts may be more important thanthe fundamental mode resonance due to a deeper impedancecontrast, and for such sites we prefer to use the predominantperiod instead of the fundamental period as the basis for thesite classification.
We are also aware that our site classifications do not ac-count for sites with very long resonant periods (greater than2 s). It would be easy to include a class for this case, butItalian sites underlain by deep basins will probably haveshallower impedance contrasts, such that there will be pre-dominant periods less than the period of the fundamentalmode. Station GBP, installed in the middle of the Gubbiobasin over several hundred meters of sediments (Bindi, Par-olai, et al., 2009), is a typical example where both the deepalluvium-limestone contrast and an uppermost very soft layercause both short- (around 0.3 s) and long-period (around 3 s)amplification. According to our classification criteria, stationGBP is assigned to a CL-II class if we analyze the range0 < T < 2 s; however, it would be classified as CL-VI ifwe analyze the range 0 < T < 10 s in a predominant-periodcriterion (allowing the upper limit of the period-range in theclass definition to be 10 s rather than 2 s), whereas looking atthe fundamental frequency, station GBP can be classified as athick sediment site.
Notwithstanding these possible limitations, an encoura-ging feature of the proposed method relies on the fact that wefind a good degree of similarity in our derived GMPEs withthose using many more data from other parts of the world,even though deriving GMPEs was not a main goal of thispaper.
Finally, we believe that future work should be done toexplore the feasibility of using ambient noise to estimatepredominant periods from Fourier H/V spectral ratios,thus allowing classification of sites with no earthquakerecordings.
Data and Resources
The strong-motion data used in this paper have beenrecorded by the Rete Accelerometrica Nazionale (RAN).The data, as well as their metadata, are available through theItalian Accelerometric Archive (ITACA) at http://itaca.mi.ingv.it/ItacaNet/ (last accessed June 2011). Both corrected(Massa et al., 2009) and uncorrected waveforms are availablefor download.
ITACA is the Italian strong-motion database, developedfrom 2004 in the framework of the 2004–2006 DPC-INGVagreement and includes strong-motion data (1972–2004)from the Italian Accelerometeric Network (RAN), presentlyoperated by the Dipartimento Protezione Civile (DPC), avail-able at http://www.protezionecivile.it (last accessed Novem-ber 2011); the database includes as well revised earthquakes,
recording sites and instrument metadata. An updated andimproved release of ITACA has been recently released, in-cluding strong-motion data from 2005 to 2007 and recordsfrom the latest major earthquakes occurred in Italy (amongothers, the 2008, Mw 5.4, Parma earthquake and the 2009L’Aquila seismic sequence).
The supplemental velocity-sensor (Trillium 40-s) seis-mograms for the selected recent events with Mw > 4:0 wererecorded by seismological stations of the Italian SeismicNetwork run by Istituto Nazionale di Geofisica e Vulcano-logia (INGV). These waveforms are available at http://iside.rm.ingv.it (last accessed November 2011).
Origin times, epicenter locations, and focal parameters ofearthquakes are from the INGV-Centro Nazionale Terremotiwebsite at http://cnt.rm.ingv.it (last accessed August 2011).
More general information on the site classification S4project adopted for the strong-motion stations can be foundat S4 project-Deliverable D8, 2009.
Acknowledgments
This study began as a part of a Cooperative Agreement between theInstitute for Radiological Protection and Nuclear Safety (IRSN) and IstitutoNazionale di Geofisica e Volcanologia (INGV) for the years 2005–2007 andcontinued in Project S4 funded by the Department of Civil Protection of Italyfor 2007–2010 (http://esse4.mi.ingv.it). C.D.A. was supported by a fellow-ship from this project. She spent two years as a visiting scientist at theUSGS, Menlo Park, California, and is currently a postdoctoral fellow atPEER Center, University of California, Berkeley, California. We thankthe project codirectors, Francesca Pacor and Roberto Paolucci, for their con-tinuous encouragement. The authors acknowledge Antonella Gorini for theassistance in processing the strong-motion data. John Zhao provided thecode for the evaluation of his ground-motion prediction equations. MarcoMoro provided the GIS-base for the simplified soil classification of the Ita-lian territory, and Giuseppe Di Capua helped with the soil characterizationfor some stations by means of cooperative information exchange. We alsothank Giovanna Calderoni, Fabrizio Cara, Giuseppe Di Giulio, and GiulianoMilana for discussions and useful computational advice. Finally, we thankDino Bindi, J.B. Fletcher, Sinan Akkar, and John Zhao for useful reviewsthat improved the paper.
References
Abrahamson, N. A., and W. J. Silva (1997). Empirical response spectralattenuation relations for shallow crustal earthquakes, Seismol. Res.Lett. 68, 94–127.
Akinci, A., L. Malagnini, and F. Sabetta (2010). Characteristics of the strongground motions from the 6 April 2009 L’Aquila earthquake, Italy, SoilDynam. Earthquake Eng. 30, 320–335.
Akkar, S., and J. J. Bommer (2006). Influence of long-period filter cut-off onelastic spectral displacements, Earthquake Eng. Struct. Dynam. 35,1145–1165.
Akkar, S., and J. J. Bommer (2010). Empirical equations for the predictionof PGA, PGV, and spectral accelerations in Europe, the Mediterraneanregion, and the Middle East, Seismol. Res. Lett. 81, no. 2, 195–206, doi10.1785/gssrl.81.2.195.
Akkar, S., O. Kale, Y. Yenier, and J. J. Bommer (2011). The high-frequencylimit of usable response spectral ordinates from filtered analogue anddigital strong-motion accelerograms, Earthquake Eng. Struct. Dynam.40, doi 10.1002/eqe.1095.
Ameri, G., M. Massa, D. Bindi, E. D’Alema, A. Gorini, L. Luzi, S. Marzor-ati, F. Pacor, R. Paolucci, R. Puglia, and C. Smerzini (2009).The 6 April 2009, Mw 6.3, L’Aquila (central Italy) earthquake:
690 C. Di Alessandro, L. F. Bonilla, D. M. Boore, A. Rovelli, and O. Scotti
Strong-motion observations, Seismol. Res. Lett. 36, 951–966, doi10.1785/gssrl.80.6.951.
Anzidei, M., E. Boschi, V. Cannelli, R. Devoti, A. Esposito, A. Galvani, D.Melini, G. Pietrantonio, F. Riguzzi, V. Sepe, and E. Serpelloni (2009).Coseismic deformation of the destructive April 6, 2009 L’Aquila earth-quake (central Italy) from GPS data, Geophys. Res. Lett. 36, L17307,doi 10.1029/2009GL039145.
Atzori, S., I. Hunstad, M. Chini, S. Salvi, C. Tolomei, C. Bignami,S. Stramondo, E. Trasatti, A. Antonioli, and E. Boschi (2009). Finitefault inversion of DInSAR coseismic displacement of the 2009 L’A-quila earthquake (central Italy), Geophys. Res. Lett. 36, doi 10.1029/2009GL039293.
Beyer, K., and J. J. Bommer (2006). Relationships between median valuesand between aleatory variabilities for different definitions of thehorizontal component of motion, Bull. Seismol. Soc. Am. 96, no. 4A,1512–1522, doi 10.1785/0120050210.
Bindi, D., L. Luzi, M. Massa, and F. Pacor (2010). Horizontal and verticalground motion prediction equations derived from the Italian Accelero-metric Archive (ITACA), Bull. Earthquake Eng. 8, doi 10.1007/s10518-009-9130-9.
Bindi, D., F. Pacor, L. Luzi, M. Massa, and G. Ameri (2009). The Mw 6.3,2009 L’Aquila earthquake: Source, path, and site effects from spectralanalysis of strong motion data, Geophys. J. Int. 179, doi 10.1111/j.1365-246X.2009.04392.x.
Bindi, D., S. Parolai, F. Cara, G. Di Giulio, G. Ferretti, L. Luzi,G. Monachesi, F. Pacor, and A. Rovelli (2009). Site amplifications ob-served in the Gubbio basin, central Italy: Hints for lateral propagationeffects, Bull. Seismol. Soc. Am. 99, no. 2A, 741–76.
Boore, D. M. (2004). Can site response be predicted?, J. Earthquake Eng. 8,Special Issue 1, 1–4.
Boore, D. M. (2005). On pads and filters: Processing strong-motion data,Bull. Seismol. Soc. Am. 95, 745–750.
Boore, D. M., and M. W. Asten (2008). Comparisons of shear-waveslowness in the Santa Clara Valley, California, using blind interpreta-tions of data from invasive and noninvasive methods, Bull. Seismol.Soc. Am. 98, 1983–2003.
Boore, D. M., and G. M. Atkinson (2008). Ground-motion predictionequations for the average horizontal component of PGA, PGV, and5%-damped PSA at spectral periods between 0.01 s and 10.0 s,Earthquake Spectra 24, 99–113.
Boore, D. M., and J. J. Bommer (2005). Processing of strong-motion accel-erograms: Needs, options and consequences, Soil Dynam. EarthquakeEng. 25, 93–115.
Boore, D. M., C. D. Stephens, and W. B. Joyner (2002). Comment on base-line correction of digital strong-motion data: Examples from the 1999Hector Mine, California, earthquake, Bull. Seismol. Soc. Am. 92,1543–1560.
Building Seismic Safety Council (2000). The 2000 NEHRP RecommendedProvisions for New Buildings and Other Structures: Part I (Provisions)and Part II (Commentary), FEMA 368/369, Federal EmergencyManagement Agency, Washington, D.C.
Cadet, H., P. Y. Bard, and A. Rodriguez-Marek (2010). Defining a standardrock site: Propositions based on the KiK-net database, Bull. Seismol.Soc. Am. 100, 172–195.
Cauzzi, C., and E. Faccioli (2008). Broadband (0.05 to 20 s) prediction ofdisplacement response spectra based on worldwide digital records, J.Seismol. 12, doi 10.1007/s10950-008-9098-y.
Çelebi, M., P. Bazzurro, L. Chiaraluce, P. Clemente, L. Decanini,A. DeSortis, W. Ellsworth, A. Gorini, E. Kalkan, S. Marcucci, G.Milana, F. Mollaioli, M. Olivieri, R. Paolucci, D. Rinaldis, A. Rovelli,F. Sabetta, and C. Stephens (2010). Recorded motions of the Mw 6.3April 6, 2009 L’Aquila (Italy) earthquake and implications for buildingstructural damage: Overview, Earthquake Spectra 23, 651–684, doi10.1193/1.3450317.
Chiarabba, C., A. Amato, M. Anselmi, P. Baccheschi, I. Bianchi,M. Cattaneo, G. Cecere, L. Chiaraluce, M. G. Ciaccio, P. De Gori,G. De Luca, M. Di Bona, R. Di Stefano, L. Faenza, A. Govoni,
L. Improta, F. P. Lucente, A. Marchetti, L. Margheriti, F. Mele,A. Michelini, G. Monachesi, M. Moretti, M. Pastori, M. Piana Agos-tinetti, D. Piccinini, P. Roselli, D. Seccia, and L. Valoroso (2009). The2009 L’Aquila (central Italy)Mw 6.3 earthquake:Main shock and after-shocks, Geophys. Res. Lett. 36, L18308, doi 10.1029/2009GL039627.
Chiarabba, C., P. De Gori, L. Chiaraluce, P. Bordoni, M. Cattaneo,M. De Martin, A. Frepoli, A. Michelini, A. Monachesi, M. Moretti,G. P. Augliera, E. D’Alema, M. Frapiccini, A. Gassi, S. Marzorati,P. Di Bartolomeo, S. Gentile, A. Govoni, L. Lovisa, M. Romanelli,G. Ferretti, M. Pasta, D. Spallarossa, and E. Zumino (2005). Main-shocks and aftershocks of the 2002 Molise seismic sequence, southernItaly, J. Seismol. 9, 487–494.
Chioccarelli, E., and I. Iervolino (2010). Near-source seismic demand andpulse-like records: A discussion for L’Aquila earthquake, EarthquakeEng. Struct. Dynam. 39, doi 10.1002/eqe.987.
Cirella, A., A. Piatanesi, M. Cocco, E. Tinti, L. Scognamiglio, A. Michelini,A. Lomax, and E. Boschi (2009). Rupture history of the 2009 L’Aquilaearthquake from non-linear joint inversion of strong motion and GPSdata, Geophys. Res. Lett. 36, L19304, doi 10.1029/2009GL039795.
Cocco, M., and A. Rovelli (1989). Evidence of the variation of stress dropbetween normal and thrust faulting earthquakes in Italy, J. Geophys.Res. 94, 9399–9416.
Converse, A. M., and A. G. Brady (1992). BAP-basic strong-motionaccelerogram processing software; Version 1.0., U.S. Geol. Surv.Open-File Rept. 174, 92–296A.
De Luca, G., S. Marcucci, G. Milana, and T. Sanò (2005). Evidence oflow-frequency amplification in the city of L’Aquila, central Italy,through a multidisciplinary approach including strong- and weak-motion data, ambient noise, and numerical modeling, Bull. Seismol.Soc. Am. 95, 1469–1481.
Di Capua, G., G. Lanzo, V. Pessina, S. Peppoloni, and G. Scasserra (2011).The recording stations of the Italian strong motion network: Geologi-cal information and site classification, Bull. Earthquake Eng. 9, no. 6,1779–1796, doi 10.1007/s10518-011-9326-7.
Di Giulio, G., C. Cornou, M. Ohrnberger, M. Wathelet, and A. Rovelli(2006). Deriving wavefield characteristics and shear-velocity profilesfrom two-dimensional small-aperture arrays analysis of ambientvibrations in a small-size alluvial basin, Colfiorito, Italy, Bull. Seismol.Soc. Am. 96, 1915–1933, doi 10.1785/0120060119.
Douglas, J., and D. M. Boore (2011). High-frequency filtering of strong-motion records, Bull. Earthquake Eng. 9, 395–409, doi 10.1007/s10518-010-9208-4.
Ekström, G., A. Morelli, E. Boschi, and A. M. Dziewonski (1998). Momenttensor analysis of the central Italy earthquake sequence of September–October 1997, Geophys. Res. Lett. 25, 1971–1974.
European Committee for Standardization (CEN) (2004). Eurocode 8: Designof structures for earthquake resistance, part 1: General rules, seismicactions and rules for buildings, EN 1998-1, http://www.cen.eu/cenorm/homepage.htm (last accessed August 2008).
Fukushima, Y., C. Berge-Thierry, P. Volant, D. A. Griot-Pommera, and F.Cotton (2003). Attenuation relation for west Eurasia determined withrecent near-fault records from California, Japan and Turkey, J. Earth-quake Eng. 7, 1–26.
Fukushima, Y, L. F. Bonilla, O. Scotti, and J. Douglas (2007). Site classi-fication using horizontal-to-vertical response spectral ratios and its im-pact when deriving empirical ground-motion prediction equations, J.Earthquake Eng. 11, 712–724.
Ghasemi, H., M. Zare, Y. Fukushima, and F. Sinaeian (2009). Applyingempirical methods in site classification, using response spectral ratio(H/V): A case study on Iranian strong motion network (ISMN), SoilDynam. Earthquake Eng. 29, 121–132.
Japan Road Association (1980). Specifications for Highway Bridges Part V,Seismic Design, Maruzen Co., LTD, Tokyo, Japan.
Japan Road Association (1990). Specifications for Highway Bridges Part V,Seismic Design, Maruzen Co., LTD, Tokyo, Japan.
Joyner, W. B., and D. M. Boore (1993). Methods for regression analysis ofstrong-motion data, Bull. Seismol. Soc. Am. 83, 469–487.
Predominant-Period Site Classification for Response Spectra Prediction Equations in Italy 691

Lang, D. H., and J. Schwarz (2006). Instrumental subsoil classification ofCalifornian strong-motion sites based on single-station measurements,Proc. of the 8th U.S. National Conference on Earthquake EngineeringSan Francisco, California, United States, 19 April 2006.
Luzi, L., R. Puglia, F. Pacor, M. R. Gallipoli, D. Bindi, and M. Mucciarelli(2011). Proposal for a soil classification based on parameters alterna-tive or complementary to VS30, Bull. Earthquake Eng. 9, doi 10.1007/s10518-011-9274-2.
Luzi, L., S. Hailemikael, D. Bindi, F. Pacor, F. Mele, and F. Sabetta (2008).ITACA (ITalian ACcelerometric Archive): A web portal for the disse-mination of Italian strong motion data, Seismol. Res. Lett. 79, no. 5,716–723. doi 10. 1785/gssrl.79.5
Malagnini, L., A. Rovelli, S. E. Hough, and L. Seeber (1993). Site ampli-fication estimates in the Garigliano Valley, central Italy, based on densearray measurements of ambient noise, Bull. Seismol. Soc. Am. 83,1744–1755.
Massa, M., F. Pacor, L. Luzi, D. Bindi, G. Milana, F. Sabetta, A. Gorini, andS. Marcucci (2009). The ITalian ACcelerometric Archive (ITACA):Processing of strong-motion data, Bull. Earthquake Eng. 8, doi10.1007/s10518-009-9152-3
Pacor, F., R. Paolucci, L. Luzi, F. Sabetta, A. Spinelli, A. Gorini, M.Nicoletti, S. Marcucci, L. Filippi, and M. Dolce (2011). Overviewof the Italian strong motion database ITACA 1.0, Bull. EarthquakeEng. 9, no. 6, 1723–1739, doi 10.1007/s10518-011-9327-6.
Paolucci, R., A. Rovelli, E. Faccioli, C. Cauzzi, D. Finazzi, M. Vanini,C. Di Alessandro, and G. Calderoni (2008). On the reliability of longperiod response spectra ordinates from digital accelerograms,Earthquake Eng. Struct. Dynam. 37, 697–710.
Park, D., and Y. M. A. Hashash (2004). Probabilistic seismic hazard analysiswith nonlinear site effects in the Mississippi embayment, Proc. 13thWorld Conf. Earthq. Eng. Vancouver, British Columbia, Canada,1–6 August 2004, CD-Rom Edition, paper no. 1549.
Pino, N. A., and F. Di Luccio (2009). Source complexity of the 6 April 2009L’Aquila (central Italy) earthquake and its strongest aftershockrevealed by elementary seismological analysis, Geophys. Res. Lett.36, L23305, doi 10.1029/2009GL041331.
Pischiutta, M., A. Rovelli, P. Vannoli, and G. Calderoni (2011). Recurrenceof horizontal amplification at rock sites: A test using H/V-basedground motion prediction equations, in Proc. of 4th IASPEI/IAEEInternational Symposium “Effects of Surface Geology on SeismicMotion”, 23–26 August 2011, University of California, Santa Barbara,California.
Pitilakis, K., C. Gazepis, and A. Anastasiadis (2006). Design response spec-tra and soil classification for seismic code provisions, in G. Boucko-valas (ed) General Report. Proc. of the Athens Workshop, ETC12,Geotechnical Evaluation and Application of the Seismic EurocodeEC8, National Technical University of Athens, 20–21 January2006, Athens, Greece, 31–46.
Pondrelli, S., G. Ekström, and A. Morelli (2001). Seismotectonicre-evaluation of the 1976 Friuli, Italy, seismic sequence, J. Seismol.5, 73–83.
Rodríguez-Marek, A., J. D. Bray, and N. A. Abrahamson (2001). Anempirical geotechnical seismic site response procedure, EarthquakeSpectra 17, 65–87.
Rovelli, A., O. Bonamassa, M. Cocco, M. Di Bona, and S. Mazza (1988).Scaling laws and spectral parameters of the ground motion in activeextensional areas in Italy, Bull. Seismol. Soc. Am. 78, 530–560.
S4 project-Deliverable D8 (2009). Progress report on Identification ofITACA sites and records with distinctive features in their seismicresponse, May 2009. Available from http://esse4.mi.ingv.it/ (lastaccessed November 2011).
Sabetta, F., and A. Pugliese (1996). Estimation of response spectra andsimulation of non-stationary earthquake ground motions, Bull. Seis-mol. Soc. Am. 86, no. 2, 337–35.
Sandıkkaya, M. A., M. T. Yılmaz, B. S. Bakır, and Ö. Yılmaz (2010). Siteclassification of Turkish national strong-motion stations, J. Seismol.14, 543–563, doi 10.1007/s10950-009-9182-y.
Scasserra, G., J. P. Stewart, P. Bazzurro, G. Lanzo, and F. Mollaioli (2009).A comparison of NGA ground-motion prediction equations to Italiandata, Bull. Seismol. Soc. Am. 99, no. 5, 2961–2978, doi 10.1785/012008013.
Scherbaum, F., J. Schmedes, and F. Cotton (2004). On the conversion ofsource-to-site distance measures for extended earthquake sourcemodels, Bull. Seismol. Soc. Am. 94, 1053–1069.
Spudich, P., W. B. Joyner, A. G. Lindh, D. M. Boore, B. M. Margaris, and J.B. Fletcher (1999). SEA99: A revised ground motion prediction rela-tion for use in extensional tectonic regimes, Bull. Seismol. Soc. Am. 89,1156–70.
Steidl, J. H. (2000). Site response in Southern California for probabilisticseismic hazard analysis, Bull. Seismol. Soc. Am. 90, 149–169.
Xia, J., R. D. Miller, C. B. Park, J. A. Hunter, J. B. Harris, and J. Ivanov(2002). Comparing shear-wave velocity profiles from multichannelanalysis of surface wave with borehole measurements, Soil Dynam.Earthquake Eng. 22, 181–190.
Yamazaki, F., and M. A. Ansary (1997). Horizontal-to-vertical spectrum ra-tio of earthquake ground motion for site characterization, EarthquakeEng. Struct. Dynam. 26, 671–689.
Zhao, J. X., K. Irikura, J. Zhang, Y. Fukushima, P. G. Somerville, T. Saiki, H.Okada, and T. Takahashi (2004). Site classification for strong-motionstations in Japan using H/V response spectral ratio, in 13th WorldConference of Earthquake Engineering Vancouver, BritishColumbia,Canada, 1–6 August 2004, paper no. 1278.
Zhao, J. X., K. Irikura, J. Zhang, Y. Fukushima, P. G. Somerville, A. Asano,Y. Ohno, T. Oouchi, T. Takahashi, and H. Ogawa (2006). An empiricalsite-classification method for strong-motion stations in Japan usingH/V response spectral ratio, Bull. Seismol. Soc. Am. 96, 914–925.
Appendix
Regression Analysis, Residuals, and Comparisonbetween GMPEs
Method
The regression analysis is performed using the one-stepmethod of Joyner and Boore (1993). This method providesboth inter- and intraevent residuals and estimate of the cor-responding standard deviations. Equation (1) is linearizedthrough a Taylor series and solved iteratively. Fukushimaet al. (2003, 2007) found that f�T� was equal to 0.42 usingEuropean earthquakes. We used the same value in order tosimplify the linearization problem. (Ⓔ The values found forthe coefficients of equation 1 are listed in Table S1, availablein the electronic supplement to this paper.)
Residuals
Residuals of the predictive equations are computed asthe logarithmic ratio between observed and predicted re-sponse spectra. We plotted the interevent residuals (e.g., Bin-di, Pacor, et al., 2009; Scasserra et al., 2009) for PGA withrespect to moment magnitude (Fig. A1). We also show anexample of intraevent residuals for PGA with respect tomoment magnitude (Fig. A2) and hypocentral distance(Fig. A3), distinguishing the different predominant-periodclasses. Misfits do not seem to be biased either in magnitude
692 C. Di Alessandro, L. F. Bonilla, D. M. Boore, A. Rovelli, and O. Scotti

or in distance, as they oscillate around zero and do not showany significant trends. (Ⓔ Residuals for 0.2 s and 1.0 s areavailable in the electronic supplement to this paper in Fig. S3,S4, S5, and S6.)
Comparison with Other Regressions
Figure A4 shows the effect of our site-classification onpredicted response spectra, compared to the trend shown byanother predictive equation recently published by Bindi et al.(2010) for the Italian data using substantially the samedataset (Fig. A5 is similar to Figure 5, but the latter includesa comparison with GMPEs that used predominant-period-based site classes and data from other parts of the world). TheGMPEs by Bindi et al. (2010) (hereby referred to as ITA08)use three site classes (rock, shallow, and deep-soil). WhileITA08-predicted spectra for rock sites agree fairly well withour predictions for CL-V sites, ITA08 predictions for shallowsoils agree with our CL-II and CL-III spectra at short periodsbut they are smaller than our predictions at longer periods.
-1
-0.5
0
0.5
1Residuals vs Mw − PGA
Res
idua
ls (
Log 1
0)
CL−I CL−II
-1
-0.5
0
0.5
1
CL−III CL−IV
-1
-0.5
0
0.5
1
CL−V
4 5 6 7 4 5 6 7Mw
CL−VICL−VII
Res
idua
ls (
Log 1
0)R
esid
uals
(Lo
g 10)
Mw
Figure A2 Dependence of intraevent residuals on momentmagnitude Mw at PGA for the different predominant-period classesproposed in this study. The color version of this figure is availableonly in the electronic edition.
76.5654.54-0.8
-0.6
-0.4
-0.2
0
0.6
Mw
Inte
r-ev
ent r
esid
uals
(Lo
g 10)
PGA
0.2
0.4
5.5
Figure A1 Dependence of interevent PGA residuals on momentmagnitude Mw. The cross symbol shows the average residual com-puted for all the April 6, 2009 L’Aquila earthquake records in apredominant-period site-classification scheme. The color versionof this figure is available only in the electronic edition.
-1
-0.5
0
0.5
1Residuals vs Distance − PGA
Res
idua
ls (
Log 10
)
CL-I CL-II
-1
-0.5
0
0.5
1CL-III CL-IV
10 100-1
-0.5
0
0.5
1CL-V
10 100R hypo (km)
CL-VICL-VII
R hypo (km)
Res
idua
ls (
Log 10
)R
esid
uals
(Lo
g 10)
Figure A3 Dependence of intraevent residuals on hypocentraldistance Rhypo at PGA for the different predominant-period classesproposed in this study. The color version of this figure is availableonly in the electronic edition.
Predominant-Period Site Classification for Response Spectra Prediction Equations in Italy 693
CL-VITA08 - RockAB
CL-ICL-IICL-IIIITA08 - Shallow Soil
CL-IVCL-VIITA08 - Deep SoilCD
10-1
100
Periods (s)
101
102
SA
(cm
/s2 )
100
101
SA
(cm
/s2 )
10-1
10-1
100
Periods (s) 10-1
100
Periods (s)
Mw
6.0
Mw
4.5
LONG PER. AMPL.INTERMEDIATE PER. AMPL.SHORT PER. AMPL.
Figure A4 Predicted response spectra for the classification proposed in this study, compared to Bindi et al. (2010), referred to as ITA08.Spectral ordinates are for moment magnitudesMw 4.5 and 6.0 (panels from top to the bottom) at hypocentral distance compatible to 50 km ofhypocentral distance. “PER. AMPL.” is the abbreviation for “period amplification”; site classes that amplify at short periods or have a rock-likebehavior are shown in the left panel, site classes that amplify at intermediate periods or have a shallow-soil–like behavior are shown in thecentral panel and site classes that amplify at long periods or have a deep-soil–like behavior are shown in the right panel. The color version ofthis figure is available only in the electronic edition.
10-1
100
Periods (s)
101
102
SA
(cm
/s2 )
10-1
100
Periods (s)10
-110
0
Periods (s)
LONG PER. AMPL.INTERMEDIATE PER. AMPL.SHORT PER. AMPL.
CDCL-IVCL-VIC&F08 - DAk&Bo10 - SoftS&P96 - Deep SoilB&A08 - Vs 270 m/s
CL-IICL-IIIC&F08 - BC&F08 - C
S&P96 - Shallow soilB&A08 - Vs 580 m/s
ABCL-ICL-VC&F08 - AAk&Bo10 - RockS&P96 - StiffB&A08 - Vs 760 m/s
Ak&Bo10 - Stiff
101
102
PG
A (
cm/s
2 )
10 100Distance (km)
10 100Distance (km)
10 100Distance (km)
Figure A5. (Top panels) Comparison between our predicted spectral amplitudes and those from other global or regional predictionsbased on non-site-period classification criteria for moment magnitudes Mw 6.0 at distances compatible to 50 km of hypocentral distance.(Bottom panels) PGAwith respect to Joyner and Boore distance (Rjb) for the same GMPEs considered in the top panels. Consistency in thedistance metric is obtained by using the distance conversion scheme proposed by Scherbaum et al. (2004). Refer to Figure A4 for the criterionused to arrange the plots. The color version of this figure is available only in the electronic edition.
694 C. Di Alessandro, L. F. Bonilla, D. M. Boore, A. Rovelli, and O. Scotti

Furthermore, ITA08 spectra for shallow soils are peaked atsomewhat shorter periods than our CL-II and CL-III: thepeaked period is more consistent with our CL-I predictions,but ITA08 spectra show 33% lower amplitudes. Finally,ITA08 predictions for deep soils agree with our CL-IV spec-tra up to 0.5 s at Mw 4.5 and 6.0. Notwithstanding thedatabases used to derive the predictive equations are fairlysimilar, the differences in spectral values can be essentiallydue to the fact that the classification scheme used is verydifferent, ITA08’s one being based on schematic geologicclassification. Irregularities in surface topography and layer-ing, velocity inversions, deep refractors and scatterers, super-ficial weathering, and other causes may be responsible forthe differences between our approach and ITA08.
Figure A5 shows the comparison between our predictedspectra and other global or regional predictions for which siteclasses are not based on the predominant period: it doesaddress epistemic uncertainty related to the variability ofmean predictions for a particular site. The comparison isperformed among the GMPEs based on European seismiccode classes (Cauzzi and Faccioli, 2008, hereby referred toas C&F08), VS30 classes (Boore and Atkinson, 2008, herebyreferred to as B&A08) and generic soil description (Akkarand Bommer, 2010, and Sabetta and Pugliese, 1996, herebyreferred to as Ak&Bo10 and S&P96, respectively). In orderto ensure consistency among the horizontal component de-finition for the different GMPEs included in our comparison,the predicted spectral amplitudes of S&P96 and ITA08(which are estimated for the largest horizontal component)have been corrected according to the simple linear relation-ship proposed by Beyer and Bommer (2006). We did not cor-rect the predicted spectral amplitudes of B&A08 because, asmentioned in Beyer and Bommer (2006), the average differ-ence between GMRotI50 and the geometric mean of the twohorizontal components is negligible.
In the panels, predicted spectra are computed for thesame moment magnitude 6.0, where all the GMPEs are wellconstrained. Using a similar criterion to the one of Figure A4,panels have been arranged in order to separate sites that am-plify short periods or have a rock-like behavior (left panels)from sites that amplify long periods or have deep sedimen-tary layers (right panels). The graphs in the central panelshow motions for sites that amplify intermediate periodsor have shallow soil layers. In order to ensure compatibilitybetween different distance metrics, we exploited the distanceconversion approach proposed by Scherbaum et al. (2004)based on statistical analysis of matching distance types upto 100 km in terms of Joyner and Boore distance (herebyreferred to as Rjb) for three possible faulting styles. We se-lected the option for generic fault type (dip angles between40° and 90°) and computed compatible hypocentral andepicentral distances for each of the selected magnitudes ofFigure A4, starting from a linear array of Rjb. In Figure A5,
spectral amplitudes are evaluated at distances compatible to a50-km hypocentral distance. The same figure shows thedistance scaling of the PGA with respect to Rjb.
The comparison among different GMPEs included in theplot shows a big variability among the different authors. Ingeneral, however, the difference between our GMPEs andother authors’ does not exceed a factor of 2. The uniqueexception is class CL-I, which shows significantly largerspectral ordinates at short periods. As discussed in the text(Fig. 6), we have differentiated spectra of CL-I from the otherpredicted spectra for rock/stiff site conditions. This resultconfirms the necessity to distinguish sites that amplify atshort periods from sites that show limited or no amplification(CL-V).
Despite some minor differences among the variousGMPEs mainly due to different short and long distanceattenuation terms in their functional forms, we can note thatat low magnitudes, S&P96 shows the biggest differenceswith respect to our predictions. However, we wanted toinclude their predictions in the comparisons because theirpredictive equations have been used frequently in Italy.(Ⓔ Plots showing the distance scaling for 0.1 s, 0.3 s,and 1.0 s are available in the electronic supplement to thispaper in Fig. S7.)
Istituto Nazionale di Geofisica e Volcanologia (INGV)Via di Vigna Murata, 60500143 Roma, [email protected]@ingv.it
(C.D.A., A.R.)
Institut Français des Sciences et Technologiesdes Transports de l’Aménagement et des Réseaux (IFSTTAR)Département Géotechnique, Eau et RisquesGroupe Séismes et Vibrations58 boulevard Lefebvre75732 Paris Cedex 15, [email protected]
(L.F.B.)
U.S. Geological SurveyMS 977 345 Middlefield RoadMenlo Park, California [email protected]
(D.M.B.)
Institute for Radiological Protection and Nuclear Safety (IRSN)31, avenue de la Division Leclerc92260 Fontenay-aux-Roses, [email protected]
(O.S.)
Manuscript received 22 March 2011
Predominant-Period Site Classification for Response Spectra Prediction Equations in Italy 695