predictive validity of 4 risk assessment scales for...
TRANSCRIPT

Predictive validity of 4 risk assessment scales
for prediction of pressure ulcer development in
a hospital setting
Ulrika Källman and Margareta Lindgren
Linköping University Post Print
N.B.: When citing this work, cite the original article.
Original Publication:
Ulrika Källman and Margareta Lindgren, Predictive validity of 4 risk assessment scales for
prediction of pressure ulcer development in a hospital setting, 2014, Advances in Skin &
Wound Care, (27), 2, 70-76.
http://dx.doi.org/10.1097/01.ASW.0000439059.72199.41
Copyright: Lippincott, Williams & Wilkins
http://www.lww.com/
Postprint available at: Linköping University Electronic Press
http://urn.kb.se/resolve?urn=urn:nbn:se:liu:diva-104219

[Skriv text]
Predictive Validity of 4 Risk Assessment Scales for Prediction of Pressure Ulcer Development in a Hospital Setting Ulrika Källman, RN, PhD student; and Margareta Lindgren, RN, PhD, Ass. professor
Ulrika Källman, RN is a PhD student and at the Department of Medicine and Health, Faculty of Health Sciences, Linköping
University, Linköping, Sweden and RN at the Department of Dermatology, Södra Älsvorgs Hospital, Borås Sweden. Margareta
Lindgren RN, PhD, is an Ass.Professor, Department of Department of Medicine and Health, Faculty of Health Sciences,
Linköping University.
Acknowledgments: The authors thank the study participants for their patience and cooperation and also the partnering
organizations and their senior nurse leaders and staff for all the help given during the research project. Additional thanks are
extended to Södra Älvsborg Hospital, Borås, and Linköping University, Linköping, Sweden. The authors have disclosed that
they have no financial relationships related to this article. Submitted October 12, 2012; accepted in revised form March 8, 2013.
ABSTRACT
OBJECTIVES: The aims of this study were to examine and compare the predictive validity of 4 risk
assessment scales used for the prediction of pressure ulcer (PrU) development and to identify risk
factors.
DESIGN: Cross-sectional descriptive study.
SETTING: A general hospital in Sweden.
PARTICIPANTS: Patients (all aged ≥18 years) admitted to medical, surgical, orthopedic, oncology,
and rehabilitation wards. Of 412 patients available, a total of 346 patients participated in the study.
METHOD: Data were collected using the Swedish version of the European Pressure Ulcer Advisory
Panel minimum data set as well as the Norton, Modified Norton, Braden, and RAPS (Risk Assessment
Pressure Ulcer Scale) scales. The predicative validity was estimated by measuring sensitivity,
specificity, positive predictive value, and negative predictive value. Multiple logistic regression
analysis was used to determine risk factors associated with PrUs.

[Skriv text]
RESULTS: The RAPS scale reached best balance between sensitivity and specificity at the
recommended cutoff level of less than or equal to 29, followed by the Braden scale and the Norton
scale at recommended cutoff levels less than or equal to 18 versus less than or equal to 16,
respectively. The modified Norton scale also reached an acceptable balance between sensitivity and
specificity but at the cutoff level of less than or equal to 23, which is a higher cutoff level than
recommended. General physical condition, physical activity, moisture, friction, and shear emerged as
significant risk factors.
CONCLUSIONS: The results support that the recommended cutoff levels of the RAPS, Norton and
Braden, and are valid in a general hospital setting. However, the recommended cutoff level of the
modified Norton scale (≤20) has to be increased when used in this care context.
Pressure ulcer (PrU) development constitutes a major problem
in nursing care and causes pain and suffering to those who are
affected. Not only do PrUs jeopardize the health of patients,
but also they are associated with significant costs in
healthcare. In Sweden, the prevalence of PrUs has been shown
to be 14% to 27% among hospital inpatients,1,2 and the
incidence stands at 11.5% to 28%.3,4 Among hospital inpatients
in other European countries, 4.5% to 18% prevalence of PrUs
has been found,5,6
and in the United States, 6.3% to 20%.2,7,8
The prevention of pressure ulcer formation is an important
aspect of nursing care, and the identification of patients who
require preventive measures is a key issue. One recommendation
to facilitate the identification process is to perform

[Skriv text]
systematic risk assessments using a risk assessment scale that
has been tested for validity and reliability in addition to
clinical judgement.9 Various risk assessment scales have been
developed since the early 1960s, and all of the scales have
claimed to have acceptable ability to identify patients at
risk of pressure ulcer development. However, changes in
hospital care such as the prevalence of an older patient
population and shorter hospital stay motivate continuous and
repeated examination of the predictive validity of these
instruments.
LITERATURE REVIEW
According to the European Pressure Ulcer Advisory Panel
(EPUAP) and the National Pressure Ulcer Advisory Panel,9 a PrU
is defined as “localized injury to the skin and/or underlying
tissue usually located over bony prominences, as a result of
pressure or pressure in combination with shear.”
Other extrinsic factors such as heat accumulation between
the patient and the bed, friction, irritants, and poor hygiene
are among other important contributing factors.10,11
Furthermore, there are numerous intrinsic factors that affect
the ability of the patient's skin to resist pressure and shear
forces, where age, nutrition, level of mobility and activity,
body temperature, incontinence (moisture), peripheral vascular
disease, blood pressure, serum albumin, general physical

[Skriv text]
condition, sensory perception, and skin condition have been
shown to be of significance.12-16
A risk assessment scale summarizes a range of these
intrinsic and extrinsic factors; however, as a scale should be
easy to use, it is not possible to include all factors. It is
important that the instruments include the most important risk
factors and have the ability to correctly identify patients at
risk.17,18
This designates as the instrument's sensitivity and
specificity and predictive value. A risk assessment scale
should have high sensitivity so as to be able to correctly
identify as many patients as possible as positive (ie, those
who are at risk of pressure ulcer development). It should also
have high specificity so as to be able to correctly identify
as many patients as possible as negative (ie, those who are
not at risk of pressure ulcer development). Likewise, the
positive (PPV) and negative predictive values (NPV) should be
high. Positive predictive value is defined as the probability
of pressure ulcer development among those who are classified
as risk patients. Negative predicative value is defined as the
probability of not developing PrUs among those who are defined
as not being at risk.19
However, to have a test that is both highly sensitive and
highly specific is usually not possible. Instead, a cutoff
level, based on a decision as to where the best balance

[Skriv text]
between the sensitivity and specificity is found, is often
used.18
The Norton Scale
The Norton scale was one of the first risk assessment scales
developed to predict pressure ulcer development. It was based
on clinical experience of a geriatric population in the early
1960s20 and includes 5 variables (Table 1). The variables are
divided into 4 subcategories, each with a score range of 1
(very bad) to 4 (good), giving a maximum score of 20. The
total score is related to a cutoff level, indicating the
presence or absence of risk of pressure ulcer development.
When first introduced, a cutoff level of less than or equal to
14 was suggested for patients “at risk.” The author later
reconsidered and suggested that a cutoff level of 15 or 16
should be used instead, because of changes in care over time.21
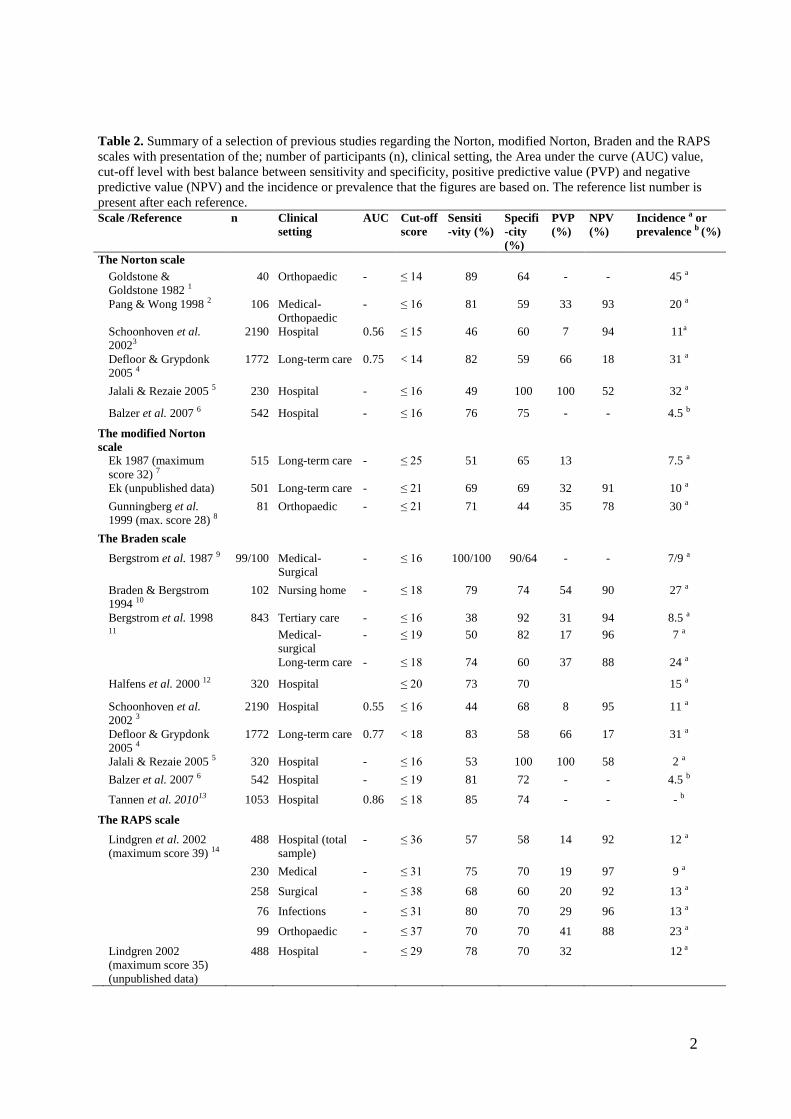
Table 2 gives an overview of previous research into the
predictive validity of the Norton scale with different cutoff
levels and different settings used.
The Modified Norton Scale
A modified version of the Norton scale was first used in
Sweden in 1987 by Ek.22 The scale adds the variables food and
fluid intake, body temperature, and social activity onto the
original Norton scale. The scale was again modified after a
multiple regression analysis.23 Body temperature and social

[Skriv text]
activity were excluded from the scale as they did not appear
to be specific risk factors, but the variables food and fluid
intake were retained (Table 1). This remodified version has a
maximum score of 28. Patients with a total score of less than
or equal to 21 are considered to be at risk of developing
PrUs,23 whereas a cutoff level of less than or equal to 20 is
recommended in the Swedish Handbook for Healthcare.24 The
modified Norton scale has been validated in long-term care and
orthopedic settings (Table 2).
The Braden Scale
The Braden scale was developed in the late 1980s and is based
on an overview of literature on the subject.25 The scale
consists of 6 variables: activity, mobility, nutritional
status, sensory perception, moisture, and friction and shear
(Table 1). Each variable is rated 1 to 4, except for the
friction and shear variable, which is rated from 1 to 3, thus
generating a maximum score of 23. The cutoff level was
originally reported as less than or equal to 16, but further
testing has resulted in a recommended cutoff level of less
than or equal to 18.26,27
Study results of the predictive
validity for the Braden scale are presented in Table 2.
The RAPS Scale
Lindgren et al3 introduced the RAPS scale (Risk Assessment
Pressure Ulcer Scale) in Sweden in the early 2000s. The scale

[Skriv text]
consists of variables culled from the Norton, modified Norton,
and Braden scales. The final version of the RAPS scale is
composed of the following variables: general physical
condition, activity, mobility, moisture, food intake, fluid
intake, sensory perception, friction and shear, body
temperature, and s-albumin (Table 1). The maximum score is 39,
and a cutoff level of less than or equal to 31 has been
suggested (Table 2). However, as s-albumin is not always
available, a version without this variable is often used. The
maximum score is then 35 with a recommended cutoff level of
less than or equal to 29.28
The aim of this study was to determine the predictive
validity of these 4 risk assessment scales in a Swedish
hospital setting. Two of the scales are commonly used in
Sweden (modified Norton and RAPS), and 2 are used worldwide
(Norton and Braden scales). A secondary aim was also to
identify risk factors for pressure ulcer development.
METHODS
Setting and Sample
This cross-sectional descriptive study was conducted in a
hospital in southern Sweden. At the time of the study, the
hospital had 510 beds divided into 36 departments.
After receiving approval from the hospital management to
implement the study, one of the researchers identified teams

[Skriv text]
of nurses to perform the data collection on each ward. Each
team consisted of 2 nurses: 1 registered nurse from the ward
being surveyed and 1 registered nurse or assistant nurse from
another ward who was an expert in the field of PrUs. Prior to
the study, all teams were educated in the use of the data
collection instrument, how to perform the risk assessment, and
how to define PrUs according to the EPUAP classification.9
The data collection was performed between 7 AM and 4 PM
during the course of 1 day in November 2009. Patients older
than 18 years and who were admitted to the medical, surgical,
orthopedic, oncology, or rehabilitation ward were included in
the study. Patients who were treated in the children's ward,
psychiatric wards, outpatient clinics, day care, and maternity
ward were excluded from the study.
Registered nurses at each ward informed the patients or
relatives, both orally and in writing, about the study on the
day prior to the survey. All patients were guaranteed
confidentiality and were assured that no individuals could be
identified when results were published. After obtaining the
patients' informed consent or, for unconscious patients, the
consent of the next of kin, each patient was thoroughly
examined for the presence or absence of PrUs by the 2 nurses
on the day of the survey. The nursing teams also completed a

[Skriv text]
data collection protocol on all patients, including background
data such as gender, age, and date of admission.
An ethical application was sent to the regional ethical
committee, and the board gave an advisory opinion (Dnr 582-
07), which was subsequently followed. The study has also been
performed in accordance to the Declaration of Helsinki.
Data Collection Protocol
The protocol used for the data collection was based on the
Swedish version of the EPUAP–minimal data set.29 It consists of
the following categories: general data, patient data, risk
assessment, incontinence (modified), skin observation,
preventive measures, and reason for eventual exclusion. Some
new items regarding documentation were added to the categories
as well as a tick box for informed consent. Observed PrUs were
classified in accordance to the EPUAP classification system:
category 1 pressure ulcer being a non-blanchable erythema,
category 2 being an abrasion or blister, category 3 being a
superficial ulcer, and category 4 being a deep ulcer.9 The
location of existing PrUs was marked on a body map, and the
most dominant pressure ulcer was also noted according to the
following response alternatives: sacrum, heel, hip, or
“other.”

[Skriv text]
The risk of each patient developing PrUs was assessed
using the 4 aforementioned risk assessment scales. The RAPS
scale used in this study was the version without s-albumin.
The variables from the scales were put together in 1
document. Two of the included variables' subscales differ from
the others, those being food intake/nutritional status and
moisture/incontinence. In the mutual scale, the definition
from the RAPS and modified Norton scale regarding food intake
was chosen. Likewise, the description from the RAPS and the
Braden scale regarding moisture was used. The kinds of
incontinence aids (urinary and/or fecal) and urinary catheter
used were also noted if relevant.
Statistical Analysis
Nonparametric data are presented as frequencies and
percentages, and parametric data are presented as means and
SD. Comparisons were made between patients with PrUs and
patients without. The predicative validity was estimated by
measuring sensitivity, specificity, PPV, and NPV; all of these
are presented as percentages. Figure 1 shows the relationship
between the risk assessment scale and the presence or absence
of PrUs. The sensitivity was calculated as a / (a + c),
specificity as d / (b + d), PPV as a / (a + b), and NPV d / (c
+ d).19 The values change depending on how the different cutoff
levels of the scales identify patients as “at risk” or “not at

[Skriv text]
risk.” To define the prognostic validity of the scales, the
area under curve was calculated. Multiple logistic regression
analysis was used to determine factors associated with PrUs.
The dependent variable, the presence of PrUs, was coded as 0
representing no pressure ulcer and 1 representing presence of
PrUs. All the factors in the assessment scales were used as
covariates (Table 2).
RESULTS
Participants
On the day of the survey, 412 patients were available for
inclusion. However, 12 patients declined participation, 29
were not available for participation at the time of survey,
and 25 patients did not participate for other reasons. Thus,
346 patients were included in the study. The mean age of the
participants was 71 (SD, 16.2) years, and 172 (49.9%) of the
patients were female.
Fifty-six of the 346 patients were found to have at least
1 pressure ulcer, yielding a prevalence rate of 16.2%. Of
these patients, 23 (41.5%) had category 1 ulcers, 2 (19.5%)
had ulcers of category 2, 11 (19.5%) of category 3, and 11
(19.5%) of category 4. The 56 patients with PrUs experienced a
total of 83 PrUs. Heels (n = 21 [37.5%]) and the sacrum (n =
14 [25%]) were the most frequent sites of the patients' most
severe pressure ulcer. Twenty-eight percent (n = 97) of all

[Skriv text]
participating patients received some kind of pressure ulcer
preventive measure (mattresses/cushions in bed or chair and/or
regularly repositioning in bed or chair), of whom 34% (n = 33)
had a pressure ulcer. Further characteristics of the
participants are presented in Table 3.
Predictive Validity of Risk Assessment Scales
The results of the predictive validity screening tests of the
Norton, modified Norton, Braden, and RAPS scales are
summarized in Table 4. The RAPS scale showed the best balance
between sensitivity (77.8%) and specificity (69.9%) at the
recommended cutoff level (≤29), followed by the Braden scale
(sensitivity 74.5% and specificity 73.7%) at the recommended
cutoff level of less than or equal to 18, and the Norton scale
(sensitivity 74.5% and specificity 70.6%) at the recommended
cutoff level of less than or equal to 16. The best balance
between sensitivity (77.8%) and specificity (68.4%) of the
modified Norton scale was reached at a cutoff level of less
than or equal to 23. Acceptable area under curve was reached
for all scales (Table 4).
At these cutoff levels, which show the best balance
between sensitivity and specificity, the modified Norton scale
had the highest PPV (35.1%), and the RAPS scale the highest
NPV (94.4%); the Norton scale had both the lowest PPV (32.5%)
and NPV (93.6%).
[Skriv text]
When performing a multiple logistic regression analysis
including all variables in the different risk assessment
scales, the following variables emerged as significant risk
factors for pressure ulcer development: general physical
condition (P > .001), physical activity (P = .029), friction
and shear (P = .036), and moisture (P = .041).
DISCUSSION
This study aimed to examine and compare the predictive
validity of the 4 different risk assessment scales used for
the prediction of pressure ulcer development in a hospital
setting. These scales were the Norton, modified Norton,
Braden, and the RAPS scale. All the scales achieved acceptable
prognostic validity, sensitivity, specificity, and NPV, but
the scales' PPVs were low. The result both supports and
contradicts previously recommended cutoff levels.
Concerning the 2 risk assessment scales commonly used in
Sweden (the modified Norton scale and the RAPS scale),
comparison with previous research is not easily done.
Regarding the RAPS scale version without the risk factor s-
albumin, a cutoff level of 29 has been recommended.28 The
findings in this study support that this estimation is
suitable in a hospital setting. One can argue that a better
balance between sensitivity and specificity was received at a
cutoff level of 28 for the RAPS scale. However, it is

[Skriv text]
preferable to choose a cutoff level generating higher
sensitivity than specificity when it is important not to miss
the presence of disease or, in this case, the risk of an
injury such as a pressure ulcer.18
The modified Norton scale has previously been validated
within long-term care and for orthopedic patients, but not in
a general hospital setting. In previous research, a cutoff
level of 21 has been used, but in the Swedish Handbook for
Healthcare,24 a cutoff level of 20 is recommended. Based on the
reasoning that higher sensitivity is preferable to higher
specificity, this study indicates that the cutoff level should
be as high as 23.18 These study results could be used as a
basis for discussion concerning the current recommended cutoff
level and if it should be reconsidered.
The discrepancies in the sensitivity between the modified
Norton and the RAPS scale, as they are used in practice, are
interesting and may have repercussions for the care provided.
The risk assessment's aim is to function as a guide to
identify which patients are in need of preventive measures. As
the sensitivity for the modified Norton scale was 59.6% at the
recommended cutoff score of 20, fewer patients will be
identified as “at risk” at hospitals using this scale than at
hospitals using the RAPS scale (with a sensitivity of 77.8%).
That means that if nurses in Sweden make the decision as to

[Skriv text]
whether to deliver preventive measures based on the results of
the risk assessment scale, nursing care will not be equal.
Hypothetically, fewer patients will achieve preventive
measures at hospitals using the modified Norton scale than
patients at hospitals using the RAPS scale.
The author of the Norton scale has suggested raising the
cutoff level from 14 to 15 or 16.30 The results of this study,
as well as those in the study by Balzer et al,5 support a
cutoff level of 16 being used in hospital settings.
Findings were similar for the Braden scale; further
testing by the authors and others have resulted in a
recommendation of a cutoff level of 18 instead of 16,27 which
is also supported by our results. However, researchers Balzer
et al5 and Halfens et al
31 find the best balance to be at an
even higher cutoff level: 19 or 20 in a hospital setting.
It is desirable to have a risk assessment scale that is
both highly sensitive and highly specific. However, there is
an important difference between a diagnostic screening test
and a risk assessment scale. The use of effective pressure
ulcer preventive measures will alter the validity test of the
risk assessment scales.32 For example, if a highly sensitive
risk assessment scale is used and preventive measures are
effective, both the sensitivity and specificity will decrease.
For this reason, sensitivity and specificity criteria have

[Skriv text]
been criticized for not being the most appropriate tools to
validate risk assessment scales.33 Because of it being
ethically unacceptable to withhold preventive measures, a
lower level of sensitivity and specificity has to be accepted.
The effect of preventive measures could also be the
reason why the PPV of the scales was not very high,
irrespective of the cutoff level used. A further explanation
could also be due to the fact that patients' health improved
during their hospital stay, and because of this they did not
develop PrUs. The interpretation of a positive or negative
diagnostic test result varies from setting to setting,
according to the prevalence of disease, or, in this case
injury, in the particular setting. If the prevalence in this
study had been higher, it is likely that the PPV would have
been higher and NPV lower.19
A further aim of this study was to identify risk factors
for pressure ulcer development. In the multiple regression
analysis, the variables general physical condition, physical
activity, friction and shear, and moisture emerged as
significant risk factors for pressure ulcer development. It
was somewhat surprising that immobility did not emerge as a
significant risk factor as previous studies have shown that
this risk factor is strongly associated with the development
of PrUs.12,13
However, the variable of friction/shear has shown

[Skriv text]
to be highly correlated with immobility13 and could thus have
diminished the effect of immobility. Furthermore, as the
variables of physical activity and immobility almost elucidate
the same thing, it is possible that these risk factors
(variables) are correlated to each other as well.
It is of primary importance that the instruments include
significant risk factors and have the ability to accurately
identify patients at risk of pressure ulcer development. Based
on the risk assessment scales validated in this study, the
RAPS scale was the only instrument including all the risk
factors that emerged as significant in this study.
STUDY LIMITATIONS
A possible problem with this study is that the variables from
the different assessment scales have been merged and not
tested for reliability and validity as a whole scale. However,
each scale has been tested separately, and several of the
variables are the same in the different scales. The strength
of this study may be that the risk assessment scales have been
validated using the same sample and under the same conditions.
To further test the predictive validity of the risk
assessment scales included in the study, a prospective design
may be used. This was not possible in the current study;
furthermore, a prospective study may see preventive measures
that interfere with the results.

[Skriv text]
CONCLUSIONS
The result supports that the recommended cutoff levels of the
Norton (level ≤ 16), Braden (level ≤ 18), and RAPS scales
(level ≤ 29) are valid for achieving good balance between
sensitivity and specificity in hospital settings. However, the
recommended cutoff level of the modified Norton scale (level
≤ 20) must be increased when used in a hospital setting.
References
1. Wann-Hansson C, Hagell P, Willman A. Risk factors and prevention among patients with hospital-acquired
and pre-existing pressure ulcers in an acute care hospital. J Clin Nurs 2008;17:1718-27.
2. Gunningberg L, Donaldson N, Aydin C, et al. Exploring variation in pressure ulcer prevalence in Sweden and
the USA: benchmarking in action. J Eval Clin Pract 2012;18:904-10.
3. Lindgren M, Unosson M, Krantz AM, et al. A risk assessment scale for the prediction of pressure sore
development: reliability and validity. J Adv Nurs 2002;38:190-9.
4. Gunnarsson AK, Lonn K, Gunningberg L. Does nutritional intervention for patients with hip fractures reduce
postoperative complications and improve rehabilitation? J Clin Nurs 2009;18:1325-33.
5. Balzer K, Pohl C, Dassen T, et al. The Norton, Waterlow, Braden, and Care Dependency Scales: comparing
their validity when identifying patients' pressure sore risk. J Wound Ostomy Continence Nurs 2007;34:389-98.
6. Vanderwee K, Clark M, Dealey C, et al. Pressure ulcer prevalence in Europe: a pilot study. J Eval Clin Pract
2007;13:227-35.
7. Vangilder C, MacFarlane GD, Meyer S. Feature: results of nine international pressure ulcer prevalence
surveys: 1989 to 2005. Ostomy Wound Manage 2008;54:40-54.
8. Jenkins ML, O'Neal E. Pressure ulcer prevalence and incidence in acute care. Adv Skin Wound Care
2010;23:556-9.
9. EPUAP/NPUAP. European Pressure Ulcer Advisory Panel and National Pressure Ulcer Advisory Panel—
Prevention and Treatment of Pressure Ulcers: Quick Reference Guide. Washington, DC: National Pressure Ulcer
Advisory Panel; 2009:22.

[Skriv text]
10. Bridel J. The epidemiology of pressure sores. Nurs Stand 1993;7:25-30.
11. Orsted H, Ohura T, Harding K. Pressure, Shear, Friction and Microclimate in Context . A consensus
document.. Wounds International, London, UK; 2010.
12. Lyne PA, Papanikolaou P, Lycett E. An empirical investigation of pressure ulcer risk factors. Nurs Stand
2000;14:46-8, 50, 53.
13. Lindgren M, Unosson M, Fredrikson M, et al. Immobility—a major risk factor for development of pressure
ulcers among adult hospitalized patients: a prospective study. Scand J Caring Sci 2004;18:57-64.
14. Defloor T, Grypdonck MF. Pressure ulcers: validation of two risk assessment scales. J Clin Nurs
2005;14:373-82.
15. Fogerty M, Abumrad N, Nanney L, et al. Risk factors for pressure ulcers in acute care hospitals. Wound
Repair Regen 2008;16:11-8.
16. Moore Z, Cowman S. Pressure ulcer prevalence and prevention practices in care of the older person in the
Republic of Ireland. J Clin Nurs 2012;21:362-71.
17. Flanagan M. Who is at risk of a pressure sore? A practical review of risk assessment systems. Prof Nurse
1995;10:305-8.
18. Fletcher R, Fletcher S. Clinical Epidemiology—The Essentials. 4th ed. Philadelphia, PA: Lippincott
Williams & Wilkins; 2005.
19. Altman D. Practical statistics for medical research. London, UK: Chapman & Hall; 1999.
20. Norton D, McLaren R, Exton-Smith AN. An Investigation of Geriatric Nursing Problems in Hospital. 3rd ed.
London, UK: Churchill Livingstone; 1979.
21. Norton D. Calculating the risk: reflections on the Norton scale. Decubitus 1989;2:24-31.
22. Ek AC. Prediction of pressure sore development. Scand J Caring Sci 1987;1:77-84.
23. Ek AC, Bjurulf P. Interrater variability in a modified Norton scale. Scand J Caring Sci 1987;1:99-102.
24. Healthcare HF. Modifierad Nortonskala [Trycksår]. Stockholm, Sweden: Inera AB; 2011.
25. Braden B, Bergstrom N. Predictive validity of the Braden scale for pressure sore risk in a nursing home
population. Res Nurs Health 1994;17:459-70.
26. Braden B, Bergstrom N. A conceptual schema for the study of the etiology of pressure sores. Rehabil Nurs
1987;12:8-12.

[Skriv text]
27. Ayello EA, Braden B. How and why to do pressure ulcer risk assessment. Adv Skin Wound Care
2002;15:125-31; quiz 132-3.
28. Lindgren M. Quality indicators for patients with or at risk of pressure ulcers. In: Idwall E, ed. Quality
Indicators for: Pain, Oral Health, Nutrition and Pressure Ulcers. Linköping, Sweden: Department of Medicine
and Care, Nursing Science, Linköping University; 2005.
29. Gunningberg L, Carlsson S, Willman A. EPUAP-protocol—a European method to survey pressure ulcers.
Vård i norden 2006;26:48-51(in Swedish)
30. Norton D. Calculating the risk: reflections on the Norton scale. 1989. Adv Wound Care 1996;9:38-42.
31. Halfens RJ, van Achterberg T, Bal RM. Validity and reliability of the Braden scale and the influence of other
risk factors: a multi-centre prospective study. Int J Nurs Stud 2000;37:313-9.
32. de Laat E. Critical Pressure - pressure ulcer care in critically ill patients and hospitalised patients at large
[thesis]. Nijmegen, the Netherlands: Radboud University; 2006.
33. Defloor T, Grypdonck MF. Validation of pressure ulcer risk assessment scales: a critique. J Adv Nurs
2004;48:613-21.
34. Ek AC, Unosson M, Larsson J, Von Schenck H, Bjurulf P. The development and healing of pressure sores
related to the nutritional state. Clin Nutr. 1991;10(5):245-50.35.
35. Goldstone L, Goldstone J. The Norton score: an early warning of pressure sores? J Adv Nurs 1982;7:419-26.
36. Pang SM, Wong TK. Predicting pressure sore risk with the Norton, Braden, and Waterlow scales in a Hong
Kong rehabilitation hospital. Nurs Res 1998;47:147-53.
37. Schoonhoven L, Haalboom JRE, Bousema MT, et al. Prospective cohort study of routine use of risk
assessment scales for prediction of pressure ulcers. BMJ 2002;325:1-5.
38. Jalali R, Rezaie M. Predicting pressure ulcer risk: comparing the predictive validity of 4 scales. Adv Skin
Wound Care 2005;18:92-7.
39. Gunningberg L. Implementation of risk assessment and classification of pressure ulcers as quality indicators
for patients with hip fractures. J Clin Nurs 1999;8:396-406.
40. Bergstrom N, Braden BJ, Laguzza A, et al. The Braden scale for predicting pressure sore risk. Nurs Res
1987;36:205-10.

[Skriv text]
41. Bergstrom N, Braden B, Kemp M, et al. Predicting pressure ulcer risk: a multisite study of the predictive
validity of the Braden scale. Nurs Res 1998;47:261-9.
42. Tannen A, Balzer K, Kottner J, et al. Diagnostic accuracy of two pressure ulcer risk scales and a generic
nursing assessment tool. A psychometric comparison. J Clin Nurs;19:1510-8.

1
Table 1. Describes the variables included in the Norton scale, modified Norton scale, Braden scale and RAPS
scale, and their point range in each variable and the scales maximum score
Variable Variable point
range
The Norton
scale a
The modified
Norton scale b
The Braden
scale c
The RAPS
scale d
General physical condition 1-4 X X X
Mental state 1-4 X X
Activity 1-4 X X X X
Mobility 1-4 X X X X
Food intake/nutritional status 1-4 X X X
Fluid intake 1-4 X X
Sensory perception 1-4 X X
Friction and shear 1-3 X X
Moisture/Incontinence 1-4 X X X X
Body temperature 1-4 X
S-albumin 1-4 (X)
Maximum score 20 28 23 39/35 a Norton et al. (1979);
b Ek et al. (1991);
c Braden & Bergstrom (1987);
d Lindgren et al. (2002) (39p with S-
albumin, 35p without S-albumin)
2
Table 2. Summary of a selection of previous studies regarding the Norton, modified Norton, Braden and the RAPS
scales with presentation of the; number of participants (n), clinical setting, the Area under the curve (AUC) value,
cut-off level with best balance between sensitivity and specificity, positive predictive value (PVP) and negative
predictive value (NPV) and the incidence or prevalence that the figures are based on. The reference list number is
present after each reference.
Scale /Reference n Clinical
setting
AUC Cut-off
score
Sensiti
-vity (%)
Specifi
-city
(%)
PVP
(%)
NPV
(%)
Incidence a or
prevalence b (%)
The Norton scale
Goldstone &
Goldstone 1982 1
40 Orthopaedic - ≤ 14 89 64 - - 45 a
Pang & Wong 1998 2 106 Medical-
Orthopaedic
- ≤ 16 81 59 33 93 20 a
Schoonhoven et al.
20023
2190
Hospital 0.56
≤ 15 46 60 7 94 11a
Defloor & Grypdonk
2005 4
1772 Long-term care 0.75
< 14 82 59 66 18 31 a
Jalali & Rezaie 2005 5 230 Hospital - ≤ 16 49 100 100 52 32 a
Balzer et al. 2007 6 542 Hospital - ≤ 16 76 75 - - 4.5 b
The modified Norton
scale
Ek 1987 (maximum
score 32) 7
515 Long-term care - ≤ 25 51 65 13 7.5 a
Ek (unpublished data) 501 Long-term care - ≤ 21 69 69 32 91 10 a
Gunningberg et al.
1999 (max. score 28) 8
81 Orthopaedic - ≤ 21 71 44 35 78 30 a
The Braden scale
Bergstrom et al. 1987 9 99/100 Medical-
Surgical
- ≤ 16 100/100 90/64 - - 7/9 a
Braden & Bergstrom
1994 10
102 Nursing home - ≤ 18 79 74 54 90 27 a
Bergstrom et al. 1998 843 Tertiary care - ≤ 16 38 92 31 94 8.5 a
11 Medical-
surgical
- ≤ 19 50 82 17 96 7 a
Long-term care - ≤ 18 74 60 37 88 24 a
Halfens et al. 2000 12 320 Hospital ≤ 20 73 70 15 a
Schoonhoven et al.
2002 3
2190 Hospital 0.55
≤ 16 44 68 8 95 11 a
Defloor & Grypdonk
2005 4
1772 Long-term care 0.77
< 18 83 58 66 17 31 a
Jalali & Rezaie 2005 5 320 Hospital - ≤ 16 53 100 100 58 2 a
Balzer et al. 2007 6 542 Hospital - ≤ 19 81 72 - - 4.5 b
Tannen et al. 201013 1053 Hospital 0.86 ≤ 18 85 74 - - - b
The RAPS scale
Lindgren et al. 2002
(maximum score 39) 14
488 Hospital (total
sample)
- ≤ 36 57 58 14 92 12 a
230 Medical - ≤ 31 75 70 19 97 9 a
258 Surgical - ≤ 38 68 60 20 92 13 a
76 Infections - ≤ 31 80 70 29 96 13 a
99 Orthopaedic - ≤ 37 70 70 41 88 23 a
Lindgren 2002
(maximum score 35)
(unpublished data)
488 Hospital - ≤ 29 78 70 32 12 a

3
Pressure ulcer No pressure ulcer
Classified as ’at
risk’ a b
Classified as
’not at risk’ c d
Figure 1. The template for calculation of sensitivity as a / (a + c),
specificity as d / (b + d), positive predictive value as a / (a + b) and
negative predictive value as d /(c + d)

4
Table 3. Characteristics of the participants
n = %
Age
≥ 70
216 62.0
65-69
38 11.1
≤ 64
89 25.9
Mobility
Chairfast
38 11.0
Bedridden
55 15.9
Incontinence
Urinary catheter user 67 22.2
Urinary incontinence 30 8.7
Faeces incontinence 28 8.1
Nutrition
Food intake 3/4 58 16.8
Food intake ≤ 1/2 100 31.6
Intravenously 29 4.0
Tube feeding 14 8.3
Ward
Surgery
85 24.6
Medicine
136 39.3
Orthopaedic 37 10.7
Oncology
18 5.2
Rehabilitation 70 20.2

5
Table 4. The area under curve estimation of the Norton scale, Modified Norton scale, Braden scale and the RAPS
scale and the sensitivity, specificity, PPV test, NPV test of the different risk assessment scales at various cut off
points.
Cut-off score n AUC Patients at
risk (%)
Sensitivity
(%)
Specificity
(%)
PPV (%) NPV
(%)
The Norton scale a
344 0.787
≤ 13 18.9 41.8 85.4 35.4 88.5
24.1 50.9 81.0 33.7 89.7
29.1 58.2 76.5 32.0 90.6
36.6 74.5 70.6 32.5 93.6
≤ 17 54.3 87.2 63.6 31.4 96.3
The Modified Norton b
342 0.791
17.0 40.7 87.5 37.9 88.7
23.4 51.9 81.9 35.0 90.1
28.4 59.3 77.4 33.0 91.0
33.3 74.1 74.3 35.1 93.9
38.9 77.8 68.4 31.6 94.3
The Braden scale c
344 0.787
25.3 54.5 80.3 34.5 90.3
29.4 61.8 76.8 33.7 91.4
34.0 74.5 73.7 35.0 93.8
40.7 81.8 67.1 32.1 95.1
50.3 87.3 56.7 27.7 95.9
The RAPS scale d
343 0.789
29.2 63.0 77.2 34.0 91.8
32.7 74.1 75.1 35.7 93.9
37.6 77.8 69.9 32.6 94.4
42.6 83.3 65.1 30.8 95.4
49.3 85.2 57.4 27.2 95.4 a Norton et al. (1979);
b Ek et al. (1991);
c Braden & Bergstrom (1987);
d Lindgren et al. (2002) (without S-
albumin)