prediction of soil water retention properties using pore-size distribution and porosity
TRANSCRIPT
ARTICLE
Prediction of soil water retention properties using pore-sizedistribution and porosityChristopher T.S. Beckett and Charles E. Augarde
Abstract: Several models have been suggested to link a soil's pore-size distribution to its retention properties. This paperpresents a method that builds on previous techniques by incorporating porosity and particles of different sizes, shapes, andseparation distances to predict soil water retention properties. Mechanisms are suggested for the determination of both themain drying and wetting paths, which incorporate an adsorbed water phase and retention hysteresis. Predicted results are thencompared with measured retention data to validate the model and to provide a foundation for discussing the validity andlimitations of using pore-size distributions to predict retention properties.
Key words: pore-size distribution, suction, cavitation.
Résumé : Plusieurs modèles ont été proposés pour relier la distribution de la taille des pores d’un sol a ses propriétés derétention. Cet article présente uneméthode bâtie a partir des techniques précédentes en incorporant la porosité et les particulesde différentes tailles, formes et distances de séparation, afin de prédire les propriétés de rétention d’eau du sol. Des mécanismessont suggérés pour la détermination des courbes principales en séchage et en mouillage qui considèrent une phase d’eauadsorbée et l’hystérésis en rétention. Les résultats prédits sont ensuite comparés a des données de rétention mesurées afin devalider le modèle et de fournir une base pour la discussion de la validité et des limitations de l’utilisation des distributions de lataille des pores pour prédire les propriétés de rétention. [Traduit par la Rédaction]
Mots-clés : distribution de la taille des pores, succion, cavitation.
IntroductionThe soil water retention curve is the relationship between suc-
tion and the water content (or degree of saturation) of an unsatu-rated soil and is a key factor in determining its behaviour (Nuthand Laloui, 2008; Gens 2010; Tarantino 2010). Suction arises due tothe formation of curved water menisci at the air–water interfaceswithin soil pores. The simplest example of this effect is the phe-nomenon of capillary rise, where water in a free reservoir willspontaneously rise to a height in a thin tube of radius, rtube. Thecorresponding suction, �, for a given height rise, h, is calculatedusing
[1] � � ua � uw � �h�wg � �2��
� �2� cos(�slv)
rtube
where ua and uw are the air andwater pressures, respectively, �w isthe density of water, g is gravitational acceleration, � is the air–water surface tension, �slv is the solid–liquid contact angle in thepresence of a vapour (in this case air). and � is themeniscus radiusof curvature. It is commonly assumed that �slv = 0, so that themeniscus curvature equals the tube radius, and that ua = 0. Thisphenomenon, although simplistic, nonetheless demonstrates thedirect link between suction and the size of the body (i.e., the pore)in which the water is held.
As the direct determination of a soil's retention properties canbe time-consuming or difficult, several models have been sug-gested to relate a soil's pore-size distribution (PSD) to its retentionproperties (Ghanbarian-Alavijeh and Liaghat 2009). The simplestof these is the “bundle of cylindrical capillaries” (BCC) model,
where each pore size is considered to be a capillary tube of acertain diameter, with suction calculated according to eq. [1](Millington and Quirk 1961; Mualem 1976). The disadvantage ofthe basic BCC model, however, is that pores are required to beeither completely filled or completely empty, so that the unsatu-rated soil effectively becomes a combination of a completely dryand a completely saturated material (Tuller and Or 2004; Bakerand Frydman 2009). Observations of water regimes in unsaturatedsoilsmade by Lourenço et al. (2012) using environmental scanningelectron microscopy (ESEM) show that water and air exist simul-taneously in a pore of a given size, with water occupying both abulk and an adsorbed phase. Adsorption is the mechanismwhereby water molecules readily adhere to the surfaces of soilparticles due to short-range solid–water interaction mechanisms(including van der Waals attractions, exchangeable cation hydra-tion, and electrical field polarization) (Philip 1977; Derjaguin et al.1987; Lu and Likos 2004). The presence of adsorbed films in cylin-drical pores was considered by Schull (1948) for correcting ob-tained PSD data from nitrogen adsorption techniques (forexample the BETmethod) and by Collet et al. (2008) for predictingPSDs of hemp-based materials from retention properties deter-mined using vapour-equilibrium, however these works did notthen go on to use measured PSDs to predict retention properties.
A more advanced model for predicting retention propertiesthat incorporates both bulk and adsorbed water regimes was sug-gested by Tuller et al. (1999), wherein pore spaces were assumed tobe angular voids joined by narrow slits, as shown in Fig. 1. Thebulk and adsorbed phases were separated for ease of calculationintomenisci present in the pore corners and adsorbed films in thenarrow slits. The disadvantage of this model, however, is that
Received 30 August 2012. Accepted 3 December 2012.
C.T.S. Beckett. School of Civil & Resource Engineering, University of Western Australia, Perth, WA 6009, Australia.C.E. Augarde. School of Engineering and Computing Sciences, Durham University, Durham, DH1 3LE, UK.
Corresponding author: Christopher T.S. Beckett (e-mail: [email protected]).
Pagination not final/Pagination non finale
1
Can. Geotech. J. 50: 1–16 (2013) dx.doi.org/10.1139/cgj-2012-0320 Published at www.nrcresearchpress.com/cgj on xx xx xxxx.
Can
. Geo
tech
. J. D
ownl
oade
d fr
om w
ww
.nrc
rese
arch
pres
s.co
m b
y M
onas
h U
nive
rsity
on
04/1
9/13
For
pers
onal
use
onl
y.

calculations are dependent on the “angularity factor” of the pores,which is information not usually available (Baker and Frydman2009).
An improvement to themodel suggested by Tuller et al. (1999) isto consider the geometry and arrangement of soil particles sur-rounding the pore space as well as the water regime. An exampleof a water meniscus suspended between two granular soil parti-cles is shown in Fig. 2, along with adsorbed films of exaggeratedthickness. A meniscus suspended between two particles has bothconcave and convex curvatures in the meridional and azimuthaldirections, respectively, properties that are not possible in themodel of Tuller et al. (1999) due to the columnar pore assumption(Butt 2008). Although the shapes of granular particles are compli-cated, simplifying them allows suctions generated in the sus-pended menisci to be calculated. Lu and Likos (2004), Mayer andStowe (2006), Grof et al. (2008), and Likos (2009) suggested modelswherein granular particles are assumed to be spherical and incontact, with toroidal menisci suspended between particles ofequal size. These assumptions allow suction to be calculated via
[2] � � �( 1� �1l )
where � and l are the meridional and azimuthal radii, respec-tively, and are each functions of particle size (these functions willbe discussed in a later section) and pore size is assumed to be thediameter of the interstitial sphere, as shown in Fig. 3. Water isassumed to exist either in bulk or as menisci suspended betweenparticles and, in the case of Likos (2009), in the form of thin filmsadsorbed onto the particle surfaces. This paper aims to improveon these models by assuming a more realistic arrangement of soilparticles that accounts for material porosity, whilst retaining theeffect of adsorbed water on the SWRC introduced in Tuller et al.(1999) and Likos (2009). Predictions made using the model arethen compared with measured data to investigate the limitationspresent when predicting retention properties using PSD data.
Soil skeleton approximations
Particle shapeAs suction is determined by the shapes of menisci suspended
between soil particles, it is important to consider particle shapesthat can reproduce the retention properties of pores of varyingsizes. A method to determine the suitability of an approximationto a particle shape is to consider the assumed particle's specificsurface area (SSA). Figure 4 shows calculated SSA values for differ-ent particle sizes as compared withmeasured data, where the SSAof a spherical particle is calculated via
[3] SSAsphere �4�R2
43
�R3��
3�R
where � is the particle density, assumed to be 2650 kg/m3, and therange of particle radius, R, values used is as given in Table 1.Although the spherical particle assumption closelymatches thoseSSA values measured for larger particles (≥silts), Fig. 4 shows thatit fails to capture the higher SSA values of clay particles, so thatsuctions predicted for pores surrounded by these particles willsuggestibly not be representative of the real material (Iwamatsuand Horii 1996). Instead, works of previous authors (for example,Hattab and Fleureau (2010) indicate that these particles might bemore appropriately modelled as being cuboidal in shape (Fig. 5).The SSA of such a cuboidal particle can be calculated using
[4] SSAcuboid �L2(2 4)
L3��
2(1 2)L�
where L and (the particle side length and height-to-length ratio,respectively) are as given in Table 1 and are dependent on claymineralogy (Powrie 2008). Note that these are the SSA values forindividual particles only, i.e., no particle–particle contact area is
Fig. 1. Examples of pore shapes considered in Tuller et al. (1999),showing decreasing angularity.
Fig. 2. Water meniscus and adsorbed films between two examplegranular particles.
Fig. 3. Interstitial pore space between cubically packed sphericalparticles. 2-D, two-dimensional.
Pagination not final/Pagination non finale
2 Can. Geotech. J. Vol. 50, 2013
Published by NRC Research Press
Can
. Geo
tech
. J. D
ownl
oade
d fr
om w
ww
.nrc
rese
arch
pres
s.co
m b
y M
onas
h U
nive
rsity
on
04/1
9/13
For
pers
onal
use
onl
y.
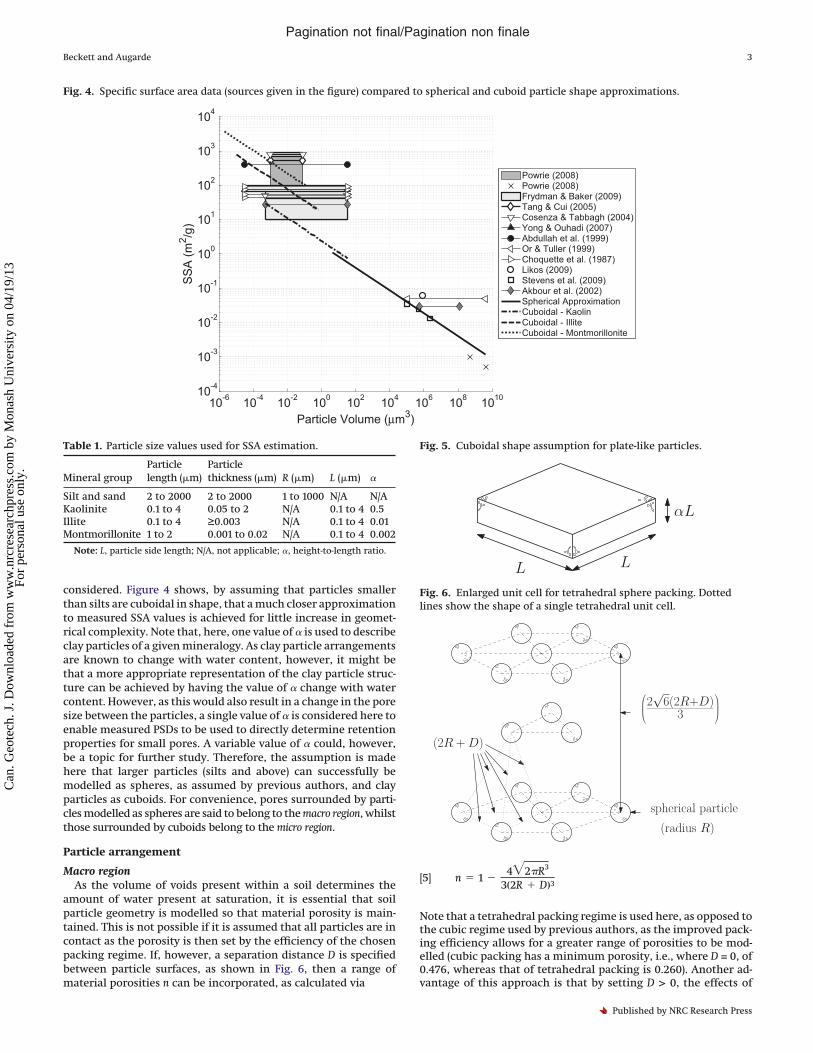
considered. Figure 4 shows, by assuming that particles smallerthan silts are cuboidal in shape, that amuch closer approximationto measured SSA values is achieved for little increase in geomet-rical complexity. Note that, here, one value of is used to describeclay particles of a givenmineralogy. As clay particle arrangementsare known to change with water content, however, it might bethat a more appropriate representation of the clay particle struc-ture can be achieved by having the value of change with watercontent. However, as this would also result in a change in the poresize between the particles, a single value of is considered here toenable measured PSDs to be used to directly determine retentionproperties for small pores. A variable value of could, however,be a topic for further study. Therefore, the assumption is madehere that larger particles (silts and above) can successfully bemodelled as spheres, as assumed by previous authors, and clayparticles as cuboids. For convenience, pores surrounded by parti-clesmodelled as spheres are said to belong to themacro region, whilstthose surrounded by cuboids belong to themicro region.
Particle arrangement
Macro regionAs the volume of voids present within a soil determines the
amount of water present at saturation, it is essential that soilparticle geometry is modelled so that material porosity is main-tained. This is not possible if it is assumed that all particles are incontact as the porosity is then set by the efficiency of the chosenpacking regime. If, however, a separation distance D is specifiedbetween particle surfaces, as shown in Fig. 6, then a range ofmaterial porosities n can be incorporated, as calculated via
[5] n � 1 �4�2�R3
3(2R D)3
Note that a tetrahedral packing regime is used here, as opposed tothe cubic regime used by previous authors, as the improved pack-ing efficiency allows for a greater range of porosities to be mod-elled (cubic packing has a minimum porosity, i.e., where D = 0, of0.476, whereas that of tetrahedral packing is 0.260). Another ad-vantage of this approach is that by setting D > 0, the effects of
Fig. 4. Specific surface area data (sources given in the figure) compared to spherical and cuboid particle shape approximations.
Table 1. Particle size values used for SSA estimation.
Mineral groupParticlelength (�m)
Particlethickness (�m) R (�m) L (�m)
Silt and sand 2 to 2000 2 to 2000 1 to 1000 N/A N/AKaolinite 0.1 to 4 0.05 to 2 N/A 0.1 to 4 0.5Illite 0.1 to 4 ≥0.003 N/A 0.1 to 4 0.01Montmorillonite 1 to 2 0.001 to 0.02 N/A 0.1 to 4 0.002
Note: L, particle side length; N/A, not applicable; , height-to-length ratio.
Fig. 5. Cuboidal shape assumption for plate-like particles.
Fig. 6. Enlarged unit cell for tetrahedral sphere packing. Dottedlines show the shape of a single tetrahedral unit cell.
Pagination not final/Pagination non finale
Beckett and Augarde 3
Published by NRC Research Press
Can
. Geo
tech
. J. D
ownl
oade
d fr
om w
ww
.nrc
rese
arch
pres
s.co
m b
y M
onas
h U
nive
rsity
on
04/1
9/13
For
pers
onal
use
onl
y.

particle surface asperities, which would impede contact duringpacking, can also be incorporated, so that results for smooth-surfaced particles can be related to those for real, rough-surfacedmaterials (Molenkamp and Nazemi 2003; Butt 2008). As for previ-ousmodels, it is assumed thatmenisci all reside between particlesof equal size for a given pore size to maintain the simple packinggeometries shown in Fig. 6. Although a simplification, as menisciin real soils are likely to reside between dissimilarly sized parti-cles, an effective particle radius (R* = R1R2/(R1 + R2) where R1 and R2are the radii of the two subtending particles) must then be used todetermine that meniscus' retention properties, so that, in effect,the calculation still considers menisci between equal-sized parti-cles. Therefore, the assumption that menisci reside betweenequal-sized particles is only suggestibly justified.
Given the required porosity, interstitial pore size r can be foundusing
[6] r � R��62
� 1� �64
D
so that R andD can be solved using eqs. [5] and [6], for a given valueof r from the PSD. As a result of this approach, particle gradingand porosity are linked via
[7] Vs(R) � Vv(r)( 1n � 1)
where Vs(R) is the volume of solids of particle size R and Vv(r) is thevolume of voids of radius r, so that the PSD and modelled particlegrading are simple transformations of each other. It should benoted, however, that it is not the objective of this model to accu-rately predict the material particle grading, but rather to modelan arrangement of particles surrounding the pores that gives riseto similar retention properties as seen in real materials.
Pore interconnectivity is discussed in Haines (1930), who sug-gested that porous media contain two pore types, namely cavitiesand throats, with large cavities being separated and connected bythe much narrower throats. This structure results in hysteresisbetween wetting and drying water contents on a change in suc-tion, as drying is controlled by the emptying of the narrow throats(i.e., at high suctions), whereas wetting is controlled by the fillingof the larger cavities (i.e., at lower suctions) (Everett 1967; Rojaset al. 2010). However, by considering pores to be in isolation,hysteresis of the wetting and drying retention properties can nolonger be considered in this manner. This is a necessary simplifi-cation, however, as the modelling of a connected pore networkwould be computationally unfeasible. Instead, hysteresis is intro-duced by considering different wetting and drying mechanisms,based solely on the modelled geometry of the individual pore;these mechanisms will be discussed in the following sections.
Micro regionCuboid particles are assumed to be stacked one on top of the
other, with pore spaces in between, so that the unit cell comprisesa single pore flanked by two particles of half width (i.e., L/2) asshown in Fig. 7. Therefore, the porosity of the micro region iscontrolled bymineralogy only. Although thismight be considereda shortfall of the model, porosity is a global value and is notrepresentative of the void ratio at different scales (i.e., local fluc-tuations are not considered). The lack of a consideration of poros-ity in the micro region is therefore arguably justifiable whenconsidering overall material retention properties.
Main drying path calculations
CavitationWater under an applied suction is in a metastable state, in that
it remains in liquid form despite pressures being lower than itsvapour pressure (Or and Tuller 2002). Cavitation is the process ofthe formation and subsequent expansion of vapour bubbleswithin a liquid on a change in liquid pressure (Young 1989). Ho-mogeneous cavitation (also called homogeneous nucleation) isthe formation of cavities (bubbles) of pure liquid vapour in thesurrounding liquid. If it is assumed that random thermal motionof the water molecules leads to the formation of a spherical cavitybetween them of a diameter equal to the minimum distance be-tween water molecules in liquid water (0.35 nm), then the subse-quent liquid pressure required for equilibrium can be found usingeq. [1]
[8] uw � ua �2��
� 2.3 kPa �0.1454
0.175 × 10�6� �830.6 MPa
where � has been calculated using � = 0.1171 − 0.0001516T, where Tis the absolute temperature, set to 293 K, and ua = 2.3 kPa is thevapour pressure of water at 293 K (Edlefsen and Anderson 1943;Marinho et al. 2008). This suction value, however, is rarelyachieved in experiments due to heterogeneous cavitation, namelythe formation of bubbles of dissolved gas that vaporizes at signif-icantly lower suctions. Cavitation of liquids containing dissolvedgases was discussed in Or and Tuller (2002), who suggested thatthe energy required (�E) to form a bubble of radius r in a liquid canbe calculated from the sum of the interfacial energy of the bubblesurface and the opposing work done by the fluid on the volume ofthe resulting bubble according to
[9] �E � 4�r2� �4�3r3�
which has a minimum at
[10] �E r
� r∗ �2��
so that r∗ is the minimum bubble radius required in order for thecreation of a bubble to be energetically favourable and � is thecorresponding cavitation suction. The pressure equilibrium be-tween the gas in the bubble and the surrounding fluid can then bedetermined via the Kelvin equation
Fig. 7. Cuboidal particle unit cell (assumed example water menisciprofiles also shown).
Pagination not final/Pagination non finale
4 Can. Geotech. J. Vol. 50, 2013
Published by NRC Research Press
Can
. Geo
tech
. J. D
ownl
oade
d fr
om w
ww
.nrc
rese
arch
pres
s.co
m b
y M
onas
h U
nive
rsity
on
04/1
9/13
For
pers
onal
use
onl
y.
[11] � �RuT
vmlog� p
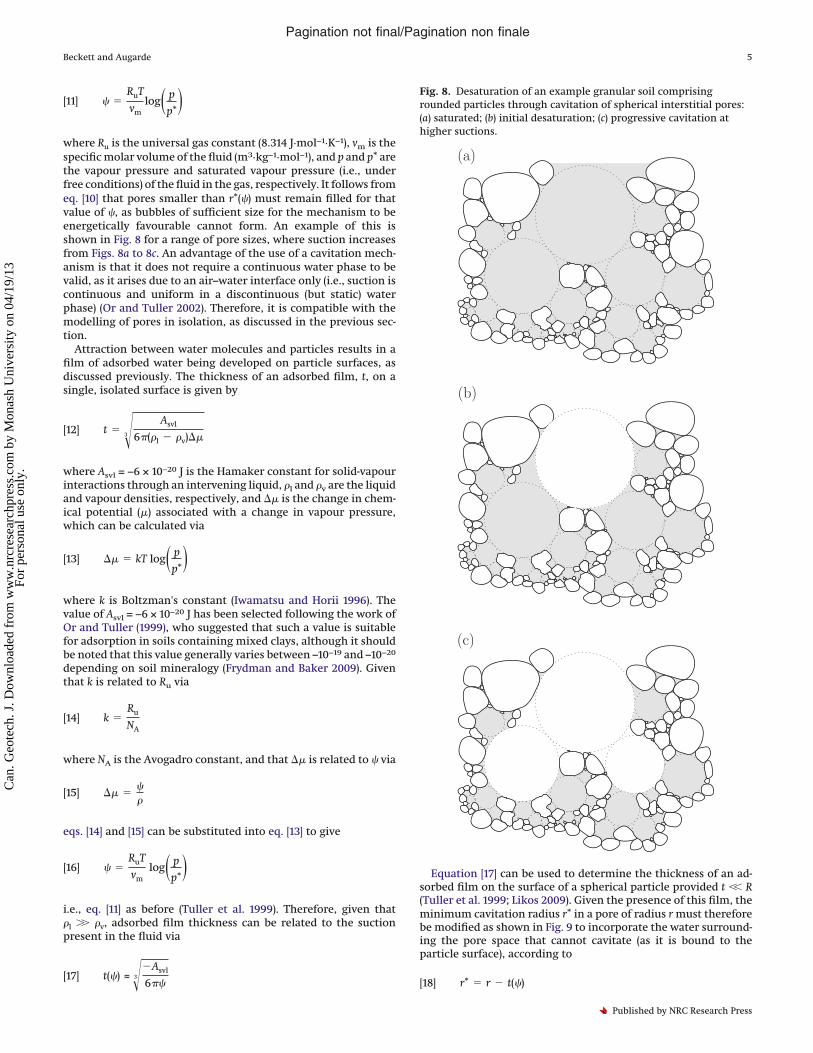
p∗�where Ru is the universal gas constant (8.314 J·mol−1·K−1), vm is thespecificmolar volume of the fluid (m3·kg−1·mol−1), and p and p∗ arethe vapour pressure and saturated vapour pressure (i.e., underfree conditions) of the fluid in the gas, respectively. It follows fromeq. [10] that pores smaller than r∗(�) must remain filled for thatvalue of �, as bubbles of sufficient size for the mechanism to beenergetically favourable cannot form. An example of this isshown in Fig. 8 for a range of pore sizes, where suction increasesfrom Figs. 8a to 8c. An advantage of the use of a cavitation mech-anism is that it does not require a continuous water phase to bevalid, as it arises due to an air–water interface only (i.e., suction iscontinuous and uniform in a discontinuous (but static) waterphase) (Or and Tuller 2002). Therefore, it is compatible with themodelling of pores in isolation, as discussed in the previous sec-tion.
Attraction between water molecules and particles results in afilm of adsorbed water being developed on particle surfaces, asdiscussed previously. The thickness of an adsorbed film, t, on asingle, isolated surface is given by
[12] t � 3� Asvl
6�(�l � �v)��
where Asvl = −6 × 10⁻²⁰ J is the Hamaker constant for solid-vapourinteractions through an intervening liquid, �l and �v are the liquidand vapour densities, respectively, and �� is the change in chem-ical potential (�) associated with a change in vapour pressure,which can be calculated via
[13] �� � kT log� p
p∗�where k is Boltzman's constant (Iwamatsu and Horii 1996). Thevalue of Asvl = −6 × 10⁻²⁰ J has been selected following the work ofOr and Tuller (1999), who suggested that such a value is suitablefor adsorption in soils containing mixed clays, although it shouldbe noted that this value generally varies between –10−19 and –10−20
depending on soil mineralogy (Frydman and Baker 2009). Giventhat k is related to Ru via
[14] k �Ru
NA
where NA is the Avogadro constant, and that �� is related to � via
[15] �� ���
eqs. [14] and [15] can be substituted into eq. [13] to give
[16] � �RuT
vmlog� p
p∗�i.e., eq. [11] as before (Tuller et al. 1999). Therefore, given that�l �� �v, adsorbed film thickness can be related to the suctionpresent in the fluid via
[17] t(�) ≈ 3��Asvl
6��
Equation [17] can be used to determine the thickness of an ad-sorbed film on the surface of a spherical particle provided t �� R(Tuller et al. 1999; Likos 2009). Given the presence of this film, theminimum cavitation radius r∗ in a pore of radius rmust thereforebe modified as shown in Fig. 9 to incorporate the water surround-ing the pore space that cannot cavitate (as it is bound to theparticle surface), according to
[18] r∗ � r � t(�)
Fig. 8. Desaturation of an example granular soil comprisingrounded particles through cavitation of spherical interstitial pores:(a) saturated; (b) initial desaturation; (c) progressive cavitation athigher suctions.
Pagination not final/Pagination non finale
Beckett and Augarde 5
Published by NRC Research Press
Can
. Geo
tech
. J. D
ownl
oade
d fr
om w
ww
.nrc
rese
arch
pres
s.co
m b
y M
onas
h U
nive
rsity
on
04/1
9/13
For
pers
onal
use
onl
y.

so that the cavitation suction � for that pore size r can then befound using eq. [10] (Schull 1948; Collet et al. 2008).
Although it is assumed above that adsorbedwater is in the formof thin films covering particle surfaces, it was shown in Lourençoet al. (2012) that water exists instead on the surface of roughgranular particles in the form of droplets. Results presented inLourenço et al. (2012) also suggest, however, that successive wet-ting and drying cycles result in a coalescence of these surfacedroplets, so that they progressively becomemore film-like. As it isassumed here that materials are first dried from a saturated state,it is therefore likely that water will remain in continuous films onparticle surfaces rather than as discontinuous bodies, so that theuse of films to represent adsorbed water is suggestibly justified.However, the effect of surface droplets on the retention proper-ties of granular particles andmethods to predict their shapes is aninteresting topic of ongoing research.
Cavitation and adsorption in slit-shaped poresA water meniscus trapped between two cuboidal particles is
shown in Fig. 7 and in more detail in Fig. 10. The thickness ofadsorbed water films in a slit-shaped pore, tss, at a given suction �is given by
[19] � � �Asvl
6�[2r � tss(�)]3
Allv
48�[r � tss(�)]3�
Asvl
6�tss(�)3
where r is the pore radius (given by the PSD) and Allv = 3.7 × 10⁻²⁰
J is the Hamaker constant for liquid–liquid interactions throughan intervening vapour (Iwamatsu and Horii 1996). Note that eq.[19] has been converted from the original expression given inIwamatsu and Horii (1996) to be in terms of �, as discussed in theprevious section. The suction required to cavitate the pore is givenby eqs. [10] and [18] as
[20] � �2�
r∗�
2�
[r � tss(�)]
so that eqs. [19] and [20] can be solved to find tss(�), and so �. Filmsof thickness tss(�) remain adsorbed to the surfaces of the slit-shaped pore after the pore has cavitated (Schull 1948).
Main wetting path calculations
Liquid bridgesCavitation of the water contained within a pore results in the
formation ofmenisci, often referred to as liquid bridges due to theirshape, suspended between the surrounding soil particles. On re-wetting, those liquid bridges expand up to the point that their
boundaries touch, whereupon the pore fills with water (Likos2009). Suction in the liquid bridges is given by eq. [2], where � andl are the meridional and azimuthal radii given by
[21] � �2Rmod[1 � cos(�)] Dmod
2cos(�slv �)
[22] l � Rmodsin(�) � �[1 � sin(�slv �)]
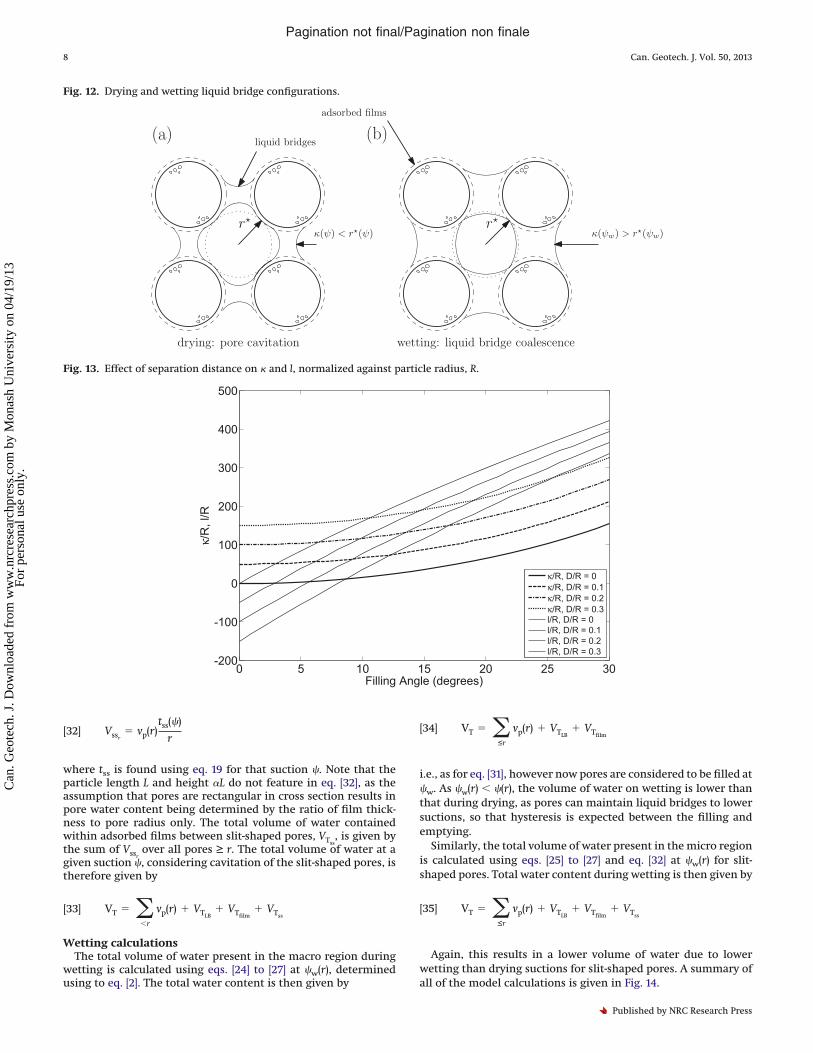
where Rmod = R + 2t(�w) and Dmod = D − 2t(�w) (t(�w) is found usingeq. [17]), and� is the filling angle, as shown in Fig. 11. Suction in theliquid bridge given by eq. [2] is now termed �w as it is to be used todetermine wetting suctions. At the moment of cavitation, suctionin the liquid bridge is equal to the cavitation suction � as calcu-lated using eq. [10], so that it can readily be shown from eqs. [17],[18], [10], and [2] that � � r∗, as shown in Fig. 12a for cubicallypacked spheres (for ease of demonstration). A reduction in suctionimmediately following cavitation therefore does not result in theimmediate filling of the pore space, as individual liquid bridgesare not in contact, but instead a gradual growth in liquid bridgevolume with reducing suction until the point at which they co-alesce. Liquid bridge coalescence occurs at � = 30° for tetrahe-drally packed spheres, assuming that �slv = 0, so that the suction atcoalescence can be found for a given value of r, R, and D using eq.[2] (Likos 2009). It should be noted that �slv = 0 for wetting anddrying due to the presence of adsorbed films on the smooth par-ticle surfaces, which are therefore perfectly wetting (Lourençoet al. 2012). Hysteresis between wetting and drying suctions isoften attributed to different wetting and drying �slv values, due toassumed “advancing” and “retreating” conditions, respectively(Haines 1930; Lourenço et al. 2012); however, by incorporatingdifferent mechanisms for wetting and drying (i.e., meniscus coales-cence and cavitation, respectively), this model is therefore also ableto include suction hysteresis despite the �slv = 0 restriction.
If D > 0, it is possible that � ≥ l for some values of �, as shown inFig. 13. This condition is undefined, as the geometry shown inFig. 11 cannot be maintained. It is therefore assumed that if thecondition � ≥ l is met for a given pore size, the liquid bridgessurrounding that pore rupture, so that only adsorbed water re-mains. � ≥ l is also possible if too high a value of n is selected, asthis results in high values of D and so a “stretching” of the liquidbridge geometry occurs. The maximum porosity that can be sup-ported by the assumed tetrahedral geometry can be determinedby setting � = l and solving between eqs. [21], [22], and [5], resultingin nmax = 0.519, so thatmaterials of porosities 0.276 ≤ n ≤ 0.519 canbe modelled using tetrahedral packing.
Filling of slit-shaped poresThe suction below which a slit-shaped pore will fill is given by
[23] �w � �1
2[r � t(�w)]
× � Asvl
6�t(�w)2
Allv
48�[r � t(�w)]2�
Asvl
6�[2r � t(�w)]2� 2��
where t(�w) is found using eq. [17] (as bulk and adsorbed waterphases are not interacting, so that eq. [19] is not required). Again,eq. [23] has been converted from the original Iwamatsu and Horii(1996) expression to be in terms of �w.
Water content calculations
Drying of macro region poresPores between spherical particles are either filled or occupied
by adsorbed films and liquid bridges (unless they have ruptured),depending on the applied suction and pore size. The volume of
Fig. 9. Reduced cavitation radius due to adsorbed films.
Pagination not final/Pagination non finale
6 Can. Geotech. J. Vol. 50, 2013
Published by NRC Research Press
Can
. Geo
tech
. J. D
ownl
oade
d fr
om w
ww
.nrc
rese
arch
pres
s.co
m b
y M
onas
h U
nive
rsity
on
04/1
9/13
For
pers
onal
use
onl
y.

water in filled pores of size r can be found directly from the soilPSD, given by the cumulative volume of pores of that size. Thevolume of water contained in a liquid bridge immediately follow-ing cavitation, VLB, is given by
[24] VLB � �Rmod� �4�2c2 � �Dmod � 2t[�(r)]�2�
[25] c �cos(�slv �) cos �slv
2
where Rmod� � Rmod/2 and t[�(r)] is as found using eq. [17]. �, �, and
l are found using eqs. [2], [21], and [22] for a given value of �(r). Notethat although eqs. [24] and [25] refer to liquid bridges, the cavita-tion suction � and not the coalescence suction �w is used forvolume determination in this case as conditions are for drying.Cavitation leads to the formation of [6 × (1/2)] + [6 × (1/4)] + 9 = 27liquid bridges in the enlarged tetrahedral cell (Fig. 6), so that thevolume of water contained within the liquid bridges, expressed asthe ratio of water volume in the liquid bridges, VLBcell
, to volume ofvoids in the cell, Vvcell
, is given by
[26] �VLBcell
Vvcell�tet
�27VLB
3�2(2R D)3 � 8�R3
Note that Rmod and Dmod are not required in eq. [26] due to theuse of the volume of voids for the total unit cell. The correspond-ing water content for liquid bridges surrounding all pores of sizer is therefore given by
[27] VLBr� vp(r)�VLBcell
Vvcell�
where vp(r) is the volume of pores of size r, found from the soil PSD.As liquid bridges can be present above the cavitation suction,
the total volume of water contained within all liquid bridges, VTLB,
is found by summing VLBrover all pore sizes ≥ r, all determined at
suction �(r) (i.e., the currently considered cavitation suction), not-ing that VLBr
can equal 0 if the applied suction is too high for thatpore geometry (i.e., the liquid bridges have ruptured).
The volume of water contained in an adsorbed film surround-ing a particle of radius R is given by
[28] Vfilm � 4�R2t[�(r)]
The total surface area for adsorption is [12 × (1/6)] + [2 × (1/2)] + 3 = 6spheres in the expanded tetrahedral unit cell, so that the total vol-umeof adsorbedwater in the unit cell expressed as the ratio ofwatervolume in the adsorbed films, Vfilmcell
, to volume of voids is given by
[29] �Vfilmcell
Vvcell�tet
�6Vfilm
3�2(2R D)3 � 8�R3
so that
[30] Vfilmr� vp(r)�Vfilmcell
Vvcell�
gives the adsorbed water content for all pores of that pore radius.Again, the total volume of water contained within adsorbed films,VTfilm
, is given by the sum of Vfilmrover pore sizes ≥ r. The total
volume of water present in the soil at a given drying suction � istherefore given by
[31] VT � �r
vp(r) VTLB VTfilm
Drying of micro region poresIt is assumed that slit-shaped pores of size r remain filled at
suctions below �(r), so that the water content of filled pores isagain given by vp(r). The total volume of water remaining in aslit-shaped pore of size r after cavitation is given by
Fig. 10. Cavitation in a slit-shaped pore containing two adsorbed films.
Fig. 11. Liquid bridge parameters.
Pagination not final/Pagination non finale
Beckett and Augarde 7
Published by NRC Research Press
Can
. Geo
tech
. J. D
ownl
oade
d fr
om w
ww
.nrc
rese
arch
pres
s.co
m b
y M
onas
h U
nive
rsity
on
04/1
9/13
For
pers
onal
use
onl
y.
[32] Vssr� vp(r)
tss(�)
r
where tss is found using eq. 19 for that suction �. Note that theparticle length L and height L do not feature in eq. [32], as theassumption that pores are rectangular in cross section results inpore water content being determined by the ratio of film thick-ness to pore radius only. The total volume of water containedwithin adsorbed films between slit-shaped pores, VTss
, is given bythe sum of Vssr
over all pores ≥ r. The total volume of water at agiven suction �, considering cavitation of the slit-shaped pores, istherefore given by
[33] VT � �r
vp(r) VTLB VTfilm
VTss
Wetting calculationsThe total volume of water present in the macro region during
wetting is calculated using eqs. [24] to [27] at �w(r), determinedusing to eq. [2]. The total water content is then given by
[34] VT � ≤r
vp(r) VTLB VTfilm
i.e., as for eq. [31], however now pores are considered to be filled at�w. As �w(r) � �(r), the volume of water on wetting is lower thanthat during drying, as pores can maintain liquid bridges to lowersuctions, so that hysteresis is expected between the filling andemptying.
Similarly, the total volume of water present in themicro regionis calculated using eqs. [25] to [27] and eq. [32] at �w(r) for slit-shaped pores. Total water content during wetting is then given by
[35] VT � ≤r
vp(r) VTLB VTfilm
VTss
Again, this results in a lower volume of water due to lowerwetting than drying suctions for slit-shaped pores. A summary ofall of the model calculations is given in Fig. 14.
Fig. 12. Drying and wetting liquid bridge configurations.
Fig. 13. Effect of separation distance on � and l, normalized against particle radius, R.
Pagination not final/Pagination non finale
8 Can. Geotech. J. Vol. 50, 2013
Published by NRC Research Press
Can
. Geo
tech
. J. D
ownl
oade
d fr
om w
ww
.nrc
rese
arch
pres
s.co
m b
y M
onas
h U
nive
rsity
on
04/1
9/13
For
pers
onal
use
onl
y.
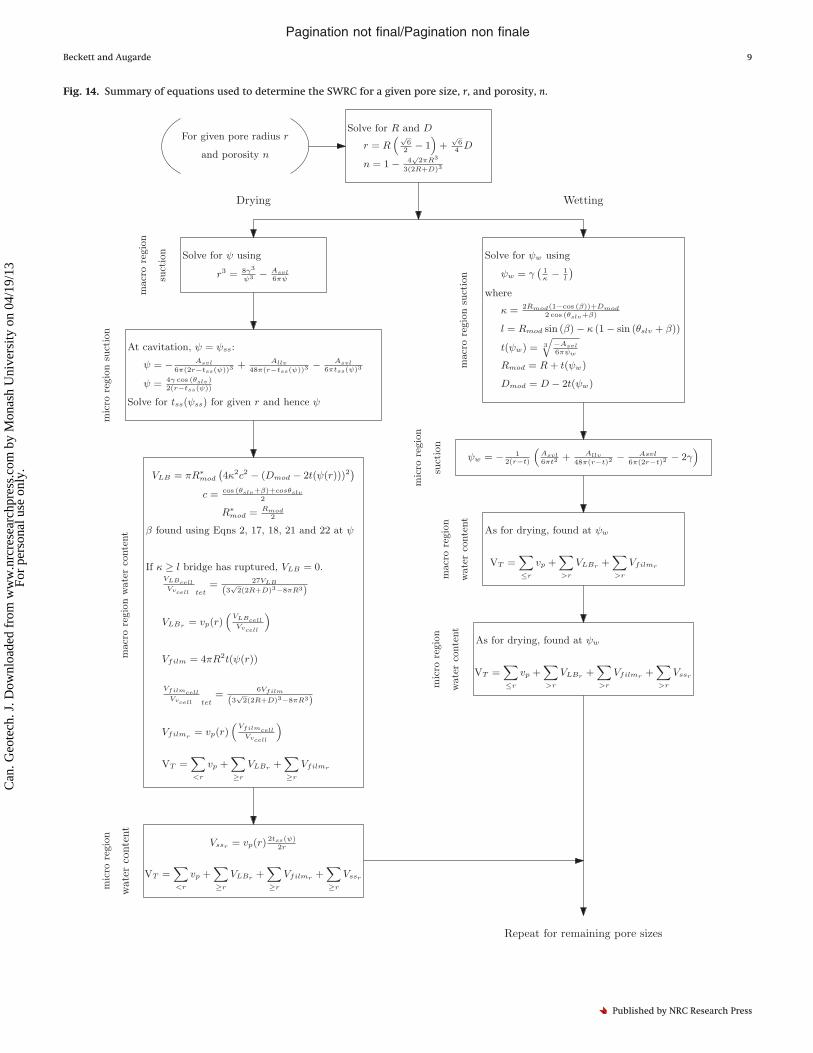
Fig. 14. Summary of equations used to determine the SWRC for a given pore size, r, and porosity, n.
Pagination not final/Pagination non finale
Beckett and Augarde 9
Published by NRC Research Press
Can
. Geo
tech
. J. D
ownl
oade
d fr
om w
ww
.nrc
rese
arch
pres
s.co
m b
y M
onas
h U
nive
rsity
on
04/1
9/13
For
pers
onal
use
onl
y.

Model performance and discussion
Soil-water retention curve predictionSoil-water retention curves (SWRCs) for five colluvial soils
formed from a naturally decomposed granitic soil were presentedin Zhang and Li (2010), as well as corresponding PSDs for thosesoils under zero applied suction as shown in Fig. 15 (soil classifi-cation in accordance with ASTM (2006)). Mercury intrusion poro-simetry (MIP) was used to determine soil PSDs using freeze-driedsamples (Penumadu and Dean 2000). Material was as used forSWRC analysis, but was sieved to pass 10 mm due to the size limitonMIP samples (15 cm3 for the device used). Modified and originalparticle grading curves for each soil are shown in Fig. 16, indicat-ing that whilst the grading of soil CL was unchanged by this pro-
cess, the grading of the remaining soils changed considerably dueto particle removal. Compacted densities were modified to ac-count for the removed material, so that the final densities of theMIP and SWRC test samples, and thus their resulting pore struc-tures, were comparable. A disadvantage of usingMIP to determinePSDs is that the range of pore sizes accessible is dependent on thepressure range of the apparatus. PSDs found by Zhang and Li(2010) for compacted and saturated samples (selected because thisis the starting condition for experimental SWRC analysis) identi-fied pore diameters between 6 nm and 146 �mand results suggestthat no pores smaller than 6 nm were present in any of the sam-ples, which is consistent with the larger pores expected in kaoli-nitic clays (Diamond 1970). Only soil GW-GM showed a significantvolume of pores larger than 146 �m.
Fig. 15. Pore-size distributions for five colluvial soil types post-compaction and saturation (Zhang and Li 2010).
Fig. 16. Particle grading curves for soils tested in Zhang and Li (2010).
Pagination not final/Pagination non finale
10 Can. Geotech. J. Vol. 50, 2013
Published by NRC Research Press
Can
. Geo
tech
. J. D
ownl
oade
d fr
om w
ww
.nrc
rese
arch
pres
s.co
m b
y M
onas
h U
nive
rsity
on
04/1
9/13
For
pers
onal
use
onl
y.

SWRCs predicted from those PSDs shown in Fig. 15 are shown inFigs. 17 to 21. A summary of the model input and output data (forthe main drying curves only) is given in Table 2. Approximationsto the SWRC made using eq. [1] (which are identical to those pre-dicted in Zhang and Li (2010)) are also shown in Figs. 17 to 21,showing that, whilst similar, the model developed here predictshigher suctions for a given water content; this is due to the effec-tive reduction in pore size owing to the presence of adsorbedfilms, as shown by eq. [18]. Note that although it is usual to showSWRCs in terms of degree of saturation, it is not possible in thiscase due to the use of different sample sizes between SWRC andPSD testing; the use of gravimetric water content removes thisrestriction. Figures 17 to 21 also show predicted main wettingcurves and adsorbed water contents for each PSD shown in Fig. 15.
Unfortunately, PSDs were not determined in Zhang and Li (2010)for wetting conditions, so that those main wetting curves shownin Figs. 17 to 21, calculated using drying PSDs, are illustrative ofthe model's ability to predict hysteresis between drying and wet-ting only. Similarly, adsorbed water contents were not measuredin Zhang and Li (2010), so that those adsorbed water contentsshown are also only indicative of how adsorbed water contentmight change with overall water content and suction. Confirma-tion of predictedwetting retention properties and adsorbedwatercontents is a topic of ongoing study.
Figures 17 to 21 indicate that the best match to measured datawas achieved for soil CL; this is suggestibly due to the use ofidentical material during SWRC and PSD testing, as shown inFig. 16, unlike those used for the other soil types. However, they
Fig. 17. Predicted SWRCs for soil CL. AWC, average water content.
Fig. 18. Predicted SWRCs for soil GW-GM.
Pagination not final/Pagination non finale
Beckett and Augarde 11
Published by NRC Research Press
Can
. Geo
tech
. J. D
ownl
oade
d fr
om w
ww
.nrc
rese
arch
pres
s.co
m b
y M
onas
h U
nive
rsity
on
04/1
9/13
For
pers
onal
use
onl
y.

also show that predicted values all show a characteristic over-shoot in the low suction range, where significantly higher suc-tions are predicted for given water contents than were foundexperimentally. The exception to this is soil GW-GM (Fig. 18),which shows a goodmatch between predicted andmeasured datain the low suction range, but a poorer match at higher suctions;this is likely due to the significant volume of pores larger than 146�m, which could not be measured using the selected MIP device(Zhang and Li 2010).
A potential source of the apparent overshoot is “pore trapping,”which occurs when pores of different radii lie on the mercuryintrusion path and which has also been suggested as a contribut-ing factor towards hysteresis observed between drying and wet-ting retention properties (Cuisinier and Laloui 2004; Rojas andRojas 2005). An example columnar pore is shown in Fig. 22. If
mercury intrudes from the left, the larger pore region (radius r1)will fill at some suction �(r1) and the smaller region (radius r2 < r1)at a higher suction �(r2), with the change in the intruded volumeof mercury being attributed to pores of sizes r1 and r2, respec-tively. However, if mercury intrudes from the right the largerregion cannot be filled due to the higher intrusion pressure of thesmaller region. Instead, both regions are intruded at �(r2), withthe change in the intruded volume for both regions being attrib-uted to pores of size r2 only (Simms and Yanful 2001). The effect oftrapped pores on MIP results is therefore an underestimation ofthe volume fraction of larger pores and a subsequent overestima-tion of that of smaller pores, resulting in higher and lower watercontents for a predicted drying suction respectively, as is seen inFigs. 17 to 21 (Meyer and Klobes 1999). Pore trapping could there-fore be responsible for the characteristic overshoot seen in Figs. 17
Fig. 19. Predicted SWRCs for soil ML.
Fig. 20. Predicted SWRCs for soil SC.
Pagination not final/Pagination non finale
12 Can. Geotech. J. Vol. 50, 2013
Published by NRC Research Press
Can
. Geo
tech
. J. D
ownl
oade
d fr
om w
ww
.nrc
rese
arch
pres
s.co
m b
y M
onas
h U
nive
rsity
on
04/1
9/13
For
pers
onal
use
onl
y.

to 21 and so demonstrates the need to use multiple methods todetermine soil PSDs, to minimize the impact of one single test onmeasured results (Hajnos et al. 2006).
Soil fabric evolution and SWRC prediction limitationsThe effect of changing suction on the fabric of double-structure
soils has been investigated by several authors. Simms and Yanful(2001) used MIP to measure the PSDs of freeze-dried samples of aclayey glacial till (compacted wet of optimum) after the applica-tion of a suction and found that, with increasing suction, voidratio decreased and the modal large pore size and volume re-duced, whilst the small pore mode remained at a constant size,but grew in volume. The change in PSD with suction was attrib-
uted to the constriction of larger soil pores and so a reduction inpore accessibility with increasing suction.
Cuisinier and Laloui (2004) used a pressure plate to subject sam-ples of a morainic sandy-loam soil (compacted on the dry side ofoptimum) to successively increasing suction levels to determinethe effect of suction on soil fabric. Material was removed from thesamples on reaching suction equilibrium and freeze-dried so thatPSDs could be determined using MIP as shown in Fig. 23. As wasfound by Simms and Yanful (2001), increasing suction resulted ina reduction in the volume of large pores, with the large poremodal size decreasing slightly with increasing suction, and anincrease in the volume of smaller pores, again with no significantchange in the small pore modal size. Soil void ratio again reducedwith increasing suction although changes in soil PSD occurred atnear-constant void ratios at higher suctions. Cuisinier and Laloui(2004), and later Tarantino (2010), suggested that observed resultswere due to the application of suctions only high enough to drainthe larger pores, so that only larger pores were subjected tochanges in water content and subsequently constricted, whilstsmaller pores remained filled at all suction levels tested.
Results found by these authors therefore show that the fabric ofa soil changes whilst undergoing SWRC testing, so that retentionproperties predicted from one PSD alone, as was done in the pre-vious section, cannot capture the material behaviour at differentsuction levels. Instead, a single PSD can only reliably predict ma-terial retention properties at the suction value at which it wasfound, so that numerous PSDs are required to determine a morecomplete SWRC (Nuth and Laloui 2008). This can be investigatedby comparingmeasured SWRC values to predictionsmade using asuccession of PSDs, determined over a range of suction values, asshown in Fig. 24 for PSDs given in Fig. 23. Although the modelconsiders particles to be rigidly arranged for purposes of the anal-ysis, the use of a different PSD per suction level prediction ac-counts for a changing (i.e., nonrigid) particle structure. Figure 24shows that although predictions made using a single PSD do notcapture the measured retention properties, a good match to pre-dicted data can be achieved by combining predictions for eachPSD for that PSD's suction level. The large difference betweenmeasured and predicted water contents shown in Fig. 24 is due tothe significant difference between the saturated water contentfound for SWRC testing (370 mL/g) and the maximum intruded
Fig. 21. Predicted SWRCs for soil SM.
Table 2. Model input (n and �slv) and output values (r/R, r/D, rlim,WClim, and �lim) for predicted drying curves.
Soil(ASTM 2006) n �slv r/R r/D
rlim(�m)
WClim
(mL/g)�lim
(MPa)
CL 0.50 0 0.40 1.42 0.40 0.0822 1.72GW-GM 0.30 0 0.25 6.55 0.25 0.0150 2.28ML 0.37 0 0.29 2.62 0.29 0.0594 2.12SC 0.35 0 0.28 3.27 0.28 0.0452 2.15SM 0.32 0 0.26 4.51 0.26 0.0325 2.15
Note: rlim, WClim, and �lim: pore size, water content, and suction, respec-tively, corresponding to macro-micro region boundary.
Fig. 22. Changing pore radii in a columnar pore.
Pagination not final/Pagination non finale
Beckett and Augarde 13
Published by NRC Research Press
Can
. Geo
tech
. J. D
ownl
oade
d fr
om w
ww
.nrc
rese
arch
pres
s.co
m b
y M
onas
h U
nive
rsity
on
04/1
9/13
For
pers
onal
use
onl
y.

volume of mercury found at zero suction (305 mL/g), suggestiblydue to a large volume of pores not being intruded during MIPtesting, either due to the limit on intrusion pressures inherent inthe device or pores not being accessible to mercury during testing(Cuisinier and Laloui 2004; Koliji et al. 2006). Also given in Fig. 24are results found using eq. [1], again showing how eq. [1] signifi-cantly underpredicts suction values for a given water content.Results given in Fig. 24 therefore show that a good approximationto measured SWRC data can be achieved by this model throughthe use of multiple PSDs, determined over a range of appliedsuctions. This result unfortunately diminishes the power of theuse of soil PSDs for predicting retention properties, however, as alarge number of PSDs is therefore required to get a goodmatch toexperimental data. The use of PSDs to predict retention properties
nonetheless remains a powerful tool, but predictions must belimited to those suction values investigated.
ConclusionsThis paper has presented a new method for determining a
material's retention properties from its PSD and has discussedthe limitations on the use of PSDs to predict retention proper-ties.
The model presented here offers several advantages over thetechniques used by previous authors
• Particles are modelled either as spheres or cuboids to moreaccurately model retention properties at different porescales.
Fig. 23. PSDs for morainic sandy-loam soil after the application of suctions of 0, 50, 100, 200, and 400 kPa (Koliji et al. 2006 after Cuisinierand Laloui 2004).
Fig. 24. Predicted SWRCs as compared to measured values (Cuisinier and Laloui 2004).
Pagination not final/Pagination non finale
14 Can. Geotech. J. Vol. 50, 2013
Published by NRC Research Press
Can
. Geo
tech
. J. D
ownl
oade
d fr
om w
ww
.nrc
rese
arch
pres
s.co
m b
y M
onas
h U
nive
rsity
on
04/1
9/13
For
pers
onal
use
onl
y.

• Material porosity, determined from the material PSD, is in-cluded as a model variable, incorporated by assuming a finiteseparation distance between modelled particles.
• The effects of adsorbed water on both wetting and drying suc-tions are included by assuming that particles are covered bythin adsorbed films, with a subsequent improvement to theaccuracy of predicted retention properties.
• Cavitation and liquid coalescence are used as mechanisms toexplain pore drainage and filling, respectively, which allowsthe model to predict hysteresis between drying and wettingconditions in the presence of adsorbed films without the needto consider the effects of pore interconnectivity.
The effect of changing suction on soil fabric was discussed andit was shown that the match to experimental data is significantlyimproved if predictions are made using PSDs determined over arange of suction values. This result unfortunately diminishes thepower of the ability to predict retention properties using PSDdata, as multiple PSDs, determined for the entirety of the suctionrange of interest, are required. Although currently a time-consuming process, developments in nondestructive testingequipment, — for example, X-Ray computed tomography —might improve the speed of PSD determination to the point thatretention property prediction from PSD data becomes viable. Re-gardless, the use of PSDs to predict retention properties has beenshown to be a useful and accurate alternative to direct SWRCmeasurement provided suitable PSDs are available.
AcknowledgementsThe first author was supported by a studentship awarded by the
School of Engineering and Computing Sciences, Durham Univer-sity, during this research. He would like to thank AlessandroTarantino and David Toll for their comments on this work.
ReferencesAbdullah, W.S., Alshibli, K.A., and Al-Zou'bi, M.S. 1999. Influence of pore water
chemistry on the swelling behavior of compacted clays. Applied Clay Science,15(5–6): 447–462. doi:10.1016/S0169-1317(99)00034-4.
Akbour, R.A., Douch, J., Hamdani, M., and Schmitz, P. 2002. Transport of kaolin-ite colloids through quartz sand: Influence of humic acid, Ca2+, and tracemetals. Journal of Colloid and Interface Science, 253(1): 1–8. doi:10.1006/jcis.2002.8523. PMID:16290824.
ASTM. 2006. Standard practice for classification of soils for engineering pur-poses (Unified Soil Classification System). ASTM standard D2487. AmericanSociety for Testing and Materials, West Conshohocken, Pa.
Baker, R., and Frydman, S. 2009. Unsaturated soil mechanics: critical review ofphysical foundations. Engineering Geology, 106(1–2): 26–39. doi:10.1016/j.enggeo.2009.02.010.
Butt, H.-J. 2008. Capillary forces: influence of roughness and heterogeneity.Langmuir, 24(9): 4715–4721. doi:10.1021/la703640f.
Choquette, M., Bérubé, M.-A., and Locat, J. 1987. Mineralogical andmicrotexturalchanges associated with lime stabilization of marine clays from eastern can-ada. Applied Clay Science, 2(3): 215–232. doi:10.1016/0169-1317(87)90032-9.
Collet, F., Bart, M., Serres, L., and Miriel, J. 2008. Porous structure and watervapour sorption of hemp-based materials. Construction and Building Mate-rials, 22(6): 1271–1280. doi:10.1016/j.conbuildmat.2007.01.018.
Cosenza, P., and Tabbagh, A. 2004. Electromagnetic determination of clay watercontent: role of the microporosity. Applied Clay Science, 26: 21–36. doi:10.1016/j.clay.2003.09.011.
Cuisinier, O., and Laloui, L. 2004. Fabric evolution during hydromechanicalloading of a compacted silt. International Journal for Numerical and Analyt-ical Methods in Geomechanics, 28(6): 483–499. doi:10.1002/nag.348.
Derjaguin, B.V., Churaev, N.V., and Muller, V.M. 1987. Surface forces. Plenum,New York.
Diamond, S. 1970. Pore size distributions in clays. Clays and Clay Minerals, 18:7–23. doi:10.1346/CCMN.1970.0180103.
Edlefsen, N.E., and Anderson, A.B.C. 1943. The thermodynamics of soil moisture.Hilgardia, 16: 31–299.
Everett, D.H. 1967. The solid–gas interface. Dekker, New York.Frydman, S., and Baker, R. 2009. Theoretical soil-water characteristic curves
based on adsorption, cavitation, and a double porosity model. InternationalJournal of Geomechanics, 9(6): 250–257. doi:10.1061/(ASCE)1532-3641(2009)9:6(250).
Gens, A. 2010. Soil-environment interactions in geotechnical engineering. Géo-technique, 60(1): 3–74. doi:10.1680/geot.9.P.109.
Ghanbarian-Alavijeh, B., and Liaghat, A.M. 2009. Evaluation of soil texture datafor estimating soil water retention curve. Canadian Journal of Soil Science,89(4): 461–471. doi:10.4141/cjss08066.
Grof, Z., Lawrence, C.J., and Stepánek, F. 2008. The strength of liquid bridges inrandom granular materials. Journal of Colloid and Interface Science, 319(1):182–192. doi:10.1016/j.jcis.2007.11.055. PMID:18083181.
Haines, W.B. 1930. Studies in the physical properties of soil. V. The hysteresiseffect in capillary properties, and the modes of moisture distribution associ-ated therewith. The Journal of Agricultural Science, 20(1): 97–116.
Hajnos, M., Lipiec, J., Swieboda, R., Sokolowska, Z., and Witkowska-Walczak, B. 2006. Complete characterization of pore size distribution oftilled and orchard soil using water retention curve, mercury porosimetry,nitrogen adsorption, and water desorption methods. Geoderma, 135: 307–314. doi:10.1016/j.geoderma.2006.01.010.
Hattab, M., and Fleureau, J.-M. 2010. Experimental study of kaolin particle ori-entationmechanism. Géotechnique, 60(5): 323–331. doi:10.1680/geot.2010.60.5.323.
Iwamatsu, M., and Horii, K. 1996. Capillary condensation and adhesion of twowetter surfaces. Journal of Colloid and Interface Science, 182(2): 400–406.doi:10.1006/jcis.1996.0480.
Koliji, A., Laloui, L., Cusinier, O., and Vulliet, L. 2006. Suction induced effects onthe fabric of a structured soil. Transport in Porous Media, 64(2): 261–278.doi:10.1007/s11242-005-3656-3.
Likos, W.J. 2009. Pore-scale model for water retention in unsaturated sand.American Institute of Physics, Golden, Colo., pp. 907–910.
Lourenço, S.D.N., Gallipoli, D., Augarde, C.E., Toll, D.G., Fisher, P., andCongreve, A. 2012. Formation and evolution of water menisci in unsaturatedgranular media. Géotechnique, 62(3): 193–199. doi:10.1680/geot.11.P.034.
Lu, N., and Likos,W.J. 2004. Unsaturated soilmechanics. JohnWiley & Sons, Inc.,N.J.
Marinho, F., Take, W., and Tarantino, A. 2008. Measurement of matric suctionusing tensiometric and axis translation techniques. Geotechnical and Geo-logical Engineering, 26: 615–631. doi:10.1007/s10706-008-9201-8.
Mayer, R.P., and Stowe, R.A. 2006. Packed uniform sphere model for solids:Interstitial access opening sizes and pressure deficiencies for wetting liquidswith comparison to reported experimental results. Journal of Colloid andInterface Science, 294(1): 139–150. doi:10.1016/j.jcis.2005.07.005. PMID:16085078.
Meyer, K., and Klobes, P. 1999. Comparison between different presentations ofpore size distribution in porous materials. Fresenius' Journal of AnalyticalChemistry, 363(2): 174–178. doi:10.1007/s002160051166.
Millington, R.J., and Quirk, J.P. 1961. Permeability of porous media. Nature, 183:387–388.
Molenkamp, F., and Nazemi, A.H. 2003. Interactions between two roughspheres, water bridge and water vapour. Géotechnique, 53(2): 255–264. doi:10.1680/geot.2003.53.2.255.
Mualem, Y. 1976. A new model for predicting the hydraulic conductivity ofunsaturated porous media. Water Resources Research, 12: 513–522. doi:10.1029/WR012i003p00513.
Nuth, M., and Laloui, L. 2008. Advances in modelling hysteretic water retentioncurve in deformable soils. Computers and Geotechnics, 35(6): 835–844. doi:10.1016/j.compgeo.2008.08.001.
Or, D., and Tuller, M. 1999. Liquid retention and interfacial area in variablysaturated porous media: Upscaling from single-pore to sample-scale model.Water Resources Research, 35: 3591–3605. doi:10.1029/1999WR900262.
Or, D., and Tuller, M. 2002. Cavitation during desaturation of porous mediaunder tension. Water Resources Research, 38: 19-1–19-4.
Penumadu, D., and Dean, J. 2000. Compressibility effect in evaluating the pore-size distribution of kaolin clay using mercury intrusion porosimetry. Cana-dian Geotechnical Journal, 37(2): 393–405. doi:10.1139/t99-121.
Philip, J.R. 1977. Unitary approach to capillary condensation and adsorption.Journal of Chemical Physics, 66: 5069–5075. doi:10.1063/1.433814.
Powrie, W. 2008. Soil mechanics: concepts and applications. 2nd ed. Spon Press.Rojas, E., and Rojas, F. 2005. Modeling hysteresis of the soil-water characteristic
curve. Soils and Foundations, 45(3): 135–145.Rojas, E., Gallegos, G., and Leal, J. 2010. A porous model based on porosimetry to
simulate retention curves. Edited by E. Alonso and A. Gens. In UnsaturatedSoils. Fifth International Conference on Unsaturated Soils. CRC Press. pp.927–932.
Schull, C.G. 1948. The determination of pore size distribution from gas adsorp-tion data. Journal of the American Chemical Society, 70(4): 1405–1410. doi:10.1021/ja01184a034.
Simms, P.H., and Yanful, E.K. 2001. Measurement and estimation of pore shrink-age and pore distribution in a clayey till during soil-water characteristiccurve tests. Canadian Geotechnical Journal, 38(4): 741–754. doi:10.1139/t01-014.
Stevens, N., Ralston, J., and Sedev, R. 2009. The uniform capillary model forpacked beds and particle wettability. Journal of Colloid and Interface Sci-ence, 337(1): 162–169. doi:10.1016/j.jcis.2009.04.086. PMID:19486994.
Tang, A.-M., and Cui, Y.-J. 2005. Controlling suction by the vapour equilibriumtechnique at different temperatures and its application in determining thewater retention properties of MX80 clay. Canadian Geotechnical Journal,42(1): 287–296. doi:10.1139/t04-082.
Pagination not final/Pagination non finale
Beckett and Augarde 15
Published by NRC Research Press
Can
. Geo
tech
. J. D
ownl
oade
d fr
om w
ww
.nrc
rese
arch
pres
s.co
m b
y M
onas
h U
nive
rsity
on
04/1
9/13
For
pers
onal
use
onl
y.

Tarantino, A. 2010. Unsaturated soils: compaction versus reconstituted states. InUnsaturated soils. Fifth International Conference on Unsaturated Soils. Ed-ited by E. Alonso and A. Gens. CRC Press. pp. 113–136.
Tuller, M., and Or, D. 2004. Retention of water in soil and the soil water charac-teristic curve. In Encyclopedia of soils in the environment. Vol. 4. Edited byD. Hillel. Elsevier Ltd., Oxford, UK. pp. 278–289.
Tuller, M., Or, D., and Dudley, L.M. 1999. Adsorption and capillary condensa-tion in porous media: Liquid retention and interfacial configurations in
angular pores. Water Resources Research, 35(7): 1949–1964. doi:10.1029/1999WR900098.
Yong, R.N., and Ouhadi, V.R. 2007. Experimental study on instability of bases onnatural and lime/cement-stabilized clayey soils. Applied Clay Science, 35(3-4):238–249. doi:10.1016/j.clay.2006.08.009.
Young, F.R. 1989. Cavitation. McGraw-Hill Book Company (UK) Ltd.Zhang, L.M., and Li, X. 2010. Microporosity structure of coarse granular soils.
Journal of Geotechnical and Geoenvironmental Engineering, 136(10): 1425–1436. doi:10.1061/(ASCE)GT.1943-5606.0000348.
Pagination not final/Pagination non finale
16 Can. Geotech. J. Vol. 50, 2013
Published by NRC Research Press
Can
. Geo
tech
. J. D
ownl
oade
d fr
om w
ww
.nrc
rese
arch
pres
s.co
m b
y M
onas
h U
nive
rsity
on
04/1
9/13
For
pers
onal
use
onl
y.