prediction of primary atomization using smoothed particle...
TRANSCRIPT

Prediction of Primary Atomization using SmoothedParticle Hydrodynamics
Rainer Koch*, Samuel Braun, Lars Wieth, Geoffroy Chaussonnet, Thilo Dauch, Hans-Jorg Bauer
ISROMAC 2016
InternationalSymposium on
TransportPhenomena andDynamics ofRotatingMachinery
Hawaii, Honolulu
April 10-15, 2016
Abstract
In modern jet engines mostly air blast atomizers are used for the liquid fuel injection. Theprediction of the spray generated by such atomizers was for a long time not feasible because ofrestricted computing resources. However, with modern super-computers the prediction of theatomization has come into reach.
In the present paper a new approach for the numerical prediction of the primary atomizationis presented. The methodology is based on the Smoothed Particle Hydrodynamics (SPH), whichhas originally been developed in the context of astrophysics.
The numerical predictions to be presented were performed for a planar model atomizer, forwhich a vast amount of experimental data was collected by us previously. The major objectivesof the numerical predictions are to elaborate the mechanism governing the effect of thickness ofthe trailing edge of the prefilmer on the size of the droplets and the temporal droplet formationrate.
Keywords
Fuel injection — Atomization — Numerical prediction — Smoothed Particle Hydrodynamics
Institut fur Thermische Stromungsmaschinen, Karlsruhe Institute of Technology (KIT), Karlsruhe, Germany
*Corresponding author: [email protected]
INTRODUCTION
In civil aviation, fuel injection is one of the most crucialprocesses affecting engine emissions, in particular sootand NOx emissions. First experimental investigationsinto air blast atomization date back to the 70’s [1]. Buteven today, the basic mechanism governing air blast at-omization is not understood, and reliable modelling ap-proaches are not available. Present state of the art is toempirically optimize the fuel injectors. Typically, expen-sive measurements of the injector performance in termsof droplet size and velocity are performed at elevatedpressures. Afterwards correlations like those proposedby e.g. Lefebvre [2, 3] are used to extrapolate the exper-imental results to other operating conditions.
The prediction of the atomization process based onfirst principles was for a long time not feasible because ofrestricted computing resources. However, with modernsuper-computers providing 10.000 or even more CPUs,such predictions have come into reach. But the predic-tion of the atomization process is still a major challenge,as a wide range of scales in space and time must becaptured. The spatial range extends from 1 µm whichresembles the typical dimensions of the thickness of thebubbles formed during the disintegration process up tothe distance required for finalizing secondary break upof larger droplets or ligaments, which is in the range ofapproximately 0.1m. Time scales reach from 1 µs for thetypical interaction between the air flow and the liquidat the trailing edge up to the residence time inside the
combustor of typically 10ms.
The Institut fur Thermische Stromungsmaschinen(ITS) has started 7 years ago to develop a numericalmethod for predicting the primary atomization of airblast nozzles, which are typically used in jet engines.The numerical approach is based on the mesh free Smoo-thed Particle Hydrodynamics (SPH) method [4], whichhas originally been developed in the context of astro-physics.
The SPH method was chosen because it has someinherent advantages over the readily available and com-monly used grid based methods such as the Volume ofFluid (VoF) method. Recent developments of applyingthe VoF method for predicting atomization are discussedby Hermann [5].
During primary atomization the liquid surface is ex-posed to large deformations, and surface tension playsa crucial role for the liquid disintegration. Because ofits Lagrangian nature, the Smoothed Particle Hydrody-namics (SPH) method adapts itself naturally to large de-formations of the gas liquid interface. Furthermore, thecurvature of the interface, which is required for comput-ing the surface tension, can directly be calculated anddoes not require a cumbersome surface reconstructiontechnique like in all grid based methods.
In the present paper the application of the SPHmethodfor predicting primary atomization will be presented anddiscussed. All predictions are reflecting an experimentwhich was performed at a generic planar prefilming air-

Prediction of Primary Atomization using Smoothed Particle Hydrodynamics — 2/11
blast atomizer. The experimental setup and results havebeen published at several occasions [6, 7, 8].
The paper is organized as follows: First the funda-mentals of the SPH method will be introduced. Then,a summary of the experimental study of the planar airblast atomizer will be given. The experimental resultsare predicted using the SPH method. Special emphasisis put on the effect of the thickness of the trailing edgeof the prefilmer on the atomization. These predicted re-sults are compared in terms of droplet size distribution,ligament lengths and breakup frequencies to experimen-tal data.
1. SMOOTHED PARTICLE HYDRO-DYNAMICS METHOD
The particle based SPH method has been developed inthe late 1970’s in the context of astrophysics [4]. Re-cently, it gained popularity in general computationalfluid dynamics, where the main scope is on the simu-lation of free surface flows, e.g. [9]. In contrast to com-monly used grid based Eulerian methods, the spatial dis-cretization of a computational domain is performed viaso called particles, which represent a small volume of thefluid. Due to the Lagrangian nature of the method, theparticles move within the computational domain withthe actual fluid velocity. The governing equations de-scribing the flow physics are the Navier Stokes equations.
The main idea behind the SPH formalism is to eval-uate the physical property of a particle or its spatialderivative by interpolating over neighbor particles withina certain radius of influence. Equation (1) reflects thebasic interpolation formalism for a particle with index i.
〈Φ〉i =∑
j
VjΦjW (~xi − ~xj , h) (1)
In Eq. (1), Φ is a physical quantity which may bee.g. the density or the velocity etc. Vj is the volumeof an adjacent particle j and W (~xi − ~xj , h) is a weight-ing function, which depends on the positions ~xi/j andthe smoothing length h. The summation is truncatedonce the distance to the adjacent particle exceeds thepredefined limit ∆r, which depends on the smoothinglength. For a more detailed description of the SPH ba-sics, please refer to e.g. [10]. The interpolation procedureis illustrated in Fig.1.
Until now, the application of SPH to technical prob-lems was limited by the lack of suitable boundary con-ditions. Recently, flexible and robust inflow and out-flow boundaries have been introduced and been demon-strated to be successfully incorporated into a massivelyparallel framework [11]. In contrast to our previous work[10], realistic boundary conditions and fluid propertiesare now available for predictions of technically relevantflow situations.
The modeling of surface tension plays a crucial rolewhen predicting the atomization process. This is due
Figure 1. Principle of the interpolation within theSPH Method
to the fact, that the liquid disintegration is determinedby the balance of two forces acting at the liquid-air in-terface: The surface tension forces and the shear forcesinduced by the air flow. In our SPH code the surfacetension is represented by the Continuum Surface Force(CSF) model, which was originally introduced by Brack-bill et al. [12] in the context of the VoF method. TheCSF model as adopted in our approach was proposed byAdami et al. [13]. The key feature of the CSF model isthe representation of the surface tension force as contin-uous force acting on the volume adjacent to the interfaceinstead of the surface of the interface between liquid andair.
Wetting effects, which may significantly affect pri-mary atomization, are accounted for by the model ofWieth et al. [14]. In order to cope with the high den-sity ratios of up to 1000 depending on the ambient airpressure, the continuity equation as proposed by Hu etal. [15] is applied
〈ρ〉i = mi
∑
j
W (~xi − ~xj , h) (2)
where mi is the mass of the center particle.
2. EXPERIMENTAL STUDY OF AIR BLASTATOMIZATION
2.1 Experimental setup and diagnosticsFor studying experimentally the liquid disintegration ofair blast atomizers, and also for the validation of predic-tions, a generic experiment resembling the characteris-tics of a typical air blast atomizer was set up. A pla-nar atomizer geometry was used instead of the annulardesign of real fuel injector nozzles [16]. This planar ge-ometry enables better access for optical diagnostics. Asketch of the atomizer is shown in Fig. 2.
On top of the planar prefilmer plate, a kerosene sur-rogate is supplied. The liquid disintegration takes placedownstream at the trailing edge of the prefilmer. InFig. 3 a top view on the trailing edge of the prefilmeris depicted. The flow direction is from top to bottom.The photograph (a) was taken at low air velocity, pho-tograph (b) at high air velocity. It is clearly visible that

Prediction of Primary Atomization using Smoothed Particle Hydrodynamics — 3/11
Figure 2. Generic planar air blast atomizer
the liquid is accumulated at the trailing edge of the pre-filmer lip. The accumulated liquid is periodically de-formed into bubbles. In Fig. 4 a zoom into the region atthe trailing edge is depicted, revealing the formation ofsuch bubbles. Once a bubble bursts, lengthy ligamentstructures are formed, which are periodically torn off thetrailing edge.
(a) (b)
Figure 3. Film flow and liquid disintegration at thetrailing edge of the prefilmer: (a) low air velocity; (b)high air velocity
Numeral series of atomization experiments have beenperformed using liquids of different surface tension andviscosity. In addition to varying the air speed and liq-uid loading, also different operating pressures have beenlooked at. The details of the experimental setup and theresults are documented in several publications [6, 7, 8].Here it is sufficient to say that a shadowgraphy setupwas used in conjunction with a high speed camera tak-ing frames at 13.000 Hz. The excellent optical accessibil-ity enables a high spatial resolution for the high-speedvideo recordings. The typical spatial dimension of sucha frame was 15mm× 20mm, resulting in a spatial res-olution of approximately 10 µm per pixel. These highspeed recordings were then post-processed in order toextract the desired data. The absence of a spanwisecross flow and of secondary vortices facilitates the sepa-ration and identification of physical processes affecting
Figure 4. Bubble formation during liquiddisintegration
liquid atomization.
2.2 Experimental resultsOne of the most striking results of the experimentalstudy was the finding that the thickness of the trailingedge does affect the atomization process, as long as theedge is thicker than the liquid film. In particular it wasfound that the droplet generation frequency decreasesand the size of the droplet increases when the trailingedge becomes thicker [6]. These results are plotted inFig. 5.
(a) (b)
Figure 5. Effect of trailing edge thickness on dropletsize (a) and detachment frequency (b)
Gepperth et al. [6] argued, that the effect of the trail-ing edge thickness is mainly due to the liquid accumula-tion at the trailing edge. The volume of the accumulatedliquid depends on the trailing edge height, because itsthickness is governed by the edge height. At the endthe accumulated liquid volume determines the volumeof the ligaments to be torn off, and thus the droplet size.At a given liquid film flow rate, the frequency of the de-tachment of the ligament is inversely proportional to thevolume of the ligaments generated. Therefore, at a largeedge height, bigger droplets are observed which detachat lower frequency.
In deed, the data of Gepperth showed that the meanbreakup frequency fbreakup is inversely proportional to

Prediction of Primary Atomization using Smoothed Particle Hydrodynamics — 4/11
the trailing edge height h.
Srf,breakup ∼ h · fbreakup (3)
In Eq. (3), the dimensionless breakup frequency is ex-pressed in terms of the Strouhal number Srf,breakup. More-over, Gepperth could derive a relation between the Sautermean diameter (SMD) of the fuel spray and the trailingedge height:
SMD ∼ h0.46 (4)
Another interesting observation could also be con-firmed by the experiments of Gepperth et al.: The filmwaves arriving at the trailing edge do not affect the liquiddisintegration process. The wavy film causes temporaland spatial fluctuations of liquid supply to the trailingedge. But these fluctuations are suppressed by the ac-cumulation of the liquid at the trailing edge. Therefore,the film waves do not have any impact on the frequencyof the ligament formation. This mechanism has been re-ported approximately 30 years ago by Sattelmayer andWittig [1], who investigated a prefilmer with an edgethickness of h ≈ 200 µm.
In contradiction to the findings of Gepperth, thereis another quite similar experimental study by Inamuraet al. [17]. The authors could not identify any effect ofthe trailing edge height neither on droplet size nor onthe break up frequency. In contrast to the setup of Gep-perth, Inamura et al. used a rather sharp edged prefilmerlip (h ≈ 160 µm [18]). The designs used by Gepperthhad rather thick trailing edges of 230 µm, 1.0mm and2.5mm.
Despite some sophisticated experimental setups, upto now the role of the prefilmer edge height in the at-omization process is not understood. In this context ithas to be considered, that the interaction of film waveswith the accumulation of the liquid at the trailing edgemakes it difficult to properly discriminate the phenom-ena involved and their impact on the atomization perfor-mance from experiments. As consequence, up to now nocorrelation did exist which includes the effect of the trail-ing edge thickness on droplet size and frequency. Theonly correlation accounting for this effect is the one pro-posed recently by Gepperth [7] as expressed by Eqs. (3,4). However, presently it is not clear within which rangethose correlations are valid. In particular it is of majorinterest, to clarify, why there seems to be no effect atrather thin trailing edges.
It is the objective of this paper to present numericalsimulations of the atomization process based on the SPHmethod, which will serve to clarify this effect.
3. NUMERICAL SETUP FOR THE SPHPREDICTIONS
The numerical results to be presented subsequently wereproduced by considering a 2D computational domain,
which represents the trailing edge of the prefilmer. Thenumerical domain covers just the close vicinity of thetrailing edge as illustrated in Fig. 6.
Figure 6. Setup of the planar air blast atomizer for thenumerical predictions
Geometry
Length of the domain L 6 [mm]
Length of the prefilmer le 2 [mm]
Height of Air flow channels H 3 [mm]
Thickness of trailing edge he 25,50,100,
230, 400 [µm]
Thickness of the liquid film hf 80 [µm]
Angle of the prefilmer α 4.29 [◦]
Spatial resolution dx 5 [µm]
Table 1. Geometrical dimensions of the numericaldomain
The computational domain comprises two inflow boun-daries at the left, an outlet boundary at the right. Theair enters the domain at the left with a piecewise linearvelocity profile, which is intended to mimic a boundarylayer close to the walls. At the boundaries at the topand at the bottom of the computational domain, thevelocity in axial direction is imposed, which is set tothe free stream velocity. This is achieved by imposingwalls moving with the free stream velocity at the topand the bottom of the domain. These wall are repre-sented as hatched areas in Fig(1). The domain includes

Prediction of Primary Atomization using Smoothed Particle Hydrodynamics — 5/11
the prefilmer lip. Here, the air velocity is set equal tothe film velocity. The liquid film enters at the inflowboundary with a block shaped velocity profile. The liq-uid loading V corresponds to an experimentally exam-ined operating point. The variation of the trailing edgeheight only affects htrailing edge and the total height of thedomain. The inflow channel height hinlet remains unal-tered. Therefore, the flow regimes for all investigatedtrailing edges are assumed to be identical. Geometricaldetails, the operating conditions and the fluid propertiesare listed in Tabs. 1 and 2.
Operating conditions and fluid properties
Air Liquid
Inlet velocity 0 – 50 0.617[
ms−1]
Operating pressure 1 [bar]
ρ 1 770[
kgm−3]
µ 1.8e-5 1.56e-3 [Pa s]
σair–liquid 0.0275[
Nm−1]
Contact anglewall–liquid 60 [◦]
Table 2. Inlet conditions and fluid properties
In order to determine a suitable spatial resolution,preliminary simulations have been performed with a meanparticle spacing dx of 20 µm, 10 µm, 5 µm and 2.5 µm.The effect of the spatial resolution is detailed and dis-cussed on computational performance and accuracy isdiscussed in a complementary paper [19]. This papercontains also a comparison of the computational perfor-mance of the SPH method in comparison to the Volumeof Fluid method as available in OpenFOAM package aswell as in FLUENT package.
Concerning the gaseous flow, a resolution of dx =10 µm was found to be sufficient. A further refinementdid not alter the flow field. The liquid phase, however,requires a much finer spatial resolution. An indicatorfor the necessity of a spatial discretization refinement isthe occurrence of single particle stripping. If the spatialdiscretization is too coarse, single particles are torn offfrom the ligaments or droplets, which are exposed tostrong shear flows. Even at a resolution of dx = 2.5 µm,single particle stripping could be observed. However,the portion of single particle droplets (which can not beconsidered as physical droplets) strongly decreases whenreducing the spatial resolution from 10 µm to 5 µm.
Taking into account the computational effort of thesimulations, a mean particle spacing of dx = 5µm hasbeen chosen as a reasonable compromise for the presentstudy. Thus, the computational domain consists of ap-proximately 1.5 million particles. 4 million time steps(23ms of physical time) have been performed in approx-imately 18 hours wall-clock time on 900 CPUs on thehigh performance parallel computer cluster ForHLR I1.
1Forschungshochleistungsrechner ForHLR (Phase) I
Furthermore, it has to be emphasized that no turbu-lence models have been used for the current predictions.Because of the fine spatial resolution of approximatelydx = 5 µm, most of the turbulent length scales are cap-tured and resolved directly, i.e. virtually a direct numeri-cal simulation (DNS) is performed. At the present stageof development of the SPH no methodology for generat-ing artificial, synthetic turbulence is available. There-fore, in the present study no turbulent fluctuations havebeen imposed at the inlet of the duct. However, the au-thors are aware that this issue needs further research inthe future.
4. POST PROCESSING OF THE NUMERI-CAL RESULTS
One major goal of the present study was to extract thedimensions, the volume and the velocity of the ligamentsand droplets formed during the break up process. In or-der to identify theses quantities, a post processing tech-nique was developed with the goal to properly detectligaments and droplets.
In this context, a ligament or droplet is defined asa connected cluster of SPH-particles consisting of liquid.Adjacent SPH-particles, which are of the ’liquid’ type,are assumed to form a ligament or droplet, if the inter-particle distance is smaller than the kernel radius ∆r. Aspecial cluster detection algorithm has been developed,which incorporates a kd-tree neighbor search and an iter-ative cluster propagation technique. After the detectionstep, a unique ID is assigned to each cluster. This en-ables to classify each cluster by e.g. the center of gravityand its velocity or by its sphericity. Due to the knownnumber of SPH-particles contained within each cluster,the mass of the ligament or droplet is known withoutany additional assumptions. Based on the mass of acluster, a representative droplet diameter is calculatedby assuming a spherical shape.
By considering all detected droplets and ligamentswithin the entire computational domain for each timestep, the temporal evolution of the characteristic diam-eters and the numbers of droplets can be obtained. Thetemporal resolution of the numerical prediction is ap-proximately 11.2 µs or 89.5 kHz. Due to this high sam-pling rate, droplets within the computational domainare detected multiple times. This approach of analyzingthe data is identical to that which was used for the post-processing of the experimental data, where the samplingrate is also very high at approximately 10 kHz [20].
If all single ligaments and droplets are properly de-tected, derived quantities can be computed. For exam-ple, the volumetric diameters DV0.1, DV0.5 and DV0.9
were calculated by sorting the droplet volumes and by
http://www.top500.org/system/178424
http://www.bwhpc-c5.de/wiki/index.php/ForHLR_Phase_I_-_Ha
rdware_and_Architecture
Prediction of Primary Atomization using Smoothed Particle Hydrodynamics — 6/11
calculating the accumulated volume distribution. Know-ing the density of the liquid and the droplet mass, thevolumetric diameters have been determined by convert-ing the corresponding percentile volumes.
Typical results which were derived on basis of thispost-processing technique will be discussed in sec. 5.4and 5.5.
5. RESULTS AND DISCUSSION
5.1 Limitations of the numerical predictionsDespite the fact that for the present numerical predic-tions leading edge high performance computers were used,there are still limitations of the present numerical study.One issue is that the geometrical dimensions of the com-putational domain is very confined. The length in stream-wise direction is definitely too small for a correct repre-sentation of the liquid break up process. The limitedlength of the prefilmer in stream-wise direction of just2mm will not allow a correct evolution of the liquid filmflow, in particular the build up of the waves on top ofthe film. This is not a real problem, because there is ex-perimental evidence that the wave structure of the filmwill not affect the frequency of the break up nor the vol-ume of the ligaments, because the film waves and breakup process are decoupled [1, 6].
The second issue is the limited statistics of the nu-merical simulations. In order to keep the computationaleffort treatable, only a few, typically 20 breakup eventscan be simulated. This is by far not sufficient for a soundcomparison to the experiment. A third shortcoming isalso due to the limitation of the computational effort:As stated in sec. 3, the spatial discretization selectedfor the present predictions is 5 µm. This is not enoughto resolve the bubbles which are formed during liquiddisintegration.
The most severe limitation is imposed by the factthat all simulations are two-dimensional. It is well knownfrom experiments, that the breakup process is governedby instabilities of the liquid in span-wise direction alongthe trailing edge [6]. The instabilities in span-wise di-rection trigger the formation of the bubbles as shown inFig.4. These instabilities can of course not be capturedby the present 2D setup. Consequently, the exact repre-sentation of the bubble formation is beyond of the scopeof the present simulations.
5.2 Objective of the numerical predictionsThe hypothesis to be elucidated by the present simula-tions is that the accumulation of liquid at the trailingedge may be the cause for the experimental observationsthat the thickness does affect the break up frequency andthe size of the droplets. In particular it is to be clarified,if the relation between the thickness of the trailing edgeand the droplet size (Eq.4), as it was found from theexperiments can be confirmed by the numerical simula-tions.
The build up of the liquid reservoir along the trailingedge is supposed to be the most important effect gov-erning droplet size and droplet detachment frequency.This process will be well captured by the present 2Dsimulations. Therefore, the present numerical setup isconsidered to be suitable for validating this hypothesis.
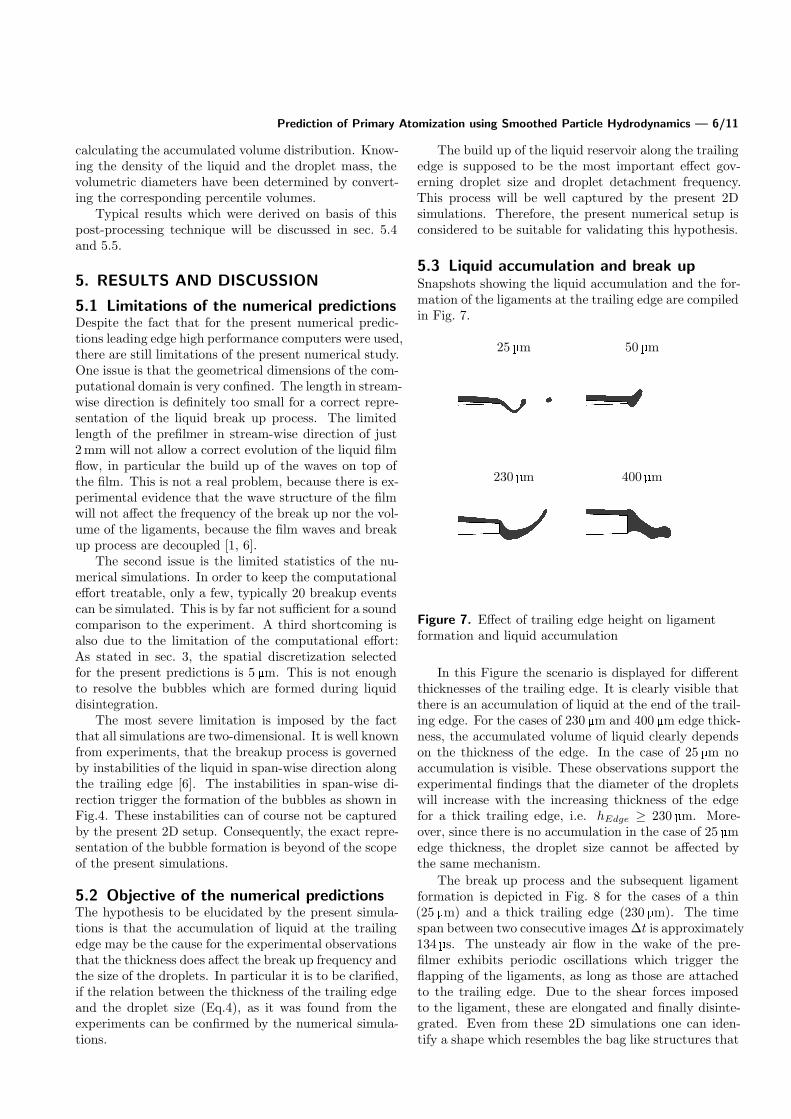
5.3 Liquid accumulation and break upSnapshots showing the liquid accumulation and the for-mation of the ligaments at the trailing edge are compiledin Fig. 7.
25 µm 50 µm
230 µm 400 µm
Figure 7. Effect of trailing edge height on ligamentformation and liquid accumulation
In this Figure the scenario is displayed for differentthicknesses of the trailing edge. It is clearly visible thatthere is an accumulation of liquid at the end of the trail-ing edge. For the cases of 230 µm and 400 µm edge thick-ness, the accumulated volume of liquid clearly dependson the thickness of the edge. In the case of 25 µm noaccumulation is visible. These observations support theexperimental findings that the diameter of the dropletswill increase with the increasing thickness of the edgefor a thick trailing edge, i.e. hEdge ≥ 230 µm. More-over, since there is no accumulation in the case of 25 µmedge thickness, the droplet size cannot be affected bythe same mechanism.
The break up process and the subsequent ligamentformation is depicted in Fig. 8 for the cases of a thin(25 µm) and a thick trailing edge (230 µm). The timespan between two consecutive images ∆t is approximately134 µs. The unsteady air flow in the wake of the pre-filmer exhibits periodic oscillations which trigger theflapping of the ligaments, as long as those are attachedto the trailing edge. Due to the shear forces imposedto the ligament, these are elongated and finally disinte-grated. Even from these 2D simulations one can iden-tify a shape which resembles the bag like structures that

Prediction of Primary Atomization using Smoothed Particle Hydrodynamics — 7/11
Figure 8. Time series of an arbitrary breakup event for a thin trailing edge height of 25 µm (top) and a thick oneof 230 µm (bottom)
were observed in the experiment, e.g. in the third snap-shot in both rows. Obviously, a part of the primaryligament is deformed into the bag like structure whichis immediately destroyed, and the other part of the lig-ament survives this first break up event. It will be dis-integrated later on downstream the trailing edge by thesecondary break up mechanism.
The obvious difference between the thin and the thicktrailing edge case is that the ligaments that survive thefirst break up are thicker and longer in case of the thickertrailing edge. Thus, these ligaments contain a highervolume. This may partly explain, why the resultingdroplets are bigger in case of the thick trailing edge.
5.4 Temporal evolution of ligament elonga-tion and droplet formation
Based on the post processing method which was ex-plained in sec. 4, the numerical results have been fur-ther analyzed. The goal was to extract time series ofthe ligament elongation and the droplet formation. Thedefinition of the ligament length as used subsequently isillustrated in Fig. 9.
Figure 9. Definition of ligament length
The break up length was determined from the length
of the ligament just at the moment where the ligamenthad reached its maximum length, i.e. maximum exten-sion downstream.
After the ligament is detached from the trailing edge,the calculated ligament length will drop suddenly, be-cause a new ligament will be formed. The time scalebetween two sudden drops of the ligaments length wasused to define the breakup frequency.
Typical time series of the ligament length and thenumber of droplets generated are plotted in Fig. 10 fordifferent thicknesses of the trailing edge.
In general, the evolution of the ligament length ischaracterized by a sawtooth shaped curve. As men-tioned previously, the primary breakup event is charac-terized by an abrupt drop of this curve. Simultaneouslywith the sudden drop of the ligament length, the numberof droplets increases. The curve representing the numberof droplets is characterized by triangular shape. The as-cending branch of the triangles indicates the generationof droplets. Obviously, droplet generation takes placeimmediately after the detachment of the ligament. Thisprocess can be identified as primary atomization. An ex-ample is highlighted by ”primary” in Fig. 10. This disin-tegration of the ligaments into droplets, which causes thestrong increase of the number of droplets is illustratedby the two most right frames in Fig. 8.
But also secondary atomization can observed in thetime series in Fig. 10. Secondary atomization meansthat larger droplets or ligaments which are detachedfrom the trailing edge undergo further disintegration.Such an example is marked as ”secondary” in Fig. 10.
The temporal evolution of the 25 µm and 50µm caseis very similar: The maximum ligament length (breakuplength) as well as the number of generated droplets are

Prediction of Primary Atomization using Smoothed Particle Hydrodynamics — 8/11
Figure 10. Time series of ligament elongation and droplet formation
almost equal and the temporal evolution of the breakupshows a regular periodic pattern with an almost identi-cal frequency. At a higher trailing edge thickness, thebreakup process seems to loose the regularity and strictperiodicity. The 100 µm case shows more or less a kindof a bimodal behavior of the breakup length. Finally, incase of 230 µm and 400 µm edge thickness, no regular pe-riodic behavior can be recognized within the simulatedperiod of time.
5.5 Time series of spray characteristicsAs described in sec. 4 another objective of the post pro-cessing was to determine the characteristic volume quan-tiles of the generated spray. A time series of the volumet-ric diameters DV0.1, DV0.5 and DV0.9 is plotted togetherwith the number of droplets in Fig. 11. The curves rep-resenting the number of droplets have been added asreference to indicate the break up event.
The graphs of the volumetric diameters DV0.1, DV0.5
and DV0.9 are characterized by shark fin shaped sectionsand by partially staggered plateaus. The peaks of theshark fin shaped sections indicate the tear-off of a liga-ment. These elongated, non-spherical ligaments containthe major part of the liquid volume. The descendingpart of the curve indicates, that these ligaments aresubject to further breakup. This can also be seen inthe course of the curve representing the droplet number,
where the peaks are located approximately at the centerof the descending section of the curves representing thedroplet diameters.
The plateau shaped sections indicate, that the breakupprocess is almost finished. The atomized liquid insidethe computational domain is represented by stable sizeof the droplets. As most of the small droplets are quicklyadvected out of the domain, the few large droplets whichare still present in the computational domain dominatethe droplet size distribution at this instance of time,and thus the height of the plateaus. It is importantto note that these larger droplets are overrepresented inthe graphs, because of their longer residence time com-pared to smaller droplets. This effect is well known alsofrom laser diagnostics of sprays and called ’biasing’.
Comparing the characteristic diameters resulting fromthe different trailing edge thicknesses, the 25 µm and50 µm case are, again, similar to each other. The shapeof the graphs as well as the magnitudes of the charac-teristic diameters coincide well and show a regular pe-riodic pattern. For increasing trailing edge thicknesses,the magnitudes of the characteristic diameters show alarger spreading and the plateaus are more dominant.
Due to the limited statistics of the numerical data,the derivation of time averaged mean diameters, e.g. theover-all Sauter mean diameter, may be critical and beprone to miscalculation due to the biasing effect. More-

Prediction of Primary Atomization using Smoothed Particle Hydrodynamics — 9/11
Figure 11. Time series of the spray statistics
over, because of the presence of highly distorted liga-ments inside the computational domain, which may besubject to further secondary atomization downstreamthe actual computational domain, the actual droplet siz-ing may be incorrect. Therefore, a direct identificationof the effect that a thicker trailing edge leads to largerdroplets is not possible based on the data of the presentstudy. However, a qualitative comparison of the volu-metric diameters DV0.1, DV0.5 and DV0.9 in Fig. 11 doessupport the experimental finding that a thicker trailingedge leads to larger droplet size.
5.6 Effect of trailing edge thicknessDespite the limited statistics and the fact that the de-tachment of the ligaments is not perfectly periodic forthe cases of the thick trailing edge, arithmetically av-eraged breakup lengths and breakup frequencies havebeen extracted from the numerical data. These quan-tities are plotted in Fig. 12 over the thickness of thetrailing edge. The curves show a clear trend as long asthe trailing edge is thicker than 100 µm. Obviously, thebreak up length increases almost linearly with the thick-ness of the trailing edge, whereas the break up frequencydecays with (1/hEdge)
n, with an arbitrary parameter n.The decay of the break up frequency is consistent withthe experimental results as described by Eq.3.
On the other hand, at a value below 100 µm, the plotsin Fig. 12 reveal, that no significant effect of the trailing
Figure 12. Time series of the spray statistics
edge thickness can be identified. This is in agreement tothe experimental results of Inamura et al. [17].
In the experiments a lower limit of break up fre-quency of approximately 250 Hz was found for the caseof 230 µm edge thickness, which is in good agreementwith the numerical result of 265 Hz. In this context it isworthwhile to note, that the frequency of the van Kar-man vortex street of the pure air flow would be 14.1 kHz,which is completely different from the break up frequen-cies observed. Hence, it can be stated that there mustbe a strong interaction between the air flow and theliquid attached to the trailing edge, that causes such asignificant frequency shift.

Prediction of Primary Atomization using Smoothed Particle Hydrodynamics — 10/11
CONCLUSIONS
1. The Smoothed Particle Hydrodynamics methodhas been proven to be suitable for predicting airblast atomization. In particular, the SPH approachseems to be capable to give insight into details ofthe liquid breakup process which are not accessiblein the experiment.
2. The present 2D predictions reveal that time seriesrepresenting the ligament elongation, droplet for-mation and spray statistics can be extracted bypost processing the numerical data. These datamay serve to derive simplified models based on cor-relations for handling air blast atomization. Thepresent predictions do not cover sufficient physicaltime which is required to extract data that couldbe cast into meaningful correlations.
3. The effect of the thickness of the trailing edgecould be analyzed in terms of break up frequencyand break up length. The numerically determinedbreak up frequency matches well to the experimen-tal results.
4. The numerical results confirmed that there areobviously 2 regimes: Above an edge thickness of100 µm, the liquid break up depends on the thick-ness of the edge, below 100 µm this is not the case.
5. The numerical results can explain the mechanismwhich leads to an increase of the droplet size withincreasing thickness of the trailing edge, as it wasfound in the experiment: The accumulation of theliquid at the end of the trailing edge is increasingif the thickness increases. In consequence, the di-ameter of the generated droplets will increase, andthe frequency of the droplet generation bursts de-creases.
6. As an outlook it can be stated that high fidelity 3Dsimulations of the atomizing process will requireat least 109 particles, and thus adequate computa-tional resources. Our recent studies revealed thatsuch massive computations are feasible with thepresent SPH code.
ACKNOWLEDGMENTS
The current work has been partly financially supportedby the European Commission under contract FP7-AAT-2010-RTD-1 within the 7th framework project ”Fuel In-jector Research for Sustainable Transport” (FIRST) andwithin the Clean Sky Research and Technology Develop-ment programme in the project ”Development of Reli-able Emission and Atomization Models for CombustorDesign” (DREAMCODE).
This numerical computations were performed on thehigh performance super computing cluster ForHLR Phase
I at the Karlsruhe Institute of Technology (KIT), Karl-sruhe, Germany. The computer cluster was funded bythe Ministry of Science, Research and the Arts Baden-Wurttemberg and the DFG (”Deutsche Forschungsge-meinschaft”) within the framework program bwHPC.
REFERENCES
[1] Th. Sattelmayer and S. Wittig. Internal flow ef-fects in prefilming airblast atomizers: mechanismsof atomization and droplet spectra. Journal of engi-neering for gas turbines and power, 108(3):465–472,1986.
[2] A. H. Lefebvre. Airblast atomization. Progress in
Energy and Combustion Sience, 6:233–261, 1980.[3] A. H. Lefebvre. Properties of sprays. Particle &
Particle Systems Characterization, 6:176–186, 1989.[4] R.A. Gingold and J.J. Monaghan. Smoothed Par-
ticle Hydrodynamics: Theory and Application toNon-Spherical Stars. Monthly notices of the royal
astronomical society, 181(3):375–389, 1977.[5] M. Herrmann. On simulating primary atomization
using the refined level set grid method. Atomiation
and Sprays, 21(4):283–301, 2011.[6] S. Gepperth, A. Muller, R. Koch, and H.-J. Bauer.
Ligament and droplet characteristics in prefilmingairblast atomization. In ICLASS, 12th Triennial
International Annual Conference on Liquid Atom-
ization and Spray Systems, Heidelberg, Germany,September 2012.
[7] S. Gepperth, R. Koch, and H.-J. Bauer. Analysisand comparison of primary droplet characteristicsin the near field of a prefilming airblast atomizer.In Proceedings of ASME Turbo Expo 2013: Tur-
bine Technical Conference and Exposition, numberGT2013-94033, San Antonio, Texas, June 2013.
[8] S. Gepperth, E. Barow, R. Koch, and H.-J. Bauer.Primary atomization of prefilming airblast nozzles:Experimental studies using advanced image process-ing techniques. In ILASS Europe, 26th Annual Con-
ference on Liquid Atomization and Spray Systems,Bremen, Germany, September 2014.
[9] I. Federico, S. Marrone, A. Colagrossi, F. Aris-todemo, and P. Veltri. Simulating free-surface chan-nel flows through SPH. In Proc. 5th international
SPHERIC workshop, Manchester, 2010.[10] C. Hofler, S. Braun, R. Koch, and H.-J. Bauer.
Multiphase Flow Simulations Using the MeshfreeSmoothed Particle Hydrodynamics Method. InICLASS, 12th Triennial International Annual Con-
ference on Liquid Atomization and Spray Systems,Heidelberg, Germany, 2012.
[11] S. Braun, L. Wieth, R. Koch, and H.-J. Bauer. AFramework for Permeable Boundary Conditions in

Prediction of Primary Atomization using Smoothed Particle Hydrodynamics — 11/11
SPH: Inlet, Outlet, Periodicity. In Proc. 10th inter-
national SPHERIC workshop, Parma, Italy, 2015.[12] J. U. Brackbill, D. B. Kothe, and C. Zemach. A con-
tinuum method for modeling surface tension. Jour-nal of computational physics, 100(2):335–354, 1992.
[13] S. Adami, X.Y. Hu, and N.A. Adams. A newsurface-tension formulation for multi-phase SPH us-ing a reproducing divergence approximation. Jour-nal of Computational Physics, 229(13):5011–5021,2010.
[14] L. Wieth, S. Braun, R. Koch, and H.-J. Bauer. Mod-eling of liquid-wall interaction using the meshlessSmoothed Particle Hydrodynamics (SPH) method.In ILASS Europe, 26th Annual Conference on Liq-
uid Atomization and Spray Systems, Bremen, Ger-many, September 2014.
[15] X.Y. Hu and N.A. Adams. A multi-phase SPHmethod for macroscopic and mesoscopic flows.Journal of Computational Physics, 213(2):844–861,2006.
[16] S. Gepperth, D. Guildenbecher, R. Koch, and H.-J.Bauer. Pre-filming primary atomization: Experi-ments and modeling. In ILASS Europe, 23rd An-
nual Conference on Liquid Atomization and Spray
Systems, Brno, Czech Rep., September 2010.[17] T. Inamura, M. Shirota, M. Tsushima, M. Kato,
S. Hamajima, and A. Sato. Spray characteristicsof prefilming type of airblast atomizer. In 12th
ICLASS, 2012.[18] M. Shirota. Private communication, 2013.[19] S. Braun, M. Krug, L. Wieth, C. Hofler, R. Koch,
and H.-J. Bauer. Simulation of primary atomiza-tion: Assessment of the smoothed particle hydro-dynamics (SPH) method. In ICLASS 2015, 13th
Triennial International Conference on Liquid Atom-
ization and Spray Systems, Taiwan, 2015.[20] S. Gepperth, R. Koch, and H.-J. Bauer. Analysis
and comparison of primary droplet characteristicsin the near field of a prefilming airblast atomizer. InASME Turbo Expo 2013: Turbine Technical Confer-
ence and Exposition. American Society of Mechani-cal Engineers, 2013.