prediction of leaching fraction from soil properties, irrigation water and rainfall
TRANSCRIPT
Irrig Sci (1985) 6:73-83 Irrigation
bclence © Springer-Verlag 1985
Prediction of Leaching Fraction from Soil Properties, Irrigation Water and Rainfall
R. J. Shaw and P. J. Thorburn
Soil Conservation Research Branch, Queensland Department of Primary Industries, Meiers Road, Indooroopilly, 4068, Queensland, Australia
Received April 18, 1984
Summary. Fine textured soils (> 40% clay) form a major proportion of irrigated soils in northeastern Australia. More than half these soils are irrigated with groundwater, some of which has high salinity (electrical conductivity > 2.9 mS cm-1). A simple prediction of salt leaching was sought to aid in land management decisions.
An empirical model of leaching fraction is presented based on rainfall and easily measured soil properties related to hydraulic conductivity. The model is based on data from 766 soils. To account for the complexity of interactions between soil properties, the data was stratified into groups based on clay con- tent and mineralogy (expressed here as CEC/clay ratio). This allowed simple linear regressions using ESP and rainfall to be developed to predict leaching fraction.
When applied to irrigated soils, a salinity correction t e r m (ECrain+irrigation/ ECrain) was used to account for the flocculation effects of the increased salinity of irrigation waters. The model gave good predictions of leaching fraction for two irrigation regions with widely differing soil properties (Fig. 4).
Successful irrigation with waters of moderate to high salt content requires adequate soil profile leaching to prevent excessive salt accumulation in the root zone with consequent plant yield reduction. For increasingly saline waters, greater opportunity for leaching and more permeable soils become necessary. The degree of salt leaching is management controlled in permeable soils and is more s o i l controlled in slowly permeable soils. Some prediction of salt leaching in soils, particularly slowly permeable soils is required for reliable irrigation resource appraisal.
In Australia, soils with clay contents of greater than 30% in the top metre comprise a large proportion of the irrigated area of 1.6 million ha. Of the 260,000 ha irrigated in Queensland, a large proportion are Vertisols with low saturated hydraulic conductivities - commonly 1 to 9 mm day -I (Shaw and Yule 1978; Gardner and Coughlan 1982). A saturated hydraulic conductivity of 24 mm day -1 has been suggested as a lower limit for soils suitable for irrigation (USSL
74 R.J. Shaw and P. J. Thorburn
1954). Groundwater is used on over 53% of the irrigated area in Queensland where a recent survey estimated 25% of the available water in the major groundwater irrigation regions had an electrical conductivity (EC) greater than 2.9 mS cm -1 (Shaw and Hughes 1981). In addition, a considerable proportion of Queensland soils are sodic (ESP > 6) and saline in the top metre (Northcote and Skene 1972).
Given this situation, a knowledge of potential salt accumulation under irriga- tion is of considerable importance, especially in the slowly permeable soils which are less amenable to management control. Further, the selection of suitable crops for these regions requires a realistic prediction of equilibrium soil salinity, even where good quality water (EC < 0.1 mS cm -1) is used.
Measurement of leaching under field experimental conditions presents large logistic problems. The use of deterministic solute movement models to predict long term salt leaching is difficult because of the requirement for short term water application and plant water use estimates, and the need for detailed description of soil hydraulic properties. There are considerable difficulties in quantifying soil hydraulic properties for Vertisols (Bouma 1983). Thus there is a need for a simple method of predicting leaching in soils.
The availability of soil analyses from soil surveys of non-irrigated regions suggested a conceptually based empirical model of leaching, derived from routine- ly measured soil properties influencing leaching as a broadly applicable approach, which could be extended to irrigation agriculture. Further, since the long term suitability of soils and waters for irrigation is of primary importance, the simpler steady state mass balance approach, with spatially and temporally averaged boundary conditions, is suitable.
This paper reports an empirical salt leaching model for dryland soils under rainfall, which is also applicable to irrigation. The model predicts the electrical conductivity at maximum field water content at the bottom of the root zone from which leaching fraction is calculated. The application of the model to two irriga- tion regions is discussed.
Selection of Soil Properties
As soil leaching is closely related to hydraulic conductivity (K), two important soil properties influencing K were chosen for use in the model from soil properties routinely measured in regional soil surveys. The soil properties chosen were clay content and exchangeable sodium percentage (ESP) for the reasons discussed below.
Clay Content
Hydraulic conductivity is a function of a pore size related soil porosity (Marshall 1958) and so is related to some extent to total soil porosity. The binary component matrix theory of Bodman and Constantin (1965) relates soil porosity to particle packing, based on the percentage of fine component. They found that porosity varied with the relative proportions of two different particle size fractions, being a
Prediction of Leaching Fraction from Soil Properties 75
minimum at the transition between a coarse matrix and a fine matrix. Coughlan et al. (1978) and Chretien and Bisdom (1983) working with natural soils and sand- clay mixtures respectively, found minimum porosity occurred between 40 and 50% clay. Also, in a study of 110 surface soils of north eastern Australia, Smith et al. (1978) found for natural, blended and reaggregated aggregates that minimum porosity occurred close to 50% clay for all three treatments. Thus it would be expected that soils of approximately 40 to 50% clay which have lowest porosity would have lowest K, due to soil intersticies being filled with finer particles. For soils of greater than 50% clay, the mineralogy and structural organization of the clay minerals should have a significant effect on K.
Soil particle arrangement is also important in determining K, particularly the occurrence of macrovoids. However, Brewer (1979) in a study of the fabric of Australian soils concluded that "soil fabric could be predicted with some degree of certainty from particle size analysis". He further considered that the level of fabric considered related closely to soil physical behaviour. So, clay percentage may be useful surrogate measure of the influence of soil fabric on hydraulic conductivity. Whilst macropores have a significant effect on saturated K, they would have limited effect of soil matrix leaching under rainfall.
Exchangeable Sodium Percentage
Many experiments have shown decreased saturated soil hydraulic conductivity with high levels of exchangeable sodium, e.g. Quirk and Schofield (1955), McNeal and Coleman (1966). Frenkel et al. (1978) clarified two processes contributing to decrease in K; (a) clay dispersion resulting in clogging of soil pores, and (b) increased soil swelling of clays resulting in pore size restrictions. They found the relative magnitude of these two effects varied with clay content, clay mineralogy and soil bulk density.
While there is some ongoing debate on the relative sensitivity of different clay minerals to the influence of exchangeable sodium on dispersion and soil swelling, smectite minerals have generally been considered to have high sensitivity (McNeal and Coleman 1966). However, Frenkel et al. (1978) could not distinguish between non acid kaolinite, vermiculite and montmorillonite in soils with low clay contents.
The influence of clay content, clay mineralogy and ESP on soil leaching is complex with varying interrelationships between these properties. Stratification of soils data on the basis of clay content and mineralogy offers a simple means of separating these effects, allowing more definitive estimation of the effect of ESP on soil leaching.
Data Base
Soil profile analyses conducted in conjunction with soil surveys of the agricultural- ly important areas of Queensland were collated. These analyses listed in published and unpublished reports and data files provided 766 non irrigated profiles. The profiles were dominantly Vertisols and Alfisols with smaller occurrences of Ultisolsl Inceptisols, Aridisols, Oxisols, Mollisols and Entisols (Soil Survey Staff
76 R.J. Shaw and P. J. Thorburn
1975). The annual average rainfall range is 288 to 2,045 mm (with summer dominance) and class A pan evaporation ranges from approximately 1,800 to 3,600 ram.
For each soil profile, mean profile clay content and cation exchange capacity (CEC) to 0.9 m and CEC, exchangeable cations, and EC of a 1 : 5 suspension for the 0.8 to 0.9 m depth were collated (analyses were conducted by the methods outlined by Bruce and Rayment 1982). The EC 1 : 5 suspension was converted to EC of the soil at maximum field water content (ECs) based on the water content ratio. The maximum field water content (W max) at 0.9 m was predicted from the - 1 . 5 MPa (= - 1 5 bar) water content using the relationships of Shaw and Yule (1978). The Wmax value was used because the traditional estimate of field capacity ( - 0.03 MPa water content determined on ground samples) is in error for clay subsoils (Gardner and Coughlan 1982), due to soil structure disturbance on grinding and high rates of wetting in laboratory procedures (P. J. Thorburn, unpublished data).
Some of the soils contained gypsum which will lead to an overestimate of EC~. However, due to the proportion of high cation exchange capacity soils in the data base, the use of chloride alone will over estimate leaching due to the large anion exclusion in the soils. Secondly, for soils where chloride is not the dominant anion, use of chloride alone will underestimate salinity. For these reasons EC was chosen.
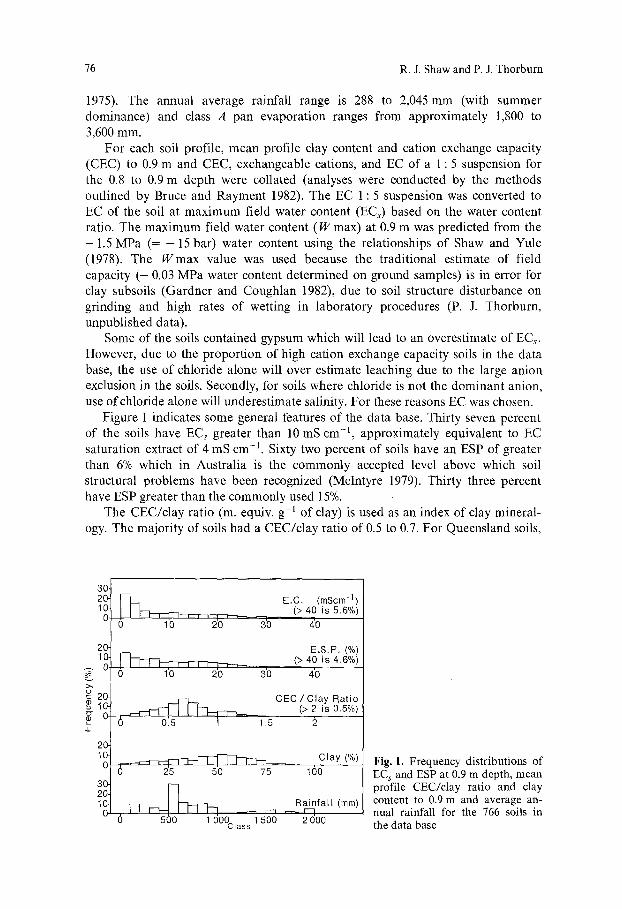
Figure 1 indicates some general features of the data base. Thirty seven percent of the soils have EC~ greater than 10 mS cm -~, approximately equivalent to EC saturation extract of 4 mS cm -]. Sixty two percent of soils have an ESP of greater than 6% which in Australia is the commonly accepted level above which soil structural problems have been recognized (Mclntyre 1979). Thirty three percent have ESP greater than the commonly used 15%.
The CEC/clay ratio (m. equiv, g-i of clay) is used as an index of clay mineral- ogy. The majority of soils had a CEC/clay ratio of 0.5 to 0.7. For Queensland soils,
30- 20- 10-
0
20- 1E~
0
CO
20-
30- 20-
E.G. (rnScm -1) (> 40 is 5.6%)
0 1'0 20 30 4'0
0 10 20
E:S.P. (%) (> 40 is 4.6%)
3'0 4'0
6 0:5 ~ 1:5
CEC/Clay Ratio (> 2 is 0.5%)
._..__,_~ , ~ Clay (%) 6 2'5 5'0 7'5 160
~] I-q--[ ~--]-'q-q-~ ~-, RainfaLl (mrn) - - , ~ r - - I
0 500 1 dOO-lassc 1 500 2000
Fig. 1. Frequency distributions of ECs and ESP at 0.9 m depth, mean profile CEC/clay ratio and clay content to 0.9 m and average an- nual rainfall for the 766 soils in the data base
Prediction of Leaching Fraction from Soil Properties 77
this CEC/clay ratio is indicative of a smectite-kaolinite mixture with at least 50% of the clay composition being smectite; montmorillonite being the dominant smectite mineral (Coughlan and Loch 1984; K. J. Coughlan pers. comm.). Soils with CEC/clay ratio greater than 1 account for 10% of the soils and are associated with sedentary and alluvial soils derived from basalt. In these soils it is thought feldspar and feldspar-clay mineral weathering stages result in significant CEC in the coarse fraction similar to that found by McAleese (1958). Clay content values are widely distributed with 56% of the soils having greater than 45% clay. The Rain- fall distribution reflects the agricultural importance of the regions and thus the intensity of soil surveys.
The Model
From the steady state mass balance equation
LF = ECi/EC0 = D0/D/
where
LF = Leaching Fraction ECi = Electrical Conductivity of input water EC0 = Electrical Conductivity of drainage water Do = Depth of drainage water Di = Depth of input water
Basic Assumptions
a)
b)
c)
(1)
Within a given management system (ECi D/) such as natural rainfall, EC0 can be related to Do which, in turn, is a function of soil properties influencing soil hydraulic conductivity. Since the soil properties influencing leaching under varying annual rainfall will be similar to those under irrigation with water of similar quality, the study of dryland soils offers a method of empirically relat- ing soil salinity to important soil properties influencing Do. The soil salinity-ESP relationships at the bottom Of the root zone for dryland soils are in equilibrium with rainfall, and thus initial variations due to parent material salt composition and content are no longer significant. There is no significant contribution to salinity from mineral weathering.
d) Short term variations in salt content of rainfall are insignificant in determining the equilibrium soil salinity. For Queensland a n ECrain of 0.03 mS c m -1 is adopted as a mean value.
e) The salt content of the drainage water (EC0) is in equilibrium with, and hence equal to ECs. Thus ECs can be related to soil properties influencing Do.
f ) For application to a particular irrigation situation, ECi and Di of equation (1) become;
ECi = ECw+r = ECw Dw + ECr Dr/Dw+,, (2)
and
Di = Dw+~ (3)
where subscript w indicates irrigation and subscript r indicates rainfall.
78 R.J . Shaw and P. J. Thorburn
The Relationships
A s s t a t e d b e c a u s e t h e r e l a t i o n s h i p s b e t w e e n c lay %, m i n e r a l o g y (as C E C / c l a y
r a t i o ) , a n d E S P a re c o m p l e x a n d v a r y i n d e p e n d e n t l y , s i m p l e r r e l a t i o n s h i p s c a n b e
d e r i v e d b y s t r a t i f y i n g t h e d a t a o n t h e b a s i s o f c lay % a n d C E C / c l a y ra t io .
T h e d a t a w a s d i v i d e d in to e i g h t c l ay r a n g e s o f 10%, c e n t e r e d o n 50% c lay as t h e
r e g i o n o f m i n i m u m p o r o s i t y . C E C / c l a y r a t i o w a s u s e d to f o r m f ive g r o u p s r e f l e c t -
i ng d o m i n a n t c l a y m i n e r a l o g i e s viz. g r e a t e r t h a n 0.95, 0.75, 0.55, 0.35 a n d less t h a n
0.35. W i t h soi ls less t h a n 5% c lay a n d g r e a t e r t h a n 85% c l ay d e l e t e d , t h e r e a r e 40 soi l
g r o u p s . T h e d a t a w i t h i n e a c h soi l g r o u p w a s r e g r e s s e d as a s i m p l e l i n e a r r e g r e s s i o n
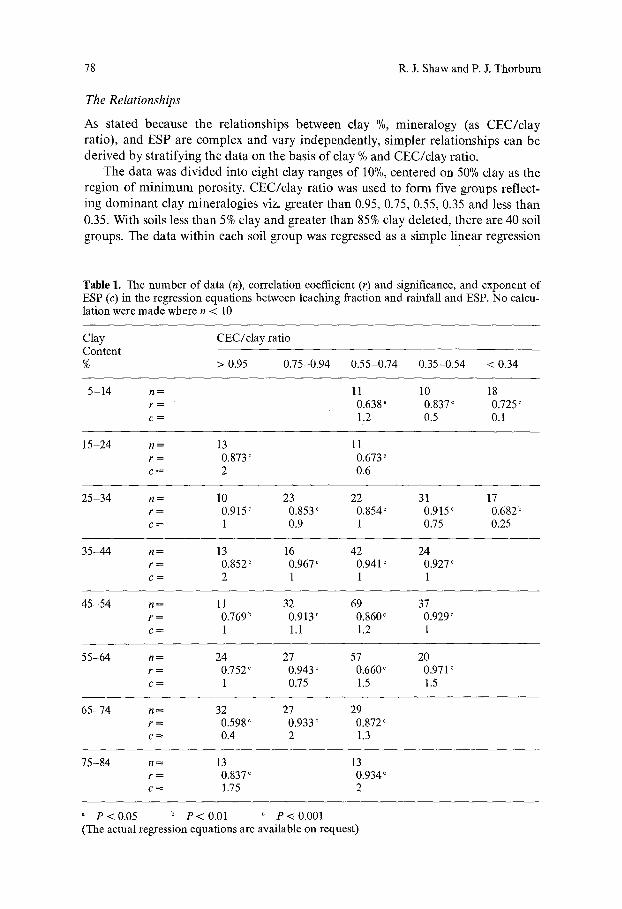
Table 1. The number o f data (n), correlat ion coefficient (r) and significance, and exponent o f ESP (c) in the regression equat ions be tween leaching fraction and rainfall and ESP. No calcu- lation were made where n < 10
Clay CEC/c l ay ratio Content % > 0.95 0.75-0.94 0.55-0.74 0.35-0.54 < 0.34
5-14 n = 11 10 18 r = 0.638" 0.837 c 0.725 c = 1.2 0.5 0.1
15 -24 n = 13 11 r = 0.873 c 0.673 ° c = 2 0.6
25-34 n = 10 23 22 31 17 r = 0.915 c 0.853 c 0.854 c 0.915 c 0.682 b c = 1 0.9 1 0.75 0.25
35-44 n = 13 16 42 24 r = 0.852 c 0.967 c 0.941 ° 0.927 ~ c = 2 1 1 1
45-54 n = 11 32 69 37 r = 0.769 b 0.913 ° 0.860 c 0.929 ¢ c = 1 1.1 1.2 1
55-64 n = 24 27 57 20 r = 0.752 ° 0.943 c 0.660 c 0.971 c c = 1 0.75 1.5 1.5
65-74 n = 32 27 29 r = 0.598 c 0.933 c 0.872 c c = 0.4 2 1.3
75-84 n = 13 13 r = 0.837 c 0.934 c --- 1.75 2
a P < 0 . 0 5 b P < 0 . 0 1 ° P < 0 . 0 0 1 (The actual regression equat ions are available on request)
Prediction of Leaching Fraction from Soil Properties 79
of the form of equation (4) with ESP the dominant soil property influencing Do (within each soil group). The varying influence of ESP on leaching was linearized by varying the exponent of ESP.
LFr = ECJECs = a" DJESP c + b (4)
where LF~ -- leaching fraction under rainfall (calculated by ECr/EC~), a and b are regression coefficients, and c is an exponent to linearize the effect of ESP.
The regression equations for the soil groups were generally highly significant with r values in excess of 0.80. Soils with CEC/clay ratios less than 0.35 and greater than 0.95 tended to be more variable. Table 1 shows the number of data points, correlation coefficients, significance of the regressions and the value of the exponent term of all groups regressed. Insufficient data were available for some groups. Only those with 10 data points or more were regressed.
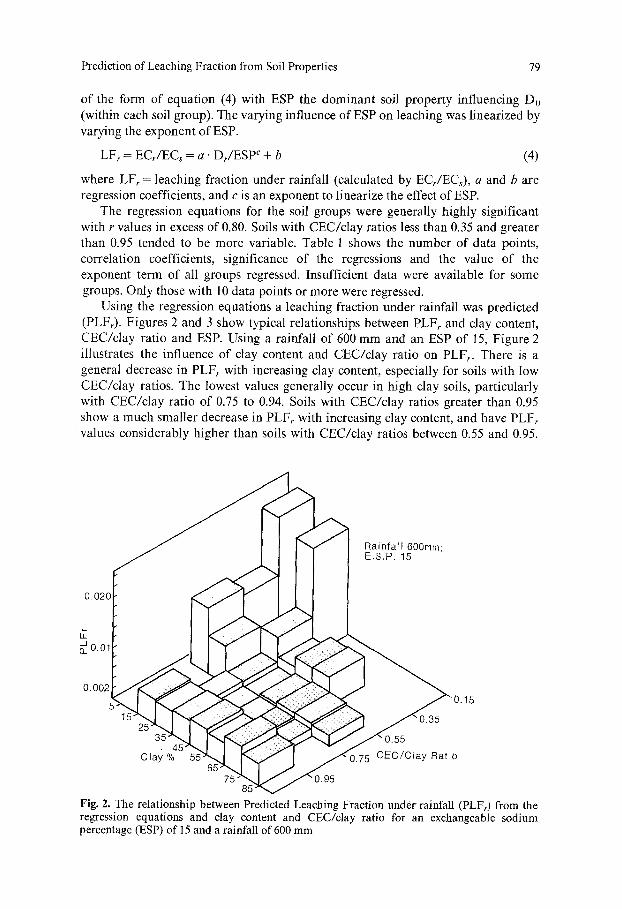
Using the regression equations a leaching fraction under rainfall was predicted (PLFr). Figures 2 and 3 show typical relationships between PLFr and clay content, CEC/clay ratio and ESP. Using a rainfall of 600 mm and an ESP of 15, Figure 2 illustrates the influence of clay content and CEC/clay ratio on PLF~. There is a general decrease in PLF~ with increasing clay content, especially for soils with low CEC/clay ratios. The lowest values generally occur in high clay soils, particularly with CEC/clay ratio of 0.75 to 0.94. Soils with CEC/clay ratios greater than 0.95 show a much smaller decrease in PLFr with increasing clay content, and have PLF~ values considerably higher than soils with CEC/clay ratios between 0.55 and 0.95.
O. 02(
~0.0"
O. 002
Fig. 2. The relationship between Predicted Leaching Fraction under rainfall (PLFr) from the regression equations and clay content and CEC/clay ratio for an exchangeable sodium percentage (ESP) of 15 and a rainfall of 600 mm
80 R.J. Shaw and P. J. Thorburn
).75
PLFr
.05
.01
.005
.001
1.5
85
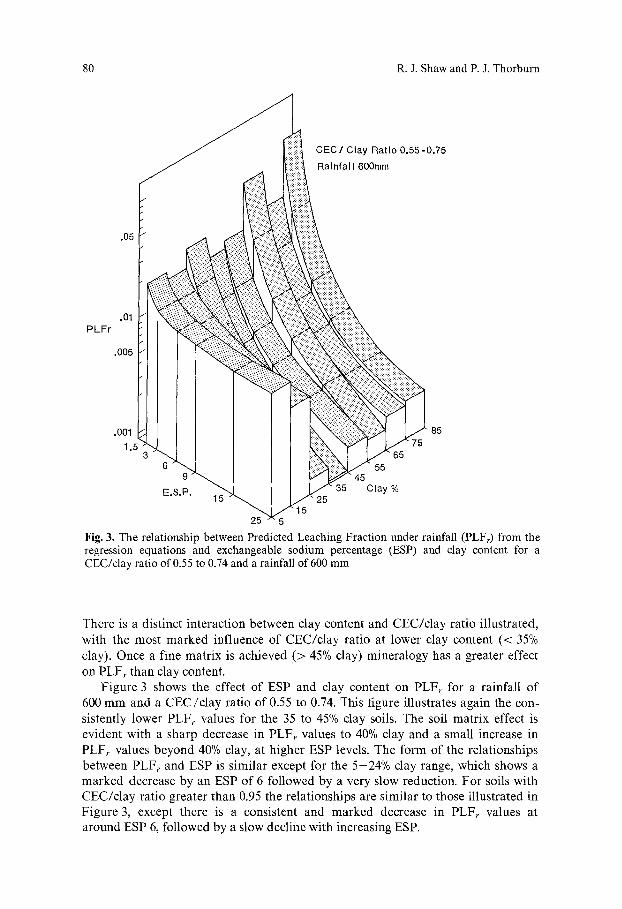
Fig. 3. The relationship between Predicted Leaching Fraction under rainfall (PLFr) from the regression equations and exchangeable sodium percentage (ESP) and clay content for a CEC/clay ratio of 0.55 to 0.74 and a rainfall of 600 mm
There is a distinct interaction between clay content and CEC/clay ratio illustrated, with the most marked influence of CEC/clay ratio at lower clay content (< 35% clay). Once a fine matrix is achieved (> 45% clay) mineralogy has a greater effect on PLFr than clay content.
Figure 3 shows the effect of ESP and clay content on PLFr for a rainfall of 600 mm and a CEC/clay ratio of 0.55 to 0.74. This figure illustrates again the con- sistently lower PLFr values for the 35 to 45% clay soils. The soil matrix effect is evident with a sharp decrease in PLFr values to 40% clay and a small increase in PLFr values beyond 40% clay, at higher ESP levels. The form of the relationships between PLF~ and ESP is similar except for the 5-24% clay range, which shows a marked decrease by an ESP of 6 followed by a very slow reduction. For soils with CEC/clay ratio greater than 0.95 the relationships are similar to those illustrated in Figure 3, except there is a consistent and marked decrease in PLFr values at around ESP 6, followed by a slow decline with increasing ESP.
Prediction of Leaching Fraction from Soil Properties
Prediction of Leaching Fraction Under Irrigation
81
To examine the prediction of leaching under irrigation, soil data available for two irrigation areas in southern Queensland - St. George and Lockyer Valley - were used
St. George is a surface water irrigation area. The soils are dominantly Alfisols and Vertisols and were sampled in 1978. Mean profile clay content was 40 to 60%, CEC/clay ratio 0.54 to 0.81 and ESP 6 to 36%. Average metered water use for the last 10 years was 552 mm year -I with an average annual rainfall over that period of 484 mm (Queensland Water Resources Commission, unpublished reports). The
-irrigation water has an EC of 0.2 mS cm -1 which was corrected for CaCO3 precipi- tation before use in the model.
The Lockyer Valley is a largely groundwater based irrigation area with a small surface water area. Vertisols are dominant with smaller proportions of Mollisols and Alfisols. Mean soil profile clay content was 16 to 66%, CEC/clay ratio 0.5 to 1.7 (with most greater than 0.95) and ESP 1.4 to 20%. Average metered surface water use over the last 10 years was 391 mm year l with an annual rainfall of 822 mm for that period (Queensland Water Resources Commission, unpublished reports). Sites were sampled in 1980 where waters of EC 1.3 mS cm -1 to 7.9 mS cm -1 were used for irrigation. Irrigation waters tended to be relatively high in bicarbonate and were corrected for CaCO3 precipitation before use in the model.
A leaching fraction under irrigation plus rainfall was calculated for these soils by substituting Dw+r for Dr in the regression equations (equation 4). The values measured (ECw+r/ECs) were considerably greater than predicted under non irrigated conditions (PLFr) due to the effect of increased electrolyte concentration in the input water. Assuming the ESP-EC-rainfall equilibrium established for the non irrigated sites is below the threshold level for maximum K, there will be an increase in leaching for an increase in electrolyte concentration above this level. Assuming the increase is linear, a correction term for irrigation water salinity can be derived. This term is the ratio ECw+JECr, so that
P C F r (ECw+r/Eer) = PLFiw, (5)
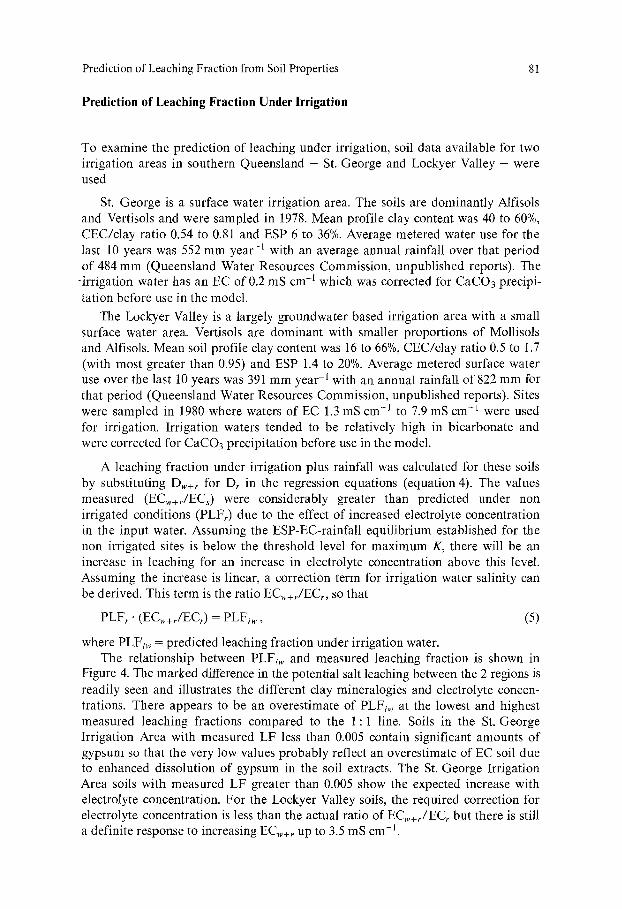
where PLFiw = predicted leaching fraction under irrigation water. The relationship between PLFiw and measured leaching fraction is shown in
Figure 4. The marked difference in th e potential salt leaching between the 2 regions is readily seen and illustrates the different clay mineralogies and electrolyte concen- trations. There appears to be an overestimate of PLFiw at the lowest and highest measured leaching fractions compared to the 1:1 line. Soils in the St. George Irrigation Area with measured LF less than 0.005 contain significant amounts of gypsum so that the very low values probably reflect an overestimate of EC soil due to enhanced dissolution of gypsum in the soil extracts. The St. George Irrigation Area soils with measured LF greater than 0.005 show the expected increase with electrolyte concentration. For the Lockyer Valley soils, the required correction for electrolyte concentration is less than the actual ratio of ECw+r/ECr but there is still a definite response to increasing ECw+r up to 3.5 mS cm -l.
82 R.J. Shaw and P. J. Thorbnrn
1.P
0.1
o.o~
o. OOl 0 . 0 0 1 . . . . . . 0' .01 ' ' ' 0 , 1 . . . . . . . . 110 . . . . . . . . .
M e a s u r e d L .F
Fig. 4. The relationship between Predicted Leaching Fraction under irrigation (PLFiw) and measured leaching fraction for soils from the St. George (') and Lockyer Valley (x) Irrigation Areas
Further sampling from irrigation areas of intermediate soil properties and ECi is required to give better definition of the effect of electrolyte concentration on PLFr. Analyses from two additional regions are being carried out.
For irrigation water compositions where ESP of the soil will be changed, the models of Suarez (1981) or Miyamoto (1980) can be used to predict the resultant soil ESP. This ESP would then be used in the calculation of PLFiw.
Conclusions
By considering a wide range of soils under a variety of rainfall regimes, the influence of soil properties on salt leaching under varying inputs has been empirically quantified. This allows the prediction of leaching under changed water application for very low salinity waters and through an empirical salinity correc- tion term for inputs of varying salinity. Further work is required to quantify the relative change in leaching for field soils under different irrigation water salinities. The relationships show that soils with high clay content (over 55%) and high CEC/clay ratios can be quite permeable at low ESP values and thus used for irrigation with quite saline waters.
Acknowledgements. The co-operation of many field soil surveyors and soil analysts in allowing access to the data is much appreciated. Thanks are due to Christine Howlitt for assistance and advice in data manipulation and statistical treatment. Helpful discussion and comments on earlier drafts on the paper were given by Dr. Kep Coughlan, Mr. Ted Gardner, Mrs. Val Eldershaw and Dr. George Smith.
Prediction of Leaching Fraction from Soil Properties 83
References
Bodman GB, Constantin GK (1965) Influence of particle size distribution in soil compaction. Hilgardia 36:567
Bouma J (1983) Use of soil survey data to select measurement techniques for hydraulic con- ductivity. Agric Water Manag 6:177
Brewer R (1979) Relationships between particle size, fabric and other factors in some Australian soils. Aust J Soil Res 17:29
Bruce RC, Rayment GE (1982) Analytical methods and interpretations used by the Agricul- tural Chemistry Branch for soil and land use surveys. Queensland Dept Primary Indust Bull QB 82004
Chretien J, Bisdom EBA (1983) The development of soil porosity in experimental sandy soils with clay admixtures as examined by Quantimet 720 from BESI and by other techniques. Geoderma 30:285
Coughla n KJ, Loch RJ (1984) The relationship between aggregation and other soil properties in cracking clay soils. Aust J Soil Res 22:59
Coughlan KJ, Loch RJ, Fox WE (1978) Binary packing theory and the physical properties of aggregates. Aust J Soil Res 16:283
Frenkel H, Goertzen JO, Rhoades JD (1978) Effects of clay type and content, exchangeable sodium percentage, and electrolyte concentration on clay dispersion and soil hydraulic conductivity. Soil Sci Soc Am J 42:32
Gardner EA, Coughlan KJ (1982) Physical factors determining soil suitability for irrigated crop production in the Burdekin-Elliot River area. Queensland Dept Primary Indust, Agricultural Chemistry Branch, Technical Report No. 20
Marshall TJ (1958) A relation between permeability and size distribution of pores. J Soil Sci 9:1
McAleese DM (1985) Studies of the basaltic soils of Northern Ireland, VI cation exchange capacities and mineralogy of the fine sand separates. J Soil Sci 9:289
McIntyre DS (1979) Exchangeable sodium, subplasticity and hydraulic conductivity of some Australian soils. Aust J Soil Res 17:115
McNeal BL, Coleman NT (1966) Effect of solution composition on soil hydraulic conductiv- ity. Soil Sci Soc Am Proc 30:308
Miyamoto S (1980) Effects of bicarbonate on sodium hazard of irrigation water: Alter- native formulation. Soil Sci Soc Am J 44:1079
Northcote KH, Skene JKM (1972) Australian soils with saline and sodic properties. CSIRO Australia Soil Publ No. 27
Quirk JP, Schofield RK (1955) The effect of electrolyte concentration on soil permeability. J Soil Sci 6:163
Shaw RJ, Yule DF (1978) The assessment of soils for irrigation, Emerald, Queensland. Queensland Dept Primary Indust, Agricultural Chemistry Branch, Technical Report No. 13
Shaw RJ, Hughes KK (1981) Salinity in Agriculture - A challenge for land management. Paper presented at 51st ANZAAS Congress, Section 13, Brisbane, May 1981
Smith GD, Coughlan KJ, Fox WE (1978) The role of texture in soil structure. In: Emerson WW, Bond RD, Dexter Al l (eds) Modification of soil structure. Chap 9. Wiley, Chi- chester
Soil Survey Staff (1975) Soil Taxonomy. A basic system of soil classification for making and interpreting soil surveys. U.S. Dept Agric, Agricultural Handbook No. 436, Washing- ton, USA, U.S. Government Printer, Washington
Suarez DL (1981) Relation between pH c and sodium adsorption ratio (SAR) and an alter- native method of estimating SAR of soil or drainage waters. Soil Sci Soc Am J 45:469
US Sal Lab Staff (1954) Diagnosis and improvement of saline and alkali soils. Handbook 60, US Dept Agric