predict reasons for refusal using information from ... · using information from telephone panel...
TRANSCRIPT
www.ssoar.info
Using information from telephone panel surveys topredict reasons for refusalLipps, Oliver
Veröffentlichungsversion / Published VersionZeitschriftenartikel / journal article
Zur Verfügung gestellt in Kooperation mit / provided in cooperation with:GESIS - Leibniz-Institut für Sozialwissenschaften
Empfohlene Zitierung / Suggested Citation:Lipps, Oliver: Using information from telephone panel surveys to predict reasons for refusal. In: Methoden, Daten,Analysen (mda) 6 (2012), 1, pp. 3-20. URN: http://nbn-resolving.de/urn:nbn:de:0168-ssoar-314544
Nutzungsbedingungen:Dieser Text wird unter einer Deposit-Lizenz (KeineWeiterverbreitung - keine Bearbeitung) zur Verfügung gestellt.Gewährt wird ein nicht exklusives, nicht übertragbares,persönliches und beschränktes Recht auf Nutzung diesesDokuments. Dieses Dokument ist ausschließlich fürden persönlichen, nicht-kommerziellen Gebrauch bestimmt.Auf sämtlichen Kopien dieses Dokuments müssen alleUrheberrechtshinweise und sonstigen Hinweise auf gesetzlichenSchutz beibehalten werden. Sie dürfen dieses Dokumentnicht in irgendeiner Weise abändern, noch dürfen Siedieses Dokument für öffentliche oder kommerzielle Zweckevervielfältigen, öffentlich ausstellen, aufführen, vertreiben oderanderweitig nutzen.Mit der Verwendung dieses Dokuments erkennen Sie dieNutzungsbedingungen an.
Terms of use:This document is made available under Deposit Licence (NoRedistribution - no modifications). We grant a non-exclusive, non-transferable, individual and limited right to using this document.This document is solely intended for your personal, non-commercial use. All of the copies of this documents must retainall copyright information and other information regarding legalprotection. You are not allowed to alter this document in anyway, to copy it for public or commercial purposes, to exhibit thedocument in public, to perform, distribute or otherwise use thedocument in public.By using this particular document, you accept the above-statedconditions of use.
3 Methoden — Daten — Analysen · 2012, Jg. 6, Heft 1, S. 3-20
Oliver Lipps
Using Information from Telephone Panel Surveys to Predict Reasons for Refusal
Prognose von Verweigerungs- gründen in telefonischen Panelbefragungen
AbstractOne of the key problems in conducting sur-veys is convincing people to participate. However, it is often difficult or impossible to determine why people refuse. Panel surveys provide information from previous waves that can offer valuable clues as to why peo-ple refuse to participate. If we are able to anticipate the reasons for refusal, then we may be able to take appropriate measures to encourage potential respondents to par-ticipate in the survey. For example, special training could be provided for interviewers on how to convince potential participants to participate. This study examines different influences, as determined from the previous wave, on refusal reasons that were given by the respondents in the subsequent wave of the telephone Swiss Household Panel. These influences include socio-demography, social inclusion, answer quality, and interviewer assessment of question understanding and of future participation. Generally, coef-ficients are similar across reasons, and between-respondents effects rather than within-respondents effects are significant. While ‘No interest’ reasons are easier to pre-dict, the other reasons are more situational.
ZusammenfassungVerweigerungen sind ein Hauptproblem in Befragungen. Oft ist es jedoch schwierig oder unmöglich zu bestimmen, warum man-che Leute verweigern. Panelbefragungen können helfen, Verweigerungsgründe vor-herzusagen, da Informationen von Respon-denten aus früheren Wellen vorliegen. Falls Eigenschaften von Verweigerern und von ihnen verwendete Verweigerungsgründe antizipiert werden können, lassen sich ge-eignete Maßnahmen treffen, diese Personen zur Teilnahme zu bewegen. Dazu zählt zum Beispiel ein spezielles Interviewer training zur Teilnahmeüberzeugung potentieller Re-spondenten. Wir untersuchen Effekte aus der vorherigen Welle auf spezifische Verweigerungsgründe im telefonisch erhobenen Schweizer Haus-halt Panel. Zu diesen Effekten zählen Sozio-Demografie, soziale Inklusion, Antwort-qualität, und Interviewereinschätzung über das Fragenverständnis und die zukünftige Teilnahme. Allgemein sind die Koeffizienten für die verschiedenen Verweigerungsgrün-de ähnlich, wobei eher zwischen-Personen Effekte als innerhalb-Personen Effekte si-gnifikant sind. Während ’Kein Interesse’ einfacher zu prognostizieren ist, spielen
4 Methoden — Daten — Analysen · 2012, Jg. 6, Heft 1, S. 3-20
1 Introduction1
Refusing to complete a survey is the most important reason for nonresponse, both in cross-sectional (e. g., Stoop et al. 2010) and especially in panel surveys (e. g., Lipps 2009). To prevent (final) refusal, most surveys that use random samples implement some refusal conversion (e. g. Lipps 2011) or refusal avoidance tech-nique (e. g., Schnell/Trappmann 2006). Good experiences with the strategy of tai-loring (Groves/Couper 1998; Stoop 2004), i. e., adapting the treatment of sample members according to their characteristics, attitudes towards surveys, previous survey experiences and behavior, further motivates this.
To improve adaptation strategies, using information about the reasons for refusal is generally recommended (Barnes et al. 2008). Phillips et al. (2002) note that “refusals can be for a variety of different reasons, and more information about this will enable a sensitive and appropriate response” (p. 45). As for final results of different reasons, it is interesting to note that people who show reluctance due to survey related reasons rather than non-survey related reasons like no time are the most difficult to convince (Phillips et al. 2002; Laurie et al. 1999). Dutwin and Herrmann (2005) report a higher refusal conversion rate following the reason ‘too busy’ (45 %) compared with ‘no interest’ (31 %). Burton et al. (2006), inves-tigating refusal conversion success in the British Household Panel Survey, report that many reasons for refusal are situational and a further attempt at a later date might be expected to be more successful in such cases. As a consequence, Burton et al. (2006) find that a relatively high proportion of people among the temporarily absent, who were almost never at home, where no household member was con-tacted by the end of fieldwork, or were looking after an ill or elderly person, return to the survey. Lipps (2011) reports similar findings in the Swiss Household Panel (SHP). Nonetheless, particular reasons have not been taken into account to improve refusal conversion programs. Predicting reasons for refusal can be a promising way to anticipate and take appropriate measures to prevent them (Menold/Zuell 2010), especially to distinguish more situational from survey related reasons.
1 This work uses data from the Swiss Household Panel (SHP). The SHP data are collected within the framework of the research programme “Living in Switzerland”, financed by the Swiss Na-tional Science Foundation. I wish to thank two anonymous reviewers for helpful comments.
Survey-specific issues are able to distin-guish different reasons to some extent.
bei den anderen Gründen situative Gründe eine grössere Rolle. Verschiedene Verweige-rungsgründe lassen sich zum Teil durch be-fragungsspezifische Unterschiede erklären.

5 Lipps: Using Information from Telephone Panel Surveys ...
At this point it must be noted that the willingness to participate or possible reasons for refusals in panel surveys may follow other patterns than in cross-sec-tional surveys. For example, panel members may be more motivated to participate in the panel survey for a certain time only. Or, different response patterns are possibly motivated by different factors. While most respondents become more and more committed, some become bored or uninterested over time or think they have done enough (Laurie et al. 1999). Watson and Wooden (2011) complain that “only rarely has any explicit consideration been given to the possibility that the magni-tude of relationships between response probabilities and hypothesized predictors and correlates might vary with the type of response pattern” (p. 3). A few stud-ies show that there may be some sort of “response continuum” in panel surveys: Lipps (2007) shows that the characteristics of respondents who drop out are simi-lar across waves, leading to an increased bias over time. Voorpostel (2010) com-pares panel members who drop out and those having irregular response patterns with loyal respondents. She finds that “in many ways the respondents who had an irregular response pattern positioned themselves in between the respondents who were interviewed in every wave and those who dropped out” (p. 374). Both findings are an indicator of similar motives to drop out irrespective of the duration of panel participation. As for the distribution of reasons over time, while Barnes et al. (2008) report more broken appointments in second and later waves in the UK labor force survey, the distributions are quite similar across waves. Olson and Klein (1980) find that the distribution of reasons for wave 1 refusals does not differ substantially from the distribution of reasons for refusal after the initial interview. Data from the first and second waves (1999 and 2000) of the SHP confirm this, with the exception of no interest reasons, which are split between simple ‘I am not interested’ and ‘I have done enough with the first wave interview’ in wave two. Note that a similar distribution of reasons for refusal across waves does not nec-essarily mean that the amount of truth of the reasons before and after the initial interview is the same (see discussion in chapter 2 below).
The present article is organized as follows: first, we examine if there is a rela-tionship between reasons for refusal stated and the true reasons in previous studies. To be able to accurately predict reasons for refusal we must be able to distinguish between real reasons and invented ones. Next, we review panel studies that analyze correlates with later panel refusal. In the absence of studies that distinguish spe-cific reasons for refusal we use these correlates to explain specific reasons relative to cooperation. We use respondent socio-demography, social inclusion, reported survey quality, characteristics of the previous interviewer and her assessments of respondent difficulty. Next we introduce the data and the modeling approach. We then discuss the model results with regard to refusal prevention strategies.
Methoden — Daten — Analysen · 2012, Jg. 6, Heft 1, S. 3-20 6
2 Truthfulness of Reasons for Refusal
To be able to predict reasons for refusal they must not be mentioned at random but should be associated with the true reason. Many surveys implicitly assume that this is actually the case: for example, if interviewers offer to call back at a more suitable moment when respondents claimed to have no time to answer the inter-view (e. g., Voogt 2004; Scherpenzeel 2011). In this section we review if reasons mentioned are related to characteristics of the respondents in the literature, in cross-sectional surveys on one hand and panel surveys on the other. In face-to-face surveys, reasons (like too old) related to visible characteristics (like old age) should correlate with these characteristics (Bates et al. 2008). Lipps and Kissau (2012) show that this is the case in a telephone survey as well, where frame infor-mation like old age or foreign nationality is positively correlated with reasons like health or language problems. A priori, this is not so clear for reasons like no time or no interest. In cross-sectional surveys, there is discordance about whether survey refusers state the true reason. Olson and Klein (1980) do not find socio-demo-graphic differences for refusal reasons. Abraham et al. (2006) report little evidence to confirm the hypothesis that busy people participate in surveys less often. Stoop (2005) finds that people who have less time are generally more likely to participate in surveys. Sztabinski et al. (2008), conducting in-depth interviews with refusers from the third round of the European Social Survey, report that people tend to refuse “flatly, without stating any reason” (p. 66). Such findings support doubts as to the truthfulness of reasons for refusal given (Rogelberg et al. 2003; Brehm 1993). Refusers may just look for an easy way to get rid of the interviewer. In addi-tion, in case that several reasons apply, they may just name the first reason they can think of. People may also give a reason which they think will be convincing for the interviewer and/or is socially accepted. In the qualitative study from Sztabin-ski et al. (2008), even refusers who generally demonstrate acceptance for surveys could not identify rational arguments that led to a refusal. However, Couper (1997) finds for ‘no interest’ and ‘too busy’ reasons that
”there appears to be systematic variation in [their] use by ... demographic charac-teristics .... Rather than viewing these two sets of statements as equivalent indi-cators of general reluctance, the use of ‘not interested’ and ‘too busy’ appears to reflect what we know about those who are not interested in politics and those who have less discretionary time available for activities such as surveys. This suggests a degree of truthfulness in these statements.” (p. 325)
7 Lipps: Using Information from Telephone Panel Surveys ...
Given these inconclusive findings in cross-sectional surveys, the degree to which refusal reasons are true should be higher in panel surveys, since respondents are well aware that there is usually a lot of information about them known to the inter-viewer.2 At the least, the respondent needs to give an argument why there should be a sudden disinterest, like ‘I have enough’ or ‘there was no change in my life so why do I have to repeat the answers every year?' Such an argument, in turn, should be correlated with the true reason in panel surveys to a relatively high extent. In fact, based on (open ended) interviewer documentations of final reasons for refus-als in the 2005 wave of the SHP, people often refer to previous experiences with the survey (e. g., no time are reasoned with a too long questionnaire, or no interest with the fact that nothing has changed in the family and that telling the same is a waste of time). Sometimes, special household circumstances are mentioned, like e. g., ’as you know my husband is very old and needs a lot of care such that I do not have the time’. Of course, there are always people who hang up immediately but these cases are rare after a certain number of panel waves. Based on this analysis, I conclude from the statements made that it is unlikely that - while the true reason is No interest - a respondent explains why she has, e. g., no time, because socially more accepted. First, the time the respondent has to invent a reason is too short and second, there is only a small incentive (stating a socially more accepted reason for refusal) to invest the cognitive effort to think about a wrong reason.
The only literature I found that helps determine the degree of truthfulness of reasons given for refusal in panel surveys is Barnes et al. (2008). The authors report that in later waves much less ‘Invasion of privacy’ reasons are given, as well as the reasons ‘Respondent does not believe in surveys’, ‘Respondent is anti-gov-ernment’, ‘Not capable’, or ‘Respondent dislikes survey subject matter’, compared to the first wave. The reason ‘Survey takes/took too long’ occurs more often in later waves. All this make sense given the respondent already took part in earlier waves, and knows both content and length of the survey. Also privacy concerns (DeMajo 1980) probably do not play a major role in a later wave of a panel survey.
2 From personal communication with interviewers who conduct interviews for the SHP. These interviewers try to discuss about the reason given and – given the respondent does not hang up immediately - generally have the impression that they can figure out the true reason, even if the first reason given was different.
Methoden — Daten — Analysen · 2012, Jg. 6, Heft 1, S. 3-20 8
3 Reasons for Refusal and Causes of Panel Non-Cooperation
We distinguish the following reasons for refusal:
• An appointment has been made, without fixing a date and time (‘call later’); ‘broken appointment (vague)’; BAv.
• An appointment has been made, with a date and time fixed, but the appoint-ment was broken ‘broken appointment (fixed)’; BAf.
• The respondent has no time; NT.• The respondent has no interest; NI. NI is probably less situational than the
aforementioned reasons.• The respondent has ‘other reasons’; OR. Although this reason is not specified
it is an important “rest” category (Dutwin/Herrmann 2005).
In the next section, we formulate expectations about correlates of specific refusal reasons. Generally, since reasons are related to the survey to a different extent, we expect that while NI reasons are easier to predict, BAv, NT, and in part BAf reasons are more situational. Unfortunately we are not able to further distinguish the cat-egory other reasons.
3.1 Broken Vague or Fixed Appointment
Not to keep a fixed appointment or never fixing a date and time but rather putting off interviewers by vague appointments can be expected from people who are either busy, or - perhaps more important - not courageous enough to give a clear-cut reason for refusal. It may be that although these persons find it too hard to argue with interviewers, they are probably not against the survey. Rather, they may be undecided. We suspect that these characteristics may be associated with little social participation and trust (Hill/Willis 2001; Uhrig 2008, Voorpostel/Lipps 2011), or language problems (Haunberger 2010). In addition, not keeping an appointment means not behaving according to norms of civic duty. Groves and Couper (1998) and Groves et al. (2000) argue that while older people are more likely to stick to such duties, younger sample members might feel less obliged to respect norms of social obligation. In addition, since contacting the same person again and again who repeatedly mention “call again” is more likely in smaller households, we sus-pect higher occurrence of broken appointments in small households. Since a fixed appointment is a stronger commitment than a vague appointment, we expect all effects and especially those related to social obligation stronger for BAf than BAv.
9 Lipps: Using Information from Telephone Panel Surveys ...
3.2 No Interest
No interest reasons are likely associated with little interest in politics (Couper 1997) and probably with a worse report quality (Pickery et al. 2001; Groves et al. 2004, De Keulenaer 2005). A bad report quality may stem from a lack of motivation and signals ‘satisficing’3 that is followed by a drop-out (Loosveldt/Carton 2001; Loosveldt et al. 2002). In addition, people who are hard to convince to partici-pate (Spiess/Kroh 2008; Uhrig 2008; Loosveldt/Carton 1997; Loosveldt et al. 2002), or those supposed not to repeat at the next wave by interviewers (Campanelli/O’Muircheartaigh 2002) are candidates for no interest reasons at the next wave survey request. To the contrary, we expect fewer no interest reasons amongst those with higher levels of education since the higher educated are more likely to see the utility of survey participation and the links between participation and the greater good (Groves/Couper 1998). In addition lower levels of participation and trust can be expected from people who mention no interest as well as higher levels of alienation (Couper 1997; Phillips et al. 2002).
Because NI reasons are less situational than the other reasons investigated, we expect more explanation power from the significant variables in the NI model compared with the other models.
3.3 No Time
Couper (1997) reports a much smaller number of significant covariates for respond-ents mentioning time-related concerns. According to Couper (1997), this suggests “no association between the use of ‘too busy’ in the introductory conversation and political interest … or participation” (p. 331). Also Stoop (2005) finds that “the respondents … being too busy … can hardly be distinguished from the reference groups in terms of the variables in the model. Being not able might be a situational reason for refusal that has probably less to do with a dislike of surveys … and therefore might just be coincidental” (p. 208). Other authors expect people stating no time more often among employed people and those with small children (Stoop 2004). Similarly, we expect younger people to state no time reasons more often and older people less often (Couper 1997). Also socially more involved people can be expected to be busier (Stoop 2005).
We include other reasons (OR) for comparison reasons.
3 I. e., instead of “optimally answering a survey question …, some respondents simply provide a satisfactory answer“ (Krosnick 1991: 213).
Methoden — Daten — Analysen · 2012, Jg. 6, Heft 1, S. 3-20 10
4 Data
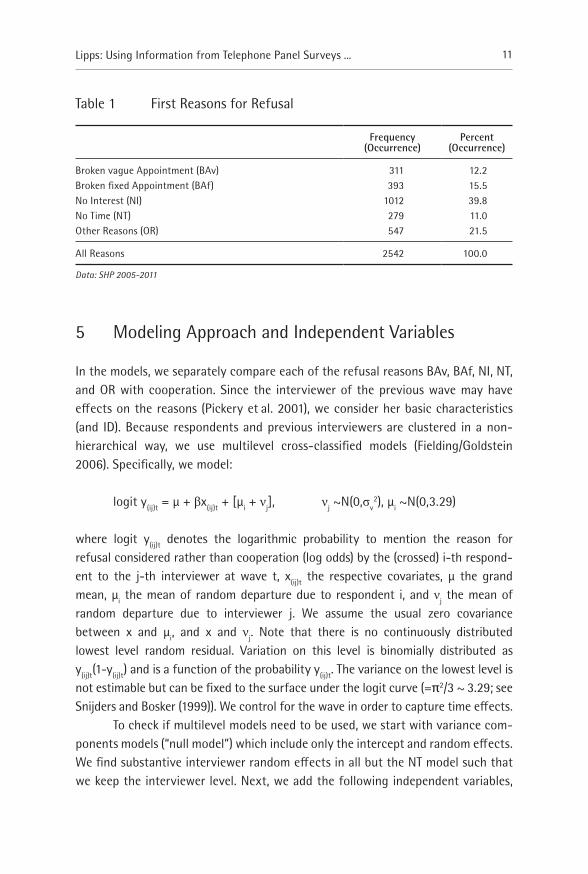
To test these expectations, we use data from the Swiss Household Panel (SHP). The SHP is designed to observe social change, in particular the dynamics of changing living conditions in Switzerland. Questions are about household composition and socio-demographics, health, well being and attitudes, politics, social networks, and economics. The SHP is a nationwide, annual centralized CATI panel survey that started in 1999 with a sample of 5,074 households, randomly drawn from the tel-ephone register and covering the Swiss residential population. The refreshment sample, first observed in 2004, consists of about 2,538 households selected in the same way. Each year, the household reference person is asked to first complete the household roster using the grid questionnaire. Conditional of the listing of all individuals in the household, all household members 14 years old and older are required to complete their individual questionnaires. In addition, interviewers are asked about their socio-demography, interview experience, and job satisfaction.4 We use matched data from respondents and their interviewers. Because respond-ents are assigned to interviewers completely at random the subsample of matched cases is not selective. In the modeling step, we will distinguish between the house-hold (reference person, when asked to complete the household grid) and the indi-vidual respondent (when asked to complete the individual questionnaire) level. We use data from 2004 to 2010 with the respectively related dependent variable (rea-sons for refusal, or cooperation as reference category) measured one wave after, i. e., from 2005 to 2011. The analysis sample amounts to 10,261 respondents each surveyed 3.3 times on average including cooperation and first reason for refusal if any, by a total of 312 interviewers. The distribution of the first reasons for refusal is given in Table 1.5
As for the results of possible refusal conversion attempts following these reasons for refusal, Lipps (2011) shows that on the household level, the chances of a successful refusal conversion after a broken appointment is 55 % higher rela-tive to the chances of a successful refusal conversion after another reason for refusal (odds ratio). This shows that on the household level, refusal conversion attempts especially pay off after a broken appointment. To the contrary, on the individual level, the odds of a successful refusal conversion after a no interest reason are 74 % lower compared with the odds of a successful refusal conversion after another reason for refusal.
4 The interviewer variables of the SHP are collected from interviewers by means of a paper and pencil questionnaire and are available for about 75 % of all interviews.
5 We exclude age, health or family related reasons.
11 Lipps: Using Information from Telephone Panel Surveys ...
Table 1 First Reasons for Refusal
Frequency (Occurrence)
Percent (Occurrence)
Broken vague Appointment (BAv) 311 12.2Broken fixed Appointment (BAf) 393 15.5No Interest (NI) 1012 39.8No Time (NT) 279 11.0Other Reasons (OR) 547 21.5
All Reasons 2542 100.0
Data: SHP 2005-2011
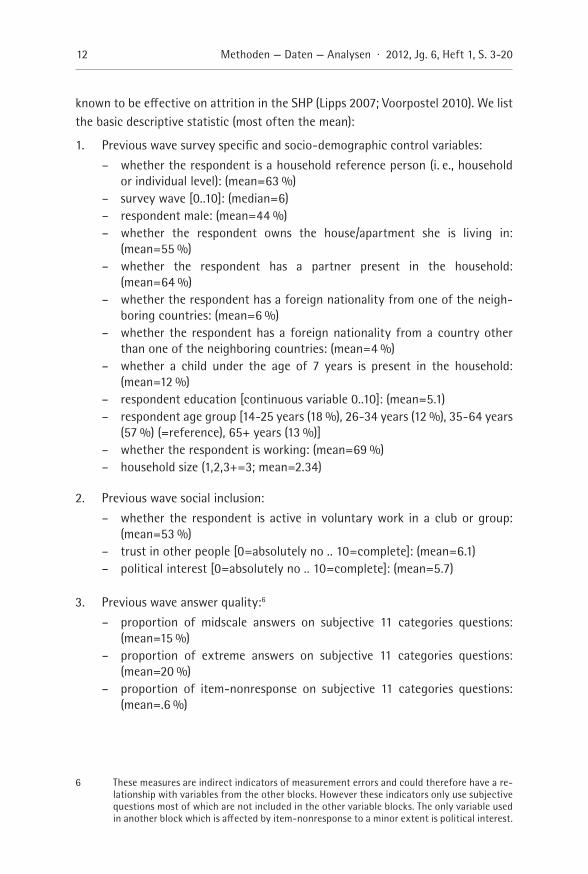
5 Modeling Approach and Independent Variables
In the models, we separately compare each of the refusal reasons BAv, BAf, NI, NT, and OR with cooperation. Since the interviewer of the previous wave may have effects on the reasons (Pickery et al. 2001), we consider her basic characteristics (and ID). Because respondents and previous interviewers are clustered in a non-hierarchical way, we use multilevel cross-classified models (Fielding/Goldstein 2006). Specifically, we model:
logit y(ij)t = μ + βx(ij)t + [μi + νj], νj ~N(0,σv2), μi ~N(0,3.29)
where logit y(ij)t denotes the logarithmic probability to mention the reason for refusal considered rather than cooperation (log odds) by the (crossed) i-th respond-ent to the j-th interviewer at wave t, x(ij)t the respective covariates, μ the grand mean, μi the mean of random departure due to respondent i, and νj the mean of random departure due to interviewer j. We assume the usual zero covariance between x and μi, and x and νj. Note that there is no continuously distributed lowest level random residual. Variation on this level is binomially distributed as y(ij)t(1-y(ij)t) and is a function of the probability y(ij)t. The variance on the lowest level is not estimable but can be fixed to the surface under the logit curve (=π2/3 ~ 3.29; see Snijders and Bosker (1999)). We control for the wave in order to capture time effects.
To check if multilevel models need to be used, we start with variance com-ponents models (“null model”) which include only the intercept and random effects. We find substantive interviewer random effects in all but the NT model such that we keep the interviewer level. Next, we add the following independent variables,
Methoden — Daten — Analysen · 2012, Jg. 6, Heft 1, S. 3-20 12
known to be effective on attrition in the SHP (Lipps 2007; Voorpostel 2010). We list the basic descriptive statistic (most often the mean):
1. Previous wave survey specific and socio-demographic control variables: – whether the respondent is a household reference person (i. e., household
or individual level): (mean=63 %) – survey wave [0..10]: (median=6) – respondent male: (mean=44 %) – whether the respondent owns the house/apartment she is living in:
(mean=55 %) – whether the respondent has a partner present in the household:
(mean=64 %) – whether the respondent has a foreign nationality from one of the neigh-
boring countries: (mean=6 %) – whether the respondent has a foreign nationality from a country other
than one of the neighboring countries: (mean=4 %) – whether a child under the age of 7 years is present in the household:
(mean=12 %) – respondent education [continuous variable 0..10]: (mean=5.1) – respondent age group [14-25 years (18 %), 26-34 years (12 %), 35-64 years
(57 %) (=reference), 65+ years (13 %)] – whether the respondent is working: (mean=69 %) – household size (1,2,3+=3; mean=2.34)
2. Previous wave social inclusion: – whether the respondent is active in voluntary work in a club or group:
(mean=53 %) – trust in other people [0=absolutely no .. 10=complete]: (mean=6.1) – political interest [0=absolutely no .. 10=complete]: (mean=5.7)
3. Previous wave answer quality:6
– proportion of midscale answers on subjective 11 categories questions: (mean=15 %)
– proportion of extreme answers on subjective 11 categories questions: (mean=20 %)
– proportion of item-nonresponse on subjective 11 categories questions: (mean=.6 %)
6 These measures are indirect indicators of measurement errors and could therefore have a re-lationship with variables from the other blocks. However these indicators only use subjective questions most of which are not included in the other variable blocks. The only variable used in another block which is affected by item-nonresponse to a minor extent is political interest.
13 Lipps: Using Information from Telephone Panel Surveys ...
4. Previous wave interviewer assessment of respondent understanding and will-ingness to continue:7
– whether the respondent understands questions well [0=no .. 2=absolu-tely]: (mean=1.91)
– whether the respondent is difficult to be convinced to participate [1=no .. 3=absolutely] : (mean=1.05)
– whether the respondent will repeat in next wave [0=no .. 3=absolutely]: (mean=2.73)
5. Previous wave interviewer: – experience as interviewer for survey agency [years] (mean=2.3) – interviewer male (mean=.32) – interviewer age [years] (mean=32) – interviewer-respondent sex match (Lipps 2010) (mean=52 %) – interviewer young (<30 years) and respondent young (Lipps 2010) (<35
years) (mean=18 %)
For most variables, we model both between-respondents (respondent specific means) and within-respondents (within-respondent de-meaned variables) effects (Brüderl 2010). If variables do not or hardly vary within respondents (sex, age, edu-cation level, nationality, club membership and home ownership), we only estimate between-respondent effects. Where we expect an effect from changes (wave, like-lihood to move, trust) we only estimate within-respondent effects. The rationale to consider both between-respondents and within-respondent effects is the follow-ing: while the within-respondent indicators capture causal effects of the respond-ent’s changed characteristics, the between-respondents indicators measure effects between different respondents.8 Generally, we expect fewer effects from within-respondent variables (Voorpostel/Lipps 2011). Interviewer variables are modeled as between-respondents effects.
7 Since the interviewer assessment values could be a consequence of the same underlying process that leads to non-participation, rather than a cause, one could conjecture an as-sociation between these variables and the survey wave. As it stands, the wave correlates positively with the respondent’s likelihood of repeating the survey, and negatively with the respondent’s difficulty, and these measures correlate with the different reasons for refusal in the expected way. Nevertheless, the correlation coefficients of these latter relationships vary greatly between different reasons for refusal, from a small .004 (respondent understanding and NT) to a high value of .073 (respondent difficulty and NI).
8 The latter may suffer from unobserved heterogeneity, see Brüderl (2010).

Methoden — Daten — Analysen · 2012, Jg. 6, Heft 1, S. 3-20 14
6 Results
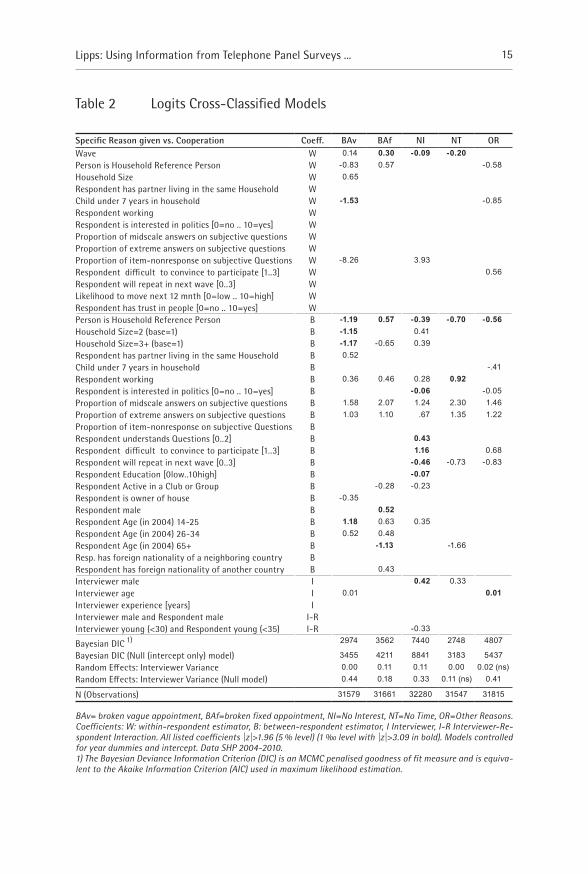
The results of the models are depicted in Table 2. First, we note that there are dif-ferent interviewer variances across the different reason for refusal models, both for the null and the full models. The BAv, NI, and OR null models contain comparatively high interviewer variances. This indicates that some of the previous interviewers are better able than others at motivating people not to use these reasons in the next wave. The interviewer variances decrease in all models after inclusion of the inde-pendent variables to an almost zero level. This shows that if the previous interviewer has an effect on reasons mentioned in the next wave, this is mostly the case for modeled characteristics only. In the BAf model however, although the interviewer random effects are small in the null model, they remain the highest after inclusion of the independent variables. This means that previous wave interviewers are similarly effective, irrespective of the (identifiable) respondent characteristics. The previous interviewer has no effects on NT reasons. This may be a first indication of a situ-ational reason.
Next we note that the Bayesian DIC difference between the null and the full models is much stronger in the NI model. This indicates that the people likely to choose a NI reason are easier to identify based on the variables included in the model. Probably NI reasons are less situational than other reasons for refusal.
Finally, with the exception of the questionnaire level (household/grid or indi-vidual) and the survey wave, few within-respondent effects are significant. It is thus between-respondent differences rather than within-respondent changed character-istics, attitudes or behavior, which are responsible for the reasons for refusal and which possibly distinguish the use of different reasons. It could be the case that seven years (2004-2010) is too short to capture enough within-respondent variation.
Based on the significant (5 % and especially the 1 ‰ level) regression coef-ficients, we characterize people that are more likely to use one of the reasons for refusal, and compare these with our expectations. Generally, if significant, the coefficients have the expected sign, although it is sometimes difficult to distin-guish people using different reasons for refusal. Although the coefficients are simi-lar across reasons, our expectations are met at least in parts.
15 Lipps: Using Information from Telephone Panel Surveys ...
Table 2 Logits Cross-Classified Models
Specific Reason given vs. Cooperation Coeff. BAv BAf NI NT ORWave W 0.14 0.30 -0.09 -0.20Person is Household Reference Person W -0.83 0.57 -0.58Household Size W 0.65Respondent has partner living in the same Household WChild under 7 years in household W -1.53 -0.85Respondent working WRespondent is interested in politics [0=no .. 10=yes] WProportion of midscale answers on subjective questions WProportion of extreme answers on subjective questions WProportion of item-nonresponse on subjective Questions W -8.26 3.93Respondent difficult to convince to participate [1..3] W 0.56Respondent will repeat in next wave [0..3] WLikelihood to move next 12 mnth [0=low .. 10=high] WRespondent has trust in people [0=no .. 10=yes] WPerson is Household Reference Person B -1.19 0.57 -0.39 -0.70 -0.56Household Size=2 (base=1) B -1.15 0.41Household Size=3+ (base=1) B -1.17 -0.65 0.39Respondent has partner living in the same Household B 0.52Child under 7 years in household B -.41Respondent working B 0.36 0.46 0.28 0.92Respondent is interested in politics [0=no .. 10=yes] B -0.06 -0.05Proportion of midscale answers on subjective questions B 1.58 2.07 1.24 2.30 1.46Proportion of extreme answers on subjective questions B 1.03 1.10 .67 1.35 1.22Proportion of item-nonresponse on subjective Questions BRespondent understands Questions [0..2] B 0.43Respondent difficult to convince to participate [1..3] B 1.16 0.68Respondent will repeat in next wave [0..3] B -0.46 -0.73 -0.83Respondent Education [0low..10high] B -0.07Respondent Active in a Club or Group B -0.28 -0.23Respondent is owner of house B -0.35Respondent male B 0.52Respondent Age (in 2004) 14-25 B 1.18 0.63 0.35Respondent Age (in 2004) 26-34 B 0.52 0.48Respondent Age (in 2004) 65+ B -1.13 -1.66Resp. has foreign nationality of a neighboring country BRespondent has foreign nationality of another country B 0.43Interviewer male I 0.42 0.33Interviewer age I 0.01 0.01Interviewer experience [years] IInterviewer male and Respondent male I-RInterviewer young (<30) and Respondent young (<35) I-R -0.33
Bayesian DIC 1) 2974 3562 7440 2748 4807
Bayesian DIC (Null (intercept only) model) 3455 4211 8841 3183 5437Random Effects: Interviewer Variance 0.00 0.11 0.11 0.00 0.02 (ns)Random Effects: Interviewer Variance (Null model) 0.44 0.18 0.33 0.11 (ns) 0.41
N (Observations) 31579 31661 32280 31547 31815
BAv= broken vague appointment, BAf=broken fixed appointment, NI=No Interest, NT=No Time, OR=Other Reasons. Coefficients: W: within-respondent estimator, B: between-respondent estimator, I Interviewer, I-R Interviewer-Re-spondent Interaction. All listed coefficients |z|>1.96 (5 % level) (1 ‰ level with |z|>3.09 in bold). Models controlled for year dummies and intercept. Data SHP 2004-2010.1) The Bayesian Deviance Information Criterion (DIC) is an MCMC penalised goodness of fit measure and is equiva-lent to the Akaike Information Criterion (AIC) used in maximum likelihood estimation.
Methoden — Daten — Analysen · 2012, Jg. 6, Heft 1, S. 3-20 16
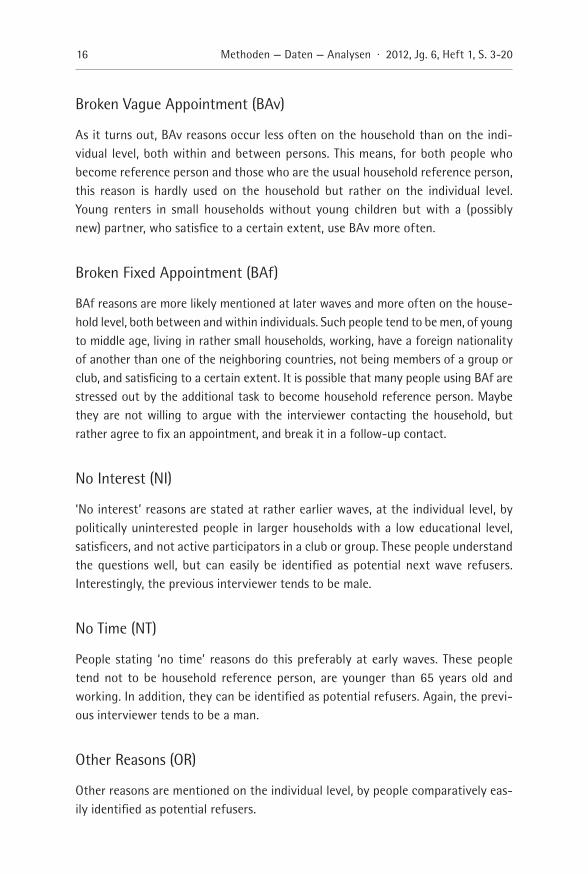
Broken Vague Appointment (BAv)
As it turns out, BAv reasons occur less often on the household than on the indi-vidual level, both within and between persons. This means, for both people who become reference person and those who are the usual household reference person, this reason is hardly used on the household but rather on the individual level. Young renters in small households without young children but with a (possibly new) partner, who satisfice to a certain extent, use BAv more often.
Broken Fixed Appointment (BAf)
BAf reasons are more likely mentioned at later waves and more often on the house-hold level, both between and within individuals. Such people tend to be men, of young to middle age, living in rather small households, working, have a foreign nationality of another than one of the neighboring countries, not being members of a group or club, and satisficing to a certain extent. It is possible that many people using BAf are stressed out by the additional task to become household reference person. Maybe they are not willing to argue with the interviewer contacting the household, but rather agree to fix an appointment, and break it in a follow-up contact.
No Interest (NI)
‘No interest’ reasons are stated at rather earlier waves, at the individual level, by politically uninterested people in larger households with a low educational level, satisficers, and not active participators in a club or group. These people understand the questions well, but can easily be identified as potential next wave refusers. Interestingly, the previous interviewer tends to be male.
No Time (NT)
People stating ‘no time’ reasons do this preferably at early waves. These people tend not to be household reference person, are younger than 65 years old and working. In addition, they can be identified as potential refusers. Again, the previ-ous interviewer tends to be a man.
Other Reasons (OR)
Other reasons are mentioned on the individual level, by people comparatively eas-ily identified as potential refusers.
17 Lipps: Using Information from Telephone Panel Surveys ...
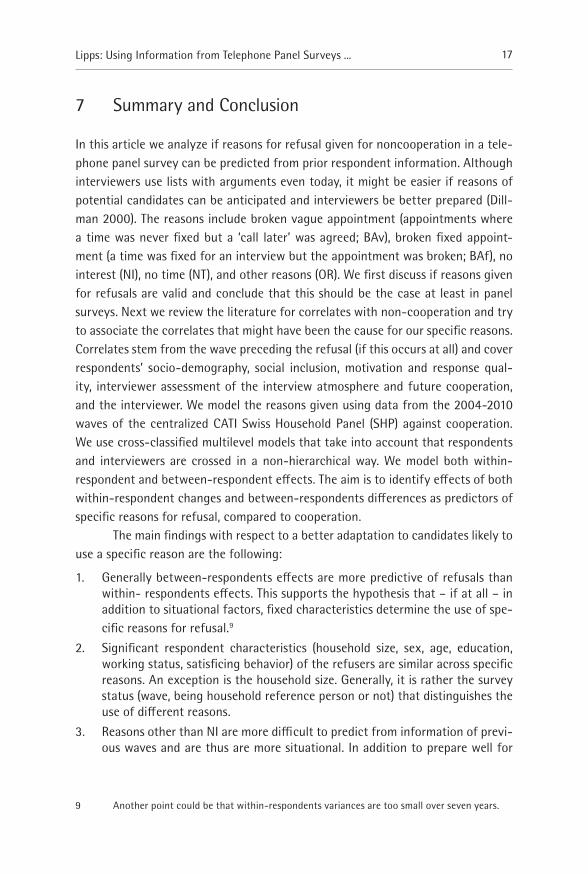
7 Summary and Conclusion
In this article we analyze if reasons for refusal given for noncooperation in a tele-phone panel survey can be predicted from prior respondent information. Although interviewers use lists with arguments even today, it might be easier if reasons of potential candidates can be anticipated and interviewers be better prepared (Dill-man 2000). The reasons include broken vague appointment (appointments where a time was never fixed but a ‘call later’ was agreed; BAv), broken fixed appoint-ment (a time was fixed for an interview but the appointment was broken; BAf), no interest (NI), no time (NT), and other reasons (OR). We first discuss if reasons given for refusals are valid and conclude that this should be the case at least in panel surveys. Next we review the literature for correlates with non-cooperation and try to associate the correlates that might have been the cause for our specific reasons. Correlates stem from the wave preceding the refusal (if this occurs at all) and cover respondents’ socio-demography, social inclusion, motivation and response qual-ity, interviewer assessment of the interview atmosphere and future cooperation, and the interviewer. We model the reasons given using data from the 2004-2010 waves of the centralized CATI Swiss Household Panel (SHP) against cooperation. We use cross-classified multilevel models that take into account that respondents and interviewers are crossed in a non-hierarchical way. We model both within-respondent and between-respondent effects. The aim is to identify effects of both within-respondent changes and between-respondents differences as predictors of specific reasons for refusal, compared to cooperation.
The main findings with respect to a better adaptation to candidates likely to use a specific reason are the following:
1. Generally between-respondents effects are more predictive of refusals than within- respondents effects. This supports the hypothesis that – if at all – in addition to situational factors, fixed characteristics determine the use of spe-cific reasons for refusal.9
2. Significant respondent characteristics (household size, sex, age, education, working status, satisficing behavior) of the refusers are similar across specific reasons. An exception is the household size. Generally, it is rather the survey status (wave, being household reference person or not) that distinguishes the use of different reasons.
3. Reasons other than NI are more difficult to predict from information of previ-ous waves and are thus are more situational. In addition to prepare well for
9 Another point could be that within-respondents variances are too small over seven years.
Methoden — Daten — Analysen · 2012, Jg. 6, Heft 1, S. 3-20 18
these situational reasons it might be a good idea to optimize calling times especially for respondents likely to state a non-NI reason, both with respect to making contact and to choosing a time which does not annoy people (Lipps 2012).
4. The fact that BAf occurs more often at the household level should be taken seriously, because a total household drop-out is more severe than a partial household drop-out. In addition, information from the household grid con-tains details on household composition and basic changes, which is important for sample weighting. Because of the higher importance of the household level, more effort should be invested at the start of the fieldwork.
5. As NT reasons tend to occur at earlier waves, special care should be taken to have good arguments ready for this reason once people are asked for the first time.
6. The fact that the previous wave interviewer plays a role is interesting. In par-ticular, that the interviewer in the wave preceding an NT and especially an NI refusal tend to be male deserves further research.
Limitations of this study are first the measurement of the reasons for refusal. The categories are somewhat rough and the coding is at the discretion of the inter-viewer. However Menold and Zuell (2010) report a sufficiently high intercoder-reli-ability when a suitable categorisation scheme is used. Nevertheless, more general models could be used in the case of mismeasured reasons for refusal (Hausman 2001). Second, we associated specific reason with correlates for non-cooperation in general reported in the literature. People using these reasons are to some extent similar when compared with cooperating respondents. More work needs to be done to find causes that are able to better discriminate between the specific reasons and to ground them on a more thorough theory. Third, the empirical part is based on only one survey which seems problematic for generalization. In particular it is questionable whether the findings hold for surveys that do not use the telephone survey mode, for instance face-to-face. Fourth, what is of course still lacking is a test if our recommendations are effective.
References
Barnes, W., G. Bright and C. Hewat, 2008: Making Sense of Labour Force Survey Response Rates. Economic & Labour Market Review 2 (12): 32-42.
Bates N., J. Dahlhamer and E. Singer, 2008: Privacy Concerns, Too Busy or Just Not Inte-rested: Using Doorstep Concerns To Predict Survey Nonresponse. Journal of Official Statistics 24 (4): 591-612.
Brehm, J., 1993: The Phantom Respondents. Opinion Surveys and Political Representation Ann Arbor, University of Michigan Press.
19 Lipps: Using Information from Telephone Panel Surveys ...
Brüderl, J., 2010: Kausalanalysen mit Paneldaten (engl.: Causal Analyses Using Panel Data). Pp. 963-994 in: C. Wolf and H. Best (Eds.): Handbuch der sozialwissenschaftlichen Da-tenanalyse, VS Verlag für Sozialwissenschaften.
Burton, J. and H. Laurie, 2006: The Long-Term Effectiveness of Refusal Conversion Procedu-res on Longitudinal Surveys. Journal of the Royal Statistical Society: Series A (Statistics in Society) 169: 459–478.
Campanelli, P. and C. O’Muircheartaigh, 2002: The Importance of Experimental Control in Testing the Impact of Interviewer Continuity on Panel Survey Nonresponse. Quality & Quantity 36: 129-144.
Couper, M., 1997: Survey Introductions and Data Quality. Public Opinion Quarterly 61 (2): 317-338.De Keulenaer, F., 2005: Using Process Data to Predict Attrition from a Panel Survey: A Case Stu-
dy. Proceedings of the Survey Research Methods Section, American Statistical Association.DeMajo, T., 1980: Refusals: Who, Where and Why. Public Opinion Quarterly 44 (2): 223-33.Dillman, D., 2000: Mail and Telephone Survey: The Tailored Design Method. New York: Wiley.Dutwin, D. and M. Herrmann, 2005: Finding Converts: Who Becomes a Refusal Conversion?
International Communications Research (ICR): Media.Fielding, A. and H. Goldstein, 2006: Cross-Classified and Multiple Membership Structures
in Multilevel Models: An Introduction and Review. Research Report RR791, Department for Education And Skills, University of Birmingham.
Groves, R., E. Singer, and A. Corning, 2000: Leverage-Saliency Theory of Survey Participati-on. Public Opinion Quarterly, 64: 299-308.
Groves, R. and M. Couper, 1998: Nonresponse in Household Interview Surveys. New York: Wiley.Groves, R., S. Presser and S. Dipko, 2004: The Role of Topic Interest in Survey Participation
Decisions. Public Opinion Quarterly 68 (1): 2-31.Haunberger, S., 2010: The Effects of Interviewer, Respondent and Area Characteristics on Co-
operation in Panel Surveys: A Multilevel Approach. Quality and Quantity 44: 957-969.Hausman, J., 2001: Mismeasured Variables in Econometric Analysis: Problems from the
Right and Problems of the Left, Journal of Economic Perspectives 15 (4): 57-67.Hill, D. and R. Willis 2001: Reducing Panel Attrition. A Search for Effective Policy Instru-
ments. Journal of Human Resources, 36, 416-438.Krosnick, J., 1991: Response Strategies for Coping with the Cognitive Demands of Attitude
Measures in Surveys. Applied Cognitive Psychology 5: 213-236.Laurie, H., R. Smith and L. Scott, 1999: Strategies for Reducing Nonresponse in a Longitudi-
nal Panel Survey. Journal of Official Statistics, 15 (2): 269-282.Lipps, O., 2007: Attrition in the Swiss Household Panel. Methoden – Daten – Analysen 1: 45-68.Lipps, O., 2009: Attrition of Households and Individuals in Panel Surveys. SOEPpapers 164.Lipps, O., 2010: Does Interviewer-Respondent Socio-demographic Matching Increase Co-
operation in Centralized CATI Household Panels? Survey Practice (August 2010).Lipps, O., 2011: Refusal Conversion in Telephone Panels: Is It Worth It? Paper 3-11, Swiss
Household Panel, Lausanne, http://aresoas.unil.ch/workingpapers/WP3_11.pdf (13.3.2012).Lipps, O. 2012: A Note on Improving Contact Times in Panel Surveys. Field Methods 24 (1):
95-111.Lipps, O. and K. Kissau (2012): Nonresponse in an Individual Register Sample Telephone
Survey in Lucerne/Switzerland. Pp. 187-208 in: M. Häder, S. Häder, and M. Kühne (Eds.): Telephone Surveys in Europe: Research and Practice. Heidelberg: Springer.
Loosveldt, G., J. Pickery and J. Billiet, 2002: Item Nonresponse as a Predictor of Unit Nonre-sponse in a Panel Survey. Journal of Official Statistics 18 (4): 545-557.
Loosveldt, G. and A. Carton, 1997: Evaluation of Nonresponse in the Belgian Election Panel Study ‘91-‘95. Proceedings of the Survey Research Methods Section, American Statis-tical Association.
Loosveldt, G. and A. Carton, 2001: An Empirical Test of a Limited Model for Panel Refusals. International Journal for Public Opinion Research 13 (2): 173-185.
Methoden — Daten — Analysen · 2012, Jg. 6, Heft 1, S. 3-20 20
Menold, N. and C. Zuell, 2010: Reasons for Refusals, their Collection in Surveys and Interviewer Impact. GESIS-Working Papers 2010/11, Mannheim. http://www.gesis.org/fileadmin/upload/forschung/publikationen/gesis_reihen/gesis_arbeitsberichte/Working_Paper_2010_11_online.pdf (1.3.2012).
Nicoletti, C. and N. Buck, 2004: Explaining Interviewee Contact and Co-Operation in the British and German Household Panels. ISER Working Paper 6/2004. Colchester: University of Essex.
Olson, J. and R. Klein, 1980: Interviewers‘ Perceptions of Reasons for Participation Refusal in a National Longitudinal Survey, 1979-1980. Proceedings of the Section on Survey Research Methods: 552-557. Washington, DC: American Statistical Association.
Pickery, J., G. Loosveldt and A. Carton, 2001: The Effects of Interviewer and Respondent Characteristics on Response Behaviour in Panel Surveys. Sociological Methods & Re-search 29 (4): 509-523.
Phillips, M., C. Woodward, D. Collins, and W. O’Connor, 2002: Encouraging and Maintaining Participation in the Families and Children Survey: Understanding Why People Take Part. National Centre for Social Research. Working Paper 6. London: Department for Work and Pensions.
Scherpenzeel, A., 2011: Data Collection in a Probability-Based Internet Panel: How the LISS Pa-nel Was Built and How It Can Be Used. Bulletin of Sociological Methodology 109 (1): 56-61.
Schnell, R. and M. Trappman, 2006: The Effect of the Refusal Avoidance Training Experi-ment on Final Disposition Codes in the German ESS-2, Working Paper 3/2006, Germany: Center for Quantitative Methods and Survey Research, University of Konstanz.
Snijders, T. and R. Bosker, 1999: Multilevel Analysis. Newbury Park, California: Sage.Spiess, M. and M. Kroh, 2008: Documentation of Sample Sizes and Panel Attrition in the Ger-
man Socio Economic Panel (SOEP) (1984 until 2006). Data Documentation 27, DIW Berlin.Stoop, I., 2004: Surveying Nonrespondents. Field Methods 16 (1): 23-54.Stoop, I., 2005: The Hunt for the Last Respondent: Nonresponse in Sample Surveys. PhD
Thesis, Utrecht University.Stoop, I., J. Billiet, A. Koch, and R. Fitzgerald, 2010: Improving Survey Response: Lessons
Learned from the European Social Survey. Chichester: John Wiley & Sons.Sztabinski, P., A. Dyjas-Pokorska, and T. Zmijewska-Jedrejczyk, 2008: Understanding Refu-
sals. Polish Academy of Sciences, Institute of Philosophy and Sociology, Warsaw.Uhrig, N., 2008: The Nature and Causes of Attrition in the British Household Panel Survey.
ISER Working Paper 5/2008. Colchester: University of Essex.Voogt, R., 2004: I Am Not Interested: Nonresponse Bias, Response Bias and Stimulus Effects
in Election Research. PhD dissertation, University of Amsterdam, Amsterdam.Voorpostel, M., 2010: Attrition Patterns in the Swiss Household Panel by Demographic Cha-
racteristics and Social Involvement. In Lipps, O., R. Tillmann, U. Kuhn, and D. Lillard (Eds.): Longitudinal Analysis in Switzerland. Special Issue of the Swiss Journal of Socio-logy 2/2010.
Voorpostel, M. and O. Lipps, 2011: Attrition in the Swiss Household Panel: Is Change Associ-ated with Later Drop-Out? Journal of Official Statistics 27 (2): 301-318.
Watson, N. and M. Wooden, 2011: Re-Engaging with Survey Non-Respondents: The BHPS, SOEP and HILDA Survey Experience. SOEPpapers 379.
Address of the Author PD Dr. Oliver Lipps FORS c/o University of Lausanne, Vidy CH - 1015 Lausanne [email protected]