pre- versus post-crisis central banking in qatar
TRANSCRIPT

Journal of Policy Modeling 36 (2014) 330–352
Available online at www.sciencedirect.com
ScienceDirect
Pre- versus post-crisis central banking in Qatar�
Elsayed Mousa Elsamadisy, Khalid Rashid Alkhater, Syed Abul Basher ∗Department of Research and Monetary Policy, Qatar Central Bank, PO Box 1234, Doha, Qatar
Received 11 November 2013; received in revised form 23 November 2013; accepted 19 January 2014Available online 31 January 2014
Abstract
In the years before the global financial crisis of 2008–2010, Qatar experienced a huge build-up of liquiditysurplus in the banking system, mainly driven by surging net capital inflows. This paper identifies varioussources of interbank liquidity in Qatar and discusses the various implications of structural primary liquiditysurplus for the money market in particular and the economy at large. The paper attempts to evaluate theQatar Central Bank policy making and conduct during the pre- and post-crisis periods within a framework ofthe Austrian monetary overinvestment theories, and concludes that the central bank had forcibly committedseveral forced monetary policy mistakes, which resulted in a breakdown in the interest rate channel of themonetary policy transmission mechanism. This led to the inability of the central bank to control the interbankinterest rate and to an accelerating inflation rate during the pre-crisis years. In contrast, a dramatic changein the central bank’s monetary policy framework and a deliberate monetary policy mistake on behalf ofthe central bank resulted in a restoration of the interest rate channel of the monetary policy transmissionmechanism, stabilization of the interbank interest rate close to the central bank’s policy rate and a sharpdeceleration in the inflation rate in the post-crisis period. The paper concludes by offering brief policyrecommendations.© 2014 Society for Policy Modeling. Published by Elsevier Inc. All rights reserved.
JEL classification: E51; E52; E58
Keywords: Monetary policy framework; Monetary policy mistakes; Liquidity management; Structural liquidity surplus;Financial crisis
� We are grateful to four anonymous referees and the editor-in-chief for their constructive suggestions. We thank CherinHamadi for excellent research assistance and Megan Foster for help with proofreading. The views expressed here arethose of the authors and do not reflect the official view of the Qatar Central Bank.
∗ Corresponding author. Tel.: +974 44456490; fax: +974 44416771.E-mail addresses: [email protected] (E.M. Elsamadisy), [email protected] (K.R. Alkhater),
[email protected] (S.A. Basher).
0161-8938/$ – see front matter © 2014 Society for Policy Modeling. Published by Elsevier Inc. All rights reserved.http://dx.doi.org/10.1016/j.jpolmod.2014.01.003

E.M. Elsamadisy et al. / Journal of Policy Modeling 36 (2014) 330–352 331
1. Introduction
The Gulf Cooperation Council (GCC)1 countries have emerged as one of the most financiallyliquid regions in the world on account of the unprecedented economic boom triggered by high oilprices during the last decade. The current account balance of the GCCs went up from US$32 billionin 2001 to US$256 billion in 2008, compared to the members of the Organization of PetroleumExporting Countries (OPEC),2 whose current account rose from US$19 billion to US$184 bil-lion over the same period. Fig. 1, adapted from Peeters (2011), illustrates the composition ofgross flows of the GCC’s current and capital account over this period. As Fig. 1 shows, totalportfolio investment outflows outstripped total portfolio inflows, reflecting the accumulation ofhydrocarbon revenues by the GCC countries. Since 2003, government current spending has risencumulatively by 58%, mainly reflecting rising wages and subsidies (International Monetary Fund(IMF), 2008). A policy mix of an expansionary fiscal stance and an easy monetary stance (importedvia fixed exchange rates) resulted in growing economic deficits to be monetized by the centralbanks.
The incidence of a liquidity surplus, in its broader sense, has been a common phenomenonobserved across the GCC region during oil-price booms. The GCC’s high surplus led to strongdomestic aggregate demand. Over a span of six years, the average annual growth in privateconsumption jumped from 8% in 2003 to over 24% in 2008, with Saudi Arabia exhibiting anearly five-fold increase, and Oman and Qatar both presenting a four-fold increase. Gross capitalformation increased from about 35% of the non-oil GDP in 2003 to about 48% in 2007 (IMF,2008). Investments were broad-based in all countries except the UAE, where they were moreconcentrated in construction (Khamis et al., 2010). Robust aggregate demand (including exports)led to strong economic growth: over the 2003–2008 period, GCC countries grew at an annualaverage real rate of 7%. This impressive economic performance has been accompanied by ageneral increase in consumer prices. Average headline inflation jumped from 1.5% in 2003 to10.6% in 2008, with considerable variation in the level and volatility of in inflation rates acrossthe six countries.3
Being no exception within the GCC, Qatar has witnessed a gradual accumulation of net capitalinflows since mid-2000 owing to hydrocarbon revenues, geo-political and geo-economic develop-ments. In particular, accumulation of foreign reserves on the asset side of the Qatar Central Bank’s(QCB’s) balance sheet can be traced back to the fraction of hydrocarbon revenues injected intothe domestic economy via (i) the government budget; (ii) net private sector’s foreign borrowing;(iii) foreign direct investment (encompassing the cash portion of hydrocarbon-related investmentand real estate purchase); and (iv) net short-term foreign portfolio investments (including stocks,bonds, bank deposits, etc.). Moreover, Qatar witnessed a further remarkable surge in foreigncurrency inflows beginning in late 2007, due to a speculative revaluation attack on the QatariRiyal (QR). Such net inflows resulted in surges in the economic deficit4 that the QCB had tomonetize. This, in turn, resulted in the accumulation of abundant QR liquidity on the liabilities
1 The GCC countries include Bahrain, Kuwait, Oman, Qatar, Saudi Arabia and the United Arab Emirates (UAE).2 These include Algeria, Angola, Ecuador, Iran, Iraq, Libya, Nigeria and Venezuela. Among the GCC countries, Kuwait,
Qatar, Saudi Arabia and the UAE are OPEC members. The authors’ calculations are based on the World Economic OutlookDatabase, April 2011, International Monetary Fund.
3 All numbers, unless otherwise stated, are authors’ own calculations based on national sources.4 By economic deficit, we mean the proportion of government expenditure financed by hydrocarbon revenues minus
the net private sector’s transactions compared to the rest of the world.

332 E.M. Elsamadisy et al. / Journal of Policy Modeling 36 (2014) 330–352
Fig. 1. Composition of gross flows of the capital and current accounts of the GCC countries.Source: Peeters (2011).
side of the central bank’s balance sheet. This was not sterilized because, unlike some GCC centralbanks, QCB lacked a number of standard liquidity management tools that are commonly usedto drain liquidity off the interbank market. Without effective liquidity management instruments,the imported Federal Reserve (hereafter Fed) easy monetary policy stance became over effectiveduring the pre-crisis period.
This was a serious concern for QCB as the interest rate channel of the monetary transmissionmechanism was weakened, and because the potential pass-through of the interbank liquiditysurplus to the general consumer price level. Going beyond acknowledging the threat of risinginflation and the subsequent appreciation of the QR real exchange rate, an accumulation of liquiditysurplus in the interbank money market posed serious threats to the stability of the financialsystem, including risks posed by credit and asset prices booms, and sectoral entities’ balance

E.M. Elsamadisy et al. / Journal of Policy Modeling 36 (2014) 330–352 333
sheet vulnerabilities. From a policy perspective, identifying the various channels of liquiditysurplus is vital.
The present paper endeavors to evaluate the QCB’s experience in managing liquidity in theinterbank market under conditions of a structural primary liquidity surplus (PLS) and to providerelevant policy recommendations. Although this paper deals with the experience of Qatar, ouranalysis may be appropriate for other GCC economies. The rest of the paper is organized asfollows: Section 2 introduces the concepts of primary liquidity and structural PLS, and discussesseveral sources of primary liquidity in the context of the Qatari economy. Section 3 presentsimportant corollaries of the structural liquidity surplus in Qatar. Section 4 focuses on QCB’sprimary liquidity management within the pre-crisis QCB monetary policy framework. In Section5, we discuss significant post-crisis changes in the QCB monetary policy framework, QCB’smonetary policy conduct and the conduct of its liquidity policy. Section 6 attempts to evaluateQCB’s pre- and post-crisis experiences. Section 7 concludes the paper and presents some policyrecommendations.
2. Primary liquidity surplus5
The phrase “liquidity” is used in practical central banking in the context of a wide range ofmeasures of the quantity of money (encompassing the whole spectrum of monetary aggregates).Yet, in this paper, we focus on the narrowest liquidity concept most relevant for day-to-day centralbanking commonly known as “interbank liquidity”, “money market liquidity”, “QR liquidity”, or“primary liquidity.” Primary liquidity encompasses the entirety of free reserves held – voluntarilyand involuntarily – by the depository institutions in their current deposit (settlement) accounts atthe central bank. Voluntarily held free reserves are “excess reserves”, conventionally defined asthe precautionary demand for banks’ reserves,6 while involuntarily held free reserves in excess ofprecautionary balances are a primary liquidity surplus. Where and when the cash flows into themoney market exceed the cash flows drained into the central bank, the phenomenon of PLS occurs.If such a phenomenon persists for extended period, we have the phenomenon of “structural” PLS.The same process works in reverse for a structural primary liquidity shortage.
2.1. Sources of PLS
Sources of PLS in Qatar can be classified into two categories typically dubbed “pull” and“push” factors. Pull factors operate via the traditional balance of payment transmission mecha-nism (leading to higher government spending financed by converting foreign currency into QRthrough the local banking sector) attracting capital inflows as a result of positive changes in thedomestic economic conditions. These include political stability, robust economic growth, assetprice increases, etc. In contrast, push factors include higher export revenues causing a currentaccount surplus, as well as investment income inflows via the income account of the balance ofpayments. Push factors operate via the budgetary transmission mechanism. Thus, sources of PLSinclude: (i) current account surplus; (ii) private capital account flows; (iii) low policy interestrates; and (iv) a speculative revaluation attack on the QR.
5 This section draws heavily on Elsamadisy (2010a, 2010b).6 Since these deposits are held at the discretion of the banks, they are known as “free” or “excess” reserves. See Bindseil,
Camba-Mendez, Hirsch, and Weller (2006), for an illustration of the role of excess reserves in the implementation ofmonetary policy in settlement accounts in the context of the European Central Bank.

334 E.M. Elsamadisy et al. / Journal of Policy Modeling 36 (2014) 330–352
2.1.1. Current account surplusQatar has been running current account surpluses since 1999. Yet, the size of the current account
surplus increased noticeably during 2003–2008, thanks to the sustained increase in internationaloil prices. This surplus rose from about $6 billion (25% of GDP) in 2003 to $34.57 billion (31%of GDP) by 2008.7 Oil and gas are priced, invoiced and paid for in US dollars directly to thestate. As such, current account surpluses do not automatically generate liquidity in the domesticbanking system. Rather, it is the utilization of this surplus to finance public spending via thebudgetary transmission mechanism8 that results in a downward shift in the supply of US dollarsin the domestic foreign exchange market, forcing on-demand QCB purchases of dollars. Thisresults in foreign exchange assets being injected on the assets side, and free reserves on theliabilities side of the central bank’s balance sheet, thus accumulating free reserves in the bankingsystem.
2.1.2. Private capital account flowsNet inflows through the capital and financial accounts of the private sector’s balance of pay-
ments constituted a significant source of QCB’s foreign reserves. Foreign direct investment (FDI),portfolio investments (including financial FDI), reluctance of private capital surpluses to outflowand repatriation of private overseas investments (due to the changes in the geo-political and geo-economic environments in the aftermath of the 9/11 attacks) were the most important determinantsof net capital inflow during the pre-crisis period. FDI inflows to Qatar have substantially increasedfrom an average of $0.6 billion in 2003–2004 to over $4.5 billion in 2007–2008 due to growinginvestment in energy and construction projects as well as notable improvements in the businessenvironment.9 These inflows were bolstered by rising oil prices that formed the basis for robusteconomic growth (UNCTAD, 2009).
After September 11, 2001, many Arab investors investing in Western countries faced diplo-matic risk “arising from Western countries’ sensitiveness about terrorism and the potential forunexpected deterioration in relations between Arab and Western countries” (Habibi, 2008, p. 14).Growing fears of confiscation or asset-freezing by host governments led small- and medium-sized GCC private investors to withdraw their funds from Western countries in favor of morepolitically “safe” investment opportunities. In addition to the fear of litigation and asset freez-ing, after 9/11, obtaining a US travel visa has become more difficult for Arab businessmenowing to security concerns (Habibi, 2008). In the meantime, political stability and the resilientdomestic economy presented strong “pull factors” attracting the Qatari and non-Qatari (par-ticularly from within the GCC) private capital surpluses invested in the West to head backhome.
7 The authors’ calculation are based on the World Economic Outlook database (October 2010), International MonetaryFund.
8 In financing public spending programs, the government sells a portion of its dollar proceeds to the commercial banksin exchange for QR and thus, ceteris paribus, generates a downward shift in the US dollar supply in the domestic marketfor foreign exchange. When the government’s dollar sales exceed the total quantity of foreign currency necessary tofinance the private sector’s net commodity imports, net capital exports, net income transfers and expatriate remittances,the residual amount finds its way to the assets side of the central bank’s balance sheet via on-demand purchases of USdollars. This residual is nothing but the economic deficit that the QCB has to monetize and therefore results in an injectionof free reserves on the liabilities side of the central bank’s balance sheet, i.e. an injection of primary liquidity in theinterbank money market (e.g., Elsamadisy, 2003a).
9 Among the Middle East and North African countries, Mina (2010) found that Qatar consistently attracted FDI flowswith a positive and highly statistically significant country dummy coefficient.

E.M. Elsamadisy et al. / Journal of Policy Modeling 36 (2014) 330–352 335
In a nutshell, rising capital inflows were, ceteris paribus, a liquidity-creating factor workingthrough the conventional balance of payments transmission mechanism. This resulted in a furtherdownward shift in the supply of the US dollar in the domestic foreign exchange market, forcingfurther on-demand central bank purchases of the dollar that resulted in an injection of foreignexchange assets on the assets side, and free QR reserves on the liabilities side of the central bank’sbalance sheet, thus generating primary liquidity.
2.1.3. Low policy interest ratesThe then prevailing global environment of low policy interest rates, owing to the stimulat-
ing monetary policy stance adopted by major central banks, resulted in easing global financialmarkets. These policies triggered capital flows looking for higher yield into emerging marketeconomies, particularly those with fixed exchange rate arrangements (where there is little orno exchange rate risk). Meanwhile, low interest rates abroad reduced liquidity leakage out ofdomestic economies. In Qatar, despite the low policy rates due to the QR peg, net foreign cur-rency inflows generated upward pressure on the home currency and forced home currency salesby the central bank. Foreign exchange assets were thus injected on the assets side and freereserves on the liabilities side of its balance sheet, accumulating primary liquidity in the bankingsystem.
2.1.4. A speculative revaluation attack on the QRSpeculative revaluation attacks are triggered when and where a home currency is considerably
undervalued. Under a fixed exchange rate, speculative foreign exchange assets accumulate at thecentral bank and speculative home currency funds accumulate in the banking system, leading tothe accumulation of free reserves in the banks’ current deposits accounts at the central bank, which,therefore, augment an existing PLS or create one. By October 2007, short-term speculative fundshad started accumulating in the banking system, with the conjecture that a weakening US dollarand low US interest rates might force the Qatari authorities to revalue the QR. Economic argumentsfor a revaluation were growing stronger as Qatar’s average annual rate of inflation (15%) helped toaccelerate the real effective exchange rate appreciation, while the nominal effective exchange ratewas heading downward due to the weakening dollar. The inability of QCB to sterilize the largenet inflow added further impetus to trigger speculative pressure on the peg. The revaluation attackmaterialized and started showing up as brisk growth in primary liquidity in late October 2007.Potential interbank liquidity rose sharply from QR2.98 billion to a local maximum of QR24.63billion by about mid-December 2007 before reaching its global peak of QR38.74 billion by aboutmid-April 2008.10
3. Corollaries of structural PLS
Structural PLS in the interbank market in the years before the global financial crisis had seriousrepercussions for the economy of Qatar, which faces a serious problem of limited absorptivecapacity that cannot be addressed in the short-run. Below we discuss some corollaries of thestructural PLS documented in Qatar during the pre-crisis period.
10 Potential liquidity is defined as the balance of free reserves plus the Qatar Money Market Rate Mechanism’s (QMR’s)net deposits balance. The QMR is a double-featured QCB standing facility where participating banks can obtain loansfrom and place deposits with the QCB at pre-specified rates for maturity ranging from 1 to 30 days.

336 E.M. Elsamadisy et al. / Journal of Policy Modeling 36 (2014) 330–352
3.1. The central bank was no longer a price setter
Since a central bank is the monopoly supplier of the home currency, one undesirable implicationof a structural PLS is the loss of the central bank’s status as a price (marginal cost) setter in theinterbank market. To appreciate this point, consider the converse condition of a liquidity shortagein the banking sector where a central bank engages in credit transactions with the depositoryinstitutions. Being a net creditor to the banking sector, the central bank acts as a price setter in themarket for banks’ reserves, where such transactions operate on the liabilities side of the depositoryinstitutions’ balance sheets. This privilege of setting the marginal costs of the banks’ reserves islost when a structural PLS exists in the banking system.
With a structural PLS, the central bank will rather endeavor to attract banks to access its openmarket operations and open market type operations’ sales, and/or to access its standing depositsfacilities. That is, a central bank intervenes to withdraw rather than to inject liquidity, wherethe transactions operate on the assets rather than the liabilities side of the commercial banks’balance sheets. In other words, the central bank attempts to set the marginal yield on banks’ assetsrather than the marginal cost of their liabilities. It is then said that the central bank’s balancesheet is assets-driven. Yet, the central bank is not a monopoly supplier of financial assets per se(although it still has the status of the last borrower (buyer) of the depository institutions’ reserves).Consequently, when a structural PLS situation exists, the central bank may not always be ableto drain the surplus. In such cases, while there is neither a risk of failure to meet the requiredreserves nor a risk of a payment system failure, there are corollaries to the structural surplus thattypically run counter to the policy goals of the central bank. Cash flows into the market for banks’reserves continue to exceed the amount of cash flows drained into the central bank. Exogenousand policy-driven rises in the central bank’s foreign assets generate balance sheet expansions inexcess of those needed to accommodate the economy’s demand for the central bank’s monetaryliabilities in the form of central bank money.
3.2. Weakening the interest rate channel of the monetary transmission mechanism
When there is a structural shortage of liquidity in the interbank market, changes in the centralbank policy rates are fully and rapidly reflected in changes in interbank rates (hence the retailinterest rates). Conversely, a structural PLS has the potential to disrupt this interest rate channel,so it breaks down or become weak. The central bank practically loses its ability to influence themoney market rates. The depository institutions may lend their surplus reserves to the centralbank – or otherwise – at their discretion. Consequently, the central bank’s ability to transmit itspreferred interest rate into the market is weakened. Indeed, the interbank rates will tend towardzero under a massive structural PLS. Fig. 2 illustrates this point. The weighted average overnightinterbank rate in Qatar (QIBOR) declined from over 4% in October 2007 to 0.75% by the year’send; since then, it remained below 1% (with some fluctuations in the intervening months, includingits lowest level at 0.15% in the third week of March 2008). As the left panel of Fig. 2 shows,over the 2007:Q3–2008:Q3 period, the QIBOR stood lower than the QCB’s deposit interest rate(QCBDR), suggesting a breakdown of the transmission of the central bank’s rate into the interbankrate. The immediate consequence is that the shorter-term interbank interest rates can potentiallyfall close to zero. The implication is that banks would make riskier loans and/or move into foreigncurrencies in a search for yield, or they may cease to accept interest-bearing customer deposits.The right panel of Fig. 2 shows that QIBOR had fallen sharply below the federal funds rate (FFR)and/or the London interbank offered rate (LIBOR), during the same period.

E.M. Elsamadisy et al. / Journal of Policy Modeling 36 (2014) 330–352 337
Fig. 2. Interbank and policy interest rates in Qatar against FFR and LIBOR. Note: average overnight interbank rate inQatar, QIBOR; Qatar Central Bank deposit rate, QCBDR; Qatar Central Bank lending rate, QCBLR; effective federalfunds rate, (FFR); London interbank offered rate, LIBOR.Source: Federal Reserve Bank of St. Louis; Qatar Central Bank.
3.3. Acceleration in money and credit growth
Excessive money and credit growth are the likely outcomes of the situation of structural a PLS;particularly under inflexible exchange rate regimes. Unless the monetary impact of positive netcapital inflow is sterilized, rapid accumulation of undesirable free reserves leads to monetary andcredit growth outside the central bank’s acceptable ranges. This reflects on the consumption andinvestment spending fueling aggregate demand, hence triggering inflationary pressures. Extremelylow or negative real interest rates for an extended period might lead to sharp and unsustainableincreases in asset prices (the experience of the Qatari stock and real estate markets over the period2003–2008 is an example). Subsequently, if and when the rise in the surplus funds is reversed– owing to, for example, a repatriation of inward capital flows and/or a reversion of the assets’market expectations – it could lead to sharp reductions in the assets’ prices and greater overallvolatility in market prices. The reversal of capital flows during mid-2008 is a case in point.11
Although the QCB attempted to slow money growth by increasing reserve requirements andissuing certificates of deposit, those measures were insufficient in the face of substantial capitalinflows driven by fiscal expansion and speculative foreign currency flows. The expansion of the
11 From a local peak of QR38.70 billion in mid-April 2008, interbank liquidity began to taper off beginning in May2008; by early July 2008, the stock of liquidity plunged to QR7.3 billion and continue to erode before winding up aroundQR4 billion in mid-September 2008.

338 E.M. Elsamadisy et al. / Journal of Policy Modeling 36 (2014) 330–352
QCB’s money, stemming from surging capital inflows, led in turn to a strong growth in broadmoney supply. Real broad money growth jumped from 8.6% in 2002 to over 34% in 2005, andgrew at an average rate of 27% per year during 2006–2007 before falling below 5% in 2008,reflecting the impact of the financial crisis (see Fig. 3a). On the credit side, total domestic credit(in real terms) grew even at a stronger pace: from under 5% in 2002 it reached over 45.50% in 2007before dropping to 32% in 2008 (see Fig. 3b). However, credit growth differed widely betweenthe private and public sectors. Over the 2002–2008 period, private real credit grew at an annualaverage of 27%, while public real credit grew by 15%.12 The bulk of private credit growth wasdue to a surge in consumption loans, followed by credit extended to the real estate sector. Overthe 2004–2007 period, roughly half of the private sector credit constituted consumption-relatedloans. Higher money and credit growth led to upward pressure on domestic prices through anexpansion of aggregate demand.13
4. QCB’s pre-crisis monetary policy framework
Since the QR was issued in 1973, exchange rate targeting was adopted as Qatar’s monetarypolicy strategy under the conditions of open trade, income, and capital and financial accountsof the balance of payments. Since established in late 1993, QCB inherited the monetary policystrategy of its predecessor (Qatar Monetary Authority). The inherited nominal anchor was a defacto fixed parity between the QR and the US dollar (USD) at QR 3.64 ± 0.0015 per 1.00 USD.Equally, QCB’s monetary policy was subordinated to its exchange rate policy. Thus, QCB’s pre-crisis monetary policy framework was a fixed exchange rate target subject to QR convertibility,implying interest rate parity between the QR and the USD. As such, maintaining equilibrium inthe local USD market at parity was the primary objective of the QCB’s monetary policy. Aspectsother than the exchange rate are of ensuring priority in relation to monetary policy.14 Sustainingthe peg credibility was imperative for anchoring domestic inflation expectations.
QCB’s interest rates framework comprised three policy rates: the QCB Lending Rate (QCBLR),the QCBDR and the QCB Repurchase Agreement (Repo) Rate (QCBRR). Both the QCBLR andQCBDR are overnight rates. Longer maturity rates were monotonically increasing linear functionsof the respective policy rate, subject to formal bank-by-bank ceilings determined by the QCB.
In managing the QR exchange rate, the QCB operated with two instruments: QCB policyinterest rates and on-demand exchange market interventions. Whether to intervene or to varythe policy rate are technically separate decisions, since they may be implemented independently.However, they may be seen, to some extent, as substitutes in relation to the QR exchange rate,
12 These averages, however, hide rather large variations in time. For example, after consecutive negative growth ratesover 2003–2006, the public sector real credit growth jumped to 95% in 2007 before dropping to 55% in 2008.13 However, domestic inflation in Qatar was also affected by other external and internal factors. On the external front,
soaring global commodity prices and a weakening US dollar adversely impacted Qatar’s import bills. On the domesticfront, a near doubling of the population within a very short span of time (2005–2008) resulted in a huge pressure onthe domestic supply of residential housing units, causing the inflation of house rents to reach its highest level in 2007at 29.44%. Rising aggregate demand also put pressure on other non-rent domestic items. Over the 2003–2008 period,nontradable inflation more than tripled compared to tradable inflation. Consequently, headline inflation rose from a model2.30% in 2003 to nearly 12% in 2006 before reaching its highest level 15.25% in 2008 (see Fig. 3c). As a result ofhigher inflation, Qatar’s effective exchange rate appreciated over the 2005–2008, as depicted in Fig. 3d. See Basher andElsamadisy (2012) for an empirical analysis on the sources of inflation in GCC countries.14 The double constraint of institutionalized QR convertibility and the monetary strategy of exchange rate targeting have
imposed stringent restrictions on the scope and effectiveness of QCB’s monetary policy.

E.M
. E
lsamadisy
et al.
/ Journal
of Policy
Modeling
36 (2014)
330–352
339
Fig. 3. Implications of liquidity surplus on major economic variables in Qatar.Source: Institute of International Finance Database, Washington, DC.

340 E.M. Elsamadisy et al. / Journal of Policy Modeling 36 (2014) 330–352
depending on the magnitude and sustainability of capital flows, particularly financial flows. In theshort-term, QCB will only use interventions in defending the peg. Isolated interventions wouldtake place primarily to alleviate temporary pressures in the market. In the long run, QCB keeps theQR stable vis-à-vis the USD by adjusting its policy rates. Having faith in the impossible trinity andthe predominance of the uncovered interest rate parity (UIP), QCB was always keen to shadowthe Fed’s policy rate closely whenever the market is stable; otherwise it would independentlyadjust its policy rate. This rendered the spread between QCB’s policy rate and the Fed’s policyrate a key to the QCB’s monetary and exchange rate management.
4.1. QCB’s pre-crisis liquidity policy framework
Within QCB’s pre-crisis monetary framework, QCB’s liquidity policy was drawn and con-ducted with the view to manage the interday and the intraday between April 2002 and June 2006liquidity in the interbank money market in a way to steer the shorter-term (overnight) moneymarket interest rates to keep them as close as possible to the policy rate (the shadow of the Fedpolicy rate) and hence sustain the exchange rate parity. The key to the QCB liquidity policyis the aggregate net balance of the banks’ free reserves account (current deposits or settlementaccounts) at the opening time of the Qatar Payment System. The opening balance of this accountis dubbed “primary liquidity,” “interbank liquidity,” “money market liquidity,” or “QR liquidity”(c/f Section 2) at the start of the monetary policy day.
Besides a bounded conventional daylight overdraft facility, QCB’s pre-crisis liquidity policyframework comprised a narrow set of liquidity management tools: (a) the required reserves ratio(RRR); (b) collateralized loans (repurchase agreements) with two weeks or with a one-monthmaturity; (c) a hybrid daylight set of central bank standing facilities dubbed the “Qatar MoneyMarket Rate Mechanism” (QMR; the QMR was amended more than once); (d) a QCB end-daystandard refinancing standing facility; and (e) QCB certificates of deposits (CDs), which werefirst launched in March 2008. Starting on 26 January 2008, QMR encompassed a multi-maturityrefinance standing facility (up to 30 days) and a multi-maturity deposit standing facility (up to30 days). As mentioned earlier, QCB’s interest rates framework comprised three policy rates: theQCBLR, the QCBDR and the QCBRR.
Even though QCB has always endeavored to operate a money market corridor system, a floorsystem has been the de facto system that QCB actually operated and the QCBDR has been the defacto major policy rate. Changes in this rate manifest shifts in the orientation of monetary policy:reductions signal easing and rises indicate tightening of QCB’s (actually the Fed’s) policy stance.Consistently, the QCB liquidity policy framework was focused on steering the interbank overnightinterest rate to keep it as close as possible to the QCB policy rate. However, QCB’s pre-crisisarsenal contained only a few liquidity management instruments (particularly liquidity drainage),thus incapacitating QCB’s liquidity management. Several standard monetary instruments werenot available at the disposal of QCB, such as:
• Only medium- and long-term government bonds (not treasury bills) were issued to commercialbanks during the pre-crisis era, with trading restricted among banks. Moreover, most bondswere issued at higher than market interest rates, thus encouraging commercial banks to buyand hold the securities. Absent a secondary market for public debt securities, open marketoperations (OMOs) had not been a viable instrument for QCB.15
15 In Bahrain and Kuwait, the central banks use OMOs on a regular basis to influence the domestic component ofthe sources of their monetary base, such instruments have not effectively materialized in Qatar. Even open market-type

E.M. Elsamadisy et al. / Journal of Policy Modeling 36 (2014) 330–352 341
• Likewise, absent deep QR forward market, foreign exchange swaps did not present an effectivealternative. Although, in the absence of any exchange rate risk for the QR against the US dollar,foreign exchange swaps could be easily computed between the central bank and commercialbanks just like any other day-to-day transaction between the two parties, but this was not analternative for the QCB. Selling US dollars (the QCB intervention currency) would have inten-sified the downward pressure on the US dollar in the Doha exchange market, while purchasesof US dollar would have aggravated the structural liquidity surplus situation in the interbankmarket.
• Furthermore, absent effective coordination between QCB and the general government (partic-ularly the Ministry of Economics and Finance, MOEF) during the pre-crisis period, the generalgovernment deposits were allocated to commercial banks (mostly to the partly government-owned Qatar National Bank) rather than to the QCB. This denied the central bank the flexibleliquidity management tool of repatriating public sector deposits between the central bank andits monetary policy counterparts.16 While repatriating public sector deposits to the central bankis not without caveats, this should be appropriate for Qatar where existing monetary controlinstruments are insufficient.
• Likewise, absence of such coordination between QCB and the MOEF (during the pre-crisisperiod) made it infeasible the creation of a special liquidity management fund like that of the“Market Stabilization Scheme” created by the Indian Ministry of Finance and the Reserve Bankof India in 2004–2005, which was financed by the former and independently operated by thelater.17
• Imposition of capital controls was never a (politically) viable alternative for the QCB.
4.2. QCB’s pre-crisis liquidity management
Only required reserves, QCB hybrid standing facilities and the collateralized loans were utilizedafter the beginning of the last decade (more precisely, the QMR mechanism was initiated in lateApril 2002). QCB certificates of deposits were initiated in March 2008, only six months beforethe blowup of the global financial crisis, and were terminated in May 2011, whence QCB startedto issue treasury bills (on behalf of the MOEF) with the same maturity structure.
1. Reserve requirements: QCB has adopted a required reserves regime that neither allows anaveraging scheme nor remunerates the reserves (so the maintenance period is one day). Abank that does not meet its required reserves is heavily penalized. The RRR was not utilizedbefore December 2007. Yet, on the backdrop of the speculative revaluation attack on the QR,and within a span of five months (December 2007 to April 2008), QCB increased the RRRon all deposits – from 2.75% to 4.75% – on three occasions: December 2007 (from 2.75% to3.25%); February 2008 (from 3.25% to 3.75%); and April 2008 (from 3.75% to 4.75%), thusdraining the sum of QR3.40 billion off the interbank money market.
operations such as Repo operations in government bonds (which are regularly used by the Saudi Arabian MonetaryAgency) are not used by QCB except to inject liquidity.16 Public sector deposits account for over 30% of the banking system’s deposit base in Qatar. The use of this method has
been highly effective in Malaysia, Saudi Arabia and Thailand (e.g., Lee, 1997). In some countries, central banks have beengiven some control of government deposits by law. The Bank of Canada, for example, can transfer government depositsfrom commercial banks to itself, and vice versa (Cottarelli, 1993).17 See, for example, Ministry of Finance (2012).
342 E.M. Elsamadisy et al. / Journal of Policy Modeling 36 (2014) 330–352
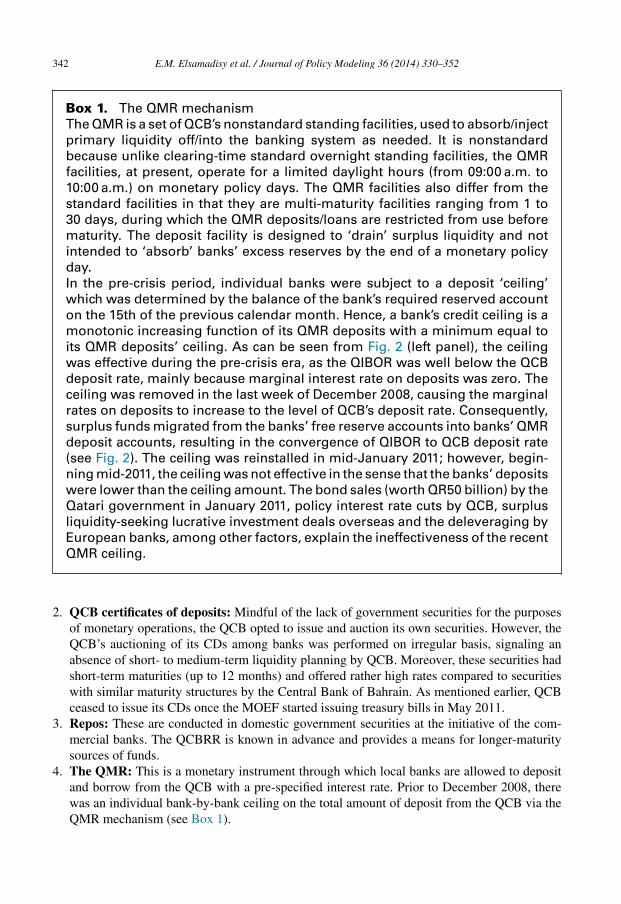
Box 1. The QMR mechanismThe QMR is a set of QCB’s nonstandard standing facilities, used to absorb/injectprimary liquidity off/into the banking system as needed. It is nonstandardbecause unlike clearing-time standard overnight standing facilities, the QMRfacilities, at present, operate for a limited daylight hours (from 09:00 a.m. to10:00 a.m.) on monetary policy days. The QMR facilities also differ from thestandard facilities in that they are multi-maturity facilities ranging from 1 to30 days, during which the QMR deposits/loans are restricted from use beforematurity. The deposit facility is designed to ‘drain’ surplus liquidity and notintended to ‘absorb’ banks’ excess reserves by the end of a monetary policyday.In the pre-crisis period, individual banks were subject to a deposit ‘ceiling’which was determined by the balance of the bank’s required reserved accounton the 15th of the previous calendar month. Hence, a bank’s credit ceiling is amonotonic increasing function of its QMR deposits with a minimum equal toits QMR deposits’ ceiling. As can be seen from Fig. 2 (left panel), the ceilingwas effective during the pre-crisis era, as the QIBOR was well below the QCBdeposit rate, mainly because marginal interest rate on deposits was zero. Theceiling was removed in the last week of December 2008, causing the marginalrates on deposits to increase to the level of QCB’s deposit rate. Consequently,surplus funds migrated from the banks’ free reserve accounts into banks’ QMRdeposit accounts, resulting in the convergence of QIBOR to QCB deposit rate(see Fig. 2). The ceiling was reinstalled in mid-January 2011; however, begin-ning mid-2011, the ceiling was not effective in the sense that the banks’ depositswere lower than the ceiling amount. The bond sales (worth QR50 billion) by theQatari government in January 2011, policy interest rate cuts by QCB, surplusliquidity-seeking lucrative investment deals overseas and the deleveraging byEuropean banks, among other factors, explain the ineffectiveness of the recentQMR ceiling.
2. QCB certificates of deposits: Mindful of the lack of government securities for the purposesof monetary operations, the QCB opted to issue and auction its own securities. However, theQCB’s auctioning of its CDs among banks was performed on irregular basis, signaling anabsence of short- to medium-term liquidity planning by QCB. Moreover, these securities hadshort-term maturities (up to 12 months) and offered rather high rates compared to securitieswith similar maturity structures by the Central Bank of Bahrain. As mentioned earlier, QCBceased to issue its CDs once the MOEF started issuing treasury bills in May 2011.
3. Repos: These are conducted in domestic government securities at the initiative of the com-mercial banks. The QCBRR is known in advance and provides a means for longer-maturitysources of funds.
4. The QMR: This is a monetary instrument through which local banks are allowed to depositand borrow from the QCB with a pre-specified interest rate. Prior to December 2008, therewas an individual bank-by-bank ceiling on the total amount of deposit from the QCB via theQMR mechanism (see Box 1).

E.M. Elsamadisy et al. / Journal of Policy Modeling 36 (2014) 330–352 343
5. The crisis period
To reiterate, the policy stance of the Fed (and other major central banks) during the pre-crisis erahad been primarily expansionary in response to periods of heightened volatility in the aftermathof 9/11. The events that followed – the anthrax attacks, and the invasion of Afghanistan andIraq – only served to heighten these uncertainties. By May 2004, the targeted federal funds rate(TFFR) dropped to 1%. Yet, the Fed started tightening its policy stance in mid-2004. By June2006, the TFFR reached 5.25%. Shortly after the financial turbulence started on August 9 and 10,2007,18 the Fed’s easing campaign began in September 2007 by cutting the TFFR by 50 basispoints. By the end of 2007, the TFFR was cut to 4.25%. As indications of economic weaknessproliferated, the Fed responded by cutting its policy rate to 2% by May 2008 (225 points). Despitethe Fed’s monetary policy support, the global economic outlook continued to deteriorate. The Fedresponded by cutting the TFFR by an additional 100 basis points (in two steps) in October 2008,of which “half of [the] reduction came as part of an unprecedented coordinated interest rate cutby six major central banks on October 8” (Bernanke, 2008). Finally, the TFFR was cut down to0.0–0.25% on December 2008, and stayed there for an extended period.
Keeping a strong faith in the impossible trinity and the predominance of the UIP, QCB waskeen to shadow the Fed’s policy rate closely prior to the eruption of the global financial crisis inmid-September 2008. The QCB policy rate was cut to reach 1.23% in June 2004, was persistentlyraised to reach 5.15% in May 2006 and was cut to reach 2% in May 2008 (Fig. 4). The importedmonetary easing has indeed reinforced upward pressures on the QR exchange value vis-à-vis theUSD, which resulted in forcing QCB on-demand QR sales and injected foreign exchange on theassets side and free bank reserves on the liabilities side of QCB’s balance sheet, thus accumulatingprimary liquidity in the banking system.
In contrast with the pre-crisis years – but still keeping faith in the trilemma and the predomi-nance of the UIP – and foreseeing the intensity of the overseas deleveraging process, the globalliquidity shortage and the global credit crunch, in the aftermath of the global financial meltdown,QCB anticipated capital mobility to freeze globally. Qatar could therefore maintain a large pos-itive interest rate differential vis-à-vis the US since “the risks that an interest rate differentialfavoring Qatari riyal deposits would attract sizeable capital flows via the ‘carry trade’ had largelydissipated” (General Secretariat for Development Planning, 2012, p. 34). Capital immobility isequivalent to closing the capital and financial accounts of the balance of payments, and henceindicates a breakup of the UIP and the neutralization of the QR peg. This frees QCB’s policy ratesfor domestic policy goals, and extends potency to the QCB monetary policy stance independentof the Fed’s monetary stance. Thus, anticipating a countercyclical fiscal stance, and the Qatarigovernment’s rescue package in support of the national commercial banks, QCB decided to fullybreak up with the Fed and adopt a relatively tightening monetary policy stance. Monetary tighten-ing reinforced the domestic impact of the global financial crisis, lowered inflationary expectationsat home and helped to deflate the economy (with no sacrifice of monetary stability or suspicionsof triggering pressures in the exchange market as long as capital mobility remained paused).
Such QCB’s vision signified a dramatic switch from a monetary policy strategy of exchangerate targeting to a (seemingly temporary) monetary policy strategy of implicit inflation targeting
18 On 9–10 August 2007, the spread between the three-month LIBOR and the three-month overnight index swap jumpedto unusually high levels and has remained high ever since. This event was dubbed a “black swanin the money market byTaleb (2007) due to its unusual appearance.

344 E.M. Elsamadisy et al. / Journal of Policy Modeling 36 (2014) 330–352
Fig. 4. Policy interest rates in Qatar and the United States. Note: Qatar Central Bank deposit rate, QCBDR; effectivefederal funds rate, FFR.Source: Federal Reserve Bank of St. Louis; Qatar Central Bank.
and exchange rate targeting. That is, QCB’s monetary policy framework was replaced by a “dualmandate framework”, which required: (i) separating QCB’s monetary policy from QCB’s liquiditymanagement; so that the policy rate would no longer be instrumental for liquidity management; (ii)untying QCB’s monetary policy from exchange rate management, so that only QCB’s exchangemarket interventions (and not the policy rate) would be utilized to neutralize pressures in themarket; (iii) no monetary easing, but gradually tightening the QCB monetary policy stance viafreezing QCB policy rates; (iv) directly injecting liquidity into the banking system as needed; and(v) draining liquidity surplus off the banking system as needed.
Meanwhile, financial stability and monetary policy came to be seen as “co-equal” responsi-bilities of central banks in several developed and emerging countries. QCB was no exception.In the aftermath of the global financial crisis, and in parallel with government intervention insupport of the banking system, QCB had restricted banks from taking on new exposures in theequity and real estate markets. Complementing ongoing global regulatory reforms, QCB initiateda comprehensive review of its prudential regulations, strengthened its department of financialstability, established a new credit bureau, started setting up a new risk monitoring department andreformed its regulatory framework.19
19 Major regulatory developments during 2009–2010 include: (i) external auditing of the banks’ off-balance sheet items;(ii) classification and valuation of financial investments inside and outside Qatar in accordance with International Account-ing standard IAS-39; (iii) elimination of credit for purposes of trading in securities; (iv) external auditing of banks’ exposureto real estate risks; (v) timely disclosure of banks’ financial statements and those of their branches abroad and their sub-sidiaries and (vi) external auditing to evaluate the effectiveness of corporate governance with respect to the performanceand the responsibilities of members of boards of directors and executive management, and the relationship between both.See Qatar Central Bank (2009, 2010) for further discussion.

E.M. Elsamadisy et al. / Journal of Policy Modeling 36 (2014) 330–352 345
Nevertheless, the QR liquidity surplus was renewed in the aftermath of the global financialcrisis, created and sustained by the gradual implementation of the state’s pre-emptive interventionsin the banking sector. While the average daily deposits via the QMR standing deposits facilityrecorded QR17.1 billion in 2009 and QR38.8 billion in 2010, QCB’s lending facilities werehardly used during this period, indicating that the interbank market was flooded with liquiditysurplus. Certainly, successful implementation of QCB’s liquidity policy within its new monetarypolicy framework under these conditions demanded much more coordination between QCB andthe MOEF, particularly in the domains of augmenting QCB’s arsenal of monetary instrumentsand fiscal actions in support of QCB’s liquidity management. QCB introduced its own securities(CDs) in March 2008 and an overnight liquidity window at 3% interest rate in October 2008, andeliminated the ceilings on bank deposits via the QMR standing deposits facility. These were highlyeffective (new) tools of liquidity management. Unlike other GCC countries (Bahrain, Kuwait andthe UAE), Qatar did not provide guarantees for deposits at local commercial banks. Meanwhile,in coordination with QCB, the MOEF issued government securities amounting to QR10 billionin June 2010 and QR50 billion in January 2011, contributing to absorbance of interbank liquiditysurplus. The outcome had been stabilizing QIBOR close to QCB’s deposit rate (which was about2%/0.0125%=160-fold compared to the mid-range of the FFR).
Noticeably, since it coincided with reluctance on behalf of commercial banks to extend creditto the private sector, a soft landing real estate sector, a bust in the stock market and a reluctance onbehalf of households to access the consumer credit markets, the accumulated PLS in the moneymarket was not inflationary. Within this environment, QCB’s new monetary policy framework,the new liquidity management approach that was independent from the QR peg, the improvedregulatory framework, and the coordination between QCB and the MOEF have been a success,resulting in: (i) significantly slower annual money (M1 and M2) growth; (ii) significantly slowergrowth in credit extended to the private sector; (iii) overall annual consumer price index (CPI)deflation; (iv) preserving banking and financial stability; (v) a soft landing in the real estate market;(vi) positive and increasing real interest rates; (vii) stabilizing the QIBOR at a much higher levelthan the LIBOR or the FFR (2.09% daily average over the period of January 2009–July 2010).While interbank markets were clogged in many countries, it was stabilized in Qatar.
6. Discussion
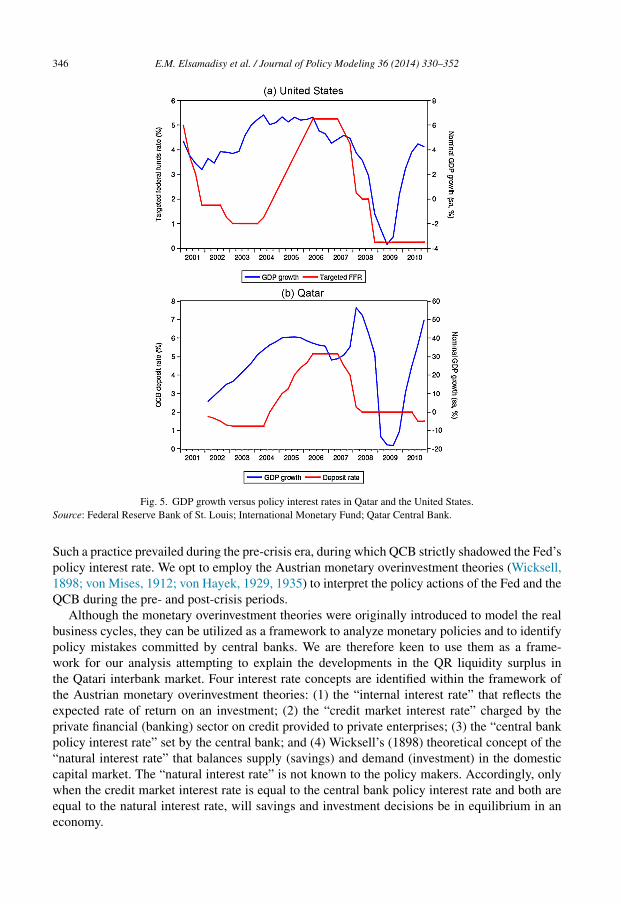
This section attempts to evaluate QCB’s monetary policy across the mid-September 2008global financial meltdown. But first, recalling some major aspects of the monetary policies ofsome major central banks, it is worth noting that the monetary counterrevolution of the early 1980smarked the return to assigning a heavy weight to price stability in the process of monetary policymaking. Since then, the policy rate levels continued to structurally decline in the major advancedeconomies. While this was driven by an asymmetric exchange rate policy in Japan (Danne &Schnabl, 2008), it was driven by an asymmetric monetary policy response toward developmentsin the stock markets (Hoffmann, 2012). Fig. 5 shows that the Fed’s monetary policy tended torespond strongly to the bear markets but not as strongly to the bull markets (Hoffmann, 2009). Itwas Alan Greenspan who developed a central banking practice keen to stabilize financial marketsin time of crisis but be inactive during boom times, in line with the Jackson Hall Consensus.20
20 According to the so-called “Jackson Hall Consensus”, the US central bankers have determined that central bankshave no sufficient information to recognize and forestall stock market bubbles, but should intervene in times of financialturmoil (Blinder and Reis, 2005).
346 E.M. Elsamadisy et al. / Journal of Policy Modeling 36 (2014) 330–352
Fig. 5. GDP growth versus policy interest rates in Qatar and the United States.Source: Federal Reserve Bank of St. Louis; International Monetary Fund; Qatar Central Bank.
Such a practice prevailed during the pre-crisis era, during which QCB strictly shadowed the Fed’spolicy interest rate. We opt to employ the Austrian monetary overinvestment theories (Wicksell,1898; von Mises, 1912; von Hayek, 1929, 1935) to interpret the policy actions of the Fed and theQCB during the pre- and post-crisis periods.
Although the monetary overinvestment theories were originally introduced to model the realbusiness cycles, they can be utilized as a framework to analyze monetary policies and to identifypolicy mistakes committed by central banks. We are therefore keen to use them as a frame-work for our analysis attempting to explain the developments in the QR liquidity surplus inthe Qatari interbank market. Four interest rate concepts are identified within the framework ofthe Austrian monetary overinvestment theories: (1) the “internal interest rate” that reflects theexpected rate of return on an investment; (2) the “credit market interest rate” charged by theprivate financial (banking) sector on credit provided to private enterprises; (3) the “central bankpolicy interest rate” set by the central bank; and (4) Wicksell’s (1898) theoretical concept of the“natural interest rate” that balances supply (savings) and demand (investment) in the domesticcapital market. The “natural interest rate” is not known to the policy makers. Accordingly, onlywhen the credit market interest rate is equal to the central bank policy interest rate and both areequal to the natural interest rate, will savings and investment decisions be in equilibrium in aneconomy.

E.M. Elsamadisy et al. / Journal of Policy Modeling 36 (2014) 330–352 347
A deviation from the (unknown) natural interest rate would result in a monetary policy mistake.Two types of monetary policy mistakes can be identified (Hoffmann & Schnabl, 2011). A TypeI monetary policy mistake is committed where and when the central bank keeps the policy ratebelow the natural interest rate for too long during the upswing of an economic cycle, triggeringan overinvestment boom that leads to crisis and recession. A Type II monetary policy mistake iscommitted where and when the central bank keeps the policy rate above the natural interest ratefor too long during the downturn of an economic cycle, thereby aggravating the recession. Thepolicy implication is that the central bank should keep its policy rate as close as possible to the(unknown) natural interest rate in order to smooth economic cycles. Since the natural interest rateremains a theoretical concept unknown to the central bank, it is the task of the central bank togain sufficient information to approximate the natural interest rate (in this spirit, Taylor’s (1993)rule is an example).
During the pre-crisis period, the Fed (under Alan Greenspan) started cutting its policy rate inJanuary 2001 – in the aftermath of the burst of the dotcom bubble – from 6.5% over May–December2000 to 3.5% in August 2001. The Fed continued to cut its policy rate – in the aftermath of theSeptember 11th 2001 – to reach 1% in July 2003 and stayed there for a whole year. Only inJune 2004, the Fed started to remove its monetary policy stimulus by continuously raising itspolicy interest rate to reach 5.25% in June 2006 and to remain untouched until August 2007.Notably, the Fed policy rate fell faster during recessions than it rose during booms (Fig. 5). In thismanner, within the framework of the monetary overinvestment theories (Wicksell–Mises–Hayek),the apparent behavior of the Fed may be judged as mixed. The implications for QCB’s monetarymanagement (and the Qatari economy) were mysterious.
Under the restrictive conditions of QR convertibility and the QR hard-peg, QCB had postulated(i.e., accepted the untested hypothesis of) the UIP implied by the QR–USD exchange rate parity.Fig. 5 shows that the Fed’s monetary policy stance had been seemingly consistent with the slowingUS economy during the period 2000:Q1–2001:Q3, showing that the Fed committed no monetarypolicy mistakes. Nevertheless, the Qatari economy was on the rise during that period. By import-ing the Fed’s easy monetary policy stance, the QCB was forced to commit a Type I monetarypolicy mistake, accommodating the expansionary fiscal stance and paving the way for heatingthe economy. Yet, while the US economy was on the rise during the period 2001:Q4–2004:Q1,the Fed had apparently committed a Type I monetary policy mistake (continuing to cut its policyrate). Shadowing the Fed policy rate, the professed Fed Type I monetary policy mistake was trans-mitted to the Qatari money market via a forced QCB Type I monetary policy mistake, therebyaggravating the already heating economy.
Starting June 2004, the Fed began removing its monetary policy stimulus by continuouslyraising its policy rate to reach 5.25% in June 2006 to remain untouched until August 2007, thuscommitting a Type II monetary policy mistake. The Fed’s Type II monetary policy mistake camein favor of the overheating Qatari economy during this period, as QCB shadowed the Fed’s policyrate. However, the pace of the Fed’s monetary tightening was insufficient to mitigate the situationin Qatar; headline CPI inflation reached 17% in 2008:Q2. Apparently consistent with a slowingUS economy, the Fed’s easing campaign began in September 2007 by cutting the TFFR 50 basispoints. The TFFR was cut to 4.25% by the end of 2007 and to 2% by May 2008. The QCB followedby cutting its policy rate down to 2% by May 2008, hence committing a Type I monetary policymistake.
This sequence of QCB’s typical QR peg-forced monetary policy mistakes resulted in a forcedpro-cyclical monetary policy stance that was combined with the prevailing pro-cyclical fiscalpolicy stance and a countercyclical local public debt management approach; the most awful

348 E.M. Elsamadisy et al. / Journal of Policy Modeling 36 (2014) 330–352
policy mix to embrace during economic booms, which produced a colossal PLS far beyond theQCB’s capacity to sterilize. However, on the monetary policy front, QCB did not do what it takes toeffectively sterilize the monetary impact of the expansionary fiscal stance, the countercyclical localpublic debt stance and the net speculative foreign currency inflows. QCB should have recognizedthe de-synchronization of the US and the Qatari economic cycles, emerged early in the 21stcentury; the changing geo-political and geo-economic environments in the aftermath of the 9/11and the Afghanistan and Iraq invasions that turned GCC liquidity-leaking into liquidity-attractingeconomies (under fixed exchange rates); the higher degree of sophistication of the economy atlarge, and the realized developments in the domestic banking sector and the financial system.
Within such an environment, QCB could have used reserve requirements more frequently asa prominent policy instrument.21 If used prudently, reserve requirements could have served asan unconventional monetary policy tool for price stability as well as a financial stability tool todeal with volatile capital flows (Glocker & Towbin, 2012). Also, QCB could have endeavored tocreate – in coordination with the MOEF – a special fund for the purpose of liquidity managementanalogous to the Market Stabilization Scheme successfully operated by the Reserve Bank ofIndia since 2004.22 The QCB could have followed suit by enacting a similar practice of issuinggovernment securities by the Central Bank of Bahrain.23 Further, the QCB could have madethe QR exchange rate more instrumental by widening the margin around the central parity. Thiswould have addressed exogenous shocks somewhat better than the hard-peg regime.24 Finally,QCB could have considered the role of capital controls in tilting the composition of capital inflowsaway from short-term toward medium- and long-term maturities; however, QCB did neither ofthese. The outcome was an overheating economy accommodating two stock market bubbles, anda real estate market bubble, heightened inflationary expectations, accelerating inflation rates andan appreciating real effective exchange rate – all typical symptoms of an overheating economyfaced with large international (net) capital inflows.
Comes the early phase of the global financial crisis, the (seemingly shocked) Fed continuedto (nervously) cut its policy rate down to 2% by May 2008. Following the blowup of the crisisin mid-September 2008, the Fed cut its policy rate in steps to 0.00–0.25% by December 2008.In the meantime, the Fed started launching its unconventional Credit Easing policy in the formof a series of non-standard refinancing facilities, followed by “Large-scale Asset Purchases I”or “Quantitative Easing I,” then Large-scale Asset Purchases II (Quantitative Easing II) in 2010.This was an ultra-easy monetary stance. While all other GCC central banks cut their policy ratesfollowing the Fed after the collapse of Lyman Brothers, QCB – for the first time since it wasestablished – decided not to follow. All three QCB policy rates were frozen: the QCBDR at 2%,the QCBLR at 5.50% and the QCBRR at 5.55%. That was a deliberate Type II monetary policymistake, aimed at deflating the economy (by reinforcing the local impact of the global financialcrisis) so that the economy reaches the next (anticipated) self-triggered boom at low base inflationrates. Later on, it was proved that QCB had acted promptly and capably.
21 For example, the People’s Bank of China raised its reserve requirements six times in 2010 but moved its policy interestrate only once (Kashyap and Stein, 2012).22 Such funds could have made it feasible to expand QCB’s OMOs via selling treasury-like bonds and bills to the banks
and the public.23 See, http://www.cbb.gov.bh/page-p-issuance of govt securities.htm.24 For example, when the domestic inflation rate is significantly and persistently higher than in trading partner countries,
the problem can be dealt with by a pre-emptive move by the central bank toward an upward adjustment in the exchangerate. Similar actions can be used if the inflow of “hot moneyseeks short-term profits.

E.M. Elsamadisy et al. / Journal of Policy Modeling 36 (2014) 330–352 349
QCB’s post-crisis decisions were based on theoretical analysis that – postulating the impossibletrinity and assuming capital immobility – concluded a breakdown of the UIP and the neutralityof the QR peg. While Elsamadisy (2003b) could not reject the UIP for the Kuwaiti data over1989–2001, we ask if the Qatari data supports QCB’s (theoretical) conclusion of the UIP beingvoid for Qatar since the blowup of the crisis. In an attempt to answer this question, Appendix Aempirically tests and rejects the UIP hypothesis. That is, our empirical results confirm the QCB’stheoretically derived conclusion that the QR peg would be futile following mid-September 2008and therefore appraises QCB’s new monetary policy framework and policy conduct.
Noticeably, the PLS accumulated in the interbank market over 2009–2010 was almost fullycreated and sustained by the gradual implementation of the government’s interventions in rescueof the Qatari banks. The surplus was not at all inflationary, owing to the banks’ reluctance toextend credit to the private sector and the shrinking private sector demand for credit among otherfactors including reassessment of risks. QCB’s objective was achieved, since inflation was indeedfalling sharply getting into negative boarders during 2009–2010 (CPI inflation dropped from anannual average of 15% in 2008 to – 5% in 2009 and continued to decrease during 2010) while thebanking and financial stability was preserved. It is thus concluded that breaking up with the Fed,adopting a dual mandated monetary policy framework, separating monetary policy from liquiditypolicy and conducting liquidity policy independent of the QR peg was in fact, a highly successfulQCB experience that was widely recognized (IMF, 2009; IMF, 2010). The interest rate differentialbetween the QCB and the US Fed policy rates was expected to remain safe until well into 2011.Disinflation provided a silver lining for Qatar, presenting an opportunity that QCB should nothave missed in order to discipline the QR real exchange rate as a requisite to preserve the relativenational wealth and relative size of the economy within the unified GCC currency area (amongother policy goals).
7. Concluding remarks
This paper considers the phenomenon of structural PLS over the last decade of QCB’s liquiditymanagement. The paper defines structural PLS in view of practical central banking, identifiesvarious sources of PLS in the context of the Qatari economy, and its consequences for the QCBmonetary policy transmission mechanism and for the economy at large. The paper discusses thecauses of QCB’s unsuccessful experience over the years preceding the crisis and those of its highlysuccessful experience in managing interbank liquidity over the crisis years. The effectiveness ofthe QR hard peg is identified as the major cause in the first case and its ineffectiveness is identifiedas the major cause in the second case. Our main conclusions can be summarized as follows:
1. While the build-up of primary liquidity in the banking system during the pre-crisis years wasmainly driven by surging capital inflows due to record hydrocarbon export revenues, FDI(including financial FDI) and speculative funds in expectation of QR appreciation during thepre-crisis years. The build-up was driven by the gradual implementation of a large scale staterescue package in support of the Qatari commercial banks during the post-crisis years.
2. While the structural PLS was highly inflationary during the pre-crisis years (in an environmentof over-heating economy), the surplus was not at all inflationary during the crisis period, due tonegative shocks in the market for loanable funds, a shift in liquidity preference and re-pricingrisks on behalf of banks (operating in an uncertain environment), and shocked demand onbehalf of the non-bank private sector.

350 E.M. Elsamadisy et al. / Journal of Policy Modeling 36 (2014) 330–352
3. While QCB’s capacity to drain liquidity off the interbank market was minimal over the pre-crisis period because QCB was short on monetary tools and lacked government coordination,QCB’s liquidity draining capacity rose significantly during the crisis period due to significantlygreater government coordination and the augmentation of its arsenal with new monetary tools.
4. While the QCB failed to control inflation during the pre-crisis years, it had contributed suc-cessfully to deflating the economy during the post-crisis years.
5. The effectiveness of the interest rate channel of the monetary transmission mechanism wasdramatically improved due to the change in the QCB monetary policy framework.
Since Qatar is committed to a decade-long program of expansionary fiscal stance within theframework of Qatar Vision 203025 and the FIFA World Cup event of 2022, the major policyrecommendation relating to the role of QCB during the upcoming decade (2011–2020) is that theQCB should strive for a proactive monetary policy that responds to the economic challenges ofthe decade. There are two relevant policy recommendations:
1. QCB can use reserve requirements more frequently as a prominent policy instrument and cancreate – in coordination with the MOEF – a special fund for the purposes of liquidity man-agement, analogous to the Market Stabilization Scheme successfully operated by the ReserveBank of India since 2004. Finally, if necessary, QCB may consider the role of capital controlsin tilting the composition of capital inflows away from the short-term toward medium- andlong term maturities. A proper cost-benefit analysis should be undertaken before consideringnew instruments for utilization.
2. QCB can alter the QR exchange rate arrangement by widening the margins around the centralparity (better still, it can adopt a more flexible exchange rate regime), in which case QCB canhave the policy interest rate instrumented for domestic policy goals, while have QCB inter-ventions instrumented for stabilizing the exchange rate. This pact would render the exchangerate more instrumental for addressing exogenous shocks.
Appendix A. Test of uncovered interest rate parity in Qatar
The general specification of uncovered interest rate parity (UIP) is given as:
(St+n − Sn)e = (it − i∗t ) + rp, (1)
where (St+n − Sn)e is the expected change of the logarithm of the exchange rate (st is thelogarithm of the spot exchange rate in units of domestic currency per unit of foreign currency);(it − i∗t ) is the interest rate differential relative to the foreign country and rp is the risk premium.For simplicity, we make the weak assumption that the expected rate of change in the domesticcurrency is stationary. We also assume the risk premium to be stationary, which is a reflectionof Qatar’s relative economic stability and low political risk observed in the past decade. The(indirect) test of UIP can be expressed as:
it = α + βi∗t + εt, (2)
where εt is a stationary disturbance term encompassing the expected rate of change of thedomestic currency and the risk premium. Under the null hypothesis of UIP, the intercept estimate
25 Qatar Vision 2030, General Secretariat for Development Planning, Qatar.

E.M. Elsamadisy et al. / Journal of Policy Modeling 36 (2014) 330–352 351
should be zero and the slope estimate should be one (i.e., α = 0 and β = 1). The data span from July2004 to December 2011 and is dubbed the “full” sample, which is further divided into two sub-samples: the “pre-crisis” period (July 2004 to September 2008) and the “crisis” period (October2008 to December 2011). The interest rates used in this analysis are the annualized three-monthdeposit interest rate in Qatar and the three-month eurodollar deposit rate (London), which is amore relevant foreign interest rate from Qatar’s perspective due to geographical proximity as wellas financial and trade integration with Europe.
As a first step, we tested for the order of integration of the two interest rates. The augmentedDickey–Fuller unit root test statistics suggest that both interest rates have a unit root, while theirfirst differences are stationary across the three sample periods (i.e., pre-crisis, crisis and fullsample). Results are not affected by the choice of the deterministic component (i.e., the interceptand linear trend) in the test regression. We base our inference on the 5% level of significance.
Given the finding of nonstationarity interest rates, we then tested for bivariate cointegrationbetween the two interest rates using the well-known Johansen cointegration approach. The resultsshow no evidence of cointegration between the two interest rates over the pre-crisis sample. Thenull of one cointegrating relationship cannot be rejected over the crisis sample.26 However, thisfinding is sensitive to the choice of lag length and the type of deterministic component considered inthe test regression. Moreover, over the full sample, the null of no cointegration cannot be rejected atthe 5% level, suggesting the non-existence of a long run equilibrium relationship between domesticand foreign interest rates. Overall, the absence or lack of a bivariate cointegration between thedomestic and foreign interest rates can be interpreted as an empirical failure of the UIP.
In the final step of our empirical analysis, we tested for the joint hypotheses (i.e., α = 0 andβ = 1) using the Wald test based on the ordinary least squares (OLS) estimation of Eq. (2). Theresults show that for the three sample periods, the F-statistics strongly reject the null hypothesisof joint restrictions. We have also examined the normality assumption of the OLS regressionerrors and are unable to reject the null hypothesis of normality in all three sample periods. Finally,the Breusch–Godfrey LM test indicates no evidence of serial correlation in the regression errors.Nevertheless, in the light of our findings (i.e., non-stationarity and non-cointegration), these resultsshould be carefully interpreted. These unreported results are available from the correspondingauthor on request.
References
Basher, S. A., & Elsamadisy, E. M. (2012). Country heterogeneity and long-run determinants of inflation in the Gulf ArabStates. OPEC Energy Review, 36, 227–240.
Bernanke, B. S. (2008). Federal reserve policies in the financial crisis. In Speech given at the Greater Austin Chamber ofCommerce Austin, Texas, December 1, http://www.federalreserve.gov/newsevents/speech/bernanke20081201a.htm
Bindseil, U., Camba-Mendez, G., Hirsch, A., & Weller, B. (2006). Excess reserves and the implementation of monetarypolicy of the ECB. Journal of Policy Modeling, 28, 491–510.
Blinder, A., & Reis, R. (2005). Understanding the Greenspan Standard. In Working Paper 88. Princeton University,Department of Economics, Center for Economic Policy Studies.
Cottarelli, C. (1993). Limiting Central Bank credit to the government: Theory and practice. In IMF Occasional Paper No.110. Washington: International Monetary Fund.
Danne, C., & Schnabl, G. (2008). A role model for China? Exchange rate flexibility and monetary policy making in Japan.China Economic Review, 19, 183–196.
26 However, we observe that both post-crisis LIBOR and the FFR stabilized at a very low rate, while the QIBOR stabilizedat a relatively very high rate (see Fig. 2).

352 E.M. Elsamadisy et al. / Journal of Policy Modeling 36 (2014) 330–352
Elsamadisy, E. M. (2003a). Determinants of the monetary base in GCC countries: A case study. Middle East Businessand Economic Review, 15, 51–66.
Elsamadisy, E. M. (2003b). Relevance of the theory of uncovered interest parity to GCC countries: A case study.International Journal of Applied Business and Economic Research, 1, 149–164.
Elsamadisy, E. M. (2010a). Liquidity concepts in practical central banking. In Chief Economist Technical Note No. 7/2010.Department of Research and Monetary Policy, Qatar Central Bank. Available from the author on request
Elsamadisy, E. M. (2010b). Liquidity measurement concepts at the Qatar Central Bank. In Chief Economist TechnicalNote No. 8/2010. Department of Research and Monetary Policy, Qatar Central Bank. Available from the author onrequest.
Glocker, C., & Towbin, P. (2012). Reserve requirements for price and financial stability: When are they effective?International Journal of Central Banking, 8, 65–113.
General Secretariat for Development Planning (GSDP). (2012). Qatar economic outlook: 2011–2012. Doha, State ofQatar: GSDP.
Habibi, N. (2008). Managing the oil wealth: Foreign assets of GCC countries. Crown Paper No. 1. Crown Center forMiddle East Studies, Brandeis University.
von Hayek, F. (1929). Geldtheorie und Konjunkturtheorie, Salzburg.von Hayek, F. (1935/1967). Prices and production (2nd ed.). Clifton, NJ: Augustus M. Kelley.Hoffmann, A. (2009). Asymmetric monetary policy with respect to asset markets. Oxonomics, 4, 26–31.Hoffmann, A. (2012). Did the Fed and the ECB react asymmetrically with respect to asset market developments? In
Working Paper No. 103. University of Leipzig.Hoffmann, A., & Schnabl, G. (2011). A vicious cycle of manias, crashes and asymmetric policy responses – An overin-
vestment view. World Economy, 34, 382–403.International Monetary Fund (IMF). (2008, May). Regional economic outlook: Middle East and Central Asia. Washington:
IMF.International Monetary Fund (IMF). (2009, October). Regional economic outlook: Middle East and Central Asia. Wash-
ington: IMF.International Monetary Fund (IMF). (2010). Qatar: Staff report for the 2009 Article IV consultation, IMF. Country Report
No. 10/41. Washington: IMF.Kashyap, A., & Stein, J. (2012). The optimal conduct of monetary policy with interest on reserves. American Economic
Journal: Macroeconomics, 4, 66–82.Khamis, M., Senhadji, A., Hasan, M., Kumah, F., Prasad, A., & Sensenbrenner, G. (2010). Impact of the global financial
crisis on the Gulf cooperation countries and challenges ahead. Washington: International Monetary Fund.Lee, J.-Y. (1997). Sterilizing capital inflows. IMF economic issues No. 7. Washington: International Monetary Fund.
http://www.imf.org/external/pubs/ft/issues7/index.htmMina, W. (2010). Institutional reforms debate and FDI flows to MENA region: Is debate relevant? UAEUFBE. In Working
Paper No. 6. Faculty of Business and Economics, United Arab Emirates University.Ministry of Finance. (2012, March). Government Debt. status paper. New Delhi: Department of Economic Affairs.
http://finmin.nic.in/reports/govtdebt2012.pdfvon Mises, L. (1912). Die Theorie des Geldes und der Umlaufmittel. Leipzig: Duncker und Humblot.Peeters, M. (2011, December). The changing pattern in international trade and capital flows of the Gulf Cooperation
Council countries in comparison with other oil-exporting countries. Journal of Knowledge Management, Economicsand Information Technology, (7).
Qatar Central Bank. (2009). Financial stability review. Issue 1. Qatar Central Bank.Qatar Central Bank. (2010). Financial stability review. Issue 2. Qatar Central Bank.Taleb, N. N. (2007). The black swan: The impact of the highly improbable. New York: Random House.Taylor, J. B. (1993). Discretion versus policy rules in practice. In Carnegie-Rochester Conference Series on Public Policy,
vol. 39 (pp. 195–214).United Nations Conference on Trade and Development (UNCTAD). (2009). Regional trend. Chapter 2 in world investment
report. UNCTAD.Wicksell, K. (1898/2005). Geldzins und Güterpreise. Jena and München.