pre-tender hospital simulation using naive diagrams … · pre-tender hospital simulation using...
TRANSCRIPT
PRE-TENDER HOSPITAL SIMULATION USING NAIVE DIAGRAMS AS MODELS
Gabriel Wurzer(a)
, Wolfgang E. Lorenz(a)
, Manfred Pferzinger(b)
(a)
Vienna University of Technology (b)
UMIT, Hall in Tirol
(a)
{gabriel.wurzer|wolfgang.lorenz}@tuwien.ac.at, (b)
ABSTRACT
Hospital simulation has so-far concentrated on late
phases of architectural planning, in which the design is
already fully formulated and undergoes optimization.
This paper moves into the exactly opposite direction -
it tries to embed simulation into the earliest phase
imaginable, which, interestingly, is well before any
architectural planning occurs: The pre-tender work that
is done by or on behalf of the client, using naïve
diagrams based on interviews with the medical staff as
models.
Keywords: early design process, hospital planning,
diagrammatic tools, pre-tender simulation
1. INTRODUCTION
The preparation of a tender represents the earliest work
done in hospital planning: Projected medical demands
of a care region are mapped to either the establishment
of a new hospital, or, more often, to an extension,
adaptation or refurbishment of an existing one.
Classically, the tool of choice for 'simulating' and
'calculating with' future demands has been spreadsheet
software. Apart from statistical data, diagrammatic
information (e.g. envisioned work processes and spatial
arrangement of departments, obtained by interviewing
the medical staff) is also generated. However, and in
contrast to spreadsheets, there is a great lack of methods
for interacting with the so-encoded data - especially
when it comes to animation/simulation of (patient and
material) flow.
Contribution: During the past half year, we have
thus been working on reverse-engineering
diagrammatic representations into simulation
models, dealing with needs-orientated flow descriptions
(patient flow), preliminary floor plans (schemata) and
functional decompositions (bubble diagrams), in order
to obtain a simulation targeted at the pre-tendering
phase. To discuss the techniques used in this context
and give a wider perspective on other possible
applications is the main topic of this paper (see Section
4, “Contribution Details”).
Establishing simulation in the earliest phase of
planning enables clients to get a better overview of the
project they are writing a tender for. Furthermore,
diagrammatic data produced as result of the subsequent
competition phase can thus be evaluated and compared,
which is advantageous for a wide audience:
Planners. The spatially simulated flows can
inform the design and enable a cross-check of
requirements for the planned building.
Generally, the flow given by the client
represents a preliminary concept (“schema”),
in which the spaces are not fully formulated.
However, the processes depicted therein stay
essentially the same, even after the architect
has designed the final form (“floor plan”). By
adaptation of the schema into the final floor
plan, the architect can simulate the flow in his
presented concept, while still relating to the
client’s vision.
Staff. The hospital staff can be trained using
the very same simulation, in which context
also an acceptance check can take place. As
the initial flow concept is typically generated
by the same persons that will see the simulated
final design, this enables to re-use the previous
knowledge for evaluation.
Client. Verification of requirements, as
mentioned, can help in the decision process
during the competition phase. Moreover, as the
hospital goes into operation, realtime data
concerning the actual patient flows can be
exported from the Enterprise Resource
Planning (ERP) system, in order to input and
visualize these in the sense of a “management
dashboard”. To some extent, this also
facilitates a verification of the building’s
operational concept.
2. RELATED WORK
Diagrams (White 1986; Seonwook and Miyoung 2012)
are used as representations for the envisioned
organization, i.e. space allocation (zones and their
adjacency relations, circulation), hierarchy and
responsibilities (organizational chart), temporal or
causal order (processes, flow). The sources for this
information vary; however, one common point is that
planning is never done in isolation, but by drawing on
pre-existing knowledge of several health professionals,
such as physicians, nurses and therapists, administrative
personnel and (most importantly) the patients
Proceedings of the International Workshop on Innovative Simulation for Health Care, 2012978-88-97999-13-3; Backfrieder, Bruzzone, Longo, Novak, Rosen, Eds. 157
themselves. Tool support for employing diagrams as
interview technique, used to let workshop participants
record daily work routines in a game-like manner, was
presented by (Wurzer, Fioravanti, Loffreda and Trento
2010). Simulation in the same setting, as “assessment
tool”, has so far not been conducted. What exists in
early-stage spatial simulation are approaches exploring
space utilization (Tabak 2008; De Vries, Jessurun and
Dijkstra 2002), verification of a functional program
(Wurzer 2010), usage simulation and pathway
visualization (Wurzer 2011) and early process
simulation (Wurzer 2012).
3. BACKGROUND
As stated earlier, work that leads to the definition of
early diagrams (most importantly: the architectural
schema) is conducted collaboratively between health
professionals and patients. The overall goal is to define
requirements that enable effective workflows according
to customer needs and expectancies. Because
objectivity during such an elaboration process is of vital
importance, work typically proceeds in workshops
targeted at a specific problem domain.
Outputs are at first centered on process knowledge
- i.e. daily work routines, clinical procedures and
practices, such that one might produce business
processes for outpatient, inpatient and day hospital
treatment, according to the different areas of the
hospital as defined in (DIN 13080 2003) as result. One
may also specify procedures in case of special situations
- e.g. mass accidents, which is especially important for
trauma clinics. With these processes in mind, one may
look at the intended spatial configuration, which is the
topic we are focusing on in our work. In more detail, we
employ three specific types of diagrams produced
within pre-planning:
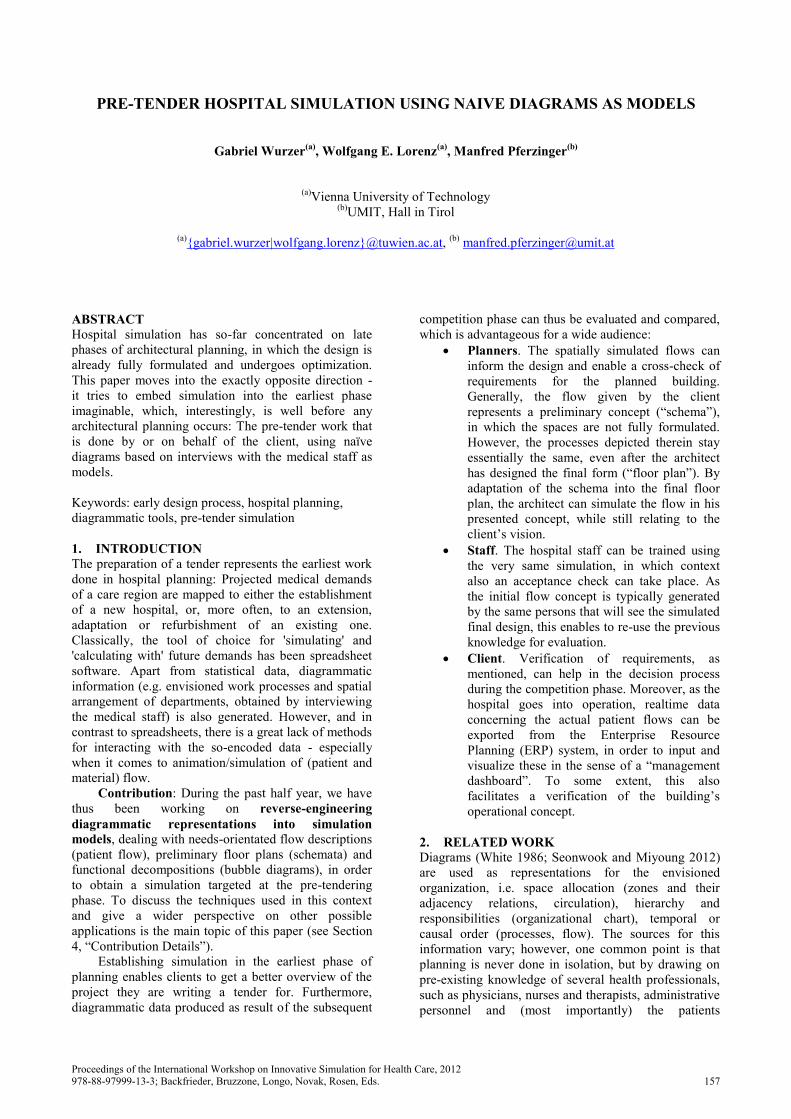
1. The architectural schema (see Figure 1a) as a
hierarchy of “spaces within spaces”. A space is
a bounded (usually rectangular) region that is
denoted by a name. It contains a set of
functions, i.e. names of activities that may be
used in that space. Each function is a resource
of limited capacity, of which the usage is
computed during the subsequent simulation
(see Simulation). It is crucial to note that the
schema is fundamentally different from a floor
plan showing the form of each space: It rather
gives the approximate area and location of
each space in two-dimensional arrangement,
which is then detailed into the fully-formulated
three-dimensional building layout during the
competition.
2. Flows (see Figure 1b) depicted as arrows on
top of the schema, giving a simple yet effective
way to express paths of building users (Lohfert
2005). Usually, these are color-coded to
distinguish different kinds of traffic (patients,
staff, visitors).
Figure 1: (a) Architectonical schema as arrangement of
nested spaces with functions. (b) Superimposed flows.
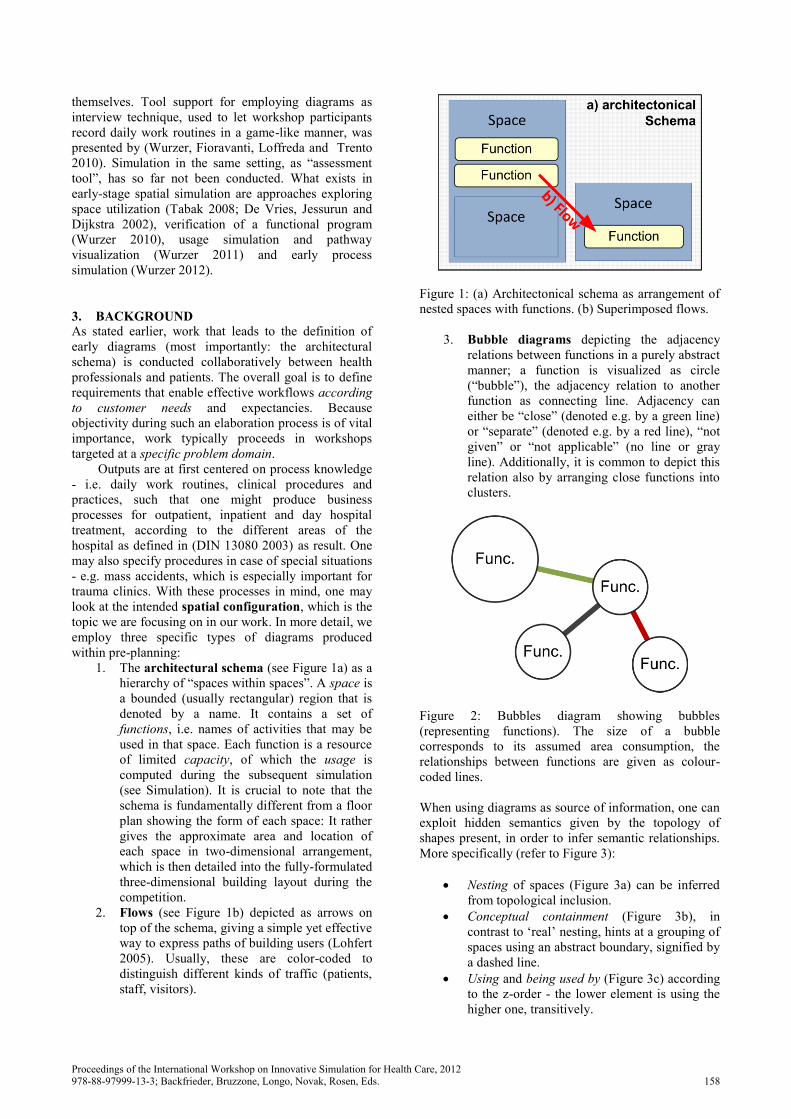
3. Bubble diagrams depicting the adjacency
relations between functions in a purely abstract
manner; a function is visualized as circle
(“bubble”), the adjacency relation to another
function as connecting line. Adjacency can
either be “close” (denoted e.g. by a green line)
or “separate” (denoted e.g. by a red line), “not
given” or “not applicable” (no line or gray
line). Additionally, it is common to depict this
relation also by arranging close functions into
clusters.
Figure 2: Bubbles diagram showing bubbles
(representing functions). The size of a bubble
corresponds to its assumed area consumption, the
relationships between functions are given as colour-
coded lines.
When using diagrams as source of information, one can
exploit hidden semantics given by the topology of
shapes present, in order to infer semantic relationships.
More specifically (refer to Figure 3):
Nesting of spaces (Figure 3a) can be inferred
from topological inclusion.
Conceptual containment (Figure 3b), in
contrast to ‘real’ nesting, hints at a grouping of
spaces using an abstract boundary, signified by
a dashed line.
Using and being used by (Figure 3c) according
to the z-order - the lower element is using the
higher one, transitively.
Proceedings of the International Workshop on Innovative Simulation for Health Care, 2012978-88-97999-13-3; Backfrieder, Bruzzone, Longo, Novak, Rosen, Eds. 158
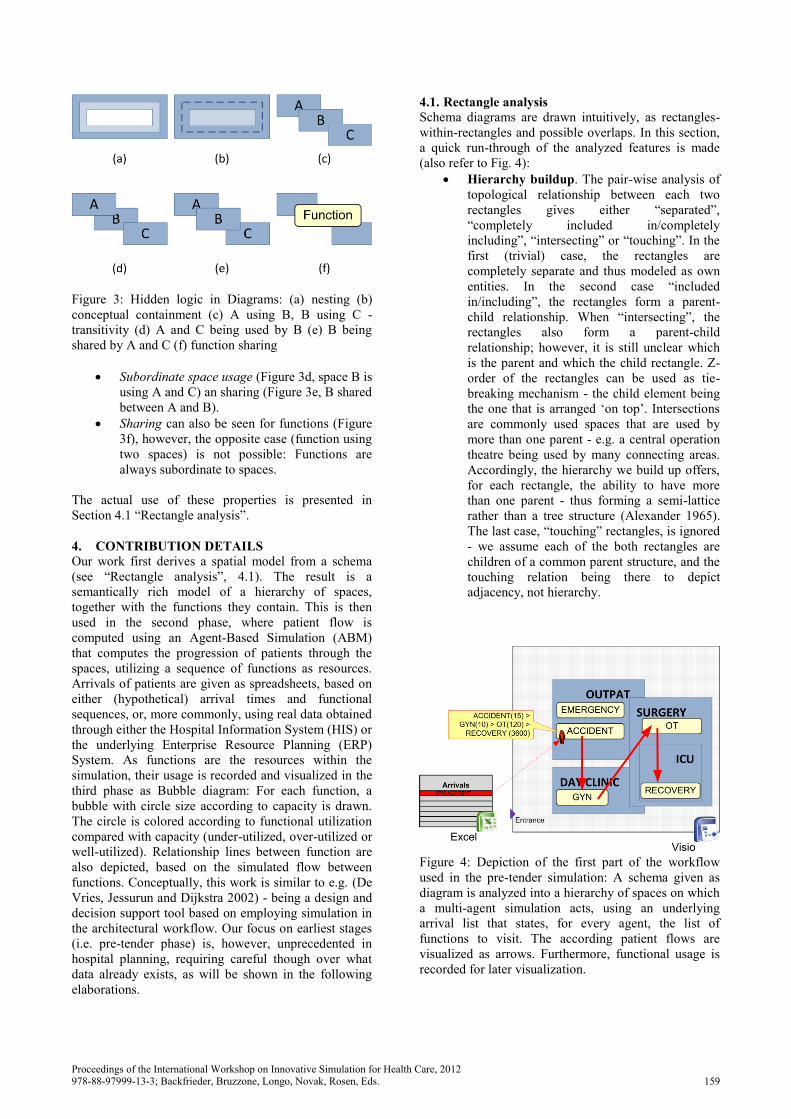
Figure 3: Hidden logic in Diagrams: (a) nesting (b)
conceptual containment (c) A using B, B using C -
transitivity (d) A and C being used by B (e) B being
shared by A and C (f) function sharing
Subordinate space usage (Figure 3d, space B is
using A and C) an sharing (Figure 3e, B shared
between A and B).
Sharing can also be seen for functions (Figure
3f), however, the opposite case (function using
two spaces) is not possible: Functions are
always subordinate to spaces.
The actual use of these properties is presented in
Section 4.1 “Rectangle analysis”.
4. CONTRIBUTION DETAILS
Our work first derives a spatial model from a schema
(see “Rectangle analysis”, 4.1). The result is a
semantically rich model of a hierarchy of spaces,
together with the functions they contain. This is then
used in the second phase, where patient flow is
computed using an Agent-Based Simulation (ABM)
that computes the progression of patients through the
spaces, utilizing a sequence of functions as resources.
Arrivals of patients are given as spreadsheets, based on
either (hypothetical) arrival times and functional
sequences, or, more commonly, using real data obtained
through either the Hospital Information System (HIS) or
the underlying Enterprise Resource Planning (ERP)
System. As functions are the resources within the
simulation, their usage is recorded and visualized in the
third phase as Bubble diagram: For each function, a
bubble with circle size according to capacity is drawn.
The circle is colored according to functional utilization
compared with capacity (under-utilized, over-utilized or
well-utilized). Relationship lines between function are
also depicted, based on the simulated flow between
functions. Conceptually, this work is similar to e.g. (De
Vries, Jessurun and Dijkstra 2002) - being a design and
decision support tool based on employing simulation in
the architectural workflow. Our focus on earliest stages
(i.e. pre-tender phase) is, however, unprecedented in
hospital planning, requiring careful though over what
data already exists, as will be shown in the following
elaborations.
4.1. Rectangle analysis
Schema diagrams are drawn intuitively, as rectangles-
within-rectangles and possible overlaps. In this section,
a quick run-through of the analyzed features is made
(also refer to Fig. 4):
Hierarchy buildup. The pair-wise analysis of
topological relationship between each two
rectangles gives either “separated”,
“completely included in/completely
including”, “intersecting” or “touching”. In the
first (trivial) case, the rectangles are
completely separate and thus modeled as own
entities. In the second case “included
in/including”, the rectangles form a parent-
child relationship. When “intersecting”, the
rectangles also form a parent-child
relationship; however, it is still unclear which
is the parent and which the child rectangle. Z-
order of the rectangles can be used as tie-
breaking mechanism - the child element being
the one that is arranged ‘on top’. Intersections
are commonly used spaces that are used by
more than one parent - e.g. a central operation
theatre being used by many connecting areas.
Accordingly, the hierarchy we build up offers,
for each rectangle, the ability to have more
than one parent - thus forming a semi-lattice
rather than a tree structure (Alexander 1965).
The last case, “touching” rectangles, is ignored
- we assume each of the both rectangles are
children of a common parent structure, and the
touching relation being there to depict
adjacency, not hierarchy.
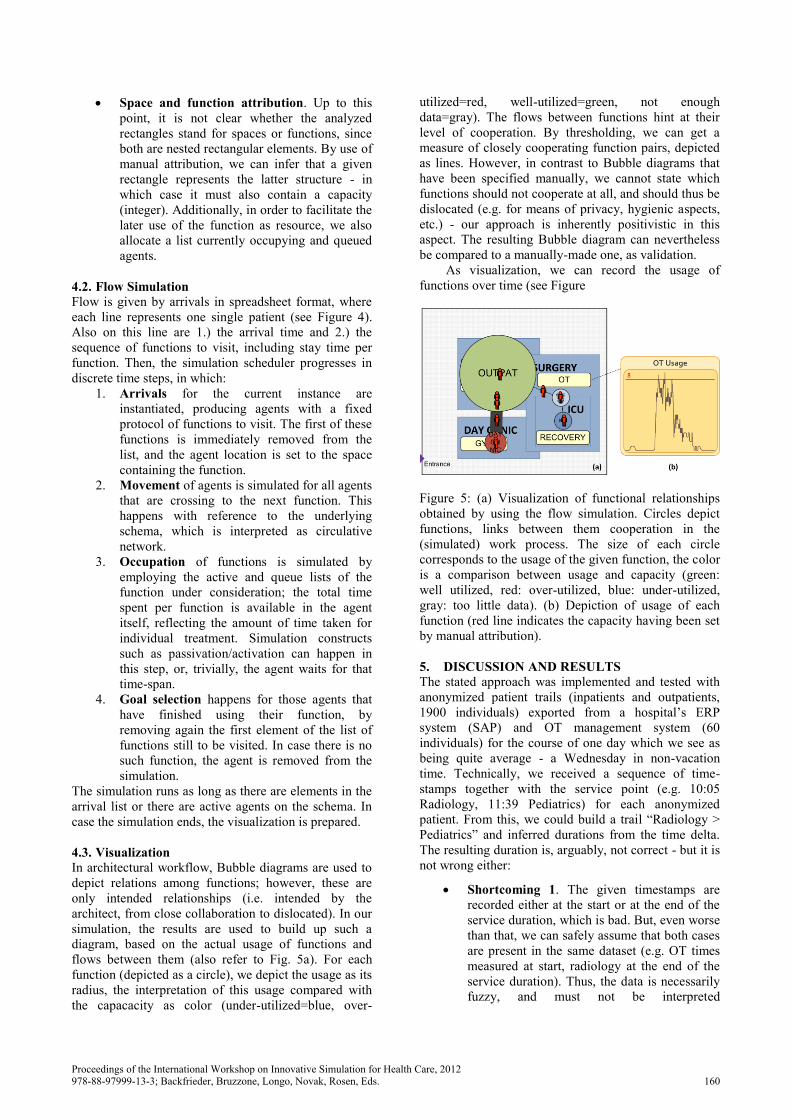
Figure 4: Depiction of the first part of the workflow
used in the pre-tender simulation: A schema given as
diagram is analyzed into a hierarchy of spaces on which
a multi-agent simulation acts, using an underlying
arrival list that states, for every agent, the list of
functions to visit. The according patient flows are
visualized as arrows. Furthermore, functional usage is
recorded for later visualization.
Proceedings of the International Workshop on Innovative Simulation for Health Care, 2012978-88-97999-13-3; Backfrieder, Bruzzone, Longo, Novak, Rosen, Eds. 159
Space and function attribution. Up to this
point, it is not clear whether the analyzed
rectangles stand for spaces or functions, since
both are nested rectangular elements. By use of
manual attribution, we can infer that a given
rectangle represents the latter structure - in
which case it must also contain a capacity
(integer). Additionally, in order to facilitate the
later use of the function as resource, we also
allocate a list currently occupying and queued
agents.
4.2. Flow Simulation
Flow is given by arrivals in spreadsheet format, where
each line represents one single patient (see Figure 4).
Also on this line are 1.) the arrival time and 2.) the
sequence of functions to visit, including stay time per
function. Then, the simulation scheduler progresses in
discrete time steps, in which:
1. Arrivals for the current instance are
instantiated, producing agents with a fixed
protocol of functions to visit. The first of these
functions is immediately removed from the
list, and the agent location is set to the space
containing the function.
2. Movement of agents is simulated for all agents
that are crossing to the next function. This
happens with reference to the underlying
schema, which is interpreted as circulative
network.
3. Occupation of functions is simulated by
employing the active and queue lists of the
function under consideration; the total time
spent per function is available in the agent
itself, reflecting the amount of time taken for
individual treatment. Simulation constructs
such as passivation/activation can happen in
this step, or, trivially, the agent waits for that
time-span.
4. Goal selection happens for those agents that
have finished using their function, by
removing again the first element of the list of
functions still to be visited. In case there is no
such function, the agent is removed from the
simulation.
The simulation runs as long as there are elements in the
arrival list or there are active agents on the schema. In
case the simulation ends, the visualization is prepared.
4.3. Visualization
In architectural workflow, Bubble diagrams are used to
depict relations among functions; however, these are
only intended relationships (i.e. intended by the
architect, from close collaboration to dislocated). In our
simulation, the results are used to build up such a
diagram, based on the actual usage of functions and
flows between them (also refer to Fig. 5a). For each
function (depicted as a circle), we depict the usage as its
radius, the interpretation of this usage compared with
the capacacity as color (under-utilized=blue, over-
utilized=red, well-utilized=green, not enough
data=gray). The flows between functions hint at their
level of cooperation. By thresholding, we can get a
measure of closely cooperating function pairs, depicted
as lines. However, in contrast to Bubble diagrams that
have been specified manually, we cannot state which
functions should not cooperate at all, and should thus be
dislocated (e.g. for means of privacy, hygienic aspects,
etc.) - our approach is inherently positivistic in this
aspect. The resulting Bubble diagram can nevertheless
be compared to a manually-made one, as validation.
As visualization, we can record the usage of
functions over time (see Figure
Figure 5: (a) Visualization of functional relationships
obtained by using the flow simulation. Circles depict
functions, links between them cooperation in the
(simulated) work process. The size of each circle
corresponds to the usage of the given function, the color
is a comparison between usage and capacity (green:
well utilized, red: over-utilized, blue: under-utilized,
gray: too little data). (b) Depiction of usage of each
function (red line indicates the capacity having been set
by manual attribution).
5. DISCUSSION AND RESULTS
The stated approach was implemented and tested with
anonymized patient trails (inpatients and outpatients,
1900 individuals) exported from a hospital’s ERP
system (SAP) and OT management system (60
individuals) for the course of one day which we see as
being quite average - a Wednesday in non-vacation
time. Technically, we received a sequence of time-
stamps together with the service point (e.g. 10:05
Radiology, 11:39 Pediatrics) for each anonymized
patient. From this, we could build a trail “Radiology >
Pediatrics” and inferred durations from the time delta.
The resulting duration is, arguably, not correct - but it is
not wrong either:
Shortcoming 1. The given timestamps are
recorded either at the start or at the end of the
service duration, which is bad. But, even worse
than that, we can safely assume that both cases
are present in the same dataset (e.g. OT times
measured at start, radiology at the end of the
service duration). Thus, the data is necessarily
fuzzy, and must not be interpreted
Proceedings of the International Workshop on Innovative Simulation for Health Care, 2012978-88-97999-13-3; Backfrieder, Bruzzone, Longo, Novak, Rosen, Eds. 160
quantitatively but rather qualitatively and with
a grain of salt.
Shortcoming 2. We cannot compute durations
from a single time stamp (or, as in the example
mentioned earlier, we do not know how long
the patient was in the Pediatrics unit). To
counter this problem, average service times
were used where available.
Shortcoming 3. The duration computed has
not necessarily got to do anything with the real
service time. For example, the time delta
between 11:39 Pediatrics and 10:05 Radiology
would be 1 hour 34 minutes, which is a rather
long time for, say, an x-ray. Again using
average service times (e.g. x-ray: 4 minutes),
one can dispatch the patient to the next
function and use the remaining time as waiting
time (i.e. Radiology(4m)>Pediatrics(1h 30m)).
In contrast to the mentioned problems, we also saw a
large benefit: We were able to transfer knowledge about
a hospital to a new design, using arrivals and current
trails as input for a new design. For this to be possible, a
transformation and mapping step was incorporated into
the interpretation of the timestamps: Each current
service point name was replaced by the name of the
future planned function (e.g. ‘Pediatrics’ becomes
‘Pediatric Centre’). In the same instance, we also
distinguished trails by the type of patient
(inpatient/outpatient) and functions present in the trail,
in order to colour-code them (see Figure 6a). In this
fashion, an outpatient with the trail
Radiology(4m)>Pediatric Centre(1h 30m) would be
tagged as child. By the assumed type of person, we also
choose an entrance space to complete the arrival, i.e.
arrival at 10:05: Main Entrance(0m) > Radiology(4m) >
Pediatric Centre(1h 30m) > Main Entrance(0m). The
passage times between functions are disregarded.
Figure 6: Implementation in Microsoft Visio. (a) Graph
editor used for inputting schema and, subsequently, for
depicting the flow of agents across a set of functions,
which is visualized as bubble-diagram. (b) Manual
attribution of shapes and setting of capacity for
functions. (c) Depiction of function usage over time.
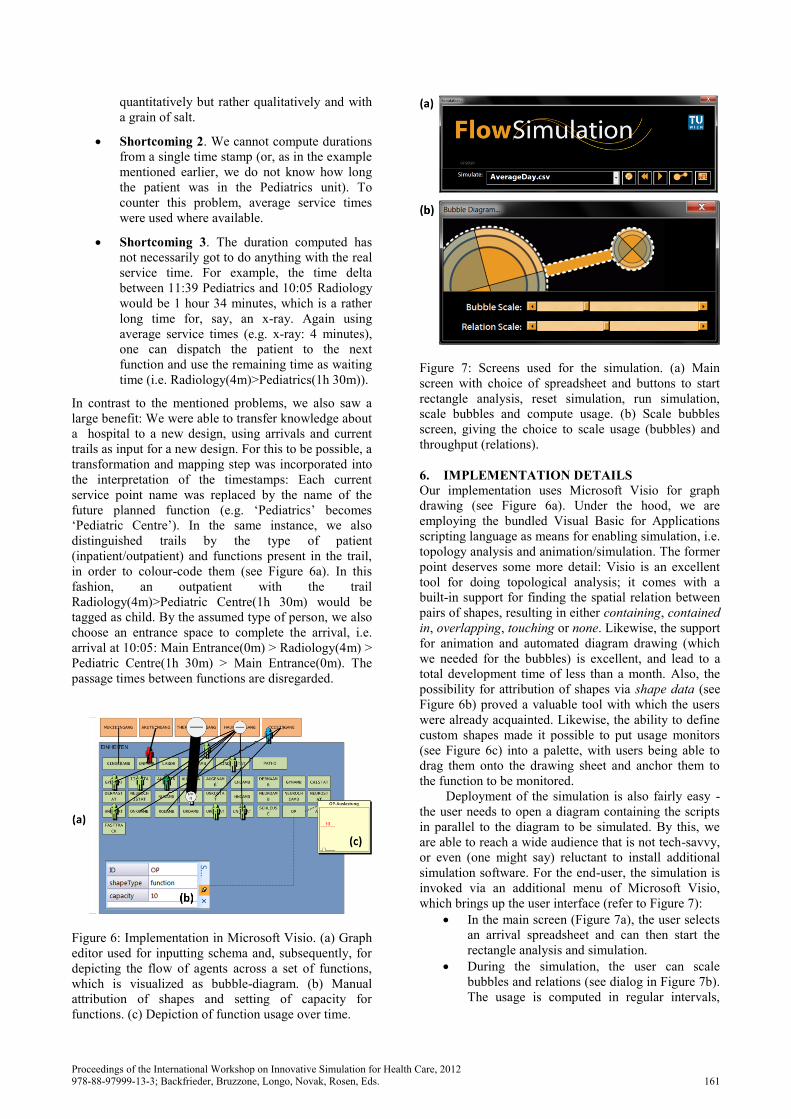
Figure 7: Screens used for the simulation. (a) Main
screen with choice of spreadsheet and buttons to start
rectangle analysis, reset simulation, run simulation,
scale bubbles and compute usage. (b) Scale bubbles
screen, giving the choice to scale usage (bubbles) and
throughput (relations).
6. IMPLEMENTATION DETAILS
Our implementation uses Microsoft Visio for graph
drawing (see Figure 6a). Under the hood, we are
employing the bundled Visual Basic for Applications
scripting language as means for enabling simulation, i.e.
topology analysis and animation/simulation. The former
point deserves some more detail: Visio is an excellent
tool for doing topological analysis; it comes with a
built-in support for finding the spatial relation between
pairs of shapes, resulting in either containing, contained
in, overlapping, touching or none. Likewise, the support
for animation and automated diagram drawing (which
we needed for the bubbles) is excellent, and lead to a
total development time of less than a month. Also, the
possibility for attribution of shapes via shape data (see
Figure 6b) proved a valuable tool with which the users
were already acquainted. Likewise, the ability to define
custom shapes made it possible to put usage monitors
(see Figure 6c) into a palette, with users being able to
drag them onto the drawing sheet and anchor them to
the function to be monitored.
Deployment of the simulation is also fairly easy -
the user needs to open a diagram containing the scripts
in parallel to the diagram to be simulated. By this, we
are able to reach a wide audience that is not tech-savvy,
or even (one might say) reluctant to install additional
simulation software. For the end-user, the simulation is
invoked via an additional menu of Microsoft Visio,
which brings up the user interface (refer to Figure 7):
In the main screen (Figure 7a), the user selects
an arrival spreadsheet and can then start the
rectangle analysis and simulation.
During the simulation, the user can scale
bubbles and relations (see dialog in Figure 7b).
The usage is computed in regular intervals,
Proceedings of the International Workshop on Innovative Simulation for Health Care, 2012978-88-97999-13-3; Backfrieder, Bruzzone, Longo, Novak, Rosen, Eds. 161

which the user can override by pressing a
“compute usage” button.
CONCLUSIONS
We have presented a novel approach that helps clients
simulate a very preliminary schematical diagram,
targeted at the pre-tender phases of a hospital project,
where requirements have to be elaborated in close
collaboration between medical staff and patients. The
output of the approach is suitable as input for the
competition, since it speaks the language architects
understand (i.e. bubble diagrams, functions and spaces).
REFERENCES
Alexander, C.A., 1965. A City Is Not A Tree (Part 1),
Architectural Forum, 122(1), 58-62.
De Vries, B., Jessurun, A.J., Dijkstra, J., 2002.
Conformance Checking by Capturing and
Simulating Human Behaviour in the Built
Environment, Proceedings of the 6th Design and
Decision Support Systems in Architecture and
Urban Planning, pp. 378-391.
DIN 13080, 2003. Gliederung des Krankenhauses in
Funktionsbereiche und Funktionsstellen, Beuth
Verlag, Berlin.
Lohfert, P., 2005. Methodik der Krankenhausplanung,
Lohfert & Lohfert AS, Copenhagen.
Seonwook, K., Miyoung, P., 2012, Architectural and
Program Diagrams 1 - Construction and Design
Manual, DOM Publishers, Berlin.
Tabak, V., 2008. User Simulation of Space Utilisation,
Ph. D. Thesis, TU Eindhoven.
White, E.T., 1986. Space Adjacency Analysis:
Diagramming information for architectural
design, Architectural Media, Tucson.
Wurzer, G., Fioravanti, A., Loffreda, G., Trento, A.,
2010. Function & Action: Verifying a functional
program in a game-oriented environment,
Proceedings of the 28th eCAADe, pp. 389-394.
Wurzer, G., 2010. Schematic Systems – Constraining
Functions Through Processes (and Vice Versa),
International Journal of Architectural Computing,
8(2), pp. 197–213.
Wurzer, G., 2011. Prozessvisualisierung in der
Krankenhausplanung, Ph. D. Thesis, Vienna
University of Techology.
Wurzer, G., 2012. In-Process Agent Simulation for
Early Stages of Hospital Planning, Preprints of
Mathmod 2012 Vienna, ARGESIM, Report no.
S38 (2012), Paper ID 190.
AUTHORS BIOGRAPHY
Gabriel Wurzer earned his Ph. D. degree in Process
Visualization and Simulation for Hospital Planning
from Vienna University of Technology in 2011. His
research in architectural sciences focuses on tool
support for early-stage planning of complex buildings,
with regular contributions to both Pedestrian and
Evacuation Dynamics conference (PED) and the
Education and Research in Computer Aided
Architectural Design in Europe conference (eCAADe),
from which he was awarded the Ivan Petrovic Prize in
2009. He is also an active researcher in archaeological
simulation, together with the Natural History Museum
Vienna.
Wolfgang Lorenz has a degree in Architecture from
Vienna University of Technology and is currently
working on his doctoral thesis on Fractal Geometry and
Quality in Architecture, in which he investigates the
concept of applying fractal geometry to architecture.
Apart from his research work, he also gives lectures on
“programming for architects” at the department of
computer aided planning and architecture.
Manfred Pferzinger got his Ph. D. degree from the
Private University for Health Sciences (UMIT) in 2012,
focusing his research on public health and health care
quality, in which subject he is author of numerous
articles and books. Apart from being associated scientist
at UMIT, he is lecturer for the University of Applied
Sciences in Upper Austria (Steyr, Austria) and the
University of Applied Sciences in Tyrol. He was
founding member of the Austrian Competence Circle
for Clinical Pathways (A3CP) and currently works as
managing director of medipro consulting, a company
that focuses on health care efficiency.
Proceedings of the International Workshop on Innovative Simulation for Health Care, 2012978-88-97999-13-3; Backfrieder, Bruzzone, Longo, Novak, Rosen, Eds. 162