practical stereological methods for morphometric cytology · for morphometric cytology ewald r....
TRANSCRIPT

P R A C T I C A L S T E R E O L O G I C A L M E T H O D S
FOR M O R P H O M E T R I C CYTOLOGY
E W A L D R . W E I B E L , G O N Z A G U E S. K I S T L E R , and
W A L T E R F . S C H E R L E
From the Department of Anatomy, University of Ztirich, Ztirieh, Switzerland
A B S T R A C T
Stereological principles provide efficient and reliable tools for the determination of quanti ta- tivc parameters of tissue structure on sections. Some principles which allow the estimation of volumetric ratios, surface areas, surface-to-volume ratios, thicknesses of tissue or cell shccts, and the number of structures are reviewed and presented in general form; means for their practical application in electron microscopy are outlined. The systematic and statistical errors involved in such measurements are discussed.
I N T R O D U C T I O N
In a previous communication (49), we presented methods by which tissues can be examined quanti- tatively at the electron microscopic level of resolu- tion. Further development of this work has yielded a set of methods which are widely applicable in the field of cytology and can efficiently produce a vast amount of reliable information. It is the pur- pose of this study to present these methods in practical form without entering into the theoreti- cal considerations on which they are based; the latter have been treated extensively by various investigators to whom reference will be made in appropriate places.
Biological morphologists still shy away from quantitation of their results for the primary reason that direct measurement of structures on sections is very cumbersome and yields doubtful results. On the other hand, geologists and metallurgists, who are faced with problems similar to ours, have de- veloped and are using methods of quantitation (12, 19, 8, 11, 42, 28) which, in recent years, have been applied to biomorphological problems with some applications touching on cytology (15, 21, 32, 44-49, 34, 40). With the development of reli- able quantitative techniques in physiology and biochemistry, a correlation of structure and rune-
tion of cells and tissues will necessitate the produc- tion of quantitative morphological data. The meth- ods reviewed and presented here should assist this endeavor.
G E N E R A L C O N S I D E R A T I O N S
The internal structure of an organ can be investi- gated only after destruction of the tissues. The most commonly used method of orderly destruction in cytology is that of sectioning of fixed and em- bedded tissues. By sectioning, the integrity of the tissue is preserved in two of the three dimensions of space while the third dimension is sacrificed for the bcncfit of rcsolution. If the section thickness is very thin with respect to the sizc of structures in- vestigated it can be disregarded and we can con- sider the section--which, in reality, is a slice of tissue---as a two-dimensional image of the internal tissue structurc. Three features of such infinitely thin sections must now be noted (47):
1. Every structure of the tissue is usually cut at random by a nonoriented section.
2. An n-dimcnsional structure of the tissue is represented on the section by an (n-1)-dimensional image: bodies are seen as areas, surfaces as lines, and lines as points.
23
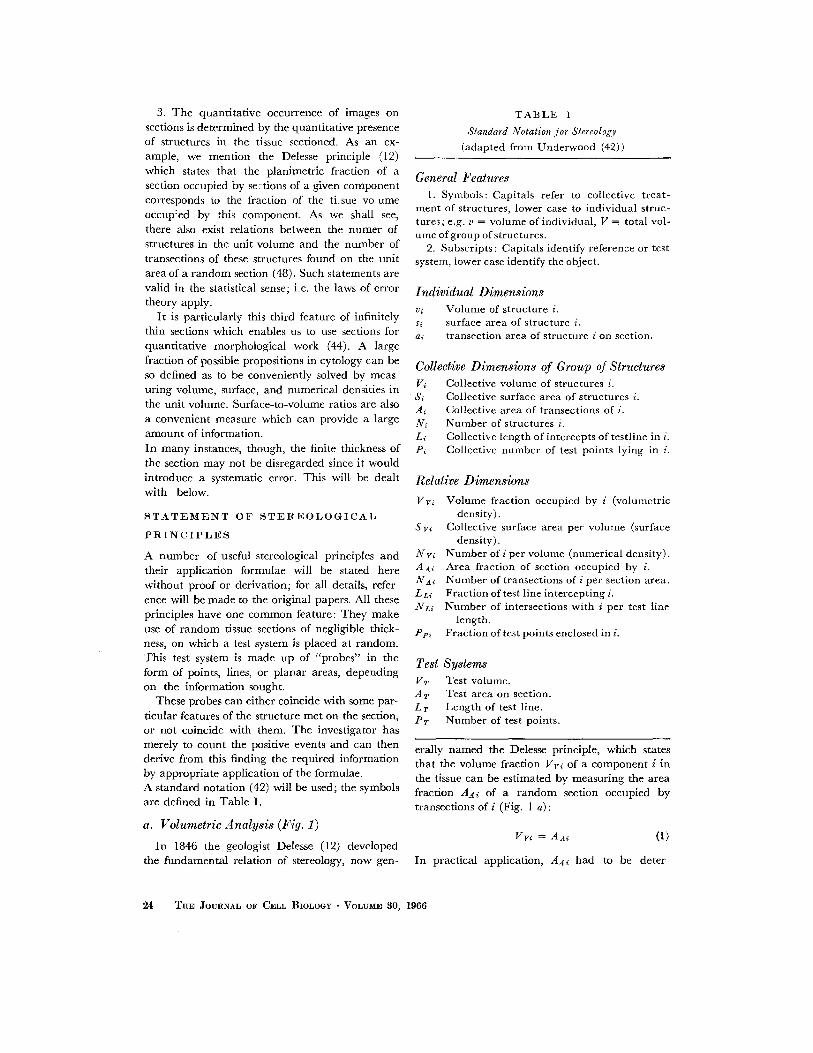
3. The quanti tat ive occurrence of images on sections is determined by the quantitative presence of structures in the tissue sectioned. As an ex- ample, we mention the Delesse principle (12) which states that the planimetric fraction of a section occupied by se:tions of a given component corresponds to the fraction of the ti_sue vo ume occup:ed by this component. As we shall see, there also exist relations between the numer of structures in the unit volume and the number of transections of these structures found on the unit
area of a random section (48). Such statements are valid in the statistical sense; i.e. the laws of error theory apply.
I t is particularly this third feature of infinitely thin sections which enables us to use sections for quanti tat ive morphological work (44). A large fraction of possible propositions in cytology can be so defined as to be conveniently solved by meas- uring volume, surface, and numerical densities in the unit volume. Surface-to-volume ratios are also
a convenient measure which can provide a large amount of information.
In many instances, though, the finite thickness of the section may not be disregarded since it would introduce a systematic error. This will~ be dealt with below.
S T A T E M E N T OF S T E R E O L O G I C A L
P R I N C I P L E S
A number of useful stereological principles and their application formulae will be stated here without proof or derivation; for all details, refer- encc will be made to the original papers. All these principles have one common feature: They make use of random tissue sections of negligible thick- ness, on which a test system is placed at random. This test system is made up of "probes" in the form of points, lines, or planar areas, depending on the information sought.
These probes can either coincide with some par-
ticular features of the structure met on the section, or not coincide with them. The investigator has merely to count the positive events and can then derive from this finding the required information by appropriate application of the formulae. A standard notation (42) will be used; the symbols are defined in Table I.
a. Volumetric Analys is (Fig. 1)
In 1846 the geologist Delesse (12) developed the fundamental relation of stereology, now gen-
T A B L E I
Standard Notation .for Stereology (adapted from Underwood (42))
General Features l. Symbols: Capitals refer to collective treat-
ment of structures, lower case to individual struc- tures; e.g. v = volume of individual, V = total vol- ume of group of structures.
2. Subscripts : Capitals identify reference or test system, lower case identify the object.
Individual Dimensions vi Volume of structure i. gl surface area of structure i. a~ transection area of structure i on section.
Collective Dimensions of Group of Structures Vi Collective volume of structures i. Si Collective surface area of structures i. Ai Collective area of transections of i. Ni Number of structures i. Li Collective length of intercepts of testline in i. Pi Collective number of test points lying in i.
Relative Dimensions
Vvl Volume fraction occupied by i (volumetric density).
Sw Collective surface area per volume (surface density).
N w Number of i per volume (numerical density). AAI Area fraction of section occupied by i. Nal Number of transeetions of i per section area. LLI Fraction of test line intercept ingi . NL~ Number of intersections with i per test line
length. PPi Fraction of test points enclosed in i.
Test Systems VT Test volume. AT Test area on section. LT Length of test line. P r Number of test points.
erally named the Delesse principle, which states that the volume fraction Vvi of a component i in the tissue can be estimated by measuring the area fraction AAi of a random section occupied by transections of i (Fig. 1 a) :
Vvl = AA~ (1)
In practical application, A~i had to be deter
24 ThE JOUI~NAL OF CELL BIOLOGY " VOLUME 30, 1966

~ . ~ ~ .:: ..... ~:.. 1 ;...-: -.. . ..." ~ ~ ~ ' .,.:! :.-~.
mined by cumbersome planimetry. Rosiwal (37) found, in 1898, that AAi could be estimated by lineal integration (Fig. 1 b), determining the lineal fraction LLi of test lines passing through transections of i. This procedure is still in use (38, 34, 44). In final reduction of this principle, Glagoleff (19) found, in 1933, that planimetry could be done by superimposing a regular point lattice on the section and counting the points which lie on transections of the structures (Fig. 1 c). Chalkley (6) and Attardi (1) proposed similar procedures for application in histology. The frac- tion PPi of points lying on transections of i would thus be an estimate of Vvi:
Vvl = PP; (2)
This procedure is the most efficient to use, par- ticularly in electron microscopy (44, 49), since the necessary measurement consists merely of count- ing. Rather complicated analyses can thus be easily carried out (30, 46). Hennig (25) has also shown that point-counting volumetry is to be pre- ferred to lineal integration, for statistical reasons. In the following, we will deal exclusively with point-counting volumetry.
As a practical example, we may wish to deter- mine the relative volumes of nuclei (Vv,) , mito- chondria (Vv,,), lysosomes (Vw), and cytoplasm (Vvc) in particular cell types. A regular point lattice is placed at random on random electron micrographs of random sections. The information sought is obtained by differential counting of the points Pi lying on n, m, l, and c, whereby points lying on other structures (interstitium, etc,) are pooled in a compartment x. We obtain the total number of test points as
PT = P.,~ + P,,~ + P~ + Pc + P~ = ~-] P~ (3)
and the volume fractions of the components as
P~ V w = - ;
PT
VV m ~ Pm etc. PT
~I(iVRE 1 Volumetric analysis of tissue composition on sections: (a) by planimetry; (b) by lineal integra- tion; (c) by differential point counting.
E. R. WEIBEL, G. S. I~ISTLER, AND W. F. SCHERLE Morphometric Methods 25

F*OVRE £ Determination of surface density from number of surface intersections with linear probes, which can be conveniently determined on sections.
generally by:
P~ Vvl = - - = Ppi (4)
PT
The absolute volume Vi of a given componen t in an organ, say of ml tochondr ia in the liver, can be computed from Vv~ if the total volume of the organ V is known :
V~ = Vv~. V (5)
b. M e a s u r e m e n t o f S u r f a c e A r e a s (Fig. 2).
Consider structures with a well defined surface embedded in the tissue. In the uni t volume, these structures will occupy a cer tain relative volume or volume density V v i , as discussed above. The i r total surface, S¢, included in the uni t test volume, VT, can be defined as their surface density S v i .
S~ Svl = - - (6)
VT
The surface of these structures will appear on sections as contour of the transections. The length of these contours on the uni t test area of section will be proport ional to the surface density, S v i . If a test line of fixed length, L T , is r andomly placed in the tissue it will pierce th rough the sur- face of these structures, whereby the n u m b e r of intersections, N i , between test line and surface
will be proport ional to Sv i and to LT. Tomkeieff (41) and Hennig (22) have independent ly derived
the relat ion:
Svl - 2 .Ni _ 2"NL¢ (7) LT
If the "surface" is considered to be a "shee t with two surfaces" the coefficient 2 has to be replaced
by 4 (22). Since the surface density, S v i , is represented on
sections by a proport ional "con tour density," the test llne can be placed at r a n d o m on r a n d o m sec- tions of the tissue and N~i can be obta ined by simple counts of intersections between probe and
surface contours. As practical examples, the surface area of cells
or of external and internal membranes of mito- chondr ia can be determined by this method.
The total surface area of these structures in a given or known volume, for example in the organ
volume, is obta ined from
S~rOT = S v i ' V (8)
C. S u r f a c e - t o - V o l u m e R a t i o s
The surface-to-volume ratio of structures proves to be a very useful measure. O n the one hand , i t is related to geometric features of the structures, and, on the other, it can often serve as a direct measure of some physiological propert ies of these structures since it gives the size of thei r contac t area with the surroundings per mass of structure.
Chalkley and Cornfield (7, 10) have derived a method for direct evaluat ion of the surface-to- volume ratio of structures: it is essentially a straightforward combina t ion of point -count ing volumetry with surface est imation by line inter- section. The test system consists of short lines of equal length, Z, which again are randomly placed on r a n d o m sections (Fig. 3). The two end-points of these test lines are used as markers for volu- metry: end-points lying on sections of structures are counted as "h i t s " and recorded as P i . Simul- taneously, tha t is, wi thout displacement of the test system, the n u m b e r of intersections, N z i , of test lines and surface contour of the structures is re- corded. The surface-to-volume ratio, s i /v¢ , of individual structures, i, follows from:
sl 4. Ni (9)
vi Z.P~
26 THE ~'OURNAL OF CELL BIOLOGY • VOLVME 30, 1966

FmuaE 3 Estimation of surface-to-volume ratio with short linear probes.
This relation can be directly derived from equa-
tions 4 and 7 if we take L r P~--Z = as the total 2
length of the test line, a condition which is fulfilled since there are two end-points to each short test line in the system of Fig. 3.
d. Measurement of Average Thicknesses
In a previous communication (49), we presented a method for estimating the arithmetic mean thickness ~ of a tissue sheet or a cell layer by modifying the above principle for surface-to- volume ratios. ~ is here defined as the average tissue volume per half the surface area of the sheet. Again, placing a test system of short lines of length Z on random sections of the sheet, i, we record, as above, the number of end-points, P i , lying on sheet tissue and the number of surface intersections, Ni, and obtain
Z. Pi = - - (io)
2 .N i
For considerations on transport across tissue lay- ers, the harmonic mean thickness r~ is often a more appropriate measure of the effective average thick- ness (44, 49). I t is defined as the average of the reciprocals of all local thicknesses. Randomly placing long lines on sections of the sheet, we can record the intercept lengths l, that is, the length of test llne lying between the two surface inter-
sections, and form the harmonic mean intercept length, lh, by averaging the reciprocal values of l. From this we obtain
2 r~ = : lh (11)
5
e. Estimation of the Number of Particulate
Structures
The number Nvi of particulate structures i con- tained in the unit volume of tissue can again be estimated from sections (Fig. 4). We found that the number of transections of i counted on the unit area of random section, Nal, is proportional to Nvi (48, 44). However, this relationship is not straightforward. It depends on a variety of factors which have to be determined by other means. Most importantly, it depends on a knowledge of the shape of the structures; there are various means of determining this from the shape of sec- tion images (14, 16). In addition, we need to know something about the size distribution of structures (11, 31, 4).
If the structures studied are all of the same shape
and roughly of the same size, two basic relations
between Nvi and Na i are available. De Hoff and
Rhines (11) have shown that
Nai = Nvi.D~ (12)
f :
L I~IOURE 4 Estimation of number of (spherical) struc- tures from number of tmnsections and volumetric density.
E. R. WEIBEL, G. S. KISTLER, AND W. F. SCnERLE Morphometrie Methods 27

where Di is the average " tangent diameter" of the structures. In the case of spherical structures, D is simply thelr average diameter. For ellipsoidal structures, [) can be determined graphically by the metkcd of Bach (4). While a knowledge of shape and size of the struc- ture is necessary for application of this method, another principle which was derived by Weibel and Gomez (48) requires only a rough knowledge of shape. This is introduced into the relation be- tween NA and Nv in form of a dimensionless co- efficient /3. Values of /3 for typical bodies have been presented in graphic form (48). In addition, we need to know the volumetric fraction Vv i oc- cupied by the bodies; this can be obtained by simple pcint-counting analysis. The following formula applies:
1 NAi 31~ Nv i (13)
.~i " V v ? j~
N~ii and V v i can be determined simultaneously if a test system is chosen in which a lattice of points is enclosed in a square area (Fig. 4). We count the number of transections, N a i , lying within the square (counting those transections which are cut by the left and upper margin and rejecting those cut by the right and lower margin), and determine the point fraction, P P i , lying on transections ac- cording to equation 4. In equation 13, we then can substitute PPi for Vv i and obtain the number of structures in the unit volume if we can make some assumptions with respect to their shape
(/3d- This latter principle can also be applied if the size cf the structures varies within certain limits. A size distribution coefficient K must then be introduced (31, 45):
| N A i 3;2 Nv~ K (14)
/31" V v~ 112
K is the ratio cf third to first moment of the dis- tribution of diameters (31). It is thus always larger than 1. For a normal distribution with a standard deviation of -4-25 % of the mean, K = 1.07.
Well defined biological structures often show a rather narrow size distribution. For renal glome- ruli it was found, for example, that K = 1.014 (31, 45). ~[his coefficient can thus be disregarded for many practical purposes or replaced by an arbitrary coefficient of the order of 1.02 to 1.1,
particularly when comparisons between control and experimental materials are sought. Caution is indicated, though, when an experiment may have induced a change in the size distribution; this can be tested by determining the variance of the size distribution of the sections in both control and experimental materials (3).
A M U L T I P U R P O S E T E S T S Y S T E M
The presentation of the above principles has shown that morphometric work requires the following "probes": a test area for counting structures, a lattice of test points for volumetric work, ann test
lines for surface estimation. A number of test sys- tems have been proposed for various tasks (6, 7, 1, 20, 25, 44, 45, 49), and it is essentially a matter of personal preference which one is selected for a particular problem. If volumetric analysis of tissues alone is wanted at the light microscope level, the Zeiss Integrating Eyepiece I may be used (23). Similarly, for surface area measurement in the light microscope the Zeiss Integrating Eyepiece I I is suitable (22). For counting transections any eyepiece containing a reticle with a square grid can be used.
In our own work, a multipurpose test system, which combines area, points, and lines (Fig. 5), was found to be particularly useful since it enabled us to obtain a large variety of information with one and the same test system. It was developed from a system presented previously for work done directly on the screen of the electron microscope (49). We are using three variants which differ only in the number of test lines and test points, but not in the general properties.
Fig. 5 A shows the general arrangement of the test system. A square area contains 21 lines of constant length, Z, which are arranged on 7 equi- distant and parallel rows, whereby the distance between the end-points of the lines is Z in every direction. These P r = 42 end-points thus form an equilateral triangular lattice; they can be used as test points for point-counting volumetry. With this arrangement each test point has an absolute
area value a - %//3 -Z=; it is thus possible to per-
form planimetry with this test system as well (1, 27), by ascribing to each point lying within the
planar area to be measured this area value a.
The 1/~ P r = 21 test lines of length Z serve as
probes for surface estimations according to equa-
tion 7. By recording NL as the number of inter-
28 THE JOURNAL OF CELL BIOLOGY • VOLUME 30, 1966
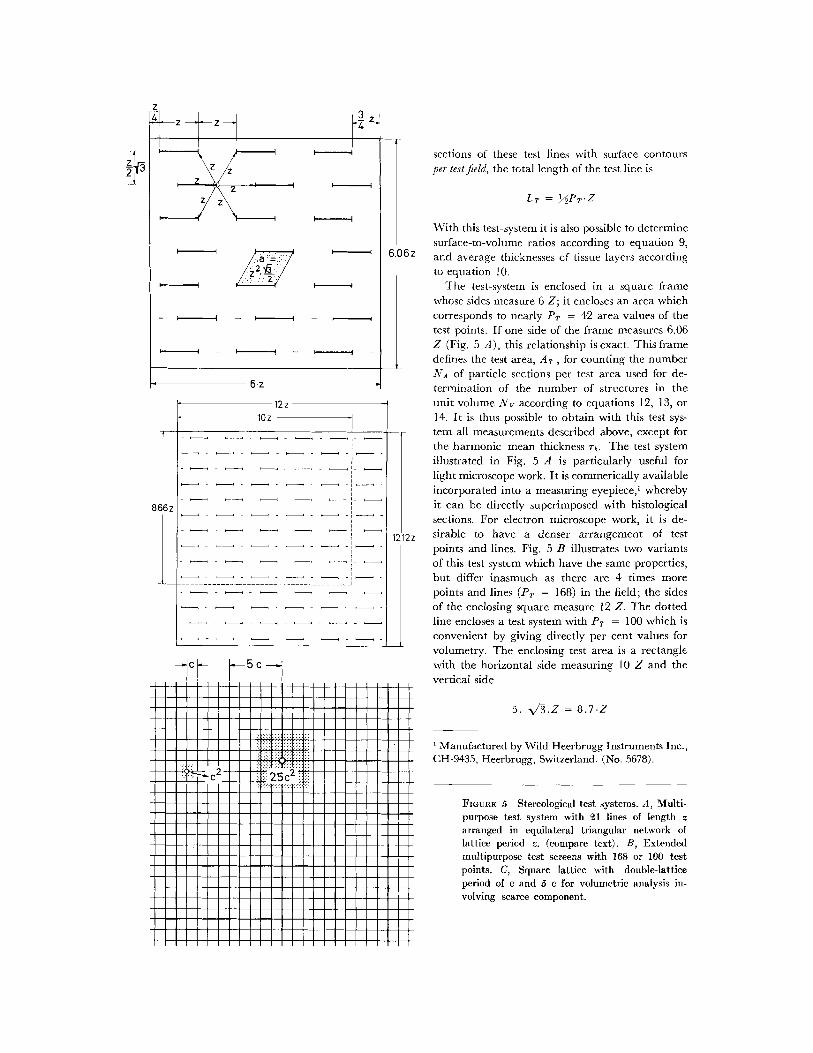
sections of these test lines with surface contoursper test field, the total length of the test line is
LT = 2PT.Z
With this test-system it is also possible to determinesurface-to-volume ratios according to equation 9,
6z and average thicknesses of tissue layers according
to equation 10.The test-system is enclosed in a square frame
whose sides measure 6 Z; it encloses an area whichcorresponds to nearly PT = 42 area values of thetest points. If one side of the frame measures 6.06Z (Fig. 5 A), this relationship is exact. This framedefines the test area, AT, for counting the numberNA of particle sections per test area used for de-trmntin nF the nilmhr jf rtritlreR in thePunit volume NV according to equations 12, 13, or14. It is thus possible to obtain with this test sys-... _ I 1 21 i . . . . r_
the harmonic mean thickness Th. The test systemillustrated in Fig. 5 A is particularly useful forlight microscope work. It is commerically availableincorporated into a measuring eyepiece,' wherebyit can be directly superimposed with histological
sections. For electron microscope work, it is de-
12.12z sirable to have a denser arrangement of testpoints and lines. Fig. 5 B illustrates two variantsof this test system which have the same properties,but differ inasmuch as there are 4 times morepoints and lines (PT = 168) in the field; the sidesof the enclosing square measure 12 Z. The dottedline encloses a test system with PT = 100 which is
convenient by giving directly per cent values forvolumetry. 'lhe enclosing test area is a rectanglewith the horizontal side measuring 10 Z and thevertical side
5. ,13.Z = 8.7.Z
l Manufactured by Wild Heerbrugg Instruments Inc.,CH-9435, Heerbrugg, Switzerland. (No. 5678).
FIGURE 5 Stereological test systems. A, Multi-purpose test system with 21 lines of length zarranged in equilateral triangular network oflattice period z. (compare text). B, Extendedmultipurpose test screens with 168 or 100 testpoints. C, Square lattice with double-latticeperiod of c and 5 c for volumetric analysis in-volving scarce component.
12z10z
8.66 z
ItI
II
. i i i i i -
I I I I
I I I I
I I I I
I I I I
I 1 1 1
1 1 1 1
1 1 1 1
1 1 1
1 1 1
1 1 1illI I I -I I II I II I II I I
- I I I I I
tem S11 menellreme nt r" eerlher Shove extent ta
t _ 1 . PTI I '* ]

A L T E R N A T E T E S T S Y S T E M S
If volumetry alone is required it may be desirable to use a simpler test system. Haug (20) and others have used simple square grids, where the cross- points of lines serve as test points. Hennig (23, 25) has proposed hexagonal point-nets and has de- vised the Integrating Eyepiece I of Zeiss for their application.
In studying the volumetric density of scarce components in the cytoplasm, it may be advan- tageous to use a double-lattice test system as shown in Fig. 5 c. It consists of a square network with a lattice constant c, whereby every fifth line is heavier than the intermediate lines. The cross- points of all lines have an area value c2; i.e., planimetrically each point represents one little square of c 2. The heavy lines alone enclose squares of area (5 c)2; the area value of the cross-points of the heavy lines thus equals 25 c ~. The relative volume, V~, of the scarce component s in the volume of the cytoplasm, Vc, can be obtained by counting the number P, of cross-points falling onto s and the number P~ of heavy cross-points falling onto cytoplasm, through the formula
Vs P, (15)
vc 25.Po'
With this test system, it is possible to greatly reduce the counting labor without appreciably
reducing the quality of the result. On the con- trary, the error probability is reduced since we can
choose a point density with which at least one test point will fall onto every section of s. Modifica- tions of this principle can easily be found to suit every problem. A particular example is given below.
P R A C T I C A L A P P L I C A T I O N OF
T H E S E P R I N C I P L E S
Light Microscopy
I t has already been pointed out that various test systems can be optically superimposed on tissue sections in any ordinary microscope. Methods for random sampling of tissue sections and of micro- scope fields have been presented previously (44). In recent work we have made extensive use of very thin sections of plastic-embedded material (30, 46) viewed with a phase contrast microscope.
Electron Microscopy
In previous work (49), we used a test system engraved into the fluorescent screen of our elec- tron microscope and thus directly obtained the necessary measurements. We have now found it advantageous to record the electron micrographs on 35-mm film and to evaluate contact prints of these negatives in a table projector. This procedure is more efficient, reduces the necessary microscope time to a minimum, and ensures better resolution. The sequence of steps is described below.
A. SAMPLINC: The application of the afore- mentioned stereological principles depends on sound random sampling of the material. The tissue is cut into the customary dices which are fixed and processed in bulk. A random sample of, e.g., 10 dices is drawn (44); these are consecutively numbered and embedded in individual capsules without orientation, and the sections are mounted on copper grids fitted with a carbon-enforced Formvar film.
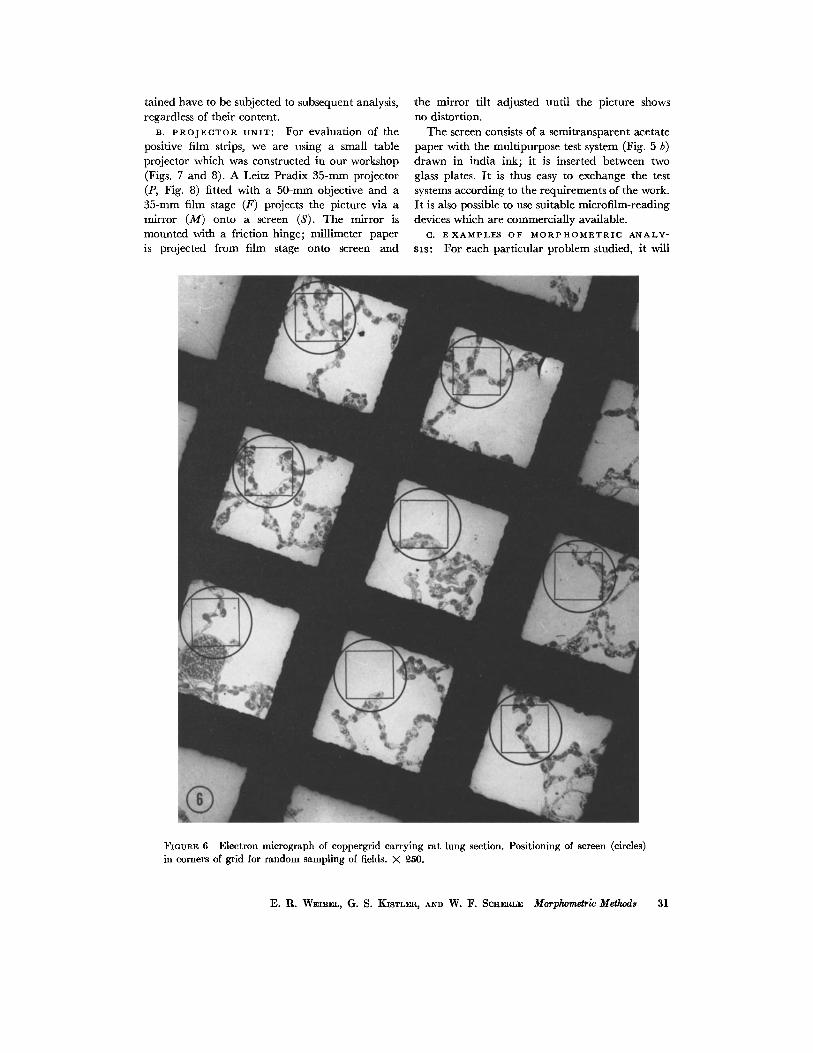
The sections are randomly subsampled in the electronmicroscope. Fig. 6 shows a low power electron micrograph of a 150-mesh copper grid carrying a section of rat lung. Random subsamples of such sections can be obtained by recording electron micrographs in one specific corner of each mesh. In the case of Fig. 6, the circles mark the position of the viewing screen; randomness is achieved by letting the edge of the screen just touch two edges of the copper bars. Depending on the number of electron micrographs required, one can either start with an arbitrary field and record all consecutive frames until the sample size
desired is reached; or, the fields to be recorded can be located by means of random numbers as proposed previously (44). The first procedure is
less cumbersome, however, and is adequate for most applications. The fields selected by one of these methods are recorded on 35-ram film. At the end of each recording period, a test specimen
(carbon grating) is micrographed for calibration purposes. The developed film strip is contact- printed onto positive film in a long light-box.
The square frame inside the circles marks the field finally recorded on the film and represents the sample studied. It should be noticed that the amount of lung tissue contained in each sample field varies considerably. If information on the composition of the entire organ-- inc luding air, tissue, and blood-- is sought, all the samples ob-
30 THE JOURNAL OF CELL BIOLOGY " VOLUME 30, 1966
tained have to be subjected to subsequent analysis, regardless of their content.
B. PROJECTOR UNIT: For evaluation of the positive film strips, we are using a small table projector which was constructed in our workshop (Figs. 7 and 8). A Leitz Pradix 35-ram projector (P, Fig. 8) fitted with a 50-mm objective and a 35-ram film stage (F) projects the picture via a mirror (M) onto a screen (S). The mirror is mounted with a friction hinge; millimeter paper is projected from film stage onto screen and
the mirror tilt adjusted until the picture shows no distortion.
The screen consists of a semitransparent acetate paper with the multipurpose test system (Fig. 5 b) drawn in india ink; it is inserted between two glass plates. I t is thus easy to exchange the test systems according to the requirements of the work. I t is also possible to use suitable microfilm-reading devices which are commercially available.
C. E X A M P L E S OF M O R P H O M E T R I C A N A L Y -
sis: For each particular problem studied, it will
FIGURE 6 Electron micrograph of coppergrid carrying rat lung section. Positioning of screen (circles) in comers of grid for random sampling of fields. X ~50.
E. R. WEIBEL, G. S. KmTLF-~, AND W° F. SCHERLE Morphometrlc Methods 31
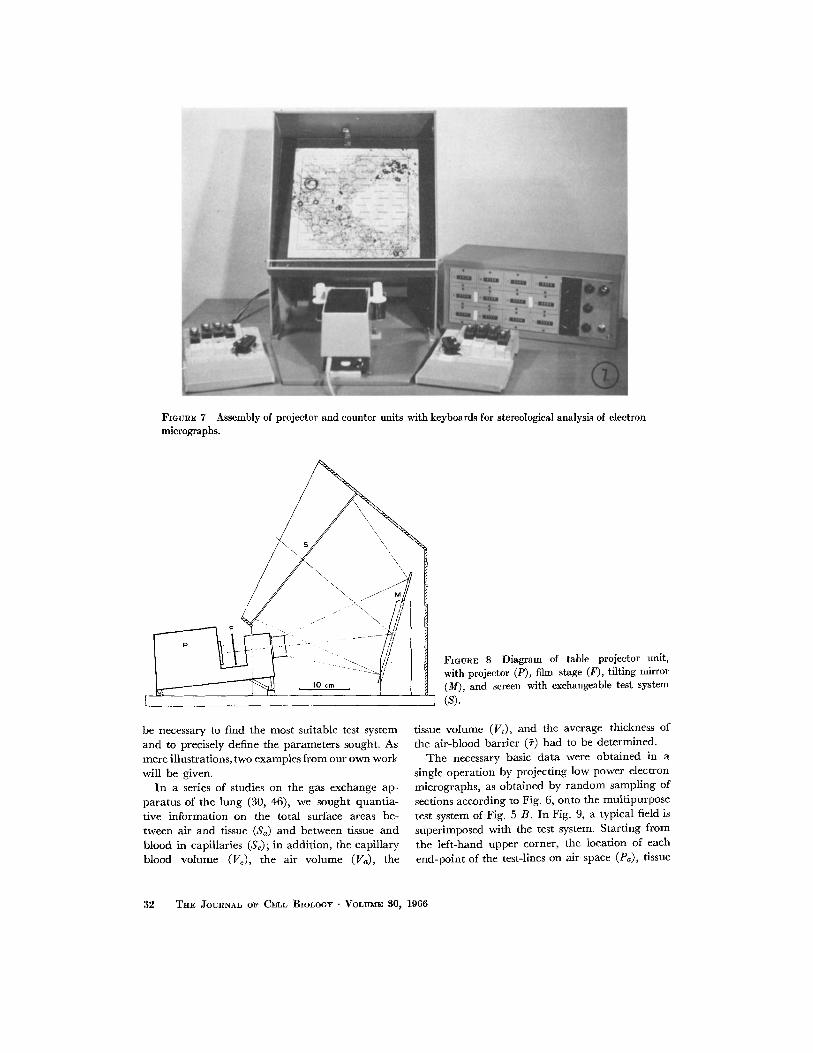
FIGURE 7 Assembly of projector and counter units with keyboards for stereological analysis of electron micrographs.
FIGURE 8 Diagram of table projector unit, with projector (P), film stage (F), tilting mirror (M), and screen with exchangeable test system
I (S).
be necessary to find the most suitable test system and to precisely define the parameters sought. As mere illustrations, two examples from our own worl~ will be given.
In a series of studies on the gas exchange ap- paratus of the lung (30, 46), we sought quantia- tive information on the total surface areas be- tween air and tissue (Sa) and between tissue and blood in capillaries (So); in addition, the capillary blood volume (Vc), the air volume (Va), the
tissue volume (Vt), and the average thickness of the air-blood barrier (~) had to be determined.
The necessary basic data were obtained in a single operation by projecting low power electron micrographs, as obtained by random sampling of sections according to Fig. 6, onto the multipurpose test system of Fig. 5 B. In Fig. 9, a typical field is superimposed with the test system. Starting from the left-hand upper corner, the location of each end-point of the test-lines on air space (Pa), tissue
32 T ~ E JOURNAL OF CELL BIOLOGY " VOLUM~ 30, 1966
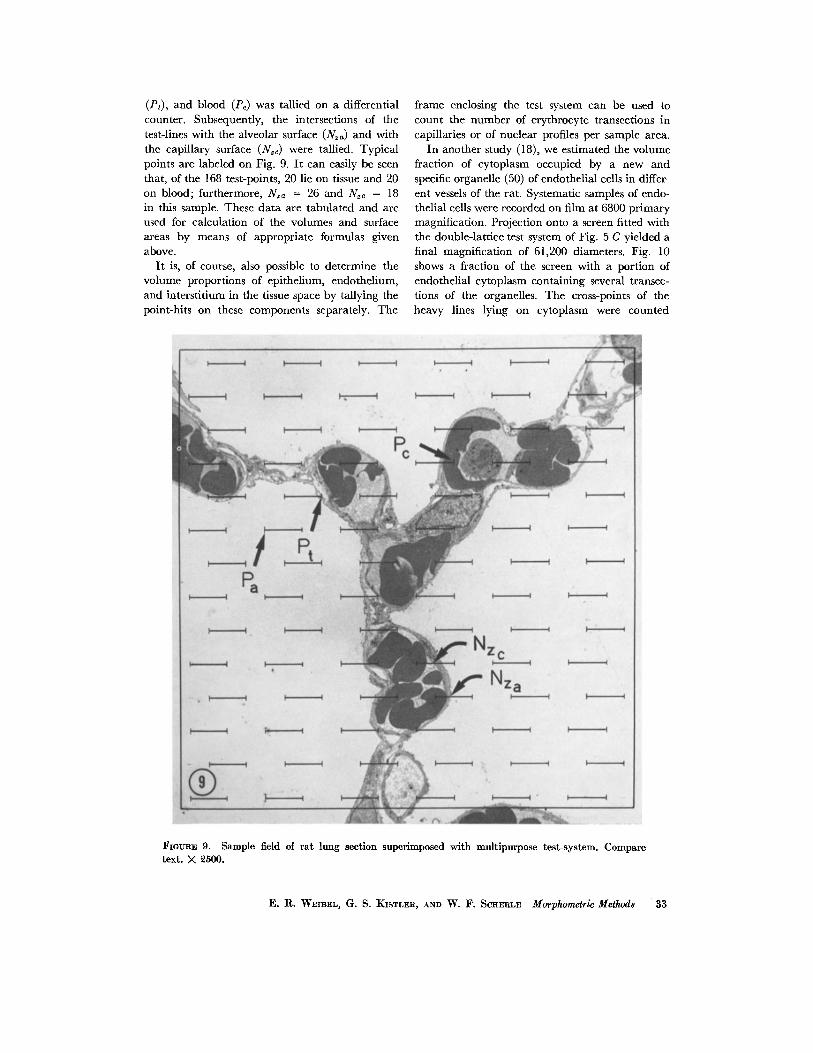
(Pt), and blood (Pc) was tallied on a differential counter. Subsequently, the intersections of the test-lines with the alveolar surface (N~a) and with the capillary surface (N~c) were tallied. Typical points are labeled on Fig. 9. I t can easily be seen that, of the 168 test-points, 20 lie on tissue and 20 on blood; furthermore, N~a = 26 and N~c = 18 in this sample. These data are tabulated and are used for calculation of the volumes and surface areas by means of appropriate formulas given above.
I t is, of course, also possible to determine the volume proportions of epithelium, endothelium, and interstitium in the tissue space by tallying the point-hits on these components separately. The
frame enclosing the test system can be used to count the number of erythrocyte transections in capillaries or of nuclear profiles per sample area.
In another study (18), we estimated the volume fraction of cytoplasm occupied by a new and specific organelle (50) of endothelial cells in differ- ent vessels of the rat. Systematic samples of endo- thelial cells were recorded on film at 6800 primary magnification. Projection onto a screen fitted with the double-lattice test system of Fig. 5 C yielded a final magnification of 61,200 diameters. Fig. 10 shows a fraction of the screen with a portion of endothelial cytoplasm containing several transec- tions of the organelles. The cross-points of the heavy lines lying on cytoplasm were counted
Fmtm~ 9. Sample field of rat lung section superimposed with multipurpose test-system. Compare text. X 2500.
E. R. W~IBEL, G. S. KISTLER, AND W. F. SCHERLE Morphometric Method8 33

FIGURE 10 Sample field of endothelial cytoplasm from human skin venule superimposed with double- lattice test-system. Arrows identify some profiles of the specific organelle investigated. L, vessel lumen, B, basement membrane, M, mitochondrion. )< 44,000.
(P / ) to estimate the area of cytoplasm present on the sample. Then the number of all cross-points lying on organelles (Pk) was recorded. The rela- tive volume Vvk of the organelles in the cytoplasm was obtained from equation 16.
In this last example, section thickness has to be taken into consideration, since the size of the or- ganelles is of about the same dimension. The value of Vvk obtained from the data overestimates the true value by about 50 %.
D. CALIBRATION: In order to avoid un-
necessary intermediate errors in calibration, it is advisable to record a calibration test specimen (silver screen, carbon-grating replica) on each film strip. At the end of evaluation in the projector unit, the absolute value of the test unit, Z, is de- termined with this calibration recording. I t should be noted that calibration is essentially irrelevant if volumetric work by point-counting alone is per- formed.
With this procedure, we found very small varia- tions in calibration. These were always due to
34 THE JOURNAL OF CELL BIOLOGY • VOLUME 80, 1966

variations in the intermediate lens settings and were thus identical for calibration specimen and sections. I t is, of course, necessary to observe all precautions for adequate calibration (5, 36).
E. D A T A R E C O R D I N G : Since the necessary measurements are essentially reduced to a differ- ential counting of different "hits" and "cuts," the data can be conveniently recorded in a simple counter unit. Commercially available hematologl- cal counters can be used. For more extensive work, we have constructed a more efficient electric counter unit with 10 counters and two totalizers (Fig. 7). The counters are arranged in series with one of the two totalizers and are fed with single impulses from Miltac microswitches which are mounted on two keyboards to allow easy handling with both hands (Fig. 7). At the end of each count- ing sequence, the counters are read off onto tables.
D I S C U S S I O N
The methods of measurement reviewed in this paper are very efficient and yield reliable results on numerous propositions (44, 35, 30, 46, 15, 40). However, two types of errors may affect this work: (a) systematic errors due to the techniques em- ployed, and (b) statistical errors. These should be discussed here without entering into details, since they should not lead to serious difficulties if the necessary precautions are observed.
Among the systematic errors, tissue-processing arti- facts are most important (49). These can be elimi- nated almost entirely if the fixation and processing media are carefully adjusted to isotonicity. For comparative work, they are further reduced by strict standardization of the laboratory techniques. Under special circumstances, however, the pos- sibility of some residual systematic error has to be borne in mind. If this cannot be eliminated, ap- propriate mathematical correction should be considered (44).
The principles stated above apply only to sec- tions of (nearly) infinite thinness. Finite section thickness will introduce a certain systematic error (Holmes effect, 29) which depends on the ratio of section thickness to mean "diameter" of the structures investigated. As a general rule, the Holmes effect can be disregarded, if this ratio is much smaller than 1. For example, no problem arises when measuring the volume fraction of whole mitochondria in liver or muscle cells or their external surface-to-volume ratio on ordinary ultrathin sections of silver interference color
~ ( 5 0 0 A). However, for determining the surface- to-volume ratio of inner mitochondrial membranes and matrix, the section thickness has to be reduced as far as possible. If two populations of mitochon- dria have to be compared, the residual Holmes effect can be disregarded if it can be expected to affect both populations to the same degree. Such very thin sections will show little contrast; this can be improved by heavily "over-stalning" the sections, for example, with a combined uranyl acetate and lead stain (17). In this work, the aesthetic quality of the electron micrographs is not of primary importance.
The Holmes effect shall not be further treated here. I t has received thorough consideration else- where for various general cases (29, 23-26, 2, 44).
Statistical Errors
In practical application, the stereological meth- ods proposed here will yield estimates of " t rue dimensions" within certain confidence intervals which essentially depend on the size of the sample and can be tested by means of usual statistical techniques (43). The quality of the result can be improved by increasing the sample size, but it must be borne in mind that this improvement runs proportional to the square root of the sample size (25, 44).
The distribution of the sample over the tissue is an important factor in reducing the error. Firstly, it has been shown that an even distribution of sample sections in the organ can be achieved by stratified random sampling (44, 13). Hennig (26) has further shown that the use of a systematic lattice of points in the test system, as proposed above, is able to reduce the probable error as compared to a purely random test system. The "randomness" required by the theory of stereology is still preserved if there is no coincidence between test system lattice and any lattice underlying tissue organization. If some structures show preferential orientation, it may be necessary to rotate the test system by, e .g , 90 ° or two times 60 ° and take two or three readings (39).
An increase of the sample size can be obtained by three principal steps: (a) an increase in the num- ber of sections investigated, (b) an increase in the number of micrographs prepared per section, or (c) by increasing the point density of the test sys- tem. Since we are dealing with multiple-stage sampling (9), the first step will bring the most intense improvement, and the least effect has to
E. R. WEIBEL, G. S. KISTLER, ANn W. F. SCI-IERLE Morphometrlc Meihod~ 35

T A B L E II
Production of Four-Stage Sample in Experimental Series (3o)
Sample stage
Characteristics
Personnel required
Specimens
Investigator -I- Technician
Random sections
Technician
Random electron micrographs
Techn. Assist. or Investigator
Standard sample per Electron micrograph Section Specimen Experimental group
Time* required per Electron micrograph, rain Section, rain Specimen, hr Experiment, hr
Relative production costs per unitt]
(8)$
0.2~
5 25
45 4
20
0.5
6 30
150
8 45
4 20
0.3
Test points ana- lyzed
Investigator
168 1,008 5,040
25,000
4 24
2 20§
<0.001
* Includes all ancillary work, Preparation time only.
§ Includes statistical analysis. [[ Wages, material, instrument time, etc.
be expected from simply increasing the test point density. This is immediately seen, if the variance V (~) of the mean obtained by three-stage sampling is considered (9). Taking $12 to be the variance of the first sampling stage, i.e. the variance between sections, and nl the corresponding sample size (number of sections); taking furthermore $2 2 and n~ to be variance and number of sample fields (electron micrographs) per section, $3 2 and n3 variance and number of test points per field, we obtain
V(~) =--$12-} - S2z + - - S " 2 (17) nl nl. n2 nl. rb2. n3
I t is easily seen that an increase in nl will reduce all three components while a simple increase in n3 will only influence the last member, namely $2.
On the other hand, increasing the number of sections will entail the highest increase in the costs of the project. Some estimates of time requirement and effective costs as they pertained to our studies are presented in Table II . Each investigator will have to judge, on the basis of his facilities, which
step ought to be increased to provide an optimal result with tolerable cost increase.
In experimental work, a "zero-order" sample has, of course, also to be taken into consideration: the number of test animals used. In general, this number depends on the experimental conditions and does not directly influence the morphometric work. I t may often prove advantageous, though, to head directly for group averages without consider- ing the individual animal values. The variance of this group mean is then calculated on the basis of a four-stage sampling procedure according to equation 17 with no and So 2 as the number and variance of the animals used, and so forth. The test-points then become the fourth-order sample, and a corresponding fourth term must be added to equation 17. I t is then again evident that an increase in the number of experimental animals will best improve the results.
C O N C L U S I O N S
Stercological methods provide the means of efficiently producing quantitative data on the
36 THE Jotrm~AL OF CELL BIOLO~r • VOLUME 30, 1966
internal structure of organs, tissues, and cells.
These methods can easily be applied to cytological
work at the electron microscope level of resolution.
Although particular caution is indicated in avoid-
ing systematic errors which may result from inade-
quate preparation, section thickness, and so on,
the results are generally very reliable. They can
be subjected to statistical analysis in order to test
for statistical errors. While the derivation of these
principles--which was purposely omitted in this
presentation--often involves the use of advanced
mathematical tools, their practical application
requires no special mathematical knowledge. On
R E F E R E N C E S
1. ATTARDI, G., Ueber neue, rasch auszuffihrende Verfahren fi~r Zellmessungen, Acta Anat., 1953, 18, 177.
2. BACH, G., Ueber die GrSssenverteilung von Kugelschnitten in durchsichtigen Schnitten endlicher Dicke, Z. wisser~ch. Mikr., 1959, 64, 265.
3. BACH, G., Ueber die Bestimmung von charak- teristischen Gr6ssen einer Kugelverteilung aus der Verteilung der Schnittkreise, Z. wissensch. Mikr., 1963, 6S, 285.
4. BACH, G., Zufallsschnitte dutch ein Haufwerk yon Rotationsellipsoiden mit konstantem Achsenverh/iltnis, Z. angew. Math. u. Physik, 1965, 16, 224.
5. BAHR, G. F., and ZEITLER, E., The determina- tion of magnification in the electron micro- scope. II. Means for the determination of magnification, Lab. Inv., 1965, 14, 880.
6. CHALKLEY, H. W., Methods for the quantitative morphologic analysis of tissues, J. Nat. Cancer Inst., 1943, 4, 47.
7. CnALKLEY, H. W., CORNFIELD, J., and PARK, H,, A method for estimating volume-surface ra- tios, Science, 1949, 110, 295.
8. C~AYES, F., Petrographic Modal A~alysis, New York, Wiley and Sons, 1956.
9. COCHRAN, W. C., Sampling Techniques, New York, Wiley and Sons, 1953.
10. CORNFIELD, J. , and C~ALKLEV, H. W., A prob- lem in geometric probability, J. HZashington Acad. Sc., 1951, 41, 226.
11. DE HOFF, R. T,, and RmNEs, F. N., Determina- tion of the number of particles per unit volume from measurements made on random plane sections: the general cylinder and the ellipsoid, Tr. AIME, 1961, 22I, 975.
12. DELESSE, M. A., Procfidfi m~eanique pour dfiter-
the basis of simple counting measurements a large variety of dimensions can be inferred.
A combination of these methods with histochemi- cal and radioautographic techniques may allow quantitative evaluation of tissue composition (33).
This work was supported in part by the Schwei- zerisches Nationalfonds zur F6rderung der wissen- schaftlichen Forschung; the National Institutes of Health, United States Public Health Service, through grant RF-57; and by the 6570th Aerospace Medical Research Laboratories under contract AF 61 (052)- 784 through the European Office of the Aerospace Research (OAR), United States Air Force.
Received for publication 2 December 1965.
miner la composition des roches, Compt. rend. Acad. sc. 1847, 25, 544.
13. DUNNILL, M. S., Evaluation of a simple method of sampling the lung for quantitative histo- logical analysis, Thorax, 1964, 19, 443.
14. ELIAS, H., and COHEN, T., Geometrical analysis of inclusions in rat liver cells as seen in electron- micrograms, Z. Zellforschung., 1954, 41,407,
15. ELIAS, H., HE~NIO, A., and ELIAS, P. M., Some methods for the study of kidney structure, Z. wissensch. Mikr., 1961, 65, 70.
16. ELIAS, H,, SOKOL, A., and LAZAROWlTZ, A., Contribution to the geometry of sectioning. II. Circular Cylinders, Z. wissensch. Mikr., 1954, 62, 20.
17. FRASCA, J. M., and PARKS, V. R., A routine technique for double-staining ultrathin sec- tions using uranyl and lead salts, J. Cell Biol., 1965, 25, 157.
18. FUCHS, A., and WEIBEL, E. R., Morphometrische Untersuchung der Verteilung einer spezifischen cytoplasmatischen Organelle yon Endothel- zellen in der Ratte, Z. Zellforschung., 1966, 73, 1-9.
19. GLAGOLEFF, A. A., On the geometrical methods of quantitative mineralogic analysis of rocks, Tr. Inst. Econ. Min. and Metal. Moskau, 1933, 59.
20. HAUG, H., Die Treffermethode, ein Verfahren zur quantitativen Analyse im histologischen Schnitt, Z. Anat. Entwcklngs. Geseh., 1955, 118, 302.
21. HAUO, H., Quantitative Untersuchungen an der Sehrinde, Stuttgart, Thieme, 1958.
22. HENNIO, A., Bestimmung der Oberfl/iche be- liebig geformter K6rper mit besonderer An- wendung auf K6rperhaufen im mikroskopi- schen Bereich, Mikroskopie, 1956, 11, 1.
23. t-I~NmG, A., Disknssion der Fehler bei der Volu- menbestimmung mikroskopisch kleiner K6rper
E. R. WEIBEL, G. S. KISTLER, AND W. F. SC~EaL~ Morphometrlc Methods 37

oder Hohlr~iume aus den Schnittprojektionen, Z. wissensch. Mikr., 1957, 63, 67.
24. HEnNIG, A., Fehler der Oberfl~ichenbestimmung von Kernen bei endlicher Schnittdicke, Mi- kroskopie, 1957, 12, 7.
25. HENNIG, A., A critical survey of volume and surface measurements in microscopy, Zeiss Werkzeitschrift, No. 30, 1959.
26. HENmC, A., Das Ausmessen r/iumlicher Struk- turen mittels zufiilliger Sonden (Punkten, Linien, Ebenen), in Proceedings of Sympo- sium on Quantitative Methods in Morphol- ogy, (E. R. Weibel and H. Elias, editors), Berlin-Heidelberg-New York, Springer, in press.
27. HENNIG, A., and MEYER-ARENDT, J. R., Micro- scopic volume determination and probability, Lab. Inv., 1963, 12, 460.
28. HILLIARD, J. E., and CAHN, J. W., Evaluation of the procedures in quantitative metallography for volume fraction analysis, Tr. AIME, 1962, 221,344.
29. HOLMES, A. H., Petrographic methods and calcu- lations, London, Murby & Co., 1927.
30. KISTLER, G. S., CALDWELL, P. R. B., and WEIBEL, E. R., A quantitative electron microscope study of lung damages due to breathing of pure oxygen at atmospheric pressure, Pro- ceedings 3rd International Conference on Hyperbaric Medicine, 1965, in press.
31. KmCHT, B. W., WEIB~L, E. R., and G o , z, D. M., Effect of size distribution on a principle of counting on sections structures contained in a volume, Proceedings 1st International Con- gress on Stereology, Vienna, Vienna Medical Academy, 1963, 18.
32. LAZAROW, A. and CARPENTER, A. M., Compo- nent quantitation of tissue sections. I, Histo- chem. and Cytochem., 1962, 10,324 and 329.
33. LEIBmTZ, L., Das Punktz~ihlverfahren als quanti- tative Methode in der Histochemie, Histo- ¢hemie, 1964, 4, 123.
34. LouD, A. V., A method for the quantitative estimation of cytoplasmic structures, J. Cell Biol., 1962, 15, 481.
35. LOUD, A. V., BARAnV, W. C., and PACK, B. A., Quantitative evaluation of cytoplasmic struc- tures in electron micrographs, Lab. Inv., 1965. 14, 996.
36. REISnER, J. H., The determination of magnifica-
tion in the electron microscope. I. Instru- mental factors influencing the estimate of magnification, Lab. Inv., 1965, 14, 875.
37. ROSIWAL, A., Ueber geometrische Gesteinsanaly- sen. Ein einfacher Weg zur zifferm~issigen Feststellung des Quantit/itsverh~iltnisses der Mineralbestandteile gemengter Gesteine, Ver- handl. K.K. Geol. Reichsanstalt, Wien, 1898, 143.
38. SCHUCHARDT, E., Die Gewebsanalyse mit dem Integrationsokular, Z. wissensch. Mikr., 1954, 62, 9.
39. SITTE, H., Morphometrische Untersuchungen an Zellen, in Proceedings of the Symposium on Quantitative Methods in Morphology, (E. R. Weibel and H. Elias, editors), Berlin-Heidel- berg-New York, Springer, in press.
40. SITTE, H., and STEINHAUSEN, M., Stereologische Auswertung elektronenoptischer Aufnahmen der S~iugerniere, Proceedings 1st International Congress on Stereology, Vienna, 1963, 24.
41. TOMrd~mFF, S. I., Linear intercepts, areas and volumes, Nature, 1945, 155, 24.
42. UNDERWOOD, E. E., Quantitative Stereology, Cambridge, Massachusetts, Addison-Wesley Co., in press.
43. VAN DER WAERDEN, B. L., Mathematische Sta- tistik, Berlin-Heidelberg-New York, Springer, 1965, 2nd edition.
44. WEmEL, E. R., Morphometry of the human lung, Heidelberg, Springer-Verlag, New York, Academic Press Inc., 1963.
45. WEmgL, E. R., Principles and methods for the morphometric study of the lung and other organs, Lab. Inv., 1963, 12, 131.
46. WEm~L, E. R., Postnatal growth of the lung with respect to gas exchange capacity, in Ciba Foundation Symposium on the develop- ment of the lung, London, Churchill, in press.
47. WErBgL, E. R., and ELIAS, H. (editors), Pro- ceedings of Symposium on Quantitative Methods in Morphology, Berlin-Heidelberg- New York, Springer-Verlag, in press.
48. WEIB~L, E. R., and GOMEZ, D. M., A principle for counting tissue structures on random sec- tions, J. Appl. Physiol., 1962, 17,343.
49. WEmEL, E. R., and KNIGHT, B. W., A rnorpho- metric study on the thickness of the pulmonary air-blood barrier, J. Cell Biol., 1964, 21, 367.
50. WEU3EL, E. R., and PALADE, G. E., New cyto- plasmic components in arterial endothelia, J. Cell Biol., 1964, 23, 101.
38 THE JO~rRbZAL OF CELL BIOLOGY • VOLU~J~ $0, 1966