practical guide for scenario analysis in line with … guide for scenario...practical guide for...
TRANSCRIPT
Practical guide for Scenario Analysis in line with TCFD recommendations
March 2019
Ministry of the Environment, Government of JapanClimate Change Policy Division
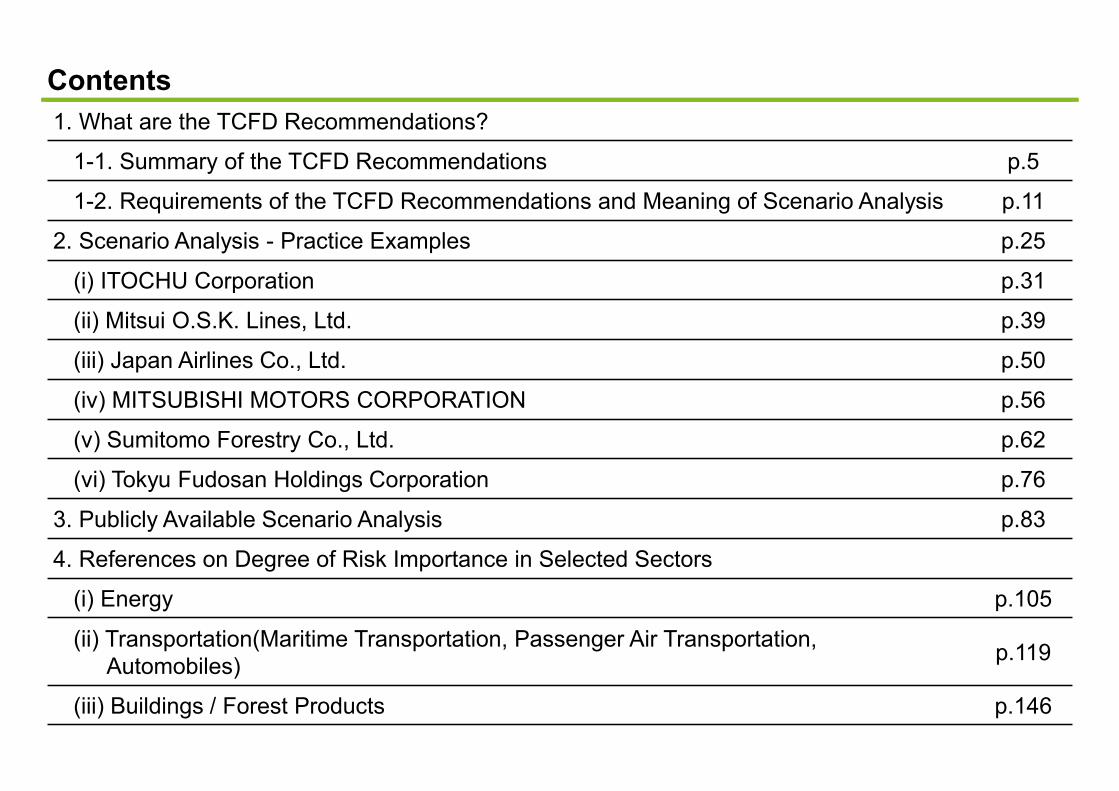
Contents1. What are the TCFD Recommendations?
1-1. Summary of the TCFD Recommendations p.5
1-2. Requirements of the TCFD Recommendations and Meaning of Scenario Analysis p.11
2. Scenario Analysis - Practice Examples p.25
(i) ITOCHU Corporation p.31
(ii) Mitsui O.S.K. Lines, Ltd. p.39
(iii) Japan Airlines Co., Ltd. p.50
(iv) MITSUBISHI MOTORS CORPORATION p.56
(v) Sumitomo Forestry Co., Ltd. p.62
(vi) Tokyu Fudosan Holdings Corporation p.76
3. Publicly Available Scenario Analysis p.83
4. References on Degree of Risk Importance in Selected Sectors
(i) Energy p.105
(ii) Transportation(Maritime Transportation, Passenger Air Transportation,Automobiles) p.119
(iii) Buildings / Forest Products p.146

[Objective of the Practical Guide]Introduce “practical” examples, to which companies can refer when performing scenario analysis aligned the TCFD Recommendations
While Japan’s companies are prepared to meet the requirements of the TCFD recommendations, the process of scenario analysis itself is not well known among
them, and almost no case studies are available.Issue
(Reference: Scenario analysis in the TCFD recommendations)The TCFD recommendations is a set of requirements that the financial industry has sent out based upon theParis Agreement, calling on business management to make climate change efforts.The TCFD recommendations call for climate-related financial reporting and business management focusingon four core elements – i.e. governance, strategy, risk management, and metrics and targets.For strategy, in particular, companies are recommended to perform scenario analysis for financial impactsunder multiple climate-change scenarios.Scenario analysis helps companies develop robust strategies under a wider range of uncertain futureconditions.
Objectiveof
the Guide
The Guide has compiled practice examples of the TCFD recommendations subject to the support programs of the Ministry of Environment to help companies to some extent
perform scenario analysis on their own.
3
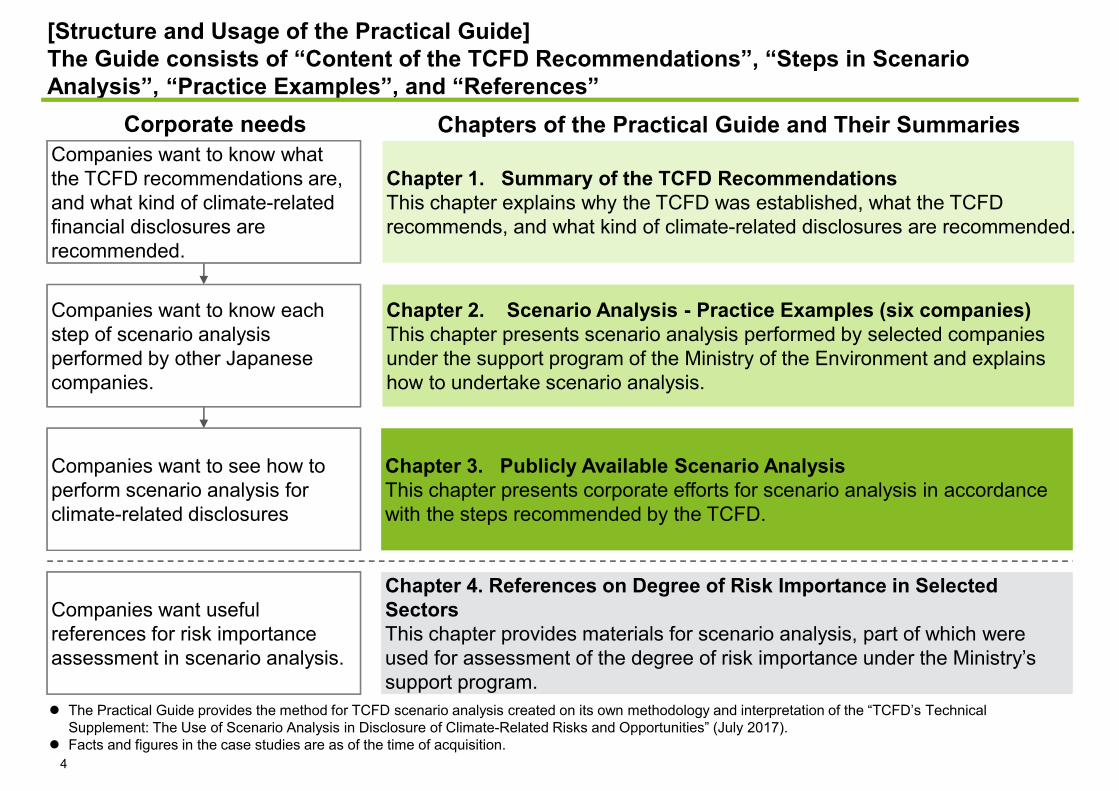
[Structure and Usage of the Practical Guide]The Guide consists of “Content of the TCFD Recommendations”, “Steps in Scenario Analysis”, “Practice Examples”, and “References”
Companies want to know what the TCFD recommendations are, and what kind of climate-related financial disclosures are recommended.
Companies want to know each step of scenario analysis performed by other Japanese companies.
Companies want useful references for risk importance assessment in scenario analysis.
Chapter 1. Summary of the TCFD RecommendationsThis chapter explains why the TCFD was established, what the TCFD recommends, and what kind of climate-related disclosures are recommended.
Chapter 2. Scenario Analysis - Practice Examples (six companies)This chapter presents scenario analysis performed by selected companies under the support program of the Ministry of the Environment and explains how to undertake scenario analysis.
Chapter 4. References on Degree of Risk Importance in Selected SectorsThis chapter provides materials for scenario analysis, part of which were used for assessment of the degree of risk importance under the Ministry’s support program.
Corporate needs Chapters of the Practical Guide and Their Summaries
4
Companies want to see how to perform scenario analysis for climate-related disclosures
Chapter 3. Publicly Available Scenario AnalysisThis chapter presents corporate efforts for scenario analysis in accordance with the steps recommended by the TCFD.
The Practical Guide provides the method for TCFD scenario analysis created on its own methodology and interpretation of the “TCFD’s Technical Supplement: The Use of Scenario Analysis in Disclosure of Climate-Related Risks and Opportunities” (July 2017).Facts and figures in the case studies are as of the time of acquisition.

1. What are the TCFD recommendations?1-1. Summary of the TCFD recommendations1-2. Requirements of the TCFD recommendations
and meaning of scenario analysis
Chapter 1. Summary of the TCFD RecommendationsThis chapter explains why the TCFD was established and what the TCFD recommends, and what kind of climate-related disclosures are recommended.
5

There are three broad channels through which climate change can affect financial stability:
Physical risks: The direct impacts on property from climate-related events, such as floods and storms and indirect impacts on blocked global supply chain or depletion of resources;Liability risks: The impacts that could arise if parties who have suffered loss or damage from the effects of climate change seek compensation from those they hold responsible;Transition risks: The risks which could result from reassessment of the value of a large range of assets with a large volume of greenhouse gas emissions during the process of adjustment towards a lower-carbon economy .
Speech by Mark Carney, Chair of the Financial Stability Board (FSB), Governor of the Bank of England (September 2015)
“The financial risks that could result from the process of adjustment towards a lower-carbon economy could prompt a reassessment of the value of a large range of assets with a large volume of greenhouse gas emissions and destabilize the financial system.” Speech made by Mark Carney, Chair of the Financial Stability Board (FSB), Governor of the Bank of England Dr. Carney also refers to the possibility that a sudden reassessment could destabilize markets like the subprime loan crises.
[Background of the TCFD ]Climate change risks could destabilize the financial system and become a possible threat to financial institutions
Source: Financial Times Online, September 30, 20156
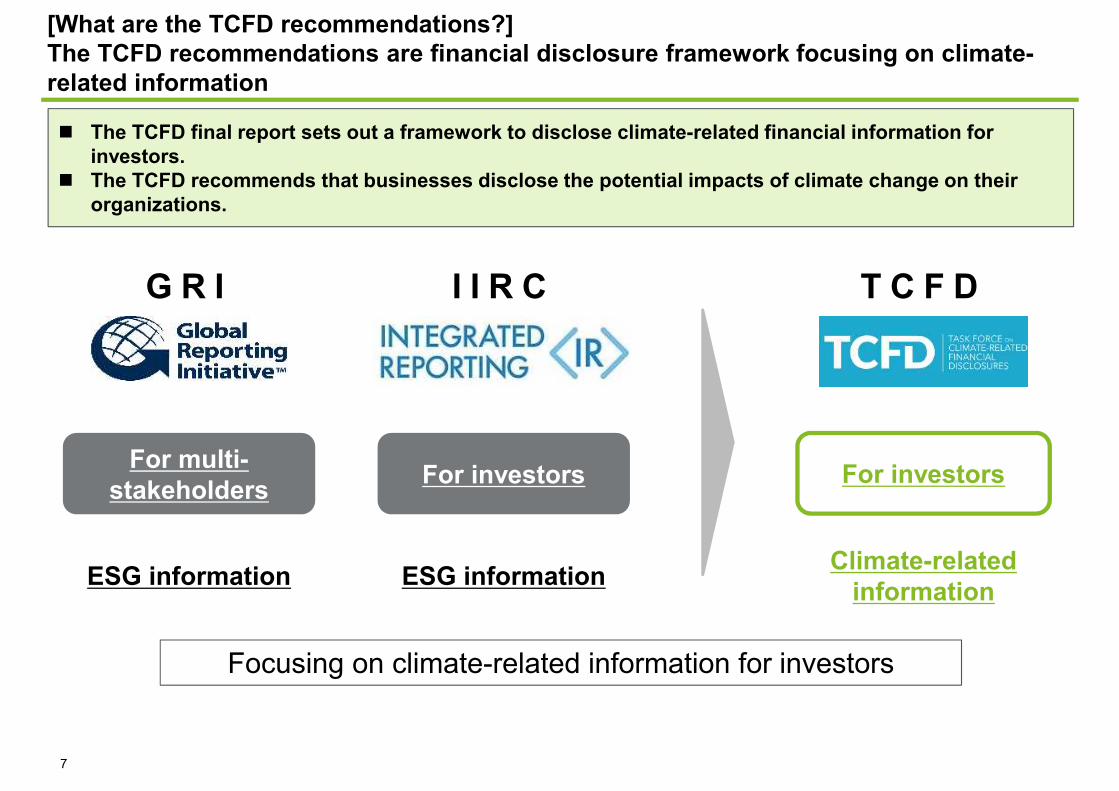
[What are the TCFD recommendations?]The TCFD recommendations are financial disclosure framework focusing on climate-related information
G R I
For multi-stakeholders
ESG information
I I R C
For investors
ESG information
T C F D
Climate-related information
For investors
Focusing on climate-related information for investors
The TCFD final report sets out a framework to disclose climate-related financial information for investors.The TCFD recommends that businesses disclose the potential impacts of climate change on their organizations.
7
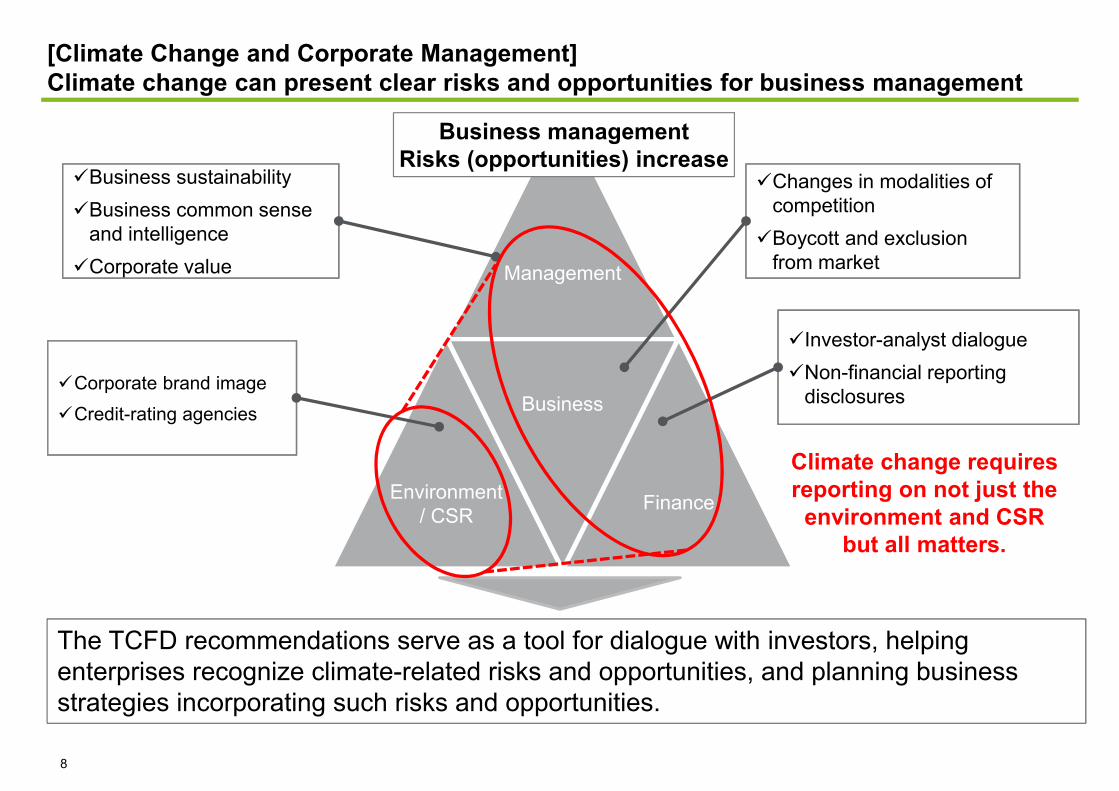
[Climate Change and Corporate Management]Climate change can present clear risks and opportunities for business management
Management
Environment/ CSR
Business
Finance
Business managementRisks (opportunities) increase
Corporate brand imageCredit-rating agencies
Investor-analyst dialogueNon-financial reporting disclosures
Business sustainabilityBusiness common sense and intelligenceCorporate value
Changes in modalities of competitionBoycott and exclusion from market
Climate change requires reporting on not just the
environment and CSR but all matters.
8
The TCFD recommendations serve as a tool for dialogue with investors, helping enterprises recognize climate-related risks and opportunities, and planning business strategies incorporating such risks and opportunities.
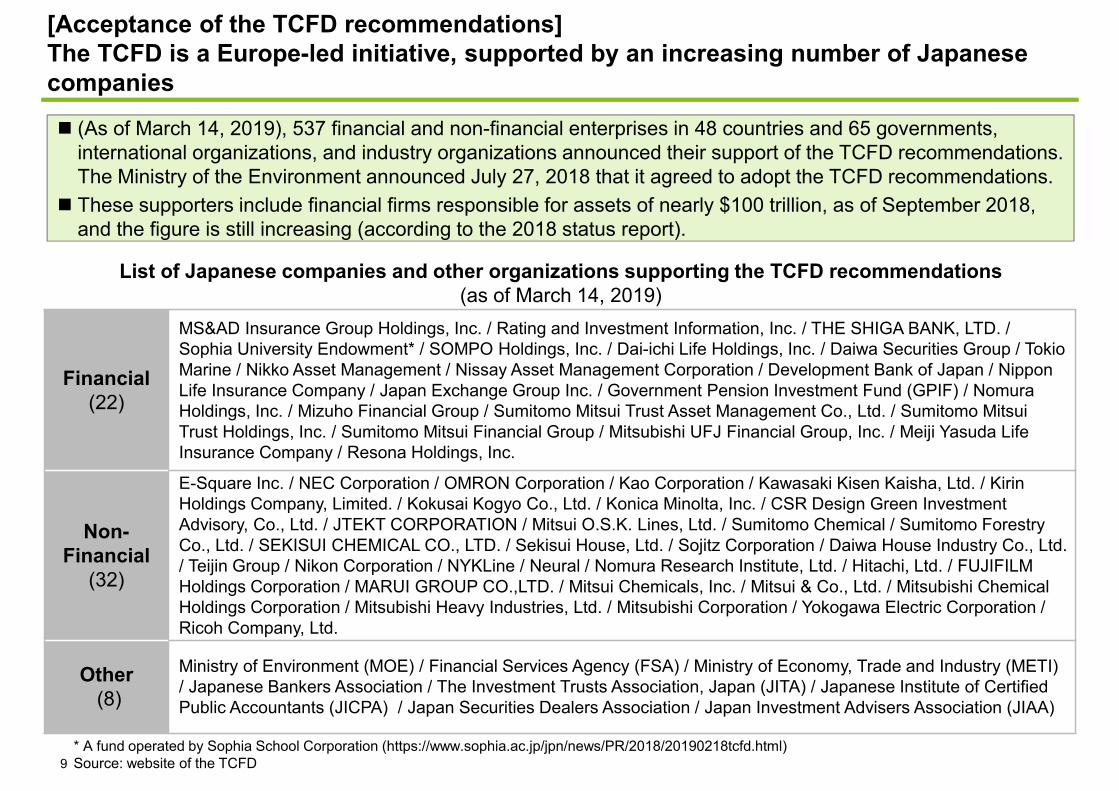
[Acceptance of the TCFD recommendations]The TCFD is a Europe-led initiative, supported by an increasing number of Japanese companies
(As of March 14, 2019), 537 financial and non-financial enterprises in 48 countries and 65 governments, international organizations, and industry organizations announced their support of the TCFD recommendations. The Ministry of the Environment announced July 27, 2018 that it agreed to adopt the TCFD recommendations.These supporters include financial firms responsible for assets of nearly $100 trillion, as of September 2018, and the figure is still increasing (according to the 2018 status report).
List of Japanese companies and other organizations supporting the TCFD recommendations (as of March 14, 2019)
9* A fund operated by Sophia School Corporation (https://www.sophia.ac.jp/jpn/news/PR/2018/20190218tcfd.html)Source: website of the TCFD
Financial(22)
MS&AD Insurance Group Holdings, Inc. / Rating and Investment Information, Inc. / THE SHIGA BANK, LTD. / Sophia University Endowment* / SOMPO Holdings, Inc. / Dai-ichi Life Holdings, Inc. / Daiwa Securities Group / Tokio Marine / Nikko Asset Management / Nissay Asset Management Corporation / Development Bank of Japan / Nippon Life Insurance Company / Japan Exchange Group Inc. / Government Pension Investment Fund (GPIF) / Nomura Holdings, Inc. / Mizuho Financial Group / Sumitomo Mitsui Trust Asset Management Co., Ltd. / Sumitomo Mitsui Trust Holdings, Inc. / Sumitomo Mitsui Financial Group / Mitsubishi UFJ Financial Group, Inc. / Meiji Yasuda Life Insurance Company / Resona Holdings, Inc.
Non-Financial
(32)
E-Square Inc. / NEC Corporation / OMRON Corporation / Kao Corporation / Kawasaki Kisen Kaisha, Ltd. / Kirin Holdings Company, Limited. / Kokusai Kogyo Co., Ltd. / Konica Minolta, Inc. / CSR Design Green Investment Advisory, Co., Ltd. / JTEKT CORPORATION / Mitsui O.S.K. Lines, Ltd. / Sumitomo Chemical / Sumitomo Forestry Co., Ltd. / SEKISUI CHEMICAL CO., LTD. / Sekisui House, Ltd. / Sojitz Corporation / Daiwa House Industry Co., Ltd. / Teijin Group / Nikon Corporation / NYKLine / Neural / Nomura Research Institute, Ltd. / Hitachi, Ltd. / FUJIFILM Holdings Corporation / MARUI GROUP CO.,LTD. / Mitsui Chemicals, Inc. / Mitsui & Co., Ltd. / Mitsubishi Chemical Holdings Corporation / Mitsubishi Heavy Industries, Ltd. / Mitsubishi Corporation / Yokogawa Electric Corporation / Ricoh Company, Ltd.
Other(8)
Ministry of Environment (MOE) / Financial Services Agency (FSA) / Ministry of Economy, Trade and Industry (METI) / Japanese Bankers Association / The Investment Trusts Association, Japan (JITA) / Japanese Institute of Certified Public Accountants (JICPA) / Japan Securities Dealers Association / Japan Investment Advisers Association (JIAA)
10
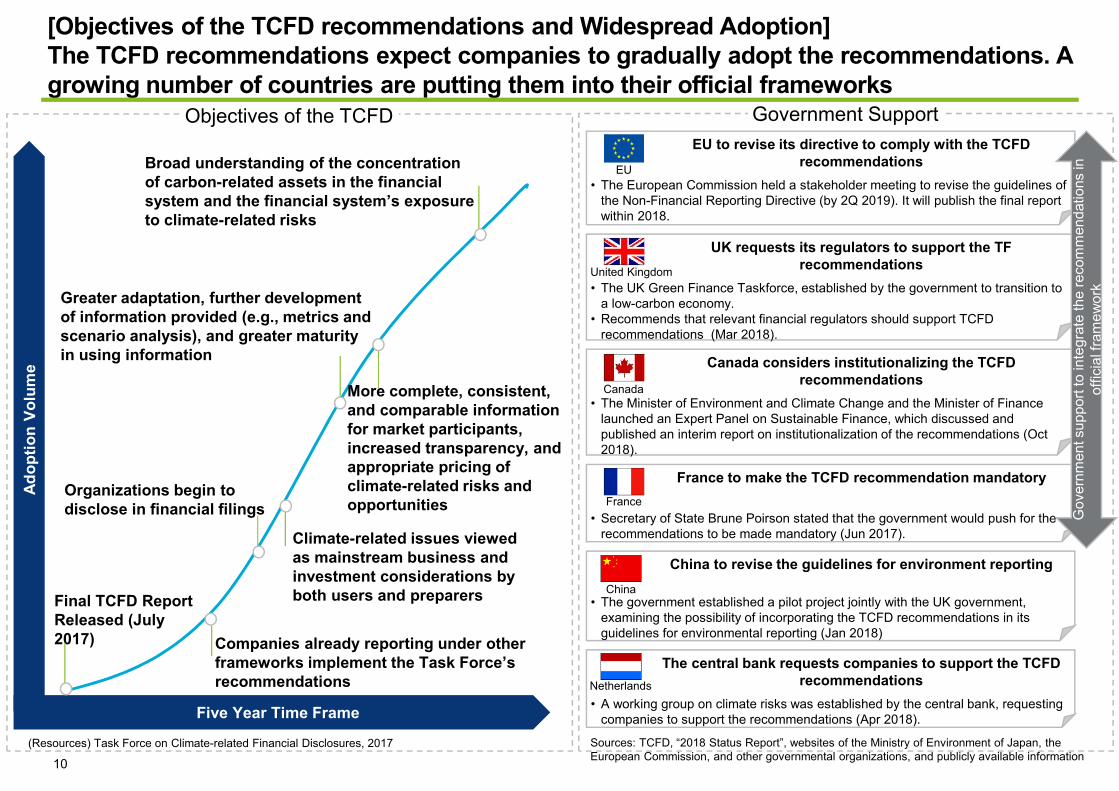
[Objectives of the TCFD recommendations and Widespread Adoption]The TCFD recommendations expect companies to gradually adopt the recommendations. A growing number of countries are putting them into their official frameworks
Broad understanding of the concentration of carbon-related assets in the financial system and the financial system’s exposure to climate-related risks
Final TCFD Report Released (July 2017) Companies already reporting under other
frameworks implement the Task Force’s recommendations
Climate-related issues viewed as mainstream business and investment considerations by both users and preparers
More complete, consistent, and comparable information for market participants, increased transparency, and appropriate pricing of climate-related risks and opportunities
Five Year Time Frame
Adop
tion
Volu
me
Organizations begin to disclose in financial filings
Greater adaptation, further development of information provided (e.g., metrics and scenario analysis), and greater maturity in using information
(Resources) Task Force on Climate-related Financial Disclosures, 2017 Sources: TCFD, “2018 Status Report”, websites of the Ministry of Environment of Japan, the European Commission, and other governmental organizations, and publicly available information
Objectives of the TCFD Government Support
The central bank requests companies to support the TCFD recommendations
• A working group on climate risks was established by the central bank, requesting companies to support the recommendations (Apr 2018).
Netherlands
UK requests its regulators to support the TF recommendations
• The UK Green Finance Taskforce, established by the government to transition to a low-carbon economy.
• Recommends that relevant financial regulators should support TCFD recommendations (Mar 2018).
United Kingdom
EU to revise its directive to comply with the TCFD recommendations
• The European Commission held a stakeholder meeting to revise the guidelines of the Non-Financial Reporting Directive (by 2Q 2019). It will publish the final report within 2018.
EU
Canada considers institutionalizing the TCFD recommendations
• The Minister of Environment and Climate Change and the Minister of Finance launched an Expert Panel on Sustainable Finance, which discussed and published an interim report on institutionalization of the recommendations (Oct 2018).
Canada
China to revise the guidelines for environment reporting
• The government established a pilot project jointly with the UK government, examining the possibility of incorporating the TCFD recommendations in its guidelines for environmental reporting (Jan 2018)
China
France to make the TCFD recommendation mandatory
• Secretary of State Brune Poirson stated that the government would push for the recommendations to be made mandatory (Jun 2017).
France
Gov
ernm
ent s
uppo
rt to
inte
grat
e th
e re
com
men
datio
ns in
of
ficia
l fra
mew
ork
Chapter 1. Summary of the TCFD RecommendationsThe chapter explains why the TCFD was established and what the TCFD recommends, and what kind of climate-related disclosures are recommended.
11
1. What are the TCFD recommendations?1-1. Summary of the TCFD recommendations1-2. Requirements of the TCFD recommendations
and meaning of scenario analysis
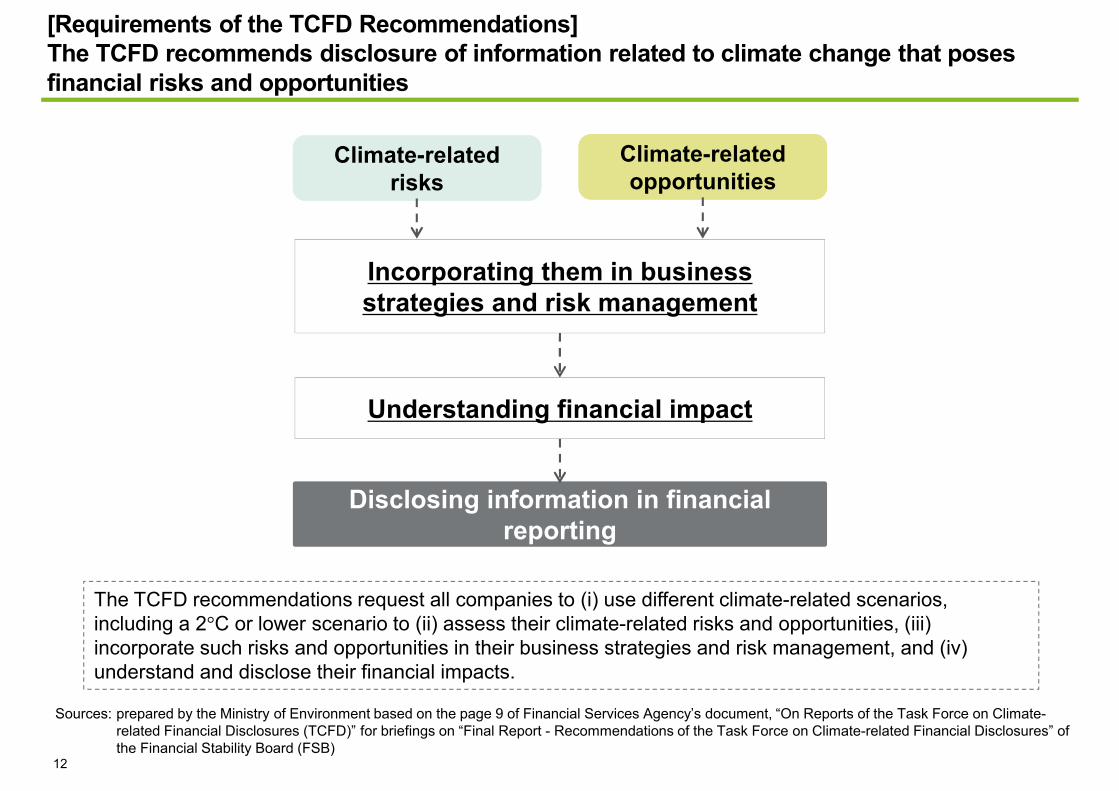
[Requirements of the TCFD Recommendations]The TCFD recommends disclosure of information related to climate change that poses financial risks and opportunities
Climate-related risks
Climate-related opportunities
Understanding financial impact
Incorporating them in business strategies and risk management
Disclosing information in financial reporting
The TCFD recommendations request all companies to (i) use different climate-related scenarios, including a 2 C or lower scenario to (ii) assess their climate-related risks and opportunities, (iii) incorporate such risks and opportunities in their business strategies and risk management, and (iv) understand and disclose their financial impacts.
Sources: prepared by the Ministry of Environment based on the page 9 of Financial Services Agency’s document, “On Reports of the Task Force on Climate-related Financial Disclosures (TCFD)” for briefings on “Final Report - Recommendations of the Task Force on Climate-related Financial Disclosures” of the Financial Stability Board (FSB)
12
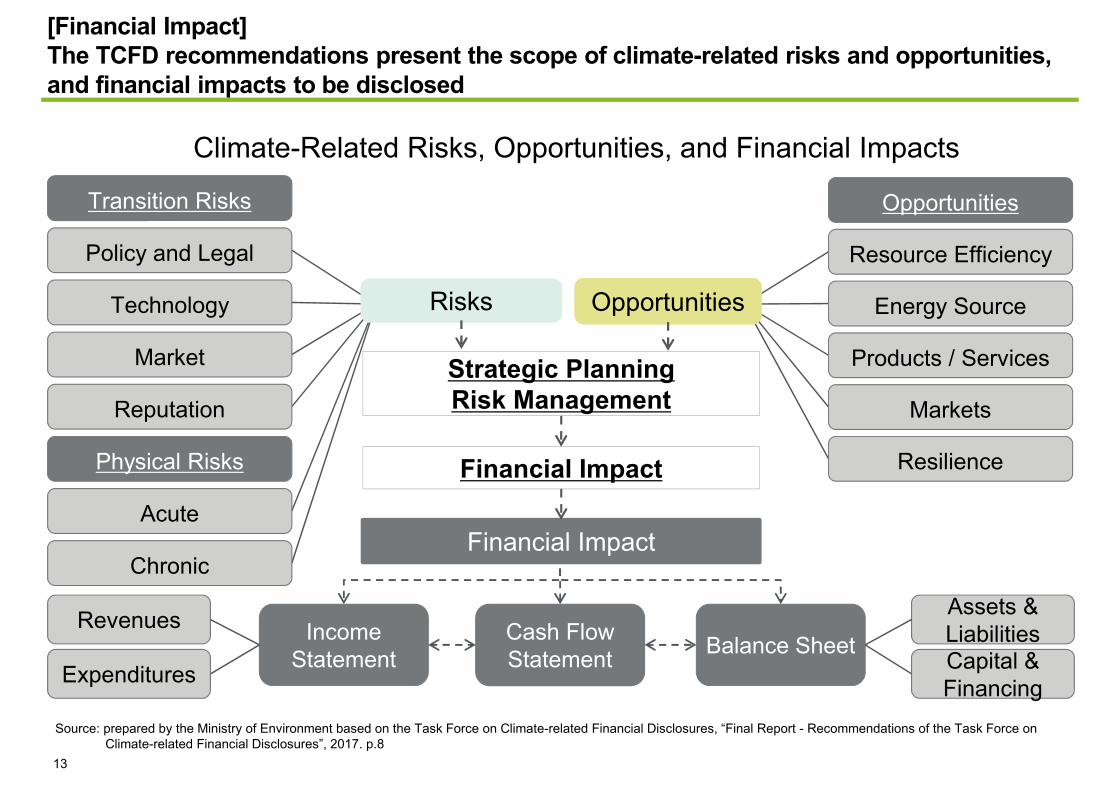
[Financial Impact]The TCFD recommendations present the scope of climate-related risks and opportunities, and financial impacts to be disclosed
Revenues Income Statement Balance Sheet
Assets & LiabilitiesCapital & Financing
Cash Flow Statement
Transition Risks
Physical Risks
Policy and Legal
Technology
Market
Reputation
Acute
Chronic
Opportunities
Resource Efficiency
Energy Source
Products / Services
Markets
Resilience
Expenditures
Climate-Related Risks, Opportunities, and Financial Impacts
Source: prepared by the Ministry of Environment based on the Task Force on Climate-related Financial Disclosures, “Final Report - Recommendations of the Task Force on Climate-related Financial Disclosures”, 2017. p.8
Risks Opportunities
Financial Impact
Strategic PlanningRisk Management
Financial Impact
13
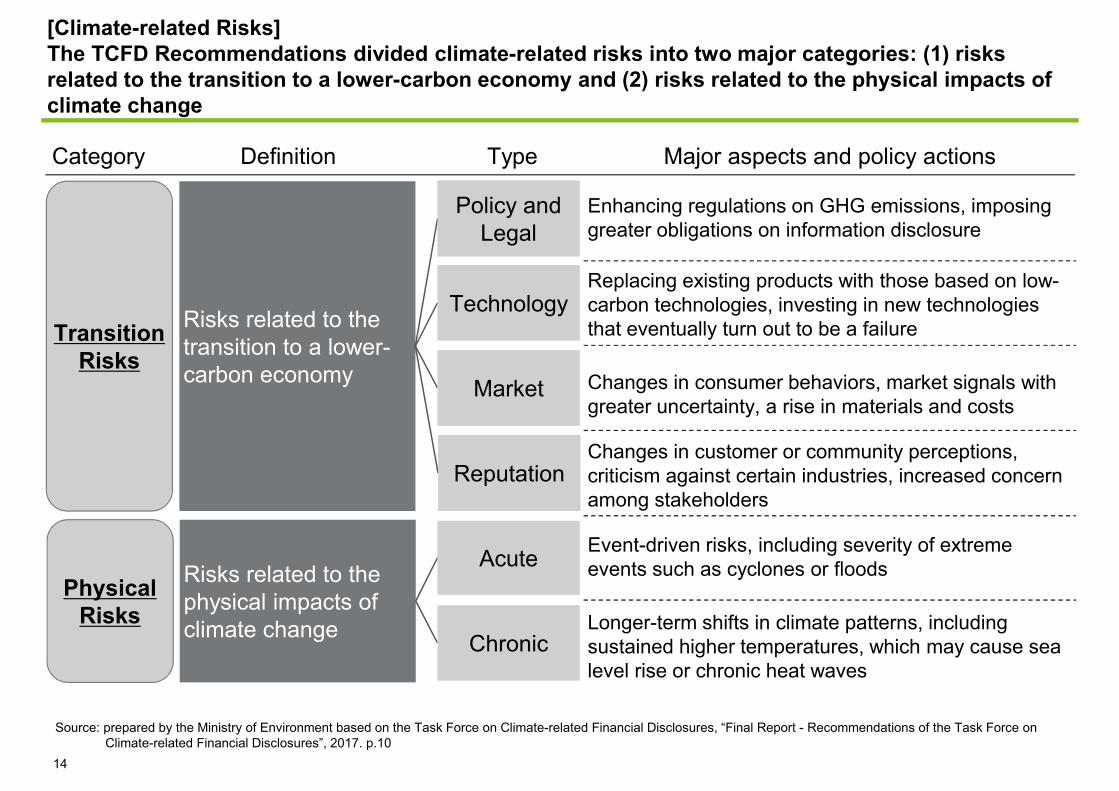
Category
Risks related to the transition to a lower-carbon economy
Risks related to the physical impacts of climate change
Transition Risks
Physical Risks
Enhancing regulations on GHG emissions, imposing greater obligations on information disclosure
Replacing existing products with those based on low-carbon technologies, investing in new technologies that eventually turn out to be a failure
Changes in consumer behaviors, market signals with greater uncertainty, a rise in materials and costs
Changes in customer or community perceptions, criticism against certain industries, increased concern among stakeholders
Event-driven risks, including severity of extreme events such as cyclones or floods
Longer-term shifts in climate patterns, including sustained higher temperatures, which may cause sea level rise or chronic heat waves
Definition Major aspects and policy actionsType
Policy and Legal
Technology
Market
Reputation
Acute
Chronic
14
[Climate-related Risks]The TCFD Recommendations divided climate-related risks into two major categories: (1) risks related to the transition to a lower-carbon economy and (2) risks related to the physical impacts of climate change
Source: prepared by the Ministry of Environment based on the Task Force on Climate-related Financial Disclosures, “Final Report - Recommendations of the Task Force on Climate-related Financial Disclosures”, 2017. p.10

[Climate-related Opportunities]The TCFD recommendations identified the following five areas of climate-related opportunities that organizations can produce in the course of their efforts to mitigate and adapt to climate change
Area Policy actions Financial impact
OpportunitiesOpportunities
Use of more efficient models of transportUse of more efficient production and distribution processesUse of RecyclingMove to more efficient buildingsReduced water usage and consumption
Resource Efficiency
Energy Source
Products and
Services
Markets
Resilience
Use of lower-emission sources of energyUse of supportive policy incentivesUse of new technologiesParticipation in carbon marketShift toward decentralized energy generation
Development and/or expansion of low emission goods and servicesDevelopment of climate adaptation and insurance risk solutionsDevelopment of new products or services through R&D and innovationAbility to diversify business activities
Access to new marketsUse of public-sector incentivesAccess to new assets and locations needing insurance coverage
Participation in renewable energy programs and adaptation of energy-efficiency measuresResource substitutes/diversification
Reduced operating costs (e.g., through efficiency gains and cost reductions)Increased production capacity, resulting in increased revenuesIncreased value of fixed assets (e.g., highly rated energy-efficient buildings)Benefits to workforce management and planning (e.g., improved health and safety, employee satisfaction) resulting in lower costs
Reduced operational costs (e.g., through use of lowest cost abatement)Reduced exposure to future fossil fuel price increasesReduced exposure to GHG emissions and therefore less sensitivity to changes in cost of carbonReturns on investment in low-emissions technologyIncreased capital availability (e.g., as more investors favor lower-emissions producers)Reputational benefits resulting in increased demand for goods/services
Increased revenue through demand for lower emissions products and servicesIncreased revenue through new solutions to adaptation needs (e.g., insurance risk transfer products and services)Better competitive position to reflect shifting consumer preferences, resulting in increased revenues
Increased revenues through access to new and emerging markets (e.g., partnerships with governments, development banks)Increased diversification of financial assets (e.g., green bonds and infrastructure)
Increased market valuation through resilience planningIncreased reliability of supply chain and ability to operate under various conditionsIncreased revenue through new products and services
Source: prepared by the Ministry of Environment based on the Task Force on Climate-related Financial Disclosures, “Final Report - Recommendations of the Task Force on Climate-related Financial Disclosures”, 2017. p.11
15
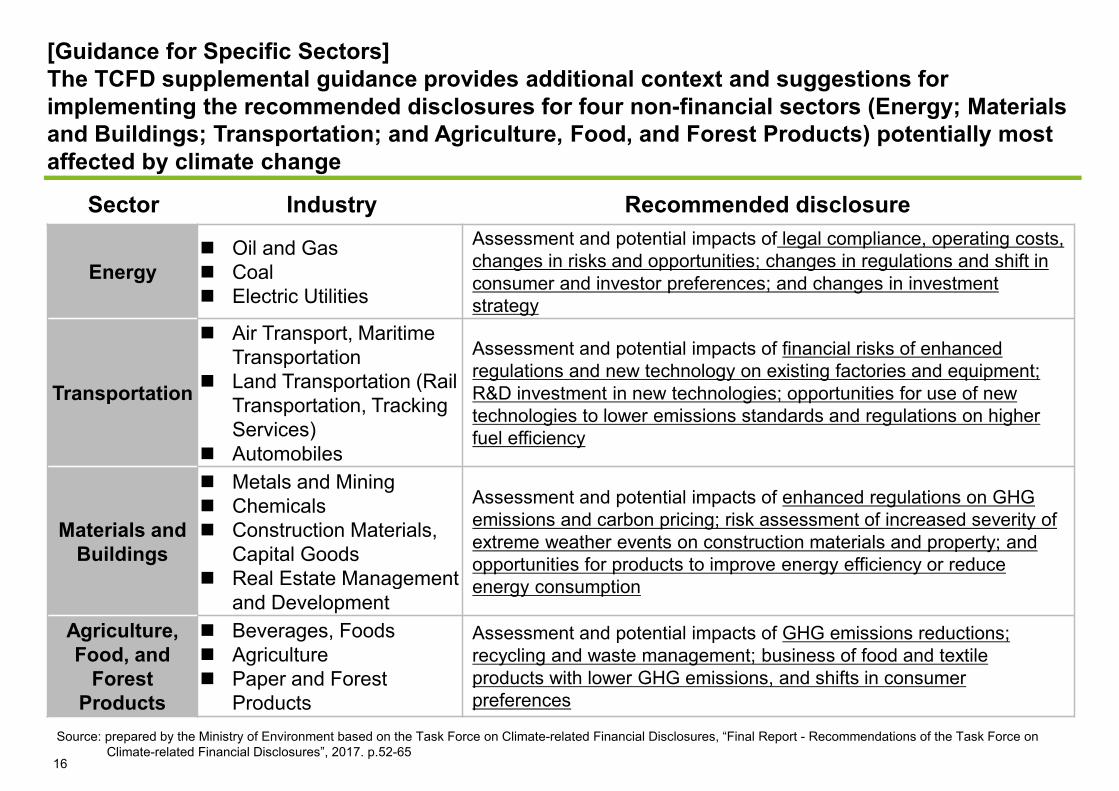
[Guidance for Specific Sectors]The TCFD supplemental guidance provides additional context and suggestions for implementing the recommended disclosures for four non-financial sectors (Energy; Materials and Buildings; Transportation; and Agriculture, Food, and Forest Products) potentially most affected by climate change
EnergyOil and GasCoalElectric Utilities
Assessment and potential impacts of legal compliance, operating costs, changes in risks and opportunities; changes in regulations and shift in consumer and investor preferences; and changes in investment strategy
Transportation
Air Transport, Maritime TransportationLand Transportation (Rail Transportation, Tracking Services)Automobiles
Assessment and potential impacts of financial risks of enhanced regulations and new technology on existing factories and equipment; R&D investment in new technologies; opportunities for use of new technologies to lower emissions standards and regulations on higher fuel efficiency
Materials and Buildings
Metals and MiningChemicalsConstruction Materials, Capital GoodsReal Estate Management and Development
Assessment and potential impacts of enhanced regulations on GHG emissions and carbon pricing; risk assessment of increased severity of extreme weather events on construction materials and property; and opportunities for products to improve energy efficiency or reduce energy consumption
Agriculture, Food, and
Forest Products
Beverages, FoodsAgriculturePaper and Forest Products
Assessment and potential impacts of GHG emissions reductions; recycling and waste management; business of food and textile products with lower GHG emissions, and shifts in consumer preferences
Source: prepared by the Ministry of Environment based on the Task Force on Climate-related Financial Disclosures, “Final Report - Recommendations of the Task Force on Climate-related Financial Disclosures”, 2017. p.52-65
Sector Industry Recommended disclosure
16
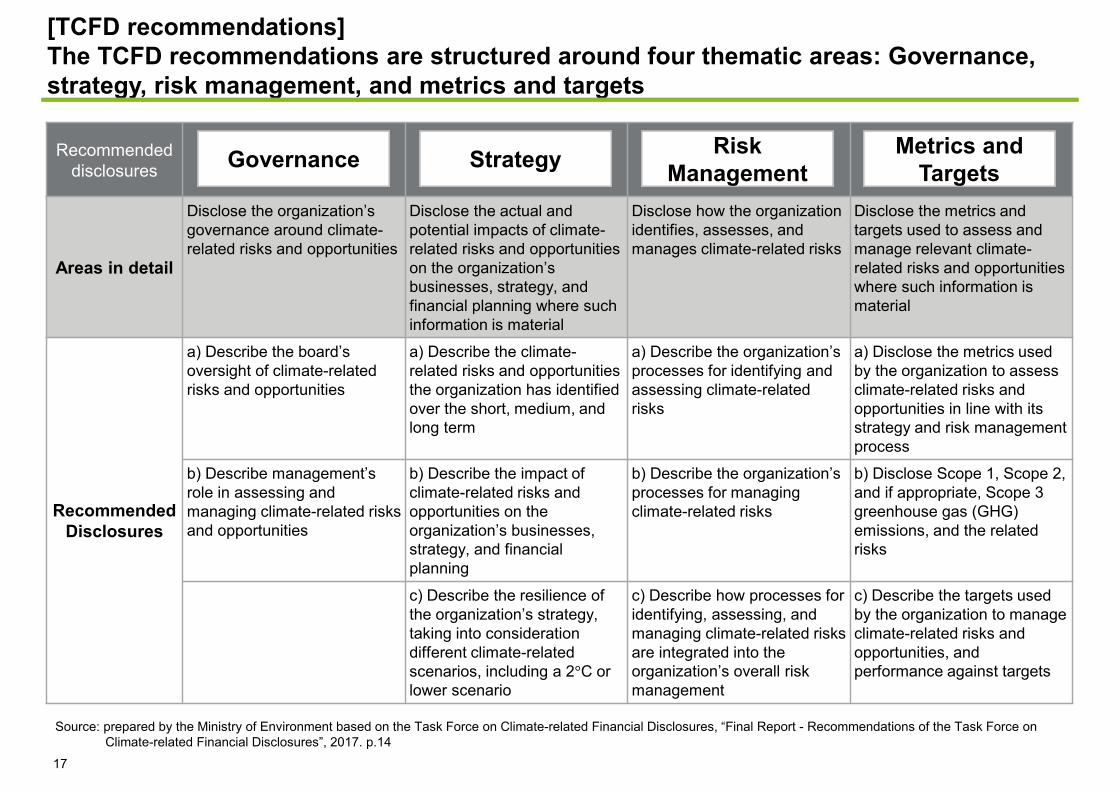
[TCFD recommendations]The TCFD recommendations are structured around four thematic areas: Governance, strategy, risk management, and metrics and targets
Recommendeddisclosures ガバナンス 戦略 リスク管理 指標と目標
Areas in detail
Disclose the organization’s governance around climate-related risks and opportunities
Disclose the actual and potential impacts of climate-related risks and opportunities on the organization’s businesses, strategy, and financial planning where such information is material
Disclose how the organization identifies, assesses, and manages climate-related risks
Disclose the metrics and targets used to assess and manage relevant climate-related risks and opportunities where such information is material
Recommended Disclosures
a) Describe the board’s oversight of climate-related risks and opportunities
a) Describe the climate-related risks and opportunities the organization has identified over the short, medium, and long term
a) Describe the organization’s processes for identifying and assessing climate-related risks
a) Disclose the metrics used by the organization to assess climate-related risks and opportunities in line with its strategy and risk management process
b) Describe management’s role in assessing and managing climate-related risks and opportunities
b) Describe the impact of climate-related risks and opportunities on the organization’s businesses, strategy, and financial planning
b) Describe the organization’s processes for managing climate-related risks
b) Disclose Scope 1, Scope 2, and if appropriate, Scope 3 greenhouse gas (GHG) emissions, and the related risks
c) Describe the resilience of the organization’s strategy, taking into consideration different climate-related scenarios, including a 2 C or lower scenario
c) Describe how processes for identifying, assessing, and managing climate-related risks are integrated into the organization’s overall risk management
c) Describe the targets used by the organization to manage climate-related risks and opportunities, and performance against targets
Risk ManagementGovernance Strategy Metrics and
Targets
17
Source: prepared by the Ministry of Environment based on the Task Force on Climate-related Financial Disclosures, “Final Report - Recommendations of the Task Force on Climate-related Financial Disclosures”, 2017. p.14
The organization’s governance
around climate-related risks and
opportunities
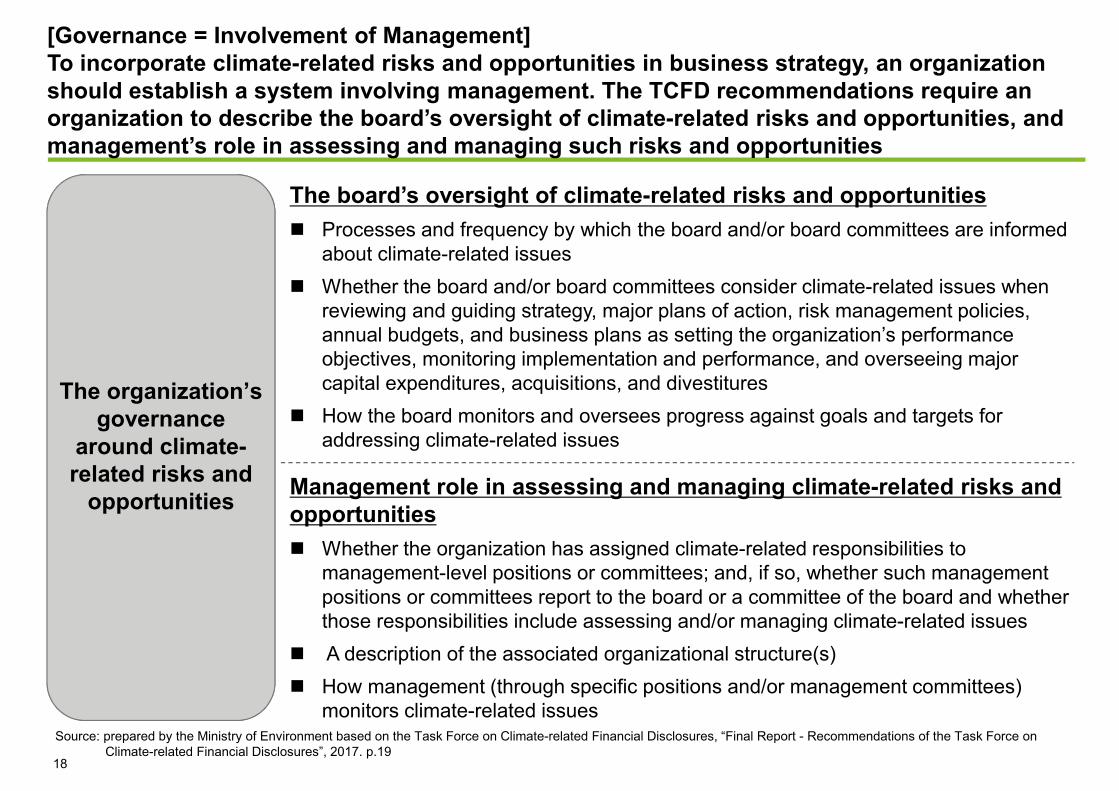
[Governance = Involvement of Management]To incorporate climate-related risks and opportunities in business strategy, an organization should establish a system involving management. The TCFD recommendations require an organization to describe the board’s oversight of climate-related risks and opportunities, and management’s role in assessing and managing such risks and opportunities
Source: prepared by the Ministry of Environment based on the Task Force on Climate-related Financial Disclosures, “Final Report - Recommendations of the Task Force on Climate-related Financial Disclosures”, 2017. p.19
18
The board’s oversight of climate-related risks and opportunitiesProcesses and frequency by which the board and/or board committees are informed about climate-related issuesWhether the board and/or board committees consider climate-related issues when reviewing and guiding strategy, major plans of action, risk management policies, annual budgets, and business plans as setting the organization’s performance objectives, monitoring implementation and performance, and overseeing major capital expenditures, acquisitions, and divestituresHow the board monitors and oversees progress against goals and targets for addressing climate-related issues
Management role in assessing and managing climate-related risks and opportunities
Whether the organization has assigned climate-related responsibilities to management-level positions or committees; and, if so, whether such management positions or committees report to the board or a committee of the board and whether those responsibilities include assessing and/or managing climate-related issuesA description of the associated organizational structure(s)How management (through specific positions and/or management committees) monitors climate-related issues
Impact on the organization’s businesses, strategy, and
financial planning (where
relevant information is
critical)
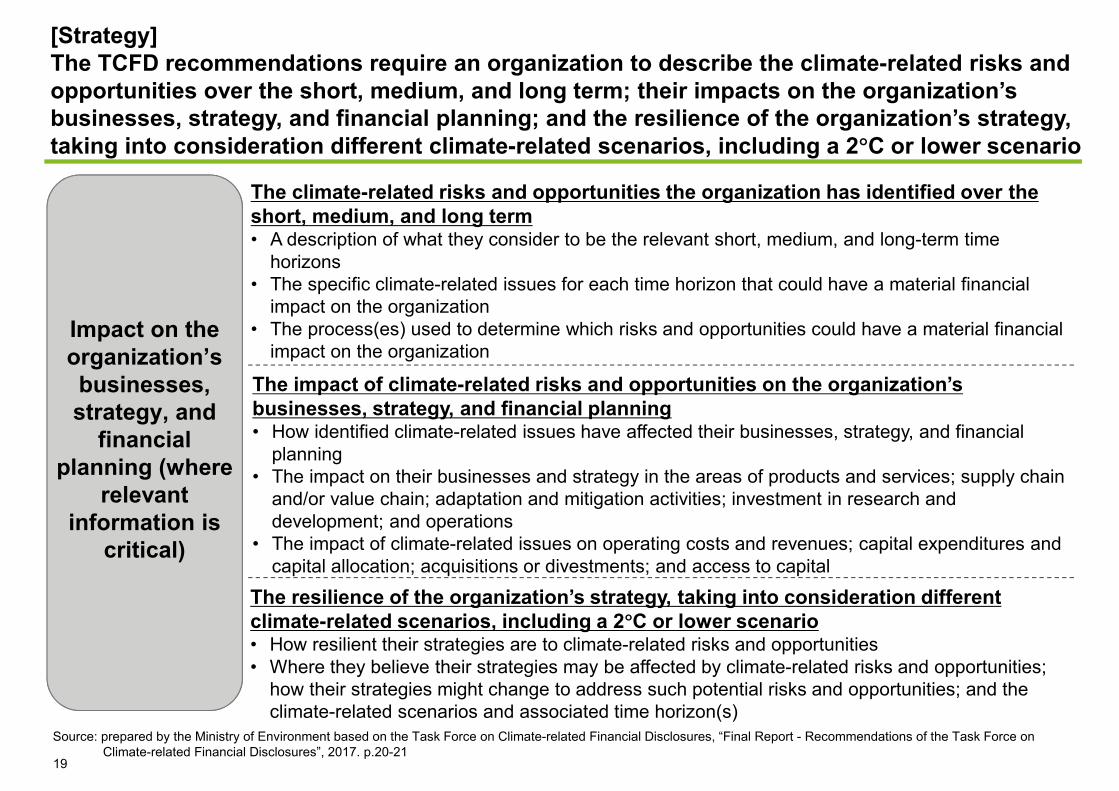
The climate-related risks and opportunities the organization has identified over the short, medium, and long term• A description of what they consider to be the relevant short, medium, and long-term time
horizons• The specific climate-related issues for each time horizon that could have a material financial
impact on the organization• The process(es) used to determine which risks and opportunities could have a material financial
impact on the organization
The impact of climate-related risks and opportunities on the organization’s businesses, strategy, and financial planning• How identified climate-related issues have affected their businesses, strategy, and financial
planning• The impact on their businesses and strategy in the areas of products and services; supply chain
and/or value chain; adaptation and mitigation activities; investment in research and development; and operations
• The impact of climate-related issues on operating costs and revenues; capital expenditures and capital allocation; acquisitions or divestments; and access to capital
The resilience of the organization’s strategy, taking into consideration different climate-related scenarios, including a 2 C or lower scenario• How resilient their strategies are to climate-related risks and opportunities• Where they believe their strategies may be affected by climate-related risks and opportunities;
how their strategies might change to address such potential risks and opportunities; and the climate-related scenarios and associated time horizon(s)
Source: prepared by the Ministry of Environment based on the Task Force on Climate-related Financial Disclosures, “Final Report - Recommendations of the Task Force on Climate-related Financial Disclosures”, 2017. p.20-21
19
[Strategy]The TCFD recommendations require an organization to describe the climate-related risks and opportunities over the short, medium, and long term; their impacts on the organization’s businesses, strategy, and financial planning; and the resilience of the organization’s strategy, taking into consideration different climate-related scenarios, including a 2 C or lower scenario

How the organization
identifies, assesses,
and manages climate-
related risks
The Organization’s processes for identifying and assessing climate-related risks• Their risk management processes for identifying and assessing climate-related risks
(An important aspect is how the organization determines the relative significance of climate-related risks in relation to other risks)
• Whether they consider existing and emerging regulatory requirements related to climate change
• Their processes for assessing the potential size and scope of identified climate-related risks; and definitions of risk terminology used or references to existing risk classification frameworks used
The organization’s processes for managing climate-related risks• Their processes for managing climate-related risks, (including how they make decisions
to mitigate, transfer, accept, or control those risks)• Their processes for prioritizing climate-related risks, (including how materiality
determinations are made)
How processes for identifying, assessing, and managing climate-related risks are integrated into the organization’s overall risks management• How their processes for identifying, assessing, and managing climate-
related risks are integrated into their overall risk management
[Risk Management]The TCFD recommendations require an organization to describe the organization’s processes for identifying, assessing, and managing climate-related risks, as well as how these processes are integrated into the organization’s overall risk management
Source: prepared by the Ministry of Environment based on the Task Force on Climate-related Financial Disclosures, “Final Report - Recommendations of the Task Force on Climate-related Financial Disclosures”, 2017. p.21-22
20
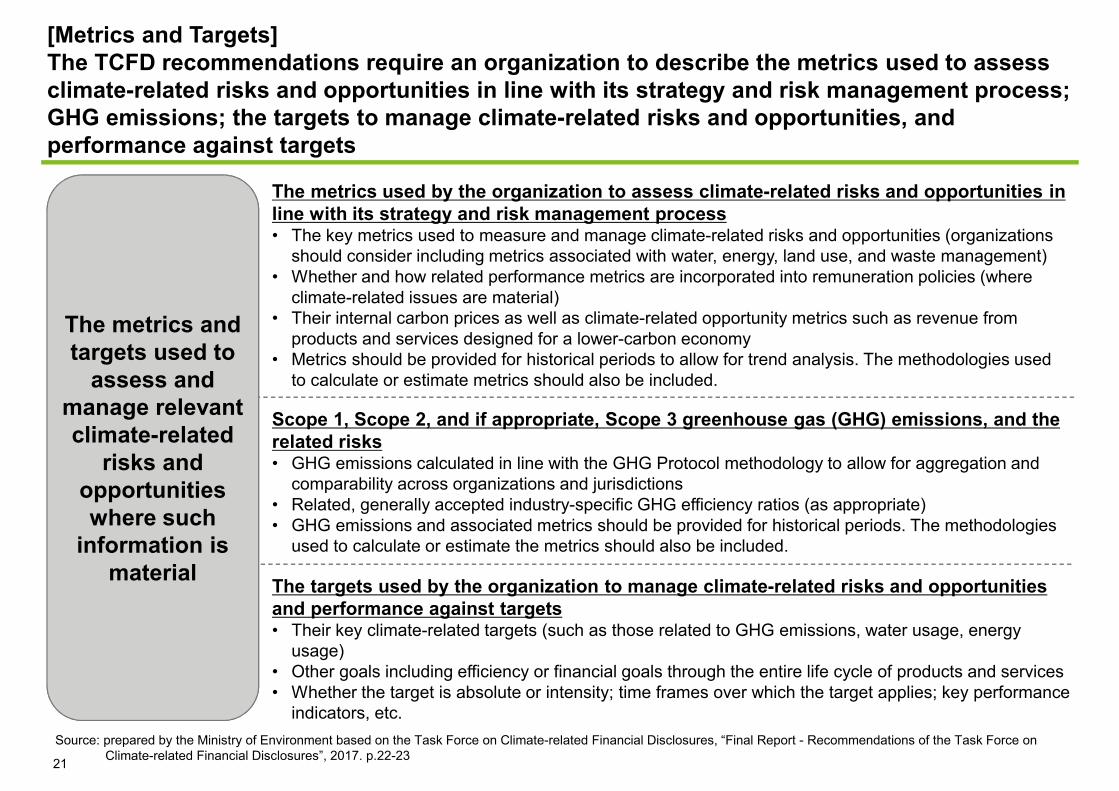
The metrics used by the organization to assess climate-related risks and opportunities in line with its strategy and risk management process• The key metrics used to measure and manage climate-related risks and opportunities (organizations
should consider including metrics associated with water, energy, land use, and waste management)• Whether and how related performance metrics are incorporated into remuneration policies (where
climate-related issues are material)• Their internal carbon prices as well as climate-related opportunity metrics such as revenue from
products and services designed for a lower-carbon economy• Metrics should be provided for historical periods to allow for trend analysis. The methodologies used
to calculate or estimate metrics should also be included.
Scope 1, Scope 2, and if appropriate, Scope 3 greenhouse gas (GHG) emissions, and the related risks• GHG emissions calculated in line with the GHG Protocol methodology to allow for aggregation and
comparability across organizations and jurisdictions• Related, generally accepted industry-specific GHG efficiency ratios (as appropriate)• GHG emissions and associated metrics should be provided for historical periods. The methodologies
used to calculate or estimate the metrics should also be included.
The targets used by the organization to manage climate-related risks and opportunities and performance against targets• Their key climate-related targets (such as those related to GHG emissions, water usage, energy
usage)• Other goals including efficiency or financial goals through the entire life cycle of products and services• Whether the target is absolute or intensity; time frames over which the target applies; key performance
indicators, etc.
[Metrics and Targets]The TCFD recommendations require an organization to describe the metrics used to assess climate-related risks and opportunities in line with its strategy and risk management process; GHG emissions; the targets to manage climate-related risks and opportunities, and performance against targets
Source: prepared by the Ministry of Environment based on the Task Force on Climate-related Financial Disclosures, “Final Report - Recommendations of the Task Force on Climate-related Financial Disclosures”, 2017. p.22-2321
The metrics and targets used to
assess and manage relevant climate-related
risks and opportunities where such
information is material

Scenario analysis can help organizations consider issues whose possible outcomes are highly uncertain and will play out over the medium to longer term. It can also enhance organizations’ strategic conversations about the future.Organizations with more significant exposure to climate-related issues should consider disclosing key assumptions and pathways related to the scenarios they use. Scenario analysis is complex and requires resources, but brings benefit to organizations.
Why scenario analysis is a useful tool
Target Applicable scenarios
Transition risks
IEA WEO 450/ETP 2DS/IEA WEO Bridge/IEA WEO INDC(2 C or lower scenarios and other scenarios)Deep decarbonizaion Pathways Project (2 C or lower scenario)IRENA Remap (the renewable energy ratio to be doubled by 2030)Greenpeace Advanced Energy [R]evolution (2 C or lower scenario)
Physical risks IPCC Representative Concentration Pathway (RCP) Scenarios: RCP8.5, RCP6.0, RCP4.5, RCP2.6
[Significance of Scenario Analysis (i)]The TCFD recommends that organizations perform scenario analysis to assess the potential business implications of climate-related risks and opportunities, and disclose assessments.The TCFD’s technical supplement provides more information on scenario analysis
The TCFD recommends that organizations perform scenario analysis to assess the potential business implications of climate-related risks and opportunities, and disclose assessments.The TCFD’s technical supplement provides more information on scenario analysis.
Sources: prepared by the Ministry of Environment based on the Task Force on Climate-related Financial Disclosures, “Final Report - Recommendations of the Task Force on Climate-related Financial Disclosures”, 2017. p. 25-29, the Task Force on Climate-related Financial Disclosures, “Technical Supplement - The Use of Scenario Analysis in Disclosure of Climate-Related Risks and Opportunities”, 2017. p.21 and p.25
22
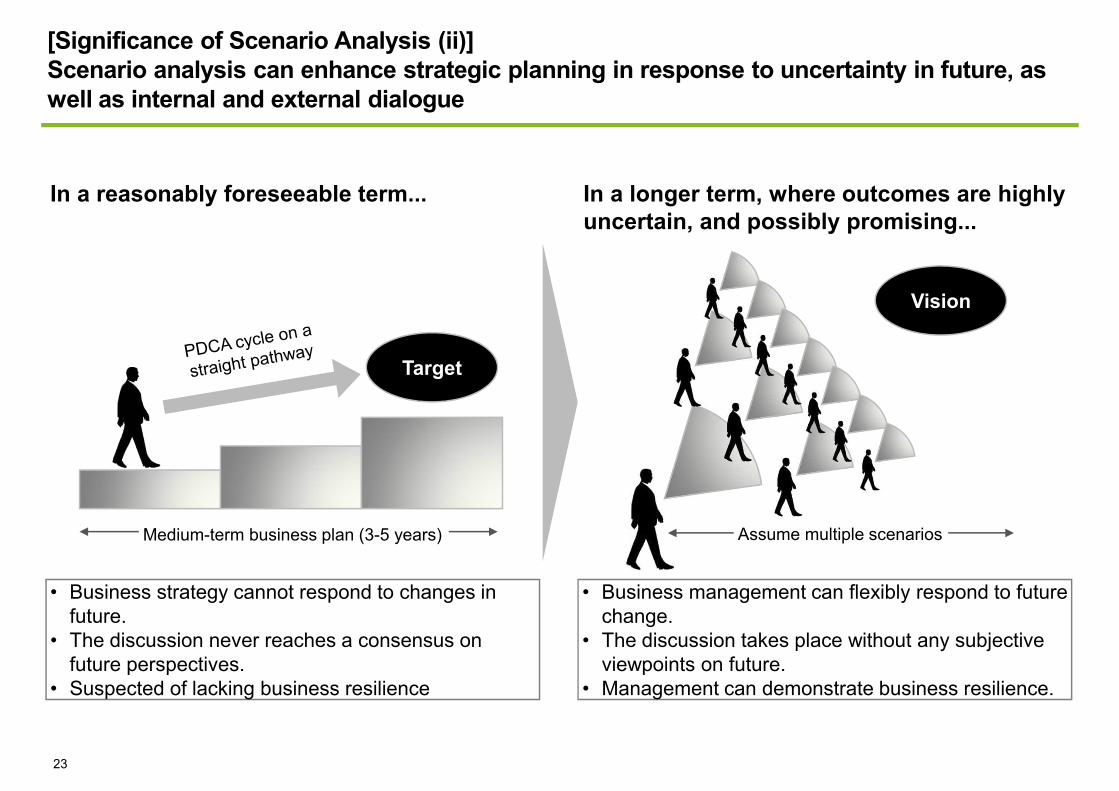
[Significance of Scenario Analysis (ii)]Scenario analysis can enhance strategic planning in response to uncertainty in future, as well as internal and external dialogue
In a reasonably foreseeable term... In a longer term, where outcomes are highly uncertain, and possibly promising...
• Business strategy cannot respond to changes in future.
• The discussion never reaches a consensus on future perspectives.
• Suspected of lacking business resilience
• Business management can flexibly respond to future change.
• The discussion takes place without any subjective viewpoints on future.
• Management can demonstrate business resilience.
Target
Vision
Medium-term business plan (3-5 years)
23
Assume multiple scenarios
24
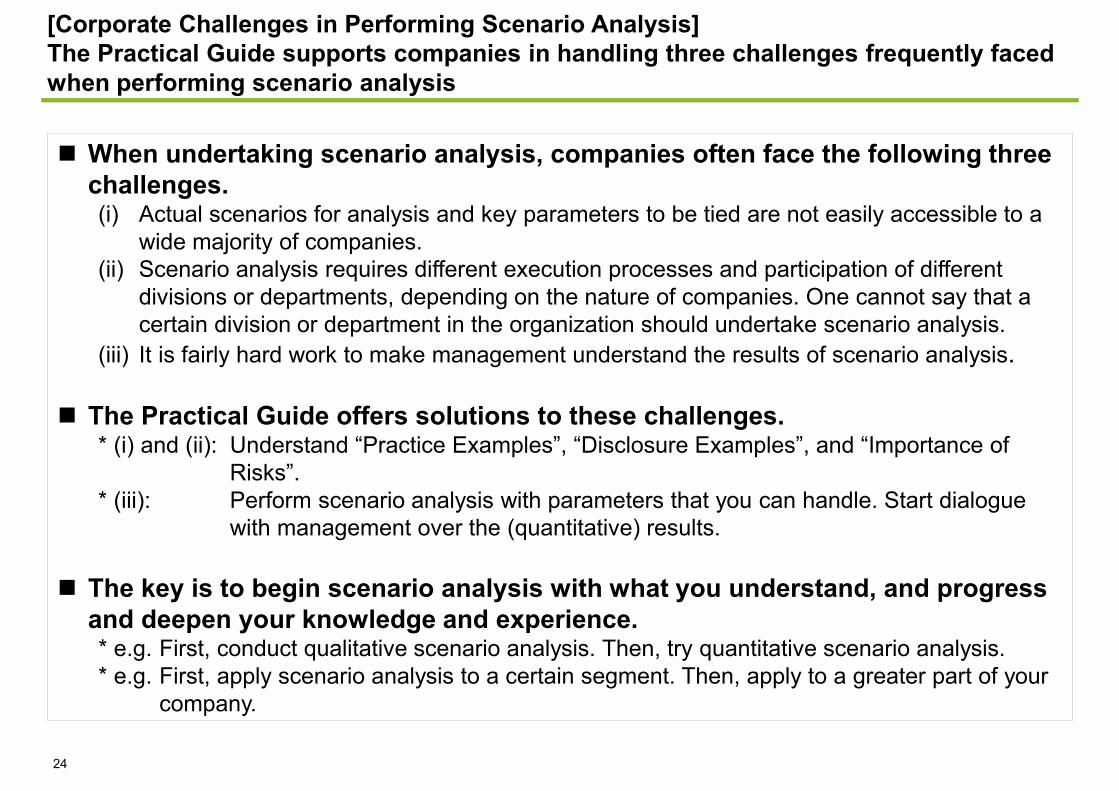
[Corporate Challenges in Performing Scenario Analysis]The Practical Guide supports companies in handling three challenges frequently faced when performing scenario analysis
When undertaking scenario analysis, companies often face the following three challenges.(i) Actual scenarios for analysis and key parameters to be tied are not easily accessible to a
wide majority of companies.(ii) Scenario analysis requires different execution processes and participation of different
divisions or departments, depending on the nature of companies. One cannot say that a certain division or department in the organization should undertake scenario analysis.
(iii) It is fairly hard work to make management understand the results of scenario analysis.
The Practical Guide offers solutions to these challenges.* (i) and (ii): Understand “Practice Examples”, “Disclosure Examples”, and “Importance of
Risks”.* (iii): Perform scenario analysis with parameters that you can handle. Start dialogue
with management over the (quantitative) results.
The key is to begin scenario analysis with what you understand, and progress and deepen your knowledge and experience.* e.g. First, conduct qualitative scenario analysis. Then, try quantitative scenario analysis.* e.g. First, apply scenario analysis to a certain segment. Then, apply to a greater part of your
company.

2. Scenario Analysis - Practice Examples
Chapter 2. Scenario Analysis -Practice Examples (six companies)This chapter presents scenario analysis performed by selected companies under the support program of the Ministry of Environment and explains how to undertake scenario analysis.
25
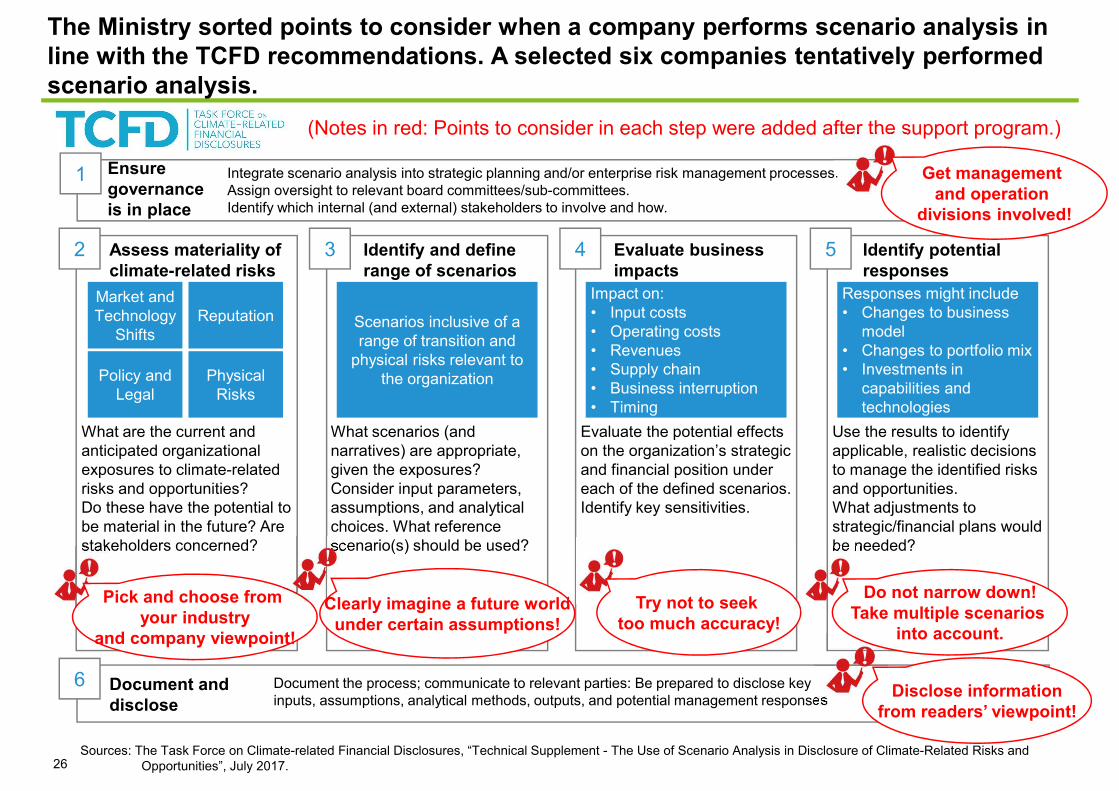
The Ministry sorted points to consider when a company performs scenario analysis in line with the TCFD recommendations. A selected six companies tentatively performed scenario analysis.
Scenarios inclusive of a range of transition and
physical risks relevant to the organization
Impact on:• Input costs• Operating costs• Revenues• Supply chain• Business interruption• Timing
Responses might include• Changes to business
model• Changes to portfolio mix• Investments in
capabilities and technologies
Market and Technology
ShiftsReputation
Policy and Legal
Physical Risks
Assess materiality of climate-related risks
Identify and define range of scenarios
Evaluate business impacts
Identify potential responses
Ensure governance is in place
Document and disclose
1
6
2 3 4 5
Integrate scenario analysis into strategic planning and/or enterprise risk management processes. Assign oversight to relevant board committees/sub-committees.Identify which internal (and external) stakeholders to involve and how.
What are the current and anticipated organizational exposures to climate-related risks and opportunities?Do these have the potential to be material in the future? Are stakeholders concerned?
What scenarios (and narratives) are appropriate, given the exposures?Consider input parameters, assumptions, and analytical choices. What reference scenario(s) should be used?
Evaluate the potential effects on the organization’s strategic and financial position under each of the defined scenarios.Identify key sensitivities.
Use the results to identify applicable, realistic decisions to manage the identified risks and opportunities.What adjustments to strategic/financial plans would be needed?
Document the process; communicate to relevant parties: Be prepared to disclose key inputs, assumptions, analytical methods, outputs, and potential management responses
(Notes in red: Points to consider in each step were added after the support program.)
Pick and choose from your industry
and company viewpoint!
Disclose informationfrom readers’ viewpoint!
Get management and operation
divisions involved!
Clearly imagine a future worldunder certain assumptions!
Try not to seek too much accuracy!
Do not narrow down!Take multiple scenarios
into account.
Sources: The Task Force on Climate-related Financial Disclosures, “Technical Supplement - The Use of Scenario Analysis in Disclosure of Climate-Related Risks and Opportunities”, July 2017.26
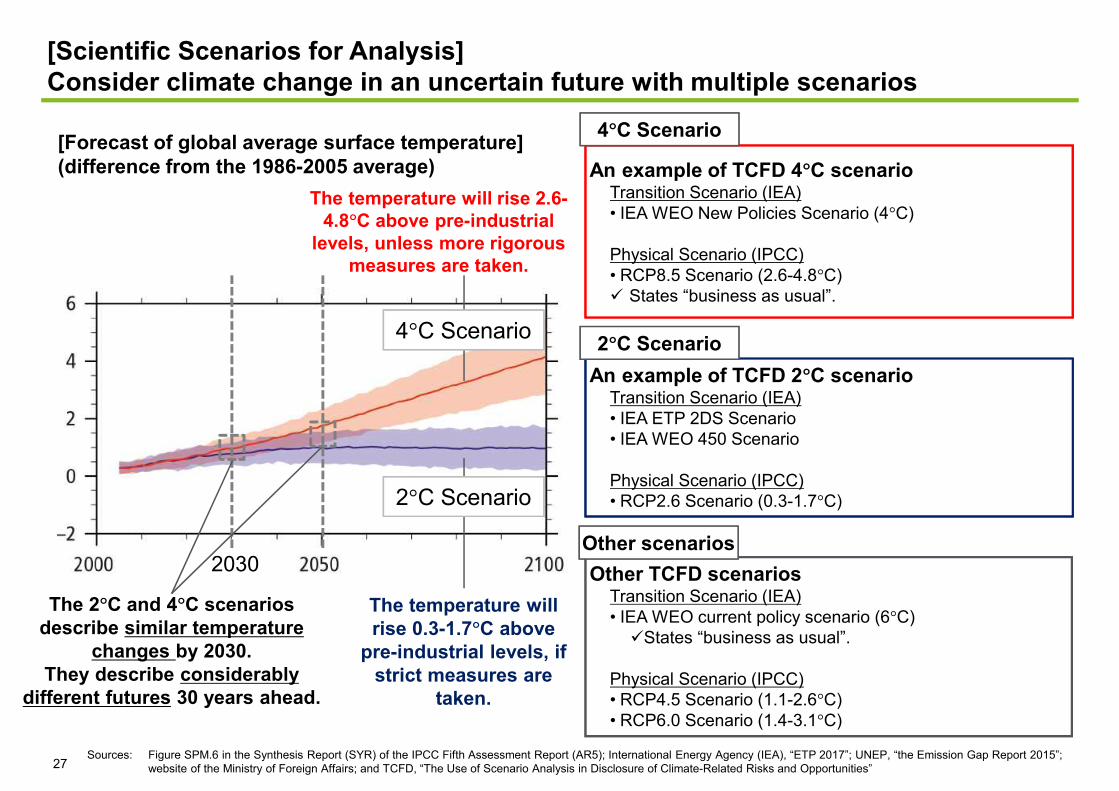
An example of TCFD 2 C scenarioTransition Scenario (IEA)• IEA ETP 2DS Scenario• IEA WEO 450 Scenario
Physical Scenario (IPCC)• RCP2.6 Scenario (0.3-1.7 C)
An example of TCFD 4 C scenarioTransition Scenario (IEA)• IEA WEO New Policies Scenario (4 C)
Physical Scenario (IPCC)• RCP8.5 Scenario (2.6-4.8 C)
States “business as usual”.
27
[Scientific Scenarios for Analysis]Consider climate change in an uncertain future with multiple scenarios
The temperature will rise 0.3-1.7 C above
pre-industrial levels, if strict measures are
taken.
The temperature will rise 2.6-4.8 C above pre-industrial
levels, unless more rigorous measures are taken.
[Forecast of global average surface temperature](difference from the 1986-2005 average)
4 C Scenario
2 C Scenario
4 C Scenario
2 C Scenario
2030
The 2 C and 4 C scenarios describe similar temperature
changes by 2030.They describe considerably
different futures 30 years ahead.
Sources: Figure SPM.6 in the Synthesis Report (SYR) of the IPCC Fifth Assessment Report (AR5); International Energy Agency (IEA), “ETP 2017”; UNEP, “the Emission Gap Report 2015”; website of the Ministry of Foreign Affairs; and TCFD, “The Use of Scenario Analysis in Disclosure of Climate-Related Risks and Opportunities”
Other TCFD scenariosTransition Scenario (IEA)• IEA WEO current policy scenario (6 C)
States “business as usual”.
Physical Scenario (IPCC)• RCP4.5 Scenario (1.1-2.6 C)• RCP6.0 Scenario (1.4-3.1 C)
Other scenarios
28
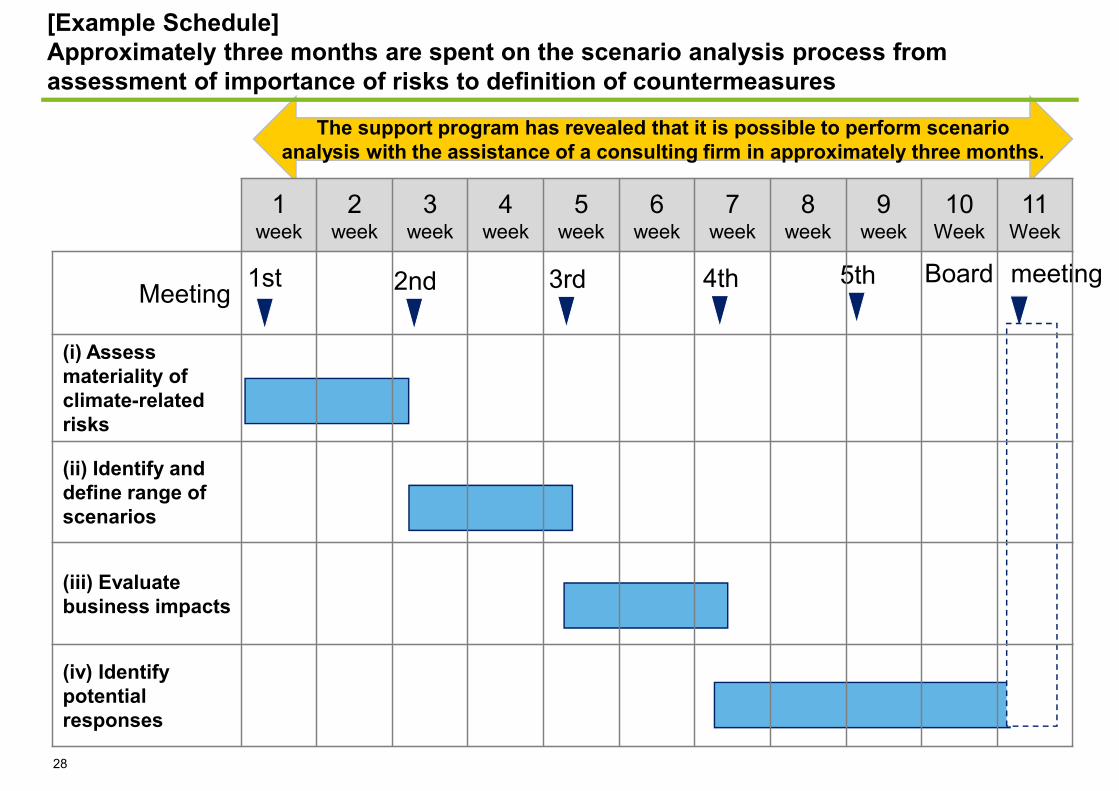
[Example Schedule]Approximately three months are spent on the scenario analysis process from assessment of importance of risks to definition of countermeasures
The support program has revealed that it is possible to perform scenario analysis with the assistance of a consulting firm in approximately three months.
1st 2nd 3rd 4th 5th Board meeting
1week
2week
3week
4week
5week
6week
7week
8week
9week
10Week
11Week
Meeting
(i) Assess materiality of climate-related risks
(ii) Identify and define range of scenarios
(iii) Evaluate business impacts
(iv) Identify potential responses
29
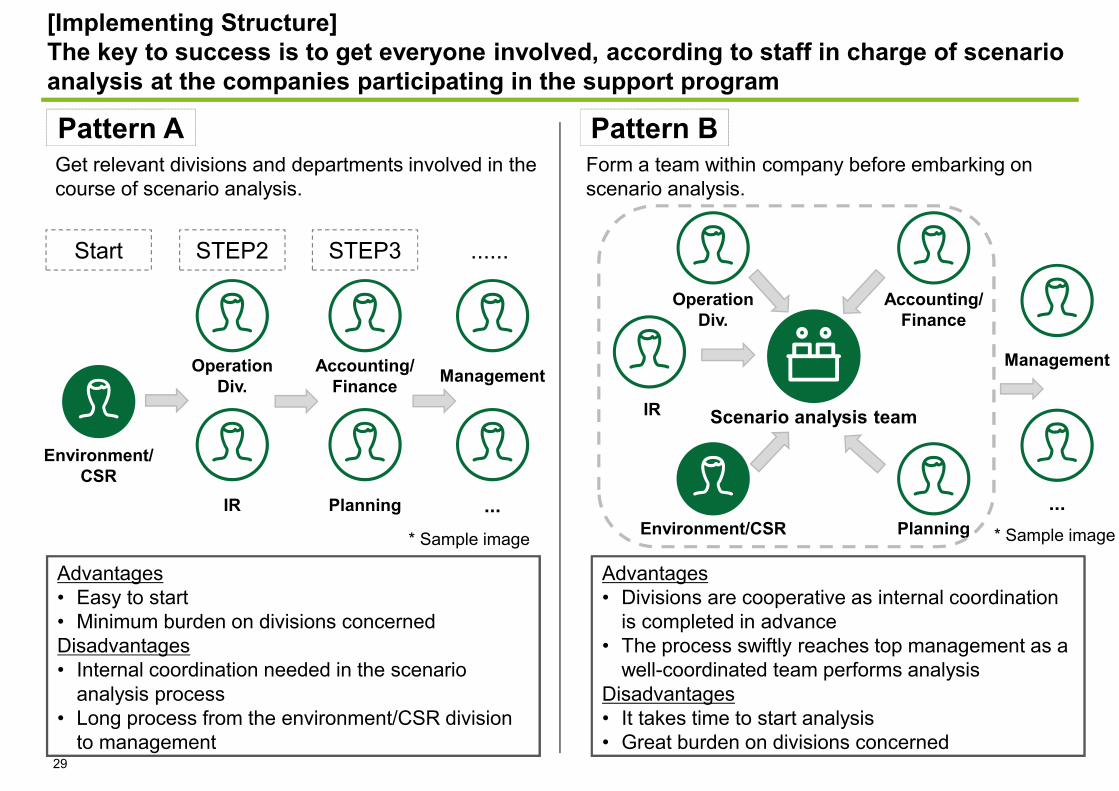
[Implementing Structure]The key to success is to get everyone involved, according to staff in charge of scenario analysis at the companies participating in the support program
Environment/CSR
Operation Div.
Accounting/ Finance
...
Management
Pattern A Pattern B
Advantages• Easy to start• Minimum burden on divisions concernedDisadvantages• Internal coordination needed in the scenario
analysis process• Long process from the environment/CSR division
to management
Advantages• Divisions are cooperative as internal coordination
is completed in advance• The process swiftly reaches top management as a
well-coordinated team performs analysisDisadvantages• It takes time to start analysis• Great burden on divisions concerned
STEP2Start ......
Planning
STEP3
Environment/CSR
Operation Div.
Accounting/Finance
Management
Planning
Scenario analysis team
Get relevant divisions and departments involved in the course of scenario analysis.
Form a team within company before embarking on scenario analysis.
...* Sample image * Sample image
IR
IR
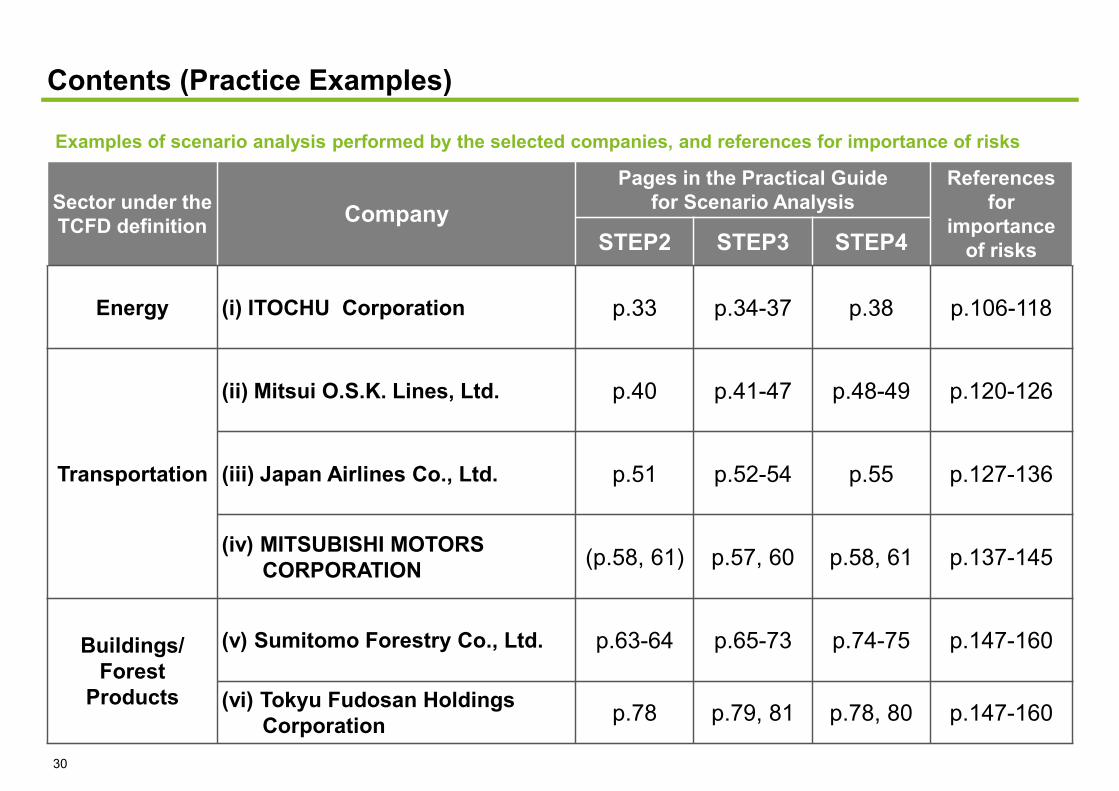
Examples of scenario analysis performed by the selected companies, and references for importance of risks
Contents (Practice Examples)
Sector under the TCFD definition Company
Pages in the Practical Guidefor Scenario Analysis
References for
importance of risksSTEP2 STEP3 STEP4
Energy (i) ITOCHU Corporation p.33 p.34-37 p.38 p.106-118
Transportation
(ii) Mitsui O.S.K. Lines, Ltd. p.40 p.41-47 p.48-49 p.120-126
(iii) Japan Airlines Co., Ltd. p.51 p.52-54 p.55 p.127-136
(iv) MITSUBISHI MOTORSCORPORATION (p.58, 61) p.57, 60 p.58, 61 p.137-145
Buildings/Forest
Products
(v) Sumitomo Forestry Co., Ltd. p.63-64 p.65-73 p.74-75 p.147-160
(vi) Tokyu Fudosan HoldingsCorporation p.78 p.79, 81 p.78, 80 p.147-160
30
2. Scenario Analysis - Practice Examples(i) ITOCHU Corporation(ii) Mitsui O.S.K. Lines, Ltd.(iii) Japan Airlines Co., Ltd(iv) MITSUBISHI MOTORS CORPORATION(v) Sumitomo Forestry Co., Ltd.(vi) Tokyu Fudosan Holdings Corporation
31

ITOCHU Corporation■Textile Company
Apparel DivisionBrand Marketing Division 1Brand Marketing Division 2
■ Machinery CompanyPlant Project, Marine & Aerospace DivisionAutomobile, Construction, Realty & Logistics, Machinery & Industrial Machinery Division
■ Metals & Minerals CompanyMetal & Mineral Resources Division
■ Energy & Chemicals CompanyEnergy DivisionChemicals Division
■ Food CompanyProvisions DivisionFresh Food DivisionFood Products Marketing & Distribution Division
■ General Products & Reality CompanyForest Products & General Merchandise DivisionConstruction & Logistics Division
■ ICT & Financial Business CompanyICT DivisionFinancial & Insurance Business Division
Power Project Department
Department in charge of scenario analysis
As of 2018
4 52 3STEP
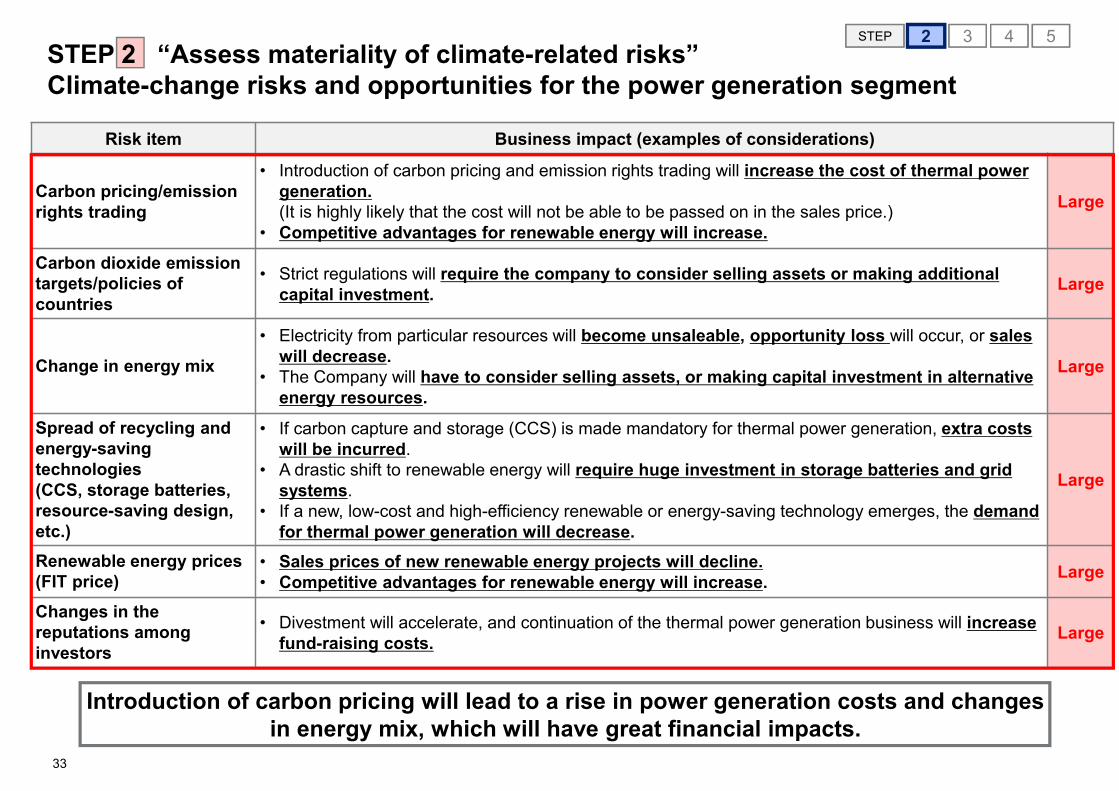
Introduction of carbon pricing will lead to a rise in power generation costs and changes in energy mix, which will have great financial impacts.
Risk item Business impact (examples of considerations)
Carbon pricing/emission rights trading
• Introduction of carbon pricing and emission rights trading will increase the cost of thermal power generation.(It is highly likely that the cost will not be able to be passed on in the sales price.)
• Competitive advantages for renewable energy will increase.
Large
Carbon dioxide emission targets/policies of countries
• Strict regulations will require the company to consider selling assets or making additional capital investment. Large
Change in energy mix• Electricity from particular resources will become unsaleable, opportunity loss will occur, or sales
will decrease.• The Company will have to consider selling assets, or making capital investment in alternative
energy resources.
Large
Spread of recycling and energy-saving technologies(CCS, storage batteries, resource-saving design, etc.)
• If carbon capture and storage (CCS) is made mandatory for thermal power generation, extra costs will be incurred.
• A drastic shift to renewable energy will require huge investment in storage batteries and grid systems.
• If a new, low-cost and high-efficiency renewable or energy-saving technology emerges, the demand for thermal power generation will decrease.
Large
Renewable energy prices (FIT price)
• Sales prices of new renewable energy projects will decline.• Competitive advantages for renewable energy will increase. Large
Changes in the reputations among investors
• Divestment will accelerate, and continuation of the thermal power generation business will increase fund-raising costs. Large
STEP 2 “Assess materiality of climate-related risks”Climate-change risks and opportunities for the power generation segment
33
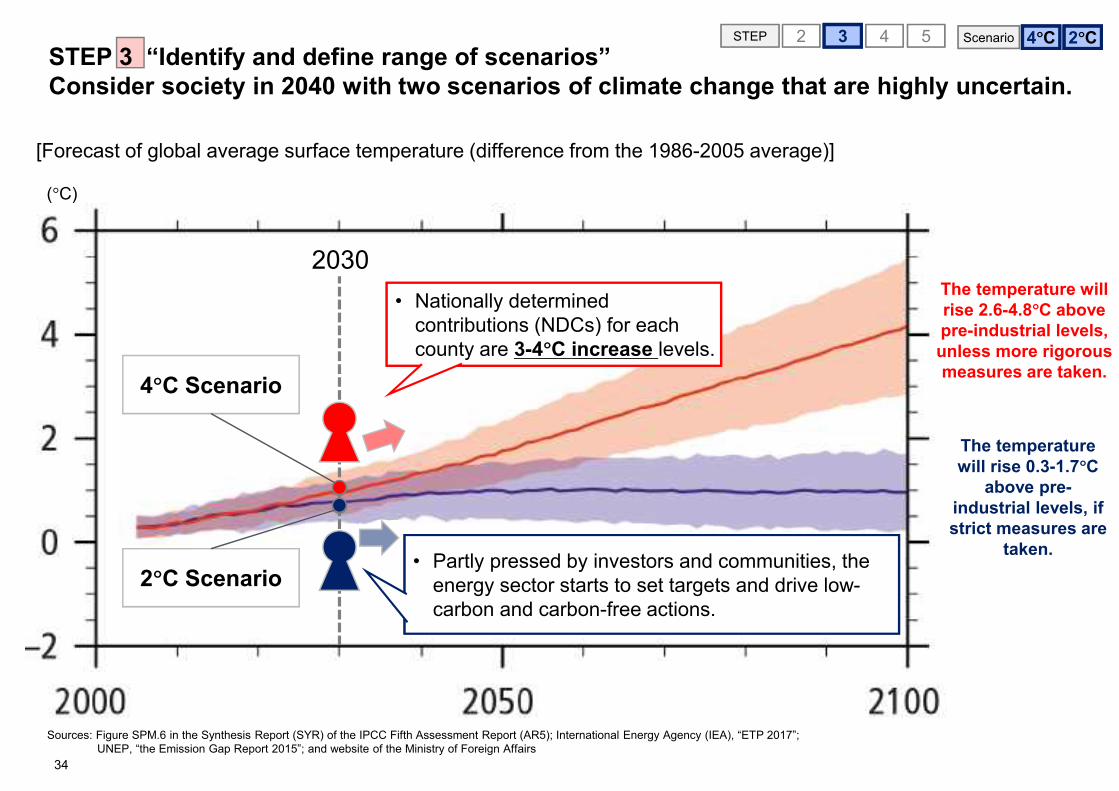
( C)
2030
4 C 2 C4 5 ScenarioSTEP
Sources: Figure SPM.6 in the Synthesis Report (SYR) of the IPCC Fifth Assessment Report (AR5); International Energy Agency (IEA), “ETP 2017”; UNEP, “the Emission Gap Report 2015”; and website of the Ministry of Foreign Affairs
[Forecast of global average surface temperature (difference from the 1986-2005 average)]
4 C Scenario
2 C Scenario
The temperature will rise 0.3-1.7 C
above pre-industrial levels, if strict measures are
taken.
The temperature will rise 2.6-4.8 C above pre-industrial levels, unless more rigorous measures are taken.
• Nationally determined contributions (NDCs) for each county are 3-4 C increase levels.
• Partly pressed by investors and communities, the energy sector starts to set targets and drive low-carbon and carbon-free actions.
2 3STEP 3 “Identify and define range of scenarios”Consider society in 2040 with two scenarios of climate change that are highly uncertain.
34
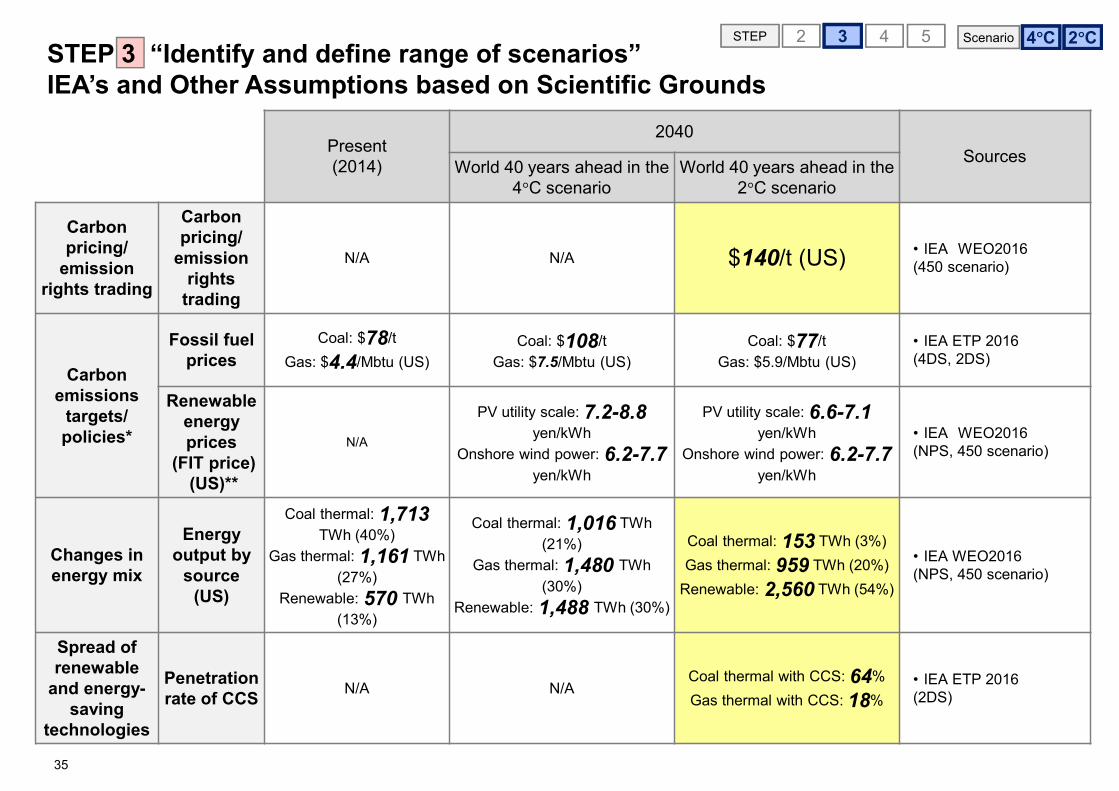
STEP 3 “Identify and define range of scenarios” IEA’s and Other Assumptions based on Scientific Grounds
Present(2014)
2040SourcesWorld 40 years ahead in the
4 C scenarioWorld 40 years ahead in the
2 C scenario
Carbon pricing/
emission rights trading
Carbon pricing/
emission rights
trading
N/A N/A $140/t (US) • IEA WEO2016(450 scenario)
Carbon emissions
targets/ policies*
Fossil fuel prices
Coal: $78/tGas: $4.4/Mbtu (US)
Coal: $108/tGas: $7.5/Mbtu (US)
Coal: $77/tGas: $5.9/Mbtu (US)
• IEA ETP 2016(4DS, 2DS)
Renewable energy prices
(FIT price)(US)**
N/A
PV utility scale: 7.2-8.8 yen/kWh
Onshore wind power: 6.2-7.7yen/kWh
PV utility scale: 6.6-7.1yen/kWh
Onshore wind power: 6.2-7.7yen/kWh
• IEA WEO2016(NPS, 450 scenario)
Changes in energy mix
Energy output by
source(US)
Coal thermal: 1,713TWh (40%)
Gas thermal: 1,161 TWh (27%)
Renewable: 570 TWh (13%)
Coal thermal: 1,016 TWh (21%)
Gas thermal: 1,480 TWh (30%)
Renewable: 1,488 TWh (30%)
Coal thermal: 153 TWh (3%)Gas thermal: 959 TWh (20%)
Renewable: 2,560 TWh (54%)
• IEA WEO2016(NPS, 450 scenario)
Spread of renewable
and energy-saving
technologies
Penetration rate of CCS N/A N/A
Coal thermal with CCS: 64%Gas thermal with CCS: 18%
• IEA ETP 2016(2DS)
35
4 C 2 C4 5 ScenarioSTEP 2 3
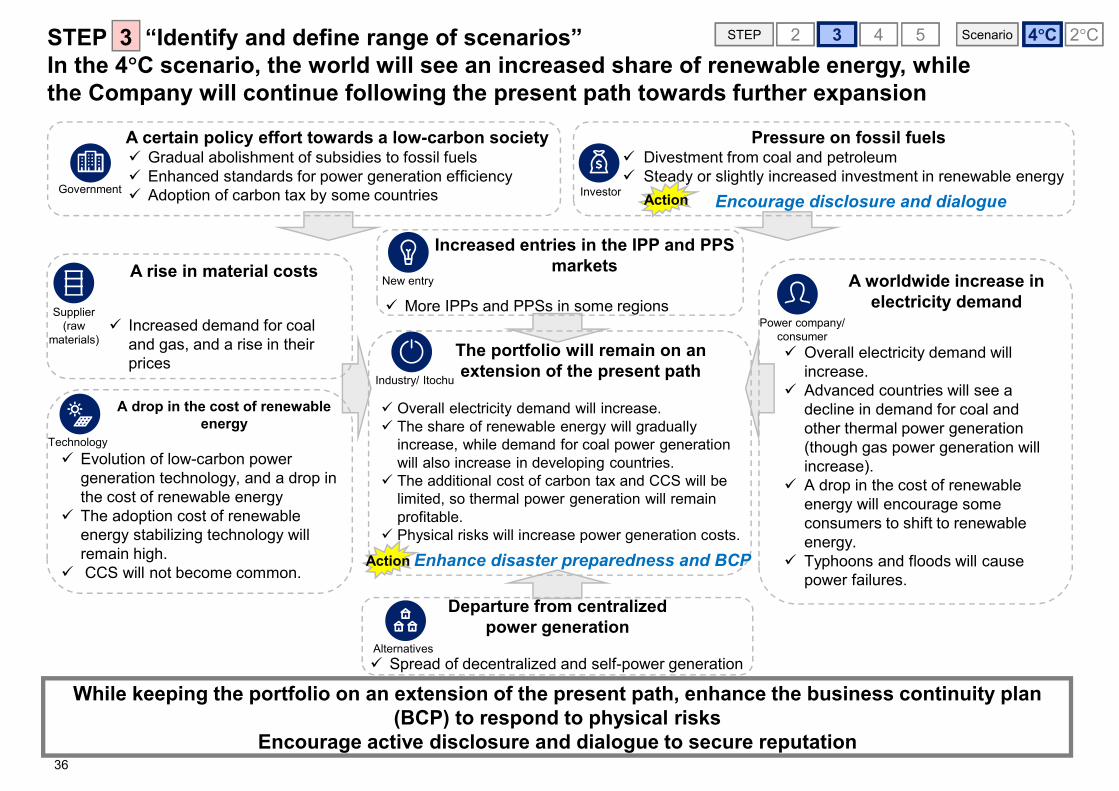
STEP 3 “Identify and define range of scenarios”In the 4 C scenario, the world will see an increased share of renewable energy, while the Company will continue following the present path towards further expansion
4 C 2 C52 ScenarioSTEP
While keeping the portfolio on an extension of the present path, enhance the business continuity plan (BCP) to respond to physical risks
Encourage active disclosure and dialogue to secure reputation
A worldwide increase in electricity demand
Overall electricity demand will increase.Advanced countries will see a decline in demand for coal and other thermal power generation (though gas power generation will increase).A drop in the cost of renewable energy will encourage some consumers to shift to renewable energy.Typhoons and floods will cause power failures.
Power company/ consumer
A certain policy effort towards a low-carbon societyGradual abolishment of subsidies to fossil fuelsEnhanced standards for power generation efficiencyAdoption of carbon tax by some countriesGovernment
Departure from centralized power generation
Spread of decentralized and self-power generationAlternatives
Increased entries in the IPP and PPS markets
More IPPs and PPSs in some regionsNew entry
A drop in the cost of renewable energy
Evolution of low-carbon power generation technology, and a drop in the cost of renewable energyThe adoption cost of renewable energy stabilizing technology will remain high.CCS will not become common.
Technology
A rise in material costs
Increased demand for coal and gas, and a rise in their prices
Supplier (raw
materials)
Encourage disclosure and dialogue
Pressure on fossil fuelsDivestment from coal and petroleumSteady or slightly increased investment in renewable energy
Investor Action
The portfolio will remain on an extension of the present path
Overall electricity demand will increase.The share of renewable energy will gradually increase, while demand for coal power generation will also increase in developing countries.The additional cost of carbon tax and CCS will be limited, so thermal power generation will remain profitable.Physical risks will increase power generation costs.
Industry/ Itochu
Enhance disaster preparedness and BCPAction
43
36
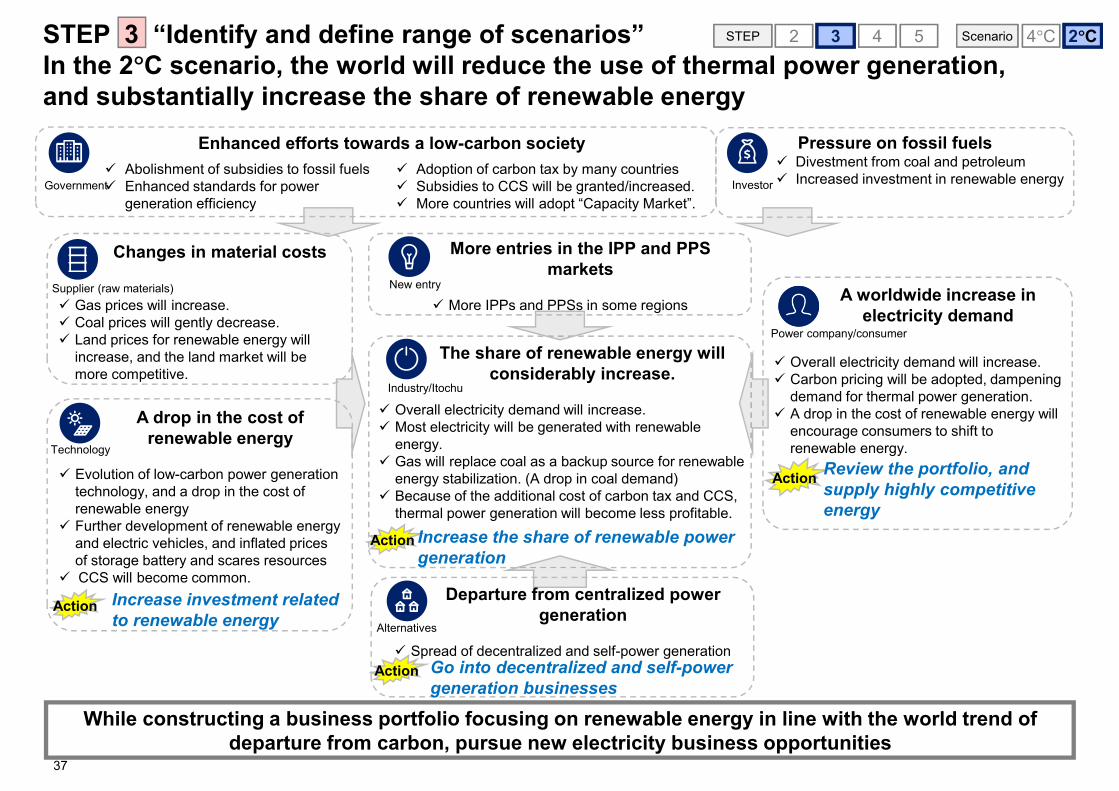
The share of renewable energy will considerably increase.
Overall electricity demand will increase.Most electricity will be generated with renewable energy.Gas will replace coal as a backup source for renewable energy stabilization. (A drop in coal demand)Because of the additional cost of carbon tax and CCS, thermal power generation will become less profitable.
52 ScenarioSTEP
While constructing a business portfolio focusing on renewable energy in line with the world trend of departure from carbon, pursue new electricity business opportunities
Industry/Itochu
Pressure on fossil fuelsDivestment from coal and petroleumIncreased investment in renewable energyInvestor
More entries in the IPP and PPS markets
More IPPs and PPSs in some regionsNew entry
Changes in material costs
Gas prices will increase.Coal prices will gently decrease.Land prices for renewable energy will increase, and the land market will be more competitive.
Supplier (raw materials)
4 C 2 C
Abolishment of subsidies to fossil fuelsEnhanced standards for power generation efficiency
Adoption of carbon tax by many countriesSubsidies to CCS will be granted/increased.More countries will adopt “Capacity Market”.
Government
Enhanced efforts towards a low-carbon society
A worldwide increase in electricity demand
Overall electricity demand will increase.Carbon pricing will be adopted, dampening demand for thermal power generation.A drop in the cost of renewable energy will encourage consumers to shift to renewable energy.
Power company/consumer
Action Review the portfolio, and supply highly competitive energy
A drop in the cost of renewable energy
Evolution of low-carbon power generation technology, and a drop in the cost of renewable energyFurther development of renewable energy and electric vehicles, and inflated prices of storage battery and scares resources CCS will become common.
Technology
Increase investment related to renewable energy
Action
Action Increase the share of renewable power generation
Departure from centralized power generation
Spread of decentralized and self-power generationAlternatives
Action Go into decentralized and self-power generation businesses
43STEP 3 “Identify and define range of scenarios”In the 2 C scenario, the world will reduce the use of thermal power generation, and substantially increase the share of renewable energy
37
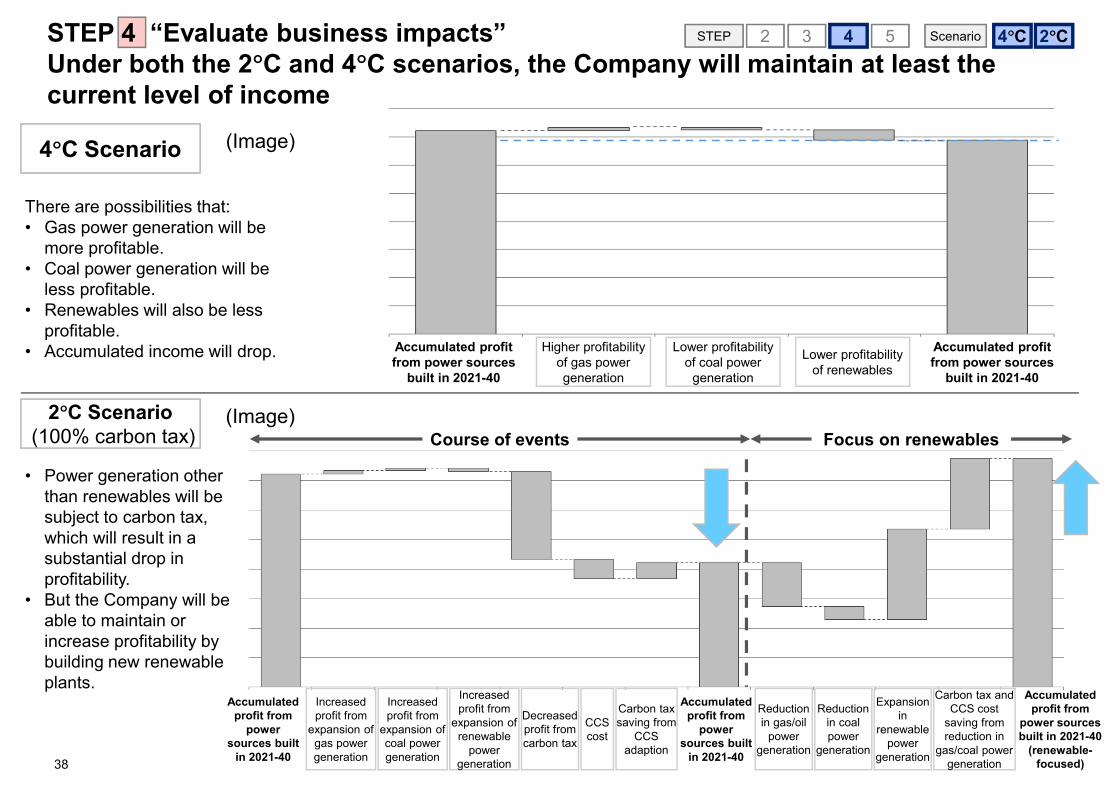
STEP 4 “Evaluate business impacts”Under both the 2 C and 4 C scenarios, the Company will maintain at least the current level of income
4 C 2 C4 52 3 ScenarioSTEP
4 C Scenario
There are possibilities that:• Gas power generation will be
more profitable.• Coal power generation will be
less profitable.• Renewables will also be less
profitable.• Accumulated income will drop.
2 C Scenario(100% carbon tax)
• Power generation other than renewables will be subject to carbon tax, which will result in a substantial drop in profitability.
• But the Company will be able to maintain or increase profitability by building new renewable plants.
Lower profitability of coal power
generation
Higher profitability of gas power generation
Lower profitability of renewables
Accumulated profit from power sources
built in 2021-40
Accumulated profit from power sources
built in 2021-40
Course of events Focus on renewables
Increased profit from
expansion ofcoal power generation
Increased profit from
expansion ofgas power generation
Increased profit from
expansion ofrenewable
power generation
Reduction in gas/oil
power generation
Decreased profit from carbon tax
CCScost
Carbon tax saving from
CCS adaption
Reduction in coalpower
generation
Carbon tax and CCS cost
saving from reduction in
gas/coal power generation
Expansion in
renewablepower
generation
Accumulated profit from
power sources built
in 2021-40
Accumulated profit from
power sources built
in 2021-40
Accumulated profit from
power sources built in 2021-40
(renewable-focused)
(Image)
(Image)
38
39
2. Scenario Analysis - Practice Examples(i) ITOCHU Corporation(ii) Mitsui O.S.K. Lines, Ltd.(iii) Japan Airlines Co., Ltd(iv) MITSUBISHI MOTORS CORPORATION(v) Sumitomo Forestry Co., Ltd.(vi) Tokyu Fudosan Holdings Corporation

40
Risk item Business impact
Tran
sitio
n ris
k
Increase/decrease inKey products and prices
• Changes in energy mix will impact the demand for key cargo transport (crude oil, petroleum products, petrochemicals, coal, LNG), leading to fluctuations in profit of ocean shipping business
• Transition to a low-carbon society will decrease the demand for coal and petroleum, which will reduce the cargo volume and profit in the ocean shipping business.
• However, the spread of CCS and CCU can revive the demand for coal transport, enabling the shipping business to maintain profit.• Spread of EVs and other next-generation vehicles will substantially change the ways of completed vehicle transport and supply
chains. This will reduce the vehicle transport volume and lower profit in the ocean shipping business.• Spread of renewable energy will increase the demand for hydrogen transport, which can help maintain profit in the ocean shipping
business.• Increased demand for onshore wind power generation will increase profit from development of onshore facilities (costs of
transport and installation), which will increase profit in the ocean shipping business.• Climate change will adversely impact cereal crop harvests, which will lower the demand for bulk cargo transport and reduce profit in the
ocean shipping business.
LargePromotion of next-generation vessels
• Shippers will expect environmental considerations in transport, calling on the ocean shipping business to shift to next-generation vessels. This will increase R&D costs, capital investments, and overall expenditures.
• Adaption of next-generation vessels will save fuel costs and payments of carbon tax, reducing overall expenditures.
National regulations on SOx/NOx
• The 2020 IMO fuel sulphur regulations will require the ocean shipping business to purchase appropriate fuel. This will increase operating costs and overall expenditures.
• Installation of SOx scrubber systems will increase capital costs and overall expenditures. Promotion of alternative fuels, though not directly related to climate change or global warming, can indirectly contribute to CO2 emissions reduction.
Energy-saving policy (EEDI/Energy efficiency laws)
• The EEDI for new ships will tighten the regulations (Phase 2 from 2020 and Phase 3 from 2025), which will inflate ship prices, and increase maintenance costs and overall expenditures.
Energy-saving subsidies
• Access to energy-saving subsidies will save capital investment, and reduce overall expenditures.• FIT and other policies to promote renewable energy will reduce the demand for crude oil, coal and LNG transport, the transport
volume, and income in the ocean shipping business.• An increase in the demand for biomass fuel transport will increase the transport volume and income in the ocean shipping business.
Trend in energy demand • Stricter regulations on the use of cleaner fuels or those with less environmental impact will increase the costs of technology development, capital, fuel and vessels (including crew training costs), and overall expenditures.
Carbon pricing • If market-based measures (MBMs) for GHG from ships are made obligatory by IMO, fuel will be charged, and ship operators will have to purchase emission rights for emissions exceeding their allocated volumes. This will increase overall expenditures.
Mediumto large
Oth
ers
Change in reputation among customers (shippers) and investors; melting of permafrost and glaciers; extremely abnormal weather; etc.
• General preference to transport means with environmental considerations will increase the demand for vessels.• Development of the North Sea Route will reduce traveling time, and the capital and travel costs. This will lead to more new contracts and
increase freight revenue.• Abnormal whether and typhoons require ship operators to change navigation routes to longer routes. This can damage reputation from
shippers.
Small tomedium
Climate-related Impact on Mitsui O.S.K. Lines4 52 3STEP
Adoption of carbon pricing and emission rights trading will increase vessel fuel costs and overall expenditures.In addition, investment in development of next-generation vessels will have considerable financial impacts.
41
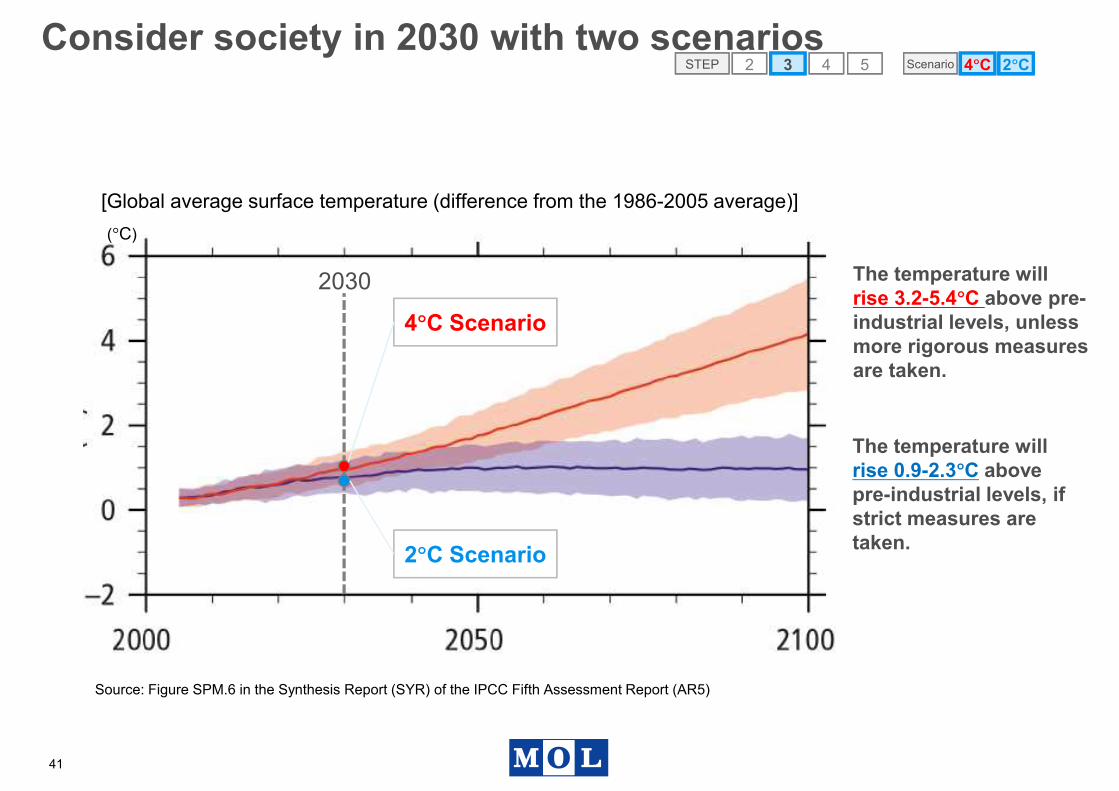
Consider society in 2030 with two scenarios
The temperature will rise 0.9-2.3 C above pre-industrial levels, if strict measures are taken.
Source: Figure SPM.6 in the Synthesis Report (SYR) of the IPCC Fifth Assessment Report (AR5)
The temperature will rise 3.2-5.4 C above pre-industrial levels, unless more rigorous measures are taken.
[Global average surface temperature (difference from the 1986-2005 average)]( C)
2030
4 C Scenario
2 C Scenario
2 C4 52 3 ScenarioSTEP 4 C

42
Assumptions in the Scenarios2 C4 52 3 ScenarioSTEP 4 C
Present2030
SourcesWorld in the 4 C scenario World in the 2 C scenario
Increase/ decrease in
Key products
and prices
Total traffic volume
66,000 G tonne-km/year(2015) 113,588 G tonne-km/year 101,178 G tonne-km/year • 2ii
(ACT, LCT scenarios)Coal traffic
volume7,300 G tonne-km/year
(2015) 7,665 G tonne-km/year 5,256 G tonne-km/year • IEA WEO2017/2ii(ACT, LCT scenarios)
Petroleum traffic volume
19,000 G tonne-km/year(2015) 25,039 G tonne-km/year 15,987 G tonne-km/year • IEA WEO2017/2ii
(ACT, LCT scenarios)Automobile
traffic volume36.2 million vehicles/year
(2017) 53.02 million vehicles/year 43.27 million vehicles/year • The Global Calculator V23(IEA 2DS/4DS scenarios)
Steel demand 1,670Mt(2014) 1,855Mt 1,855Mt • IEA ETP 2017
(RTS, 2 C scenario)
LNG demand 3,635bcm(2014) 4,269bcm 4,545bcm • IEA ETP 2017
(RTS, 2 C scenario)
Demand for offshore wind
power generation
350GW(2014) 1,255GW 1,840GW
• Agency for Natural Resources and Energy, Renewable Energy Institute, Japan Maritime Center, etc.
Spread of next-
generation vessels
Spread of next-generation fuels
FAME: 1,040USD/Mt, 38MJ/kgMDO: 482USD/Mt, 43MJ/kg (2016) n.a. n.a. • IEA Bioenergy report “Biofuels for
the marine shipping sector”
EEDI regulations Phase 1 = 10% Phase 3 = 30%(in and after 2025)
Phase 3 = 30%(in and after 2025) • IMO
RegulationsCO2 emissions of
global marine transport
810 million tonnes(Emissions from ships worldwide,
2010)
924 million tonnes(Emissions from ships
worldwide)
823 million tonnes(Emissions from ships
worldwide)
• 2ii(UMAS Scenarios 8, 10)
Carbon pricing
Carbon tax * Average bidding price: Approx. $8/t at the EU-ETS
Europe: $37/tChina: $23/t
Japan, North America, Europe: $100/t
China: $75/t
• IEA WEO 2016(450, NPS scenario)
• “Implementation and Considerations of Emissions Trading in Selected Countries”, a Ministry of Environment report, 2016
Fuel price Petroleum: $97/bbl Petroleum: $113/bbl Petroleum: $97/bbl • IEA ETP 2016/2ii
43
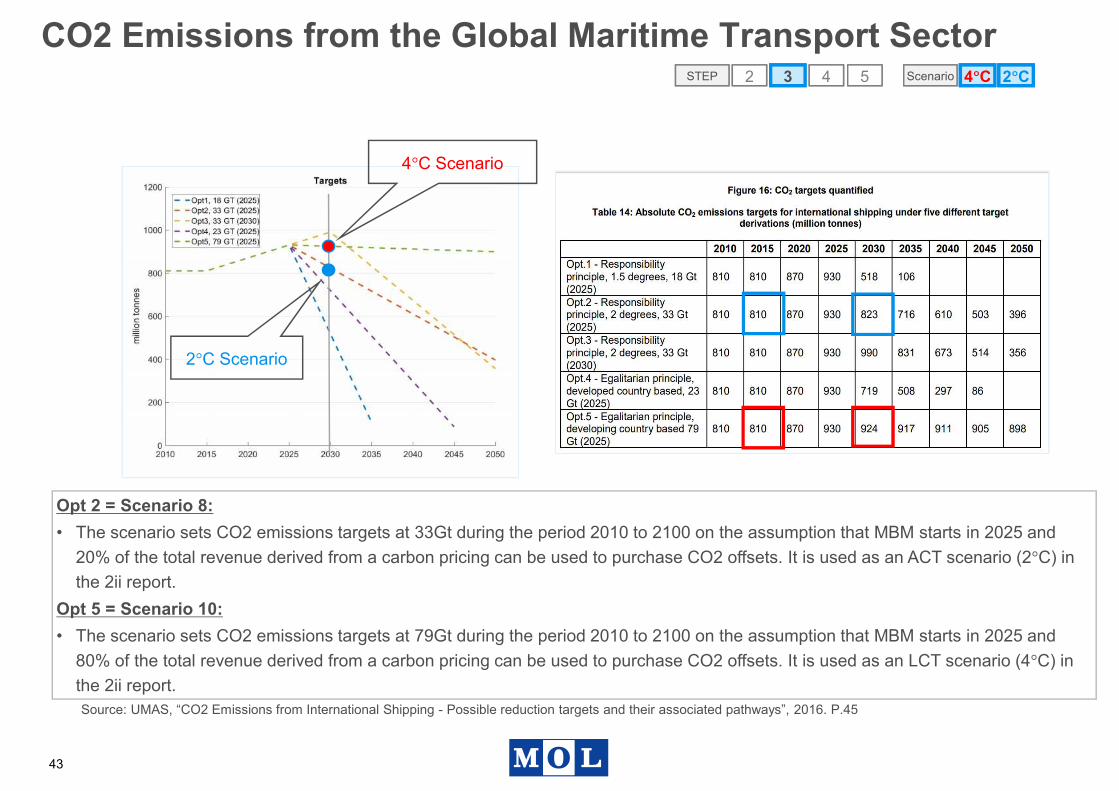
CO2 Emissions from the Global Maritime Transport Sector
Source: UMAS, “CO2 Emissions from International Shipping - Possible reduction targets and their associated pathways”, 2016. P.45
4 C Scenario
2 C Scenario
Opt 2 = Scenario 8:• The scenario sets CO2 emissions targets at 33Gt during the period 2010 to 2100 on the assumption that MBM starts in 2025 and
20% of the total revenue derived from a carbon pricing can be used to purchase CO2 offsets. It is used as an ACT scenario (2 C) in the 2ii report.
Opt 5 = Scenario 10:• The scenario sets CO2 emissions targets at 79Gt during the period 2010 to 2100 on the assumption that MBM starts in 2025 and
80% of the total revenue derived from a carbon pricing can be used to purchase CO2 offsets. It is used as an LCT scenario (4 C) in the 2ii report.
2 C4 52 3 ScenarioSTEP 4 C

44
World in the 4 C Scenario: More Natural Disasters and Inflated Fuel Costs 4 C 2 C4 52 3 ScenarioSTEP
CO2 SOx NOxx
CO2
CO2 Government
FCVEV
Biofuel
Higher port chargesdue to a rise in sea levels
Increased demand forbiofuel as an alternative
Fossil fuel
...
Regulations in line with rules of the international
community
No change in EEDI or other regulations or policies.
Regulations will not work properly even after MBM starts.
Increased demand foroffshore wind power
generation
Development of icebreakers eyeing to the North Sea Route
Increased demand for EVs, increasing the
cargo volume
Inflated fossil fuel prices,increasing the cargo
volume
Storms and cyclones will force ship operators to change navigation routes. This will increase the capital and fuel
costs, cause delays in delivery, and pose adverse impacts on ferry terminals.
IMO
45
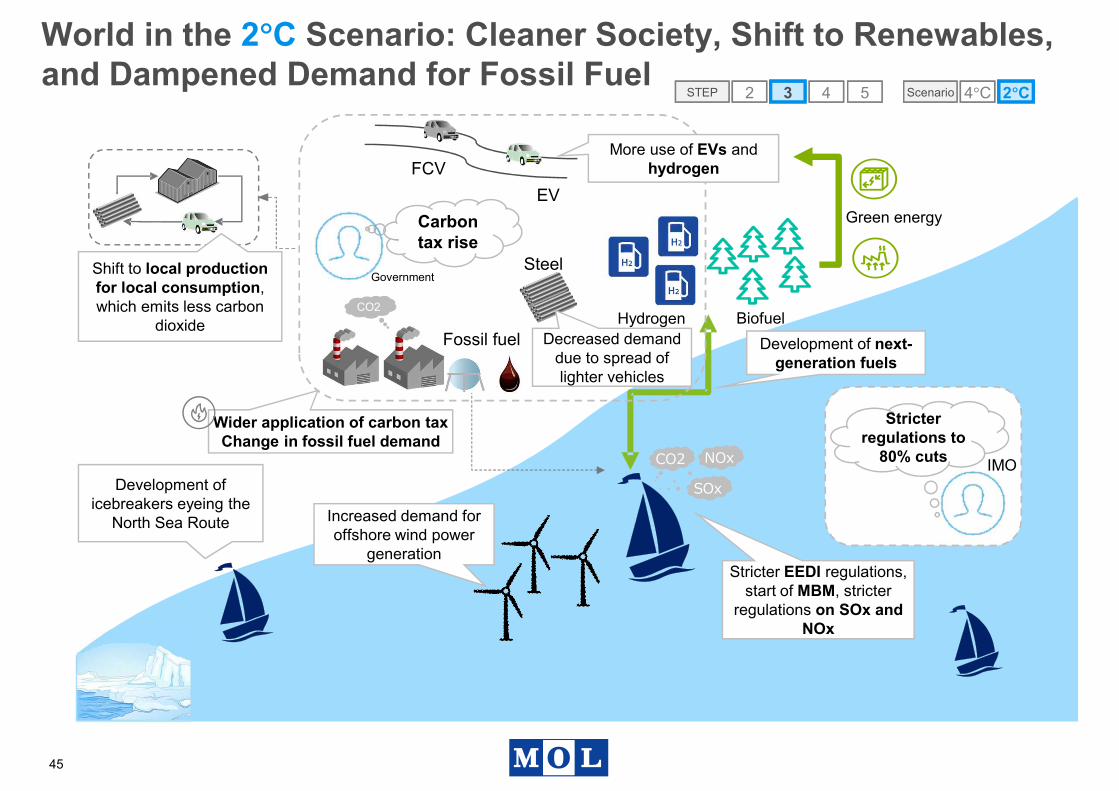
World in the 2 C Scenario: Cleaner Society, Shift to Renewables, and Dampened Demand for Fossil Fuel
4 C 2 C4 52 3 ScenarioSTEP
More use of EVs and hydrogen
Carbon tax rise
EVFCV
Government
BiofuelHydrogenCO2
Fossil fuel
Steel
Decreased demand due to spread of lighter vehicles
Wider application of carbon taxChange in fossil fuel demand
Shift to local production for local consumption, which emits less carbon
dioxide
Development of icebreakers eyeing the
North Sea Route Increased demand foroffshore wind power
generation
Green energy
IMO
Stricter regulations to
80% cuts
Stricter EEDI regulations, start of MBM, stricter
regulations on SOx and NOx
Development of next-generation fuels
CO2 NOx
SOx
World in the 2030s in the 4 C scenario
46
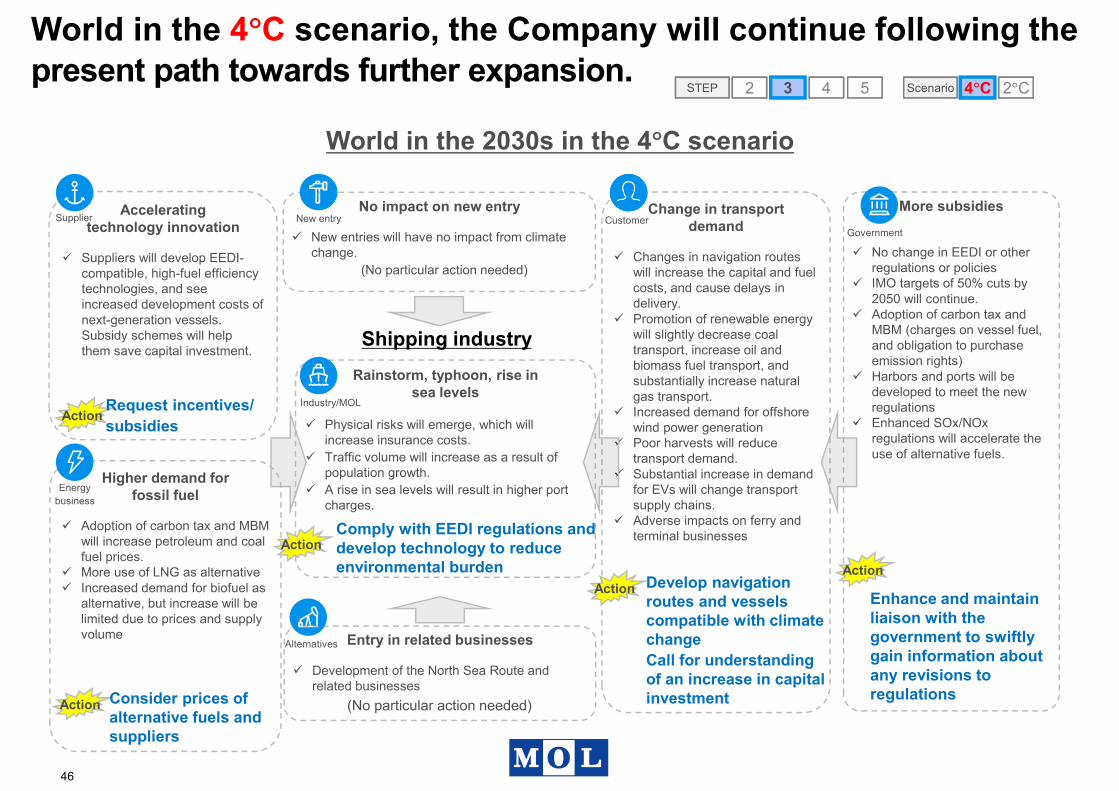
World in the 4 C scenario, the Company will continue following the present path towards further expansion.
Accelerating technology innovation
Suppliers will develop EEDI-compatible, high-fuel efficiency technologies, and see increased development costs of next-generation vessels. Subsidy schemes will help them save capital investment.
Shipping industry
ActionRequest incentives/subsidies
Supplier
Higher demand for fossil fuel
Adoption of carbon tax and MBM will increase petroleum and coal fuel prices.More use of LNG as alternativeIncreased demand for biofuel as alternative, but increase will be limited due to prices and supply volume
Action Consider prices of alternative fuels and suppliers
Energybusiness
No impact on new entry
New entries will have no impact from climate change.
New entry
(No particular action needed)
Rainstorm, typhoon, rise in sea levels
Physical risks will emerge, which will increase insurance costs.Traffic volume will increase as a result of population growth.A rise in sea levels will result in higher port charges.
Action
Industry/MOL
Comply with EEDI regulations and develop technology to reduce environmental burden
Entry in related businesses
Development of the North Sea Route and related businesses
(No particular action needed)
Change in transport demand
Changes in navigation routes will increase the capital and fuel costs, and cause delays in delivery.Promotion of renewable energy will slightly decrease coal transport, increase oil and biomass fuel transport, and substantially increase natural gas transport.Increased demand for offshore wind power generationPoor harvests will reduce transport demand.Substantial increase in demand for EVs will change transport supply chains.Adverse impacts on ferry and terminal businesses
Customer
Action Develop navigation routes and vessels compatible with climate changeCall for understanding of an increase in capital investment
More subsidies
No change in EEDI or other regulations or policiesIMO targets of 50% cuts by 2050 will continue.Adoption of carbon tax and MBM (charges on vessel fuel, and obligation to purchase emission rights)Harbors and ports will be developed to meet the new regulationsEnhanced SOx/NOx regulations will accelerate the use of alternative fuels.
Action
Government
Enhance and maintain liaison with the government to swiftly gain information about any revisions to regulations
4 C 2 CScenario4 52 3STEP
Alternatives
World in the 2030s in the 2 C scenario
47
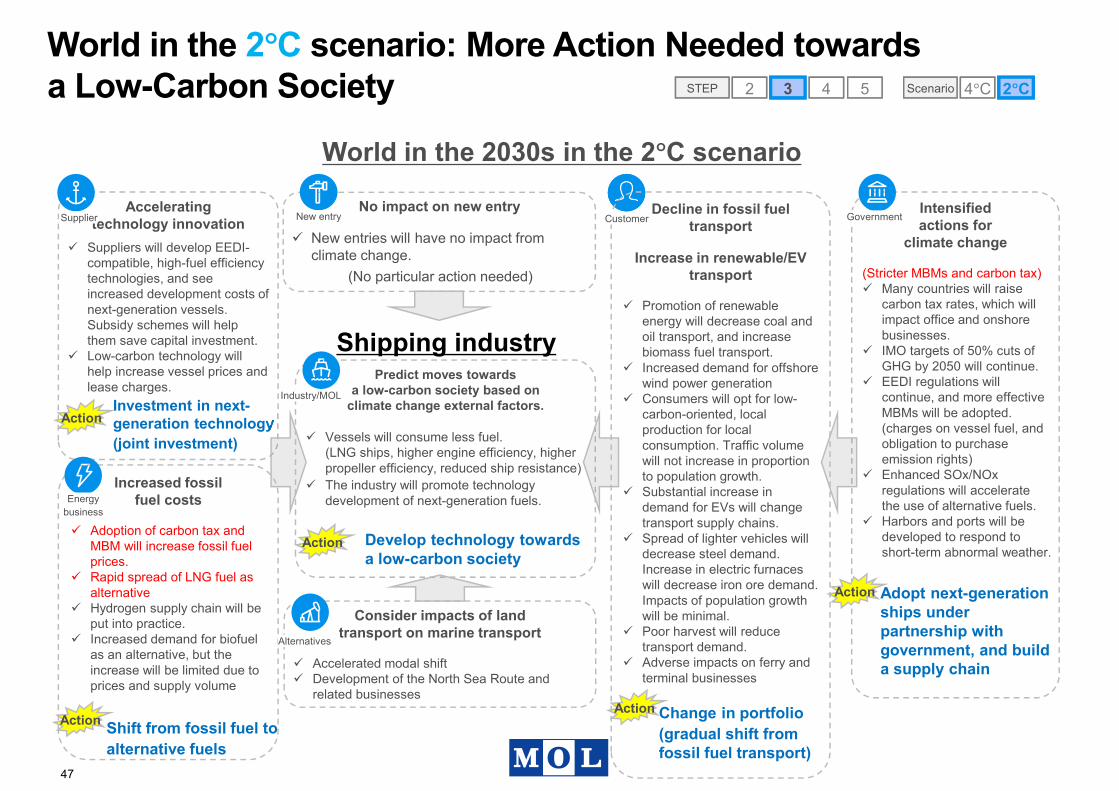
World in the 2 C scenario: More Action Needed towards a Low-Carbon Society
Accelerating technology innovation
Suppliers will develop EEDI-compatible, high-fuel efficiency technologies, and see increased development costs of next-generation vessels. Subsidy schemes will help them save capital investment.Low-carbon technology will help increase vessel prices and lease charges.
Shipping industry
ActionInvestment in next-generation technology(joint investment)
Increased fossil fuel costs
Adoption of carbon tax and MBM will increase fossil fuel prices.Rapid spread of LNG fuel as alternativeHydrogen supply chain will be put into practice.Increased demand for biofuel as an alternative, but the increase will be limited due to prices and supply volume
Action Shift from fossil fuel toalternative fuels
No impact on new entry
New entries will have no impact from climate change.
(No particular action needed)
Predict moves towards a low-carbon society based on
climate change external factors.
Vessels will consume less fuel.(LNG ships, higher engine efficiency, higher propeller efficiency, reduced ship resistance)The industry will promote technology development of next-generation fuels.
Action Develop technology towards a low-carbon society
Consider impacts of land transport on marine transport
Accelerated modal shiftDevelopment of the North Sea Route and related businesses
Action
Intensified actions for
climate change
(Stricter MBMs and carbon tax)Many countries will raise carbon tax rates, which will impact office and onshore businesses.IMO targets of 50% cuts of GHG by 2050 will continue.EEDI regulations will continue, and more effective MBMs will be adopted. (charges on vessel fuel, and obligation to purchase emission rights)Enhanced SOx/NOx regulations will accelerate the use of alternative fuels.Harbors and ports will be developed to respond to short-term abnormal weather.
Action Adopt next-generation ships under partnership with government, and build a supply chain
4 52 3STEP 4 C 2 CScenario
Change in portfolio(gradual shift from fossil fuel transport)
Decline in fossil fuel transport
Increase in renewable/EV transport
Promotion of renewable energy will decrease coal and oil transport, and increase biomass fuel transport.Increased demand for offshore wind power generationConsumers will opt for low-carbon-oriented, local production for local consumption. Traffic volume will not increase in proportion to population growth.Substantial increase in demand for EVs will change transport supply chains.Spread of lighter vehicles will decrease steel demand. Increase in electric furnaces will decrease iron ore demand. Impacts of population growth will be minimal.Poor harvest will reduce transport demand.Adverse impacts on ferry and terminal businesses
Energybusiness
Alternatives
Supplier New entry Customer Government
Industry/MOL

48
World in the 4 C scenario, population growth and other factors will increase traffic volume. The Company will use high-efficiency and LNG vessels to deal with inflated fuel costs. 4 C 2 CScenario4 52 3STEP
Risk item Financial impactindicator Summary of impact Background of the impact
Magnitude of impact
(¥100 million)
Tran
sitio
nris
ks
Increase/ decrease in key
cargoes
Coal traffic volume Sales (profit of ocean shipping business)
Increase in traffic volume will increase profit (freight revenue) of ocean shipping business.
The continued upward trend of coal demand, and population growth and vital economy will boost coal demand further.
Petroleum traffic volume
Sales (profit of ocean shipping business)
Increase in traffic volume will increase profit (freight revenue) of ocean shipping business.
The continued upward trend of petroleum demand, and population growth and vital economy will boost coal demand further.
Automobile traffic volume
Sales (profit of ocean shipping business)
Increase in traffic volume will increase profit (freight revenue) of ocean shipping business.
Consumers will not have enough incentives to purchase next-generation vehicles because of unsolved infrastructure problems, poor availability of related products, and high prices. So, the vehicle market will remain focused on vehicles with an internal combustion engine (ICE).
Steel traffic volume Sales (profit of ocean shipping business)
Increase in traffic volume will increase profit (freight revenue) of ocean shipping business.
Currently, steel is used the most for construction and automobiles. It is hardly possible to consider any alternative to steel for construction, so impacts of transition risks will be minimal. (Increase in climate disasters will result in an increase in demand for stronger and more durable materials.)
LNG traffic volume Sales (profit of ocean shipping business)
Increase in traffic volume will increase profit (freight revenue) of ocean shipping business.
The continued upward trend of LNG demand, and population growth and vital economy will boost LNG demand further.
Traffic volume related to offshore wind power
generation
Sales (cost of ocean shipping business)
Increase in related projects will increase cost (freight revenue) of ocean shipping business.
Further spread of renewable energy and particularly an increase in demand for offshore wind power generation using Japan’s outstanding technology will increase revenues from facility construction (transport and installation costs).
Transport of otherproducts
Sales (profit of ocean shipping business)
Increase in traffic volume will increase profit (freight revenue) of ocean shipping business.
The continued upward trend of demand, and population growth and vital economy will boost demand further.
Energy-saving policy/ regulations
/ carbon pricing
MBM/emission rights trading
Expenditures (cost of ocean shipping business) Emission trading will increase expenditures. Emission trading will be adopted to achieve the CO2 reduction target by 2050, but the trading
volume will be limited. New technologies will be put in place to achieve the goal.
Inflated fuel prices Expenditures (cost of ocean shipping business)
Adoption of carbon pricing will inflate fuel prices, which will increase cost (fuel costs) of ocean shipping business.
Carbon pricing will slightly increase. This will be passed on to fuel prices in advanced countries, causing financial impacts.
Trend inenergy demand Inflated fuel prices Expenditures (cost of
ocean shipping business)
Rise in fuel prices due to supply-demand balance will increase costs (fuel costs) of ocean shipping business.
Considerable rise in fossil fuel costs will have great financial impacts.
Energy-saving policy/ regulations
/carbon pricing
EEDI and otherregulations
Expenditures (cost of ocean shipping business)
Adoption of high-efficiency vessels will reduce cost (fuel costs) of ocean shipping business.
Low-carbon transport modes will be required. Fuel efficiency of vessels will be improved, reducing operation costs.
Expenditures (cost of ocean shipping business)
Regulations will increase new shipbuilding costs.
To develop low-carbon transport modes, shipbuilders will seek high-efficiency vessels and install high-efficiency facilities in existing vessels. This will increase shipbuilding and repair costs.
Spread of next-generation
vessels
Adoption of LNG-fueled vessels
Expenditures (cost of ocean shipping business)
Adoption of LNG-fueled vessels will impact cost (fuel costs) of ocean shipping business.
Adoption of LNG-fueled vessels will reduce vessel fuel costs and costs equivalent to carbon pricing.
Expenditures (cost of ocean shipping business)
Adoption of LNG-fueled vessels will increase new shipbuilding costs.
Adoption of LNG-fueled vessels will require additional investment as the difference from conventional vessels, having great financial impacts.
Spread of next-generation
fuels (biofuels, etc.)
Expenditures (cost of ocean shipping business)
Spread of biofuels will increase cost (fuel costs) of ocean shipping business.
Biofuels will become common and more easily available. Businesses will consider adopting such fuels toward a low-carbon society.
49
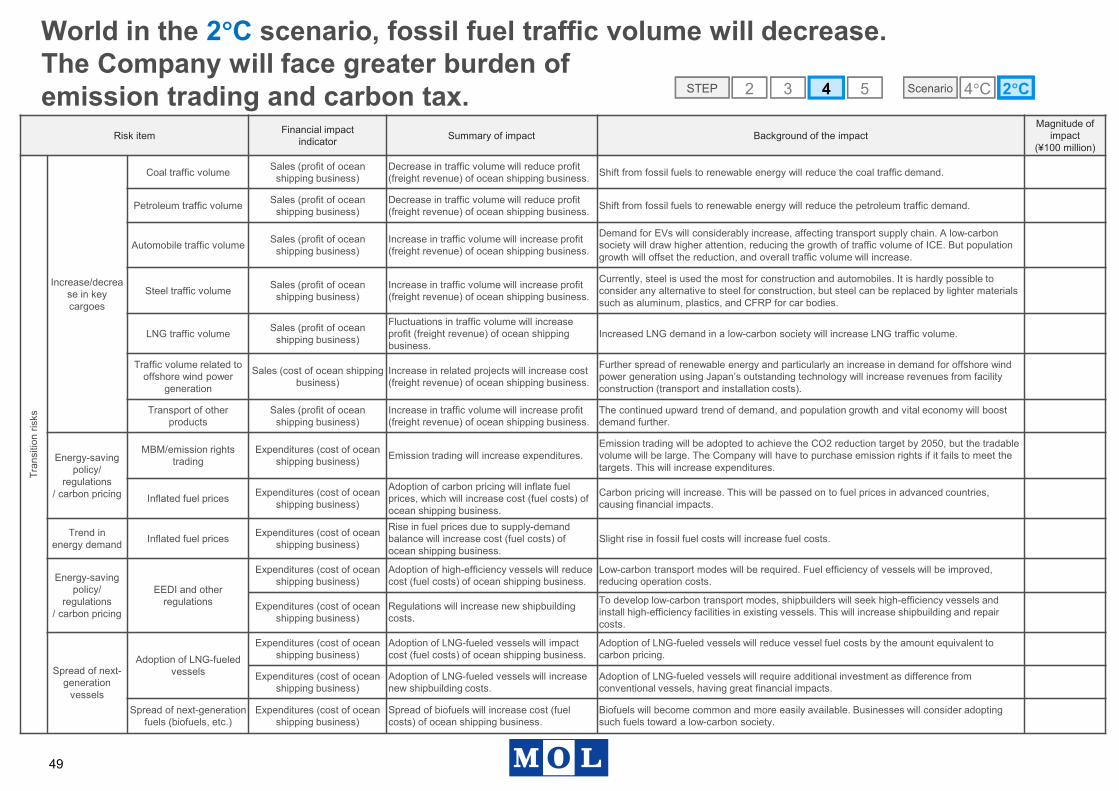
World in the 2 C scenario, fossil fuel traffic volume will decrease. The Company will face greater burden of emission trading and carbon tax. 4 52 3STEP 4 C 2 CScenario
Risk item Financial impactindicator Summary of impact Background of the impact
Magnitude of impact
(¥100 million)
Tran
sitio
nris
ks
Increase/decrease in key cargoes
Coal traffic volume Sales (profit of ocean shipping business)
Decrease in traffic volume will reduce profit (freight revenue) of ocean shipping business. Shift from fossil fuels to renewable energy will reduce the coal traffic demand.
Petroleum traffic volume Sales (profit of ocean shipping business)
Decrease in traffic volume will reduce profit (freight revenue) of ocean shipping business. Shift from fossil fuels to renewable energy will reduce the petroleum traffic demand.
Automobile traffic volume Sales (profit of ocean shipping business)
Increase in traffic volume will increase profit (freight revenue) of ocean shipping business.
Demand for EVs will considerably increase, affecting transport supply chain. A low-carbon society will draw higher attention, reducing the growth of traffic volume of ICE. But population growth will offset the reduction, and overall traffic volume will increase.
Steel traffic volume Sales (profit of ocean shipping business)
Increase in traffic volume will increase profit (freight revenue) of ocean shipping business.
Currently, steel is used the most for construction and automobiles. It is hardly possible to consider any alternative to steel for construction, but steel can be replaced by lighter materials such as aluminum, plastics, and CFRP for car bodies.
LNG traffic volume Sales (profit of ocean shipping business)
Fluctuations in traffic volume will increase profit (freight revenue) of ocean shipping business.
Increased LNG demand in a low-carbon society will increase LNG traffic volume.
Traffic volume related to offshore wind power
generation
Sales (cost of ocean shipping business)
Increase in related projects will increase cost (freight revenue) of ocean shipping business.
Further spread of renewable energy and particularly an increase in demand for offshore wind power generation using Japan’s outstanding technology will increase revenues from facility construction (transport and installation costs).
Transport of other products
Sales (profit of ocean shipping business)
Increase in traffic volume will increase profit (freight revenue) of ocean shipping business.
The continued upward trend of demand, and population growth and vital economy will boost demand further.
Energy-saving policy/
regulations/ carbon pricing
MBM/emission rights trading
Expenditures (cost of ocean shipping business) Emission trading will increase expenditures.
Emission trading will be adopted to achieve the CO2 reduction target by 2050, but the tradable volume will be large. The Company will have to purchase emission rights if it fails to meet the targets. This will increase expenditures.
Inflated fuel prices Expenditures (cost of ocean shipping business)
Adoption of carbon pricing will inflate fuel prices, which will increase cost (fuel costs) of ocean shipping business.
Carbon pricing will increase. This will be passed on to fuel prices in advanced countries, causing financial impacts.
Trend inenergy demand Inflated fuel prices Expenditures (cost of ocean
shipping business)
Rise in fuel prices due to supply-demand balance will increase cost (fuel costs) of ocean shipping business.
Slight rise in fossil fuel costs will increase fuel costs.
Energy-saving policy/
regulations/ carbon pricing
EEDI and otherregulations
Expenditures (cost of ocean shipping business)
Adoption of high-efficiency vessels will reduce cost (fuel costs) of ocean shipping business.
Low-carbon transport modes will be required. Fuel efficiency of vessels will be improved, reducing operation costs.
Expenditures (cost of ocean shipping business)
Regulations will increase new shipbuilding costs.
To develop low-carbon transport modes, shipbuilders will seek high-efficiency vessels and install high-efficiency facilities in existing vessels. This will increase shipbuilding and repair costs.
Spread of next-generation
vessels
Adoption of LNG-fueled vessels
Expenditures (cost of ocean shipping business)
Adoption of LNG-fueled vessels will impact cost (fuel costs) of ocean shipping business.
Adoption of LNG-fueled vessels will reduce vessel fuel costs by the amount equivalent to carbon pricing.
Expenditures (cost of ocean shipping business)
Adoption of LNG-fueled vessels will increase new shipbuilding costs.
Adoption of LNG-fueled vessels will require additional investment as difference from conventional vessels, having great financial impacts.
Spread of next-generationfuels (biofuels, etc.)
Expenditures (cost of ocean shipping business)
Spread of biofuels will increase cost (fuel costs) of ocean shipping business.
Biofuels will become common and more easily available. Businesses will consider adopting such fuels toward a low-carbon society.

50
2. Scenario Analysis - Practice Examples(i) ITOCHU Corporation(ii) Mitsui O.S.K. Lines, Ltd.(iii) Japan Airlines Co., Ltd(iv) MITSUBISHI MOTORS CORPORATION(v) Sumitomo Forestry Co., Ltd.(vi) Tokyu Fudosan Holdings Corporation
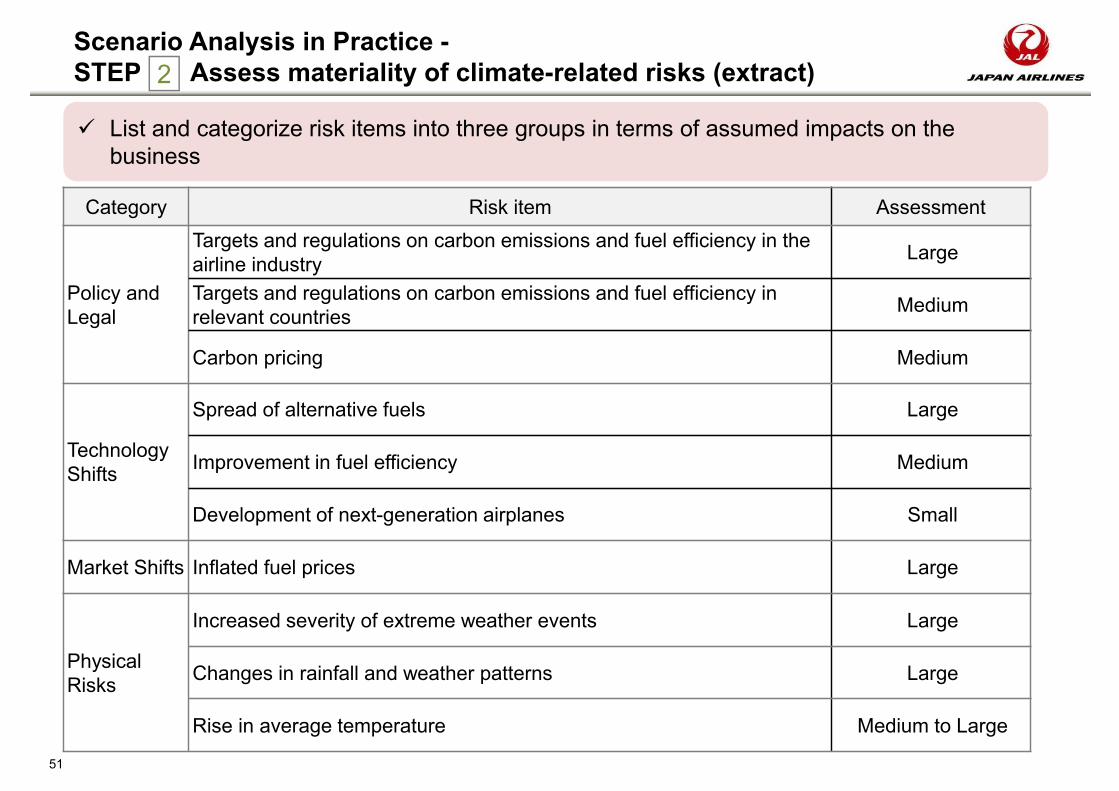
Scenario Analysis in Practice -STEP Assess materiality of climate-related risks (extract)2
List and categorize risk items into three groups in terms of assumed impacts on the business
Category Risk item Assessment
Policy and Legal
Targets and regulations on carbon emissions and fuel efficiency in the airline industry Large
Targets and regulations on carbon emissions and fuel efficiency in relevant countries Medium
Carbon pricing Medium
Technology Shifts
Spread of alternative fuels Large
Improvement in fuel efficiency Medium
Development of next-generation airplanes Small
Market Shifts Inflated fuel prices Large
Physical Risks
Increased severity of extreme weather events Large
Changes in rainfall and weather patterns Large
Rise in average temperature Medium to Large
51
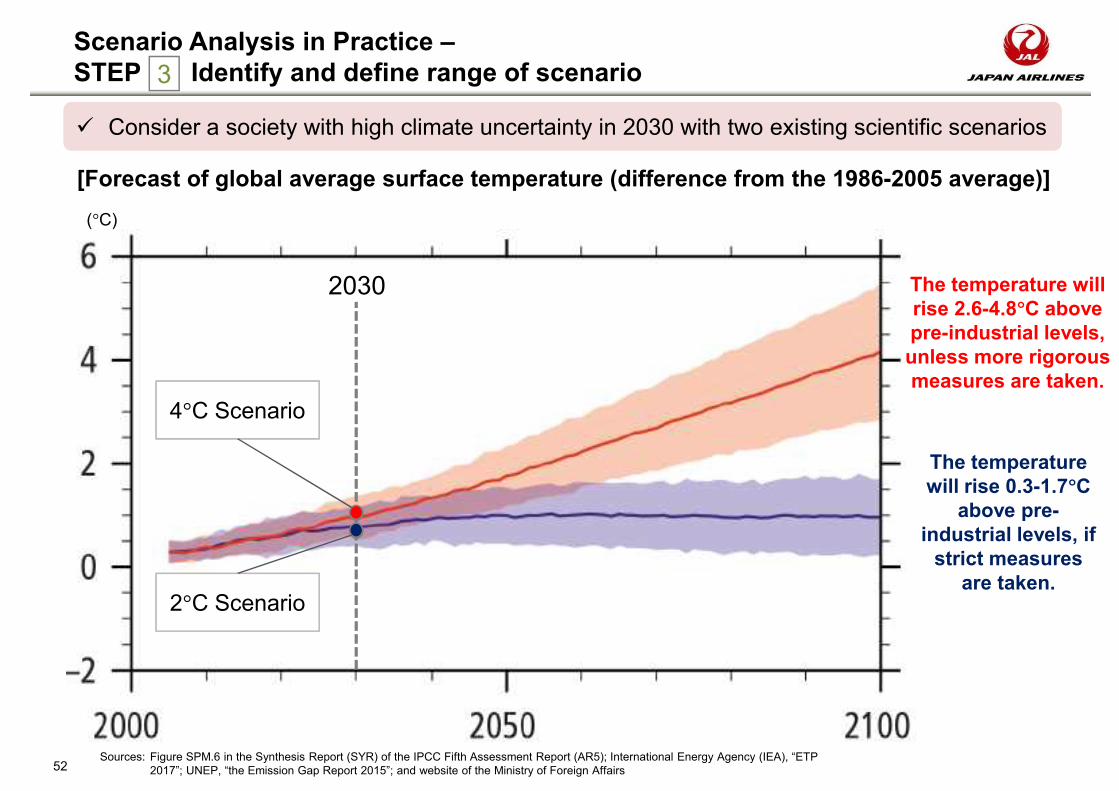
Scenario Analysis in Practice –STEP Identify and define range of scenario
Consider a society with high climate uncertainty in 2030 with two existing scientific scenarios
( C)
2030
Sources: Figure SPM.6 in the Synthesis Report (SYR) of the IPCC Fifth Assessment Report (AR5); International Energy Agency (IEA), “ETP 2017”; UNEP, “the Emission Gap Report 2015”; and website of the Ministry of Foreign Affairs
[Forecast of global average surface temperature (difference from the 1986-2005 average)]
4 C Scenario
2 C Scenario
The temperature will rise 0.3-1.7 C
above pre-industrial levels, if
strict measures are taken.
The temperature will rise 2.6-4.8 C above pre-industrial levels, unless more rigorous measures are taken.
52
3
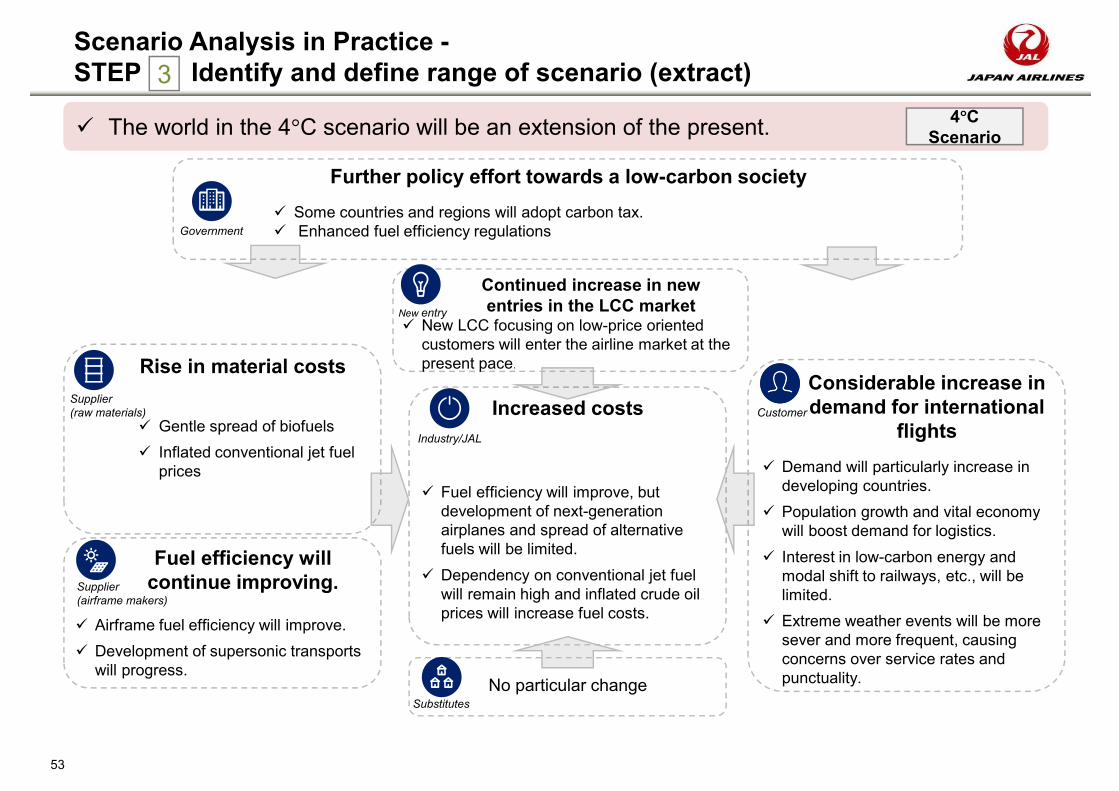
Scenario Analysis in Practice -STEP Identify and define range of scenario (extract)
The world in the 4 C scenario will be an extension of the present.
No particular change
Fuel efficiency will continue improving.
Airframe fuel efficiency will improve.Development of supersonic transports will progress.
Increased costs
Fuel efficiency will improve, but development of next-generation airplanes and spread of alternative fuels will be limited.Dependency on conventional jet fuel will remain high and inflated crude oil prices will increase fuel costs.
Rise in material costs
Gentle spread of biofuelsInflated conventional jet fuel prices
Continued increase in new entries in the LCC market
New LCC focusing on low-price oriented customers will enter the airline market at the present pace.
Considerable increase in demand for international
flightsDemand will particularly increase in developing countries.Population growth and vital economy will boost demand for logistics.Interest in low-carbon energy and modal shift to railways, etc., will be limited.Extreme weather events will be more sever and more frequent, causing concerns over service rates and punctuality.
New entry
Further policy effort towards a low-carbon societySome countries and regions will adopt carbon tax.Enhanced fuel efficiency regulations
Industry/JAL
Substitutes
Customer
Supplier (airframe makers)
Supplier (raw materials)
Government
53
4 CScenario
3

Scenario Analysis in Practice –STEP Identify and define range of scenario
In the 2 C Scenario, alternative fuels will become more available, and modal shifts will take place. Therefore, the Company may have to revise its supply chain and business model.
Modal shift to railways and vessels
Fuel efficiency will continue improving.
Development of next-generation airplanes will progress.Demand for higher fuel-efficiency, next-generation airplanes will increase.
More efforts towards a low-carbon society
Enhanced regulations will raise carbon pricing.
More airline companies will use biojet fuel.
Fluctuations in material costs
Use of biojet fuel will vary among regions, which can raise differences in costs among regions
Carriers with electric airplanes will enter the airline market.
Increase in demand for international flights
Demand will particularly increase in developing countries.Interest in the environment will heighten, and some customers may shift transport modes to railways, vessels, and other modes with lower environmental burdens.
New entry
Considerable policy effort towards a low-carbon societyMore countries and regions will adopt carbon tax towards a carbon-free/low-carbon society.Enhanced fuel efficiency regulationsMore countries and regions will promote development and spread of alternative fuels towards a carbon-free/low-carbon society.
Industry/JAL
Substitutes
Customer
Supplier (airframe makers)
Supplier (raw materials)
Government
54
2 C Scenario
3
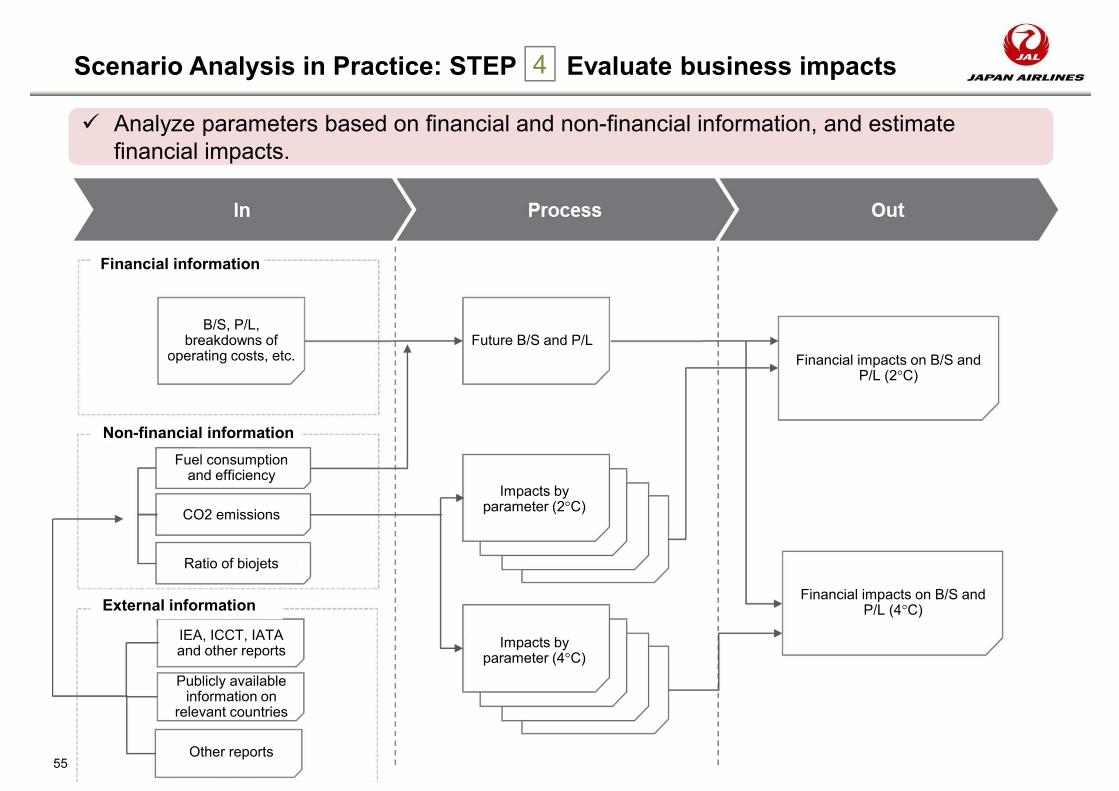
Scenario Analysis in Practice: STEP Evaluate business impacts
Analyze parameters based on financial and non-financial information, and estimate financial impacts.
55
Financial information
B/S, P/L, breakdowns of
operating costs, etc.
Non-financial informationFuel consumption
and efficiency
CO2 emissions
Ratio of biojets
External information
IEA, ICCT, IATA and other reports
Publicly available information on
relevant countries
Other reports
Future B/S and P/L
Impacts by parameter (2 C)
Impacts by parameter (4 C)
Financial impacts on B/S and P/L (2 C)
Financial impacts on B/S and P/L (4 C)
4

56
2. Scenario Analysis - Practice Examples(i) ITOCHU Corporation(ii) Mitsui O.S.K. Lines, Ltd.(iii) Japan Airlines Co., Ltd(iv) MITSUBISHI MOTORS CORPORATION(v) Sumitomo Forestry Co., Ltd.(vi) Tokyu Fudosan Holdings Corporation
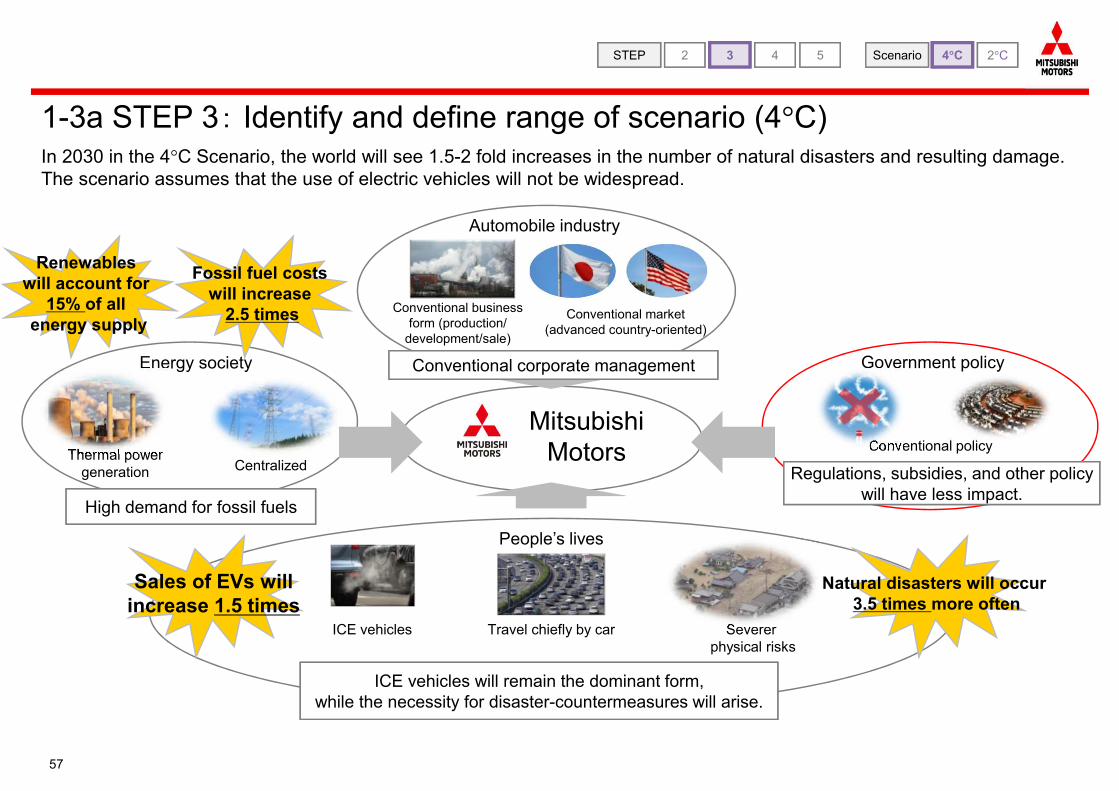
57
1-3a STEP 3: Identify and define range of scenario (4 C)In 2030 in the 4 C Scenario, the world will see 1.5-2 fold increases in the number of natural disasters and resulting damage.The scenario assumes that the use of electric vehicles will not be widespread.
4 C 2 C4 52 3 ScenarioSTEP
People’s lives
Energy society Government policy
High demand for fossil fuels
ICE vehicles will remain the dominant form,while the necessity for disaster-countermeasures will arise.
Regulations, subsidies, and other policywill have less impact.
Severer physical risks
Travel chiefly by carICE vehicles
Thermal power generation Centralized
Conventional policy
Conventional business form (production/
development/sale)
Conventional market(advanced country-oriented)
Automobile industry
MitsubishiMotors
Natural disasters will occur 3.5 times more often
Sales of EVs willincrease 1.5 times
Fossil fuel costs will increase
2.5 times
Renewables will account for
15% of all energy supply
Conventional corporate management
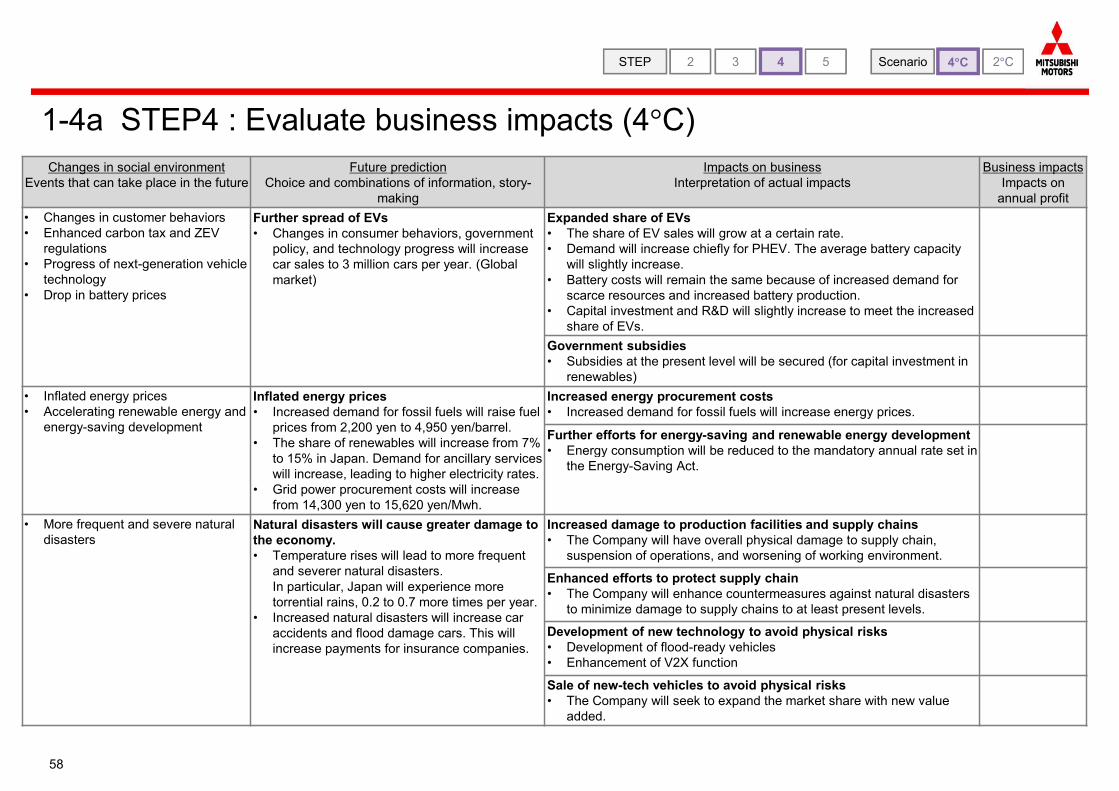
58
1-4a STEP4 : Evaluate business impacts (4 C)Changes in social environment
Events that can take place in the futureFuture prediction
Choice and combinations of information, story-making
Impacts on businessInterpretation of actual impacts
Business impactsImpacts on
annual profit• Changes in customer behaviors• Enhanced carbon tax and ZEV
regulations• Progress of next-generation vehicle
technology• Drop in battery prices
Further spread of EVs• Changes in consumer behaviors, government
policy, and technology progress will increase car sales to 3 million cars per year. (Global market)
Expanded share of EVs• The share of EV sales will grow at a certain rate.• Demand will increase chiefly for PHEV. The average battery capacity
will slightly increase.• Battery costs will remain the same because of increased demand for
scarce resources and increased battery production.• Capital investment and R&D will slightly increase to meet the increased
share of EVs.Government subsidies• Subsidies at the present level will be secured (for capital investment in
renewables)• Inflated energy prices• Accelerating renewable energy and
energy-saving development
Inflated energy prices• Increased demand for fossil fuels will raise fuel
prices from 2,200 yen to 4,950 yen/barrel.• The share of renewables will increase from 7%
to 15% in Japan. Demand for ancillary services will increase, leading to higher electricity rates.
• Grid power procurement costs will increase from 14,300 yen to 15,620 yen/Mwh.
Increased energy procurement costs• Increased demand for fossil fuels will increase energy prices.
Further efforts for energy-saving and renewable energy development• Energy consumption will be reduced to the mandatory annual rate set in
the Energy-Saving Act.
• More frequent and severe natural disasters
Natural disasters will cause greater damage to the economy.• Temperature rises will lead to more frequent
and severer natural disasters.In particular, Japan will experience more torrential rains, 0.2 to 0.7 more times per year.
• Increased natural disasters will increase car accidents and flood damage cars. This will increase payments for insurance companies.
Increased damage to production facilities and supply chains• The Company will have overall physical damage to supply chain,
suspension of operations, and worsening of working environment.
Enhanced efforts to protect supply chain• The Company will enhance countermeasures against natural disasters
to minimize damage to supply chains to at least present levels.
Development of new technology to avoid physical risks• Development of flood-ready vehicles• Enhancement of V2X function
Sale of new-tech vehicles to avoid physical risks• The Company will seek to expand the market share with new value
added.
4 C 2 C4 52 3 ScenarioSTEP

59
(Reference) Examples of Actual Physical Risks (Business Impacts)Mazda warns of 28 billion yen loss from Japan floodsProduction disrupted for months in areas hit by rain
Mazda Motor expects a roughly 28 billion yen ($248 million) hit to operating profit due to production cuts at the main factory (Hiroshima pref.) and the Hofu plants (Yamaguchi pref.) from the torrential rains that flooded western Japan in July, the company said. They operated at reduced capacity in August and September, as paralyzed transportation networks hampered workers’ commutes. …For the year ending March, many factors squeezed earnings, such as the higher costs of materials such as steel and precious metals, as well as spending to bolster the automaker’s sales network in the U.S. and comply with tougher environmental regulations. This leaves the company with little room to absorb the losses from the rains from the reduced production of 28 billion yen.
(Nikkei Shimbun, September 21, 2018)
Mitsubishi Motors CEO Says West Japan Torrential Rains Reduce Production of More than 10,000 Cars
Mitsubishi Motors Co. published consolidated financial results on November 6th. Net profit increased 7% year-on-year to 51.8 billion yen due to strong sales of sports utility vehicles (SUVs) and minivans in emerging economies including Indonesia, Thailand and China. A series of natural disasters including the West Japan Torrential Rains, and typhoons Nos. 21 and 24 caused the company to reduce production worth 4 billion yen. The Company, however, achieved profit growth.
At a press conference for the first half of fiscal 2018, held on November 6th, the Chief Executive Officer said: “The West Japan Torrential Rains caused tremendous damage to Okayama prefecture, where our Mizushima Plant is located, and the production declines totaled more than 10,000 vehicles.” “Thanks to the efforts of our suppliers and many business partners, however, we managed to minimize the impact on production and shipping”, he added.(Nikkei Shimbun, November 6, 2018)
(Mitsubishi Motors Reports First-Half Financial Results for FY2018, November 6, 2018)
Vehicle Insurance Claims Exceed 20,000 - Nearly 70% in Heavy Rain-hit Okayama and Hiroshima, a GIAJ report reveals
The General Insurance Association of Japan (GIAJ headed by Keiji Nishizawa) compiled the number of car accident claims related to the torrential rains in west Japan. A total of 48,303 insurance claims including vehicles (including commercial vehicles), fire, and new types (including accident insurance) insurance claims were brought to member insurance companies by July 17. Car insurance claims totaled 23,644. Member companies set up emergency headquarters at their head offices or local branches in the afflicted prefectures, and started to inspect and collect flood-damaged cars under insurance coverage...(Daily Automobile (Nikkan Jidosha Shimbun), July 23, 2018)
Impacts of West Japan Torrential Rains and Typhoons
(100 million yen)Impact of West Japan Torrential
Rains
Impacts of Typhoons Nos. 21
and 24
Operating profit
Non-operating and extraordinary
losses
Total
* Impacts in the 1st half of FY2018

60
People’s lives
Energy society Government policy
High demand for fossil fuels
Further electrification and modal shift will increase demand for EVs.
regulations.
Stricter policy to a carbon-free society will result in higher
carbon tax and stricter regulations.
Electrification
Renewables Decentralized
Efforts towards a carbon-free society (energy-
saving facilities/ business transfer)
Conventional market(advanced country-
oriented)
Automobile industry
MitsubishiMotors
Natural disasters will slightly increase
Sales of EVs willincrease 10 times
Fossil fuel costs willincrease 1.5 times
Renewables will account
for 22% of all energy supply Conventional corporate management
1-3b STEP3:Identify and define range of scenarios (2 C)In 2030 in the 2 C Scenario, the number of natural disasters and damage will remain almost present levels.The scenario assumes that the use of renewables, energy-saving technology, and electric vehicles will steadily progress, (and that, as a result, the 2 C target will be achieved.)
4 C 2 C4 52 3 ScenarioSTEP
CO2 emissionsfrom factories willbe cut 2% per year
Local production will increase
Carbon tax11,000 yen/t-CO2
ZEV regulations will come to
effect worldwide
Modal shift/MaaS
Maas market will expand 16 times
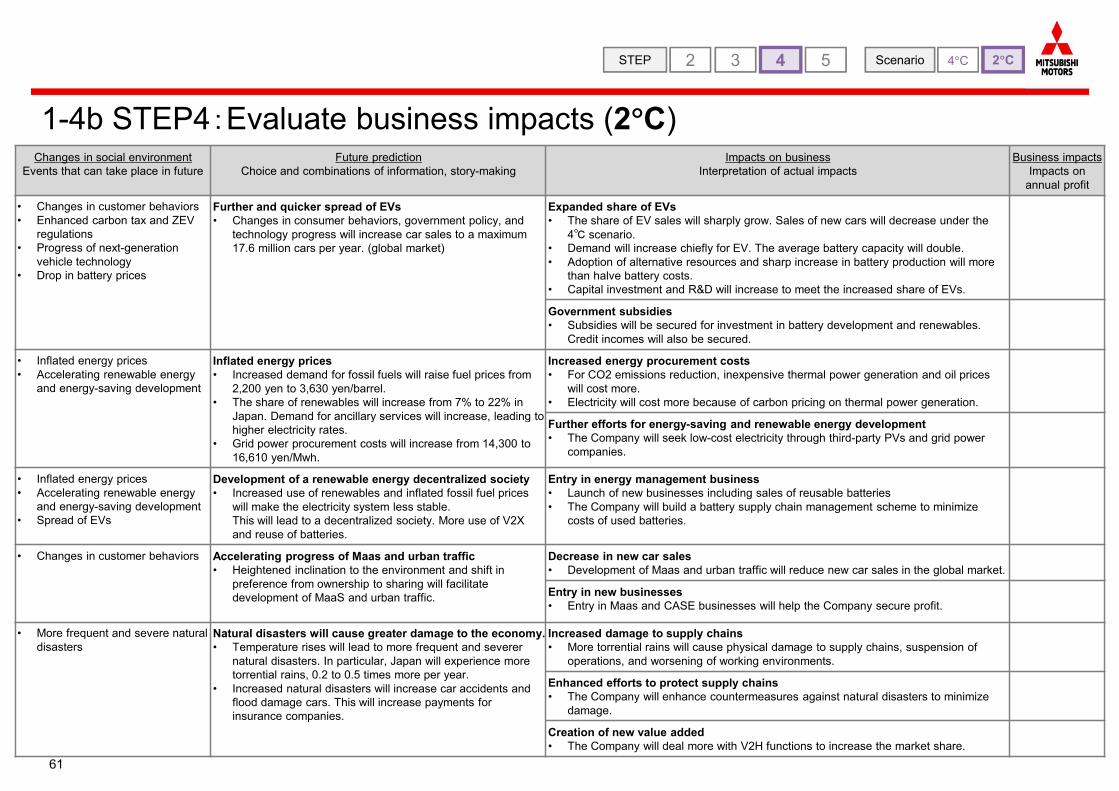
61
1-4b STEP4:Evaluate business impacts (2 C)
4 52 3 ScenarioSTEP
Changes in social environmentEvents that can take place in future
Future predictionChoice and combinations of information, story-making
Impacts on businessInterpretation of actual impacts
Business impactsImpacts on
annual profit
• Changes in customer behaviors• Enhanced carbon tax and ZEV
regulations• Progress of next-generation
vehicle technology• Drop in battery prices
Further and quicker spread of EVs• Changes in consumer behaviors, government policy, and
technology progress will increase car sales to a maximum 17.6 million cars per year. (global market)
Expanded share of EVs• The share of EV sales will sharply grow. Sales of new cars will decrease under the
4℃ scenario.• Demand will increase chiefly for EV. The average battery capacity will double.• Adoption of alternative resources and sharp increase in battery production will more
than halve battery costs.• Capital investment and R&D will increase to meet the increased share of EVs.
Government subsidies• Subsidies will be secured for investment in battery development and renewables.
Credit incomes will also be secured.
• Inflated energy prices• Accelerating renewable energy
and energy-saving development
Inflated energy prices• Increased demand for fossil fuels will raise fuel prices from
2,200 yen to 3,630 yen/barrel.• The share of renewables will increase from 7% to 22% in
Japan. Demand for ancillary services will increase, leading to higher electricity rates.
• Grid power procurement costs will increase from 14,300 to 16,610 yen/Mwh.
Increased energy procurement costs• For CO2 emissions reduction, inexpensive thermal power generation and oil prices
will cost more.• Electricity will cost more because of carbon pricing on thermal power generation.
Further efforts for energy-saving and renewable energy development• The Company will seek low-cost electricity through third-party PVs and grid power
companies.
• Inflated energy prices• Accelerating renewable energy
and energy-saving development• Spread of EVs
Development of a renewable energy decentralized society• Increased use of renewables and inflated fossil fuel prices
will make the electricity system less stable.This will lead to a decentralized society. More use of V2X and reuse of batteries.
Entry in energy management business• Launch of new businesses including sales of reusable batteries• The Company will build a battery supply chain management scheme to minimize
costs of used batteries.
• Changes in customer behaviors Accelerating progress of Maas and urban traffic• Heightened inclination to the environment and shift in
preference from ownership to sharing will facilitate development of MaaS and urban traffic.
Decrease in new car sales• Development of Maas and urban traffic will reduce new car sales in the global market.
Entry in new businesses• Entry in Maas and CASE businesses will help the Company secure profit.
• More frequent and severe natural disasters
Natural disasters will cause greater damage to the economy.• Temperature rises will lead to more frequent and severer
natural disasters. In particular, Japan will experience more torrential rains, 0.2 to 0.5 times more per year.
• Increased natural disasters will increase car accidents and flood damage cars. This will increase payments for insurance companies.
Increased damage to supply chains• More torrential rains will cause physical damage to supply chains, suspension of
operations, and worsening of working environments.
Enhanced efforts to protect supply chains• The Company will enhance countermeasures against natural disasters to minimize
damage.
Creation of new value added• The Company will deal more with V2H functions to increase the market share.
4 C 2 C
62
2. Scenario Analysis - Practice Examples(i) ITOCHU Corporation(ii) Mitsui O.S.K. Lines, Ltd.(iii) Japan Airlines Co., Ltd(iv) MITSUBISHI MOTORS CORPORATION(v) Sumitomo Forestry Co., Ltd.(vi) Tokyu Fudosan Holdings Corporation
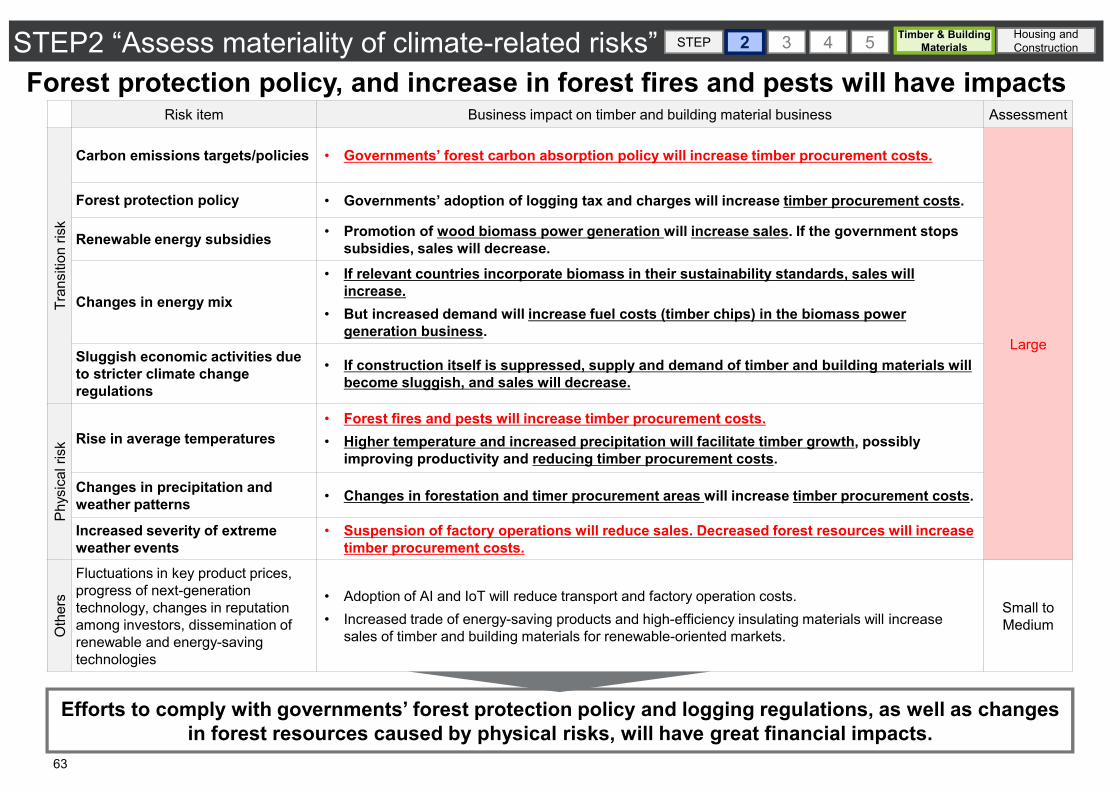
63
Risk item Business impact on timber and building material business Assessment
Tran
sitio
n ris
k
Carbon emissions targets/policies • Governments’ forest carbon absorption policy will increase timber procurement costs.
Large
Forest protection policy • Governments’ adoption of logging tax and charges will increase timber procurement costs.
Renewable energy subsidies • Promotion of wood biomass power generation will increase sales. If the government stops subsidies, sales will decrease.
Changes in energy mix
• If relevant countries incorporate biomass in their sustainability standards, sales will increase.
• But increased demand will increase fuel costs (timber chips) in the biomass powergeneration business.
Sluggish economic activities due to stricter climate changeregulations
• If construction itself is suppressed, supply and demand of timber and building materials will become sluggish, and sales will decrease.
Phys
ical
risk
Rise in average temperatures• Forest fires and pests will increase timber procurement costs.• Higher temperature and increased precipitation will facilitate timber growth, possibly
improving productivity and reducing timber procurement costs.
Changes in precipitation and weather patterns • Changes in forestation and timer procurement areas will increase timber procurement costs.
Increased severity of extreme weather events
• Suspension of factory operations will reduce sales. Decreased forest resources will increase timber procurement costs.
Oth
ers
Fluctuations in key product prices, progress of next-generation technology, changes in reputation among investors, dissemination of renewable and energy-saving technologies
• Adoption of AI and IoT will reduce transport and factory operation costs.• Increased trade of energy-saving products and high-efficiency insulating materials will increase
sales of timber and building materials for renewable-oriented markets.
Small to Medium
Efforts to comply with governments’ forest protection policy and logging regulations, as well as changes in forest resources caused by physical risks, will have great financial impacts.
Forest protection policy, and increase in forest fires and pests will have impactsSTEP2 “Assess materiality of climate-related risks” 4 52 3STEP Timber & Building
MaterialsTimber & Building
MaterialsHousing and ConstructionHousing and Construction
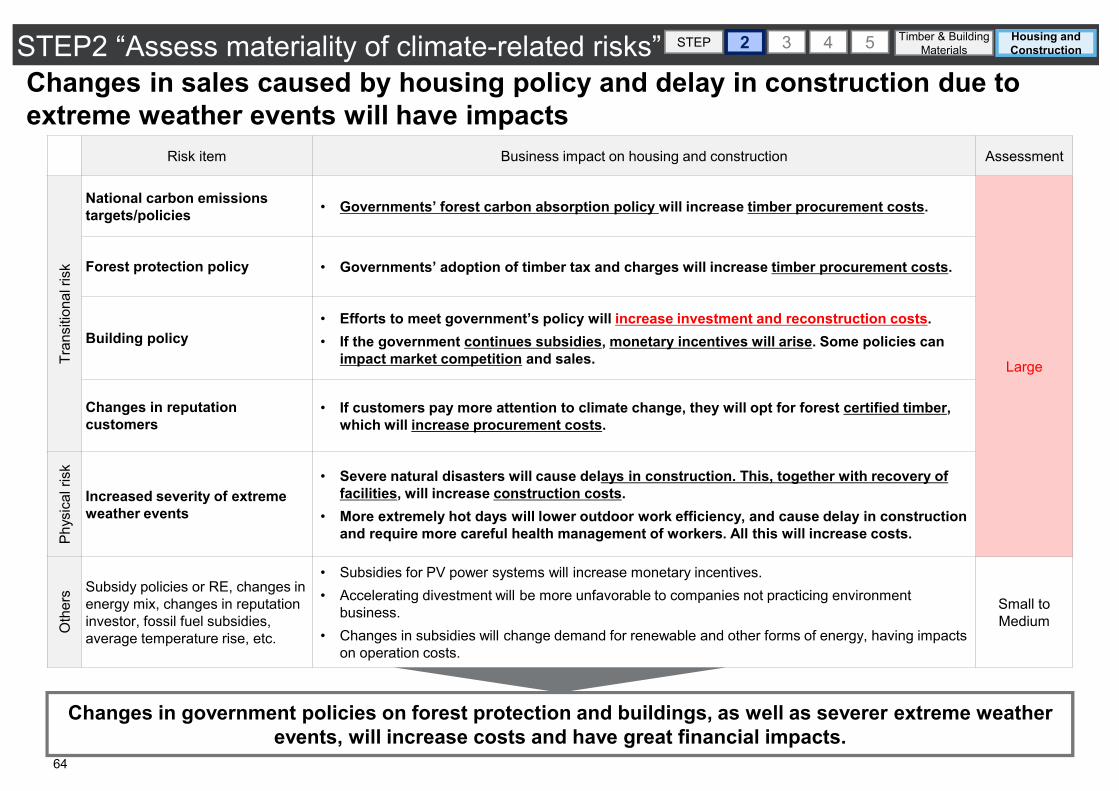
64
Risk item Business impact on housing and construction Assessment
Tran
sitio
nal r
isk
National carbon emissions targets/policies • Governments’ forest carbon absorption policy will increase timber procurement costs.
Large
Forest protection policy • Governments’ adoption of timber tax and charges will increase timber procurement costs.
Building policy• Efforts to meet government’s policy will increase investment and reconstruction costs.• If the government continues subsidies, monetary incentives will arise. Some policies can
impact market competition and sales.
Changes in reputation customers
• If customers pay more attention to climate change, they will opt for forest certified timber, which will increase procurement costs.
Phys
ical
risk
Increased severity of extreme weather events
• Severe natural disasters will cause delays in construction. This, together with recovery of facilities, will increase construction costs.
• More extremely hot days will lower outdoor work efficiency, and cause delay in construction and require more careful health management of workers. All this will increase costs.
Oth
ers Subsidy policies or RE, changes in
energy mix, changes in reputation investor, fossil fuel subsidies,average temperature rise, etc.
• Subsidies for PV power systems will increase monetary incentives.• Accelerating divestment will be more unfavorable to companies not practicing environment
business.• Changes in subsidies will change demand for renewable and other forms of energy, having impacts
on operation costs.
Small to Medium
Changes in government policies on forest protection and buildings, as well as severer extreme weather events, will increase costs and have great financial impacts.
Changes in sales caused by housing policy and delay in construction due to extreme weather events will have impacts
STEP2 “Assess materiality of climate-related risks” 4 52 3STEP Timber & Building Materials
Timber & Building Materials
Housing and ConstructionHousing and Construction
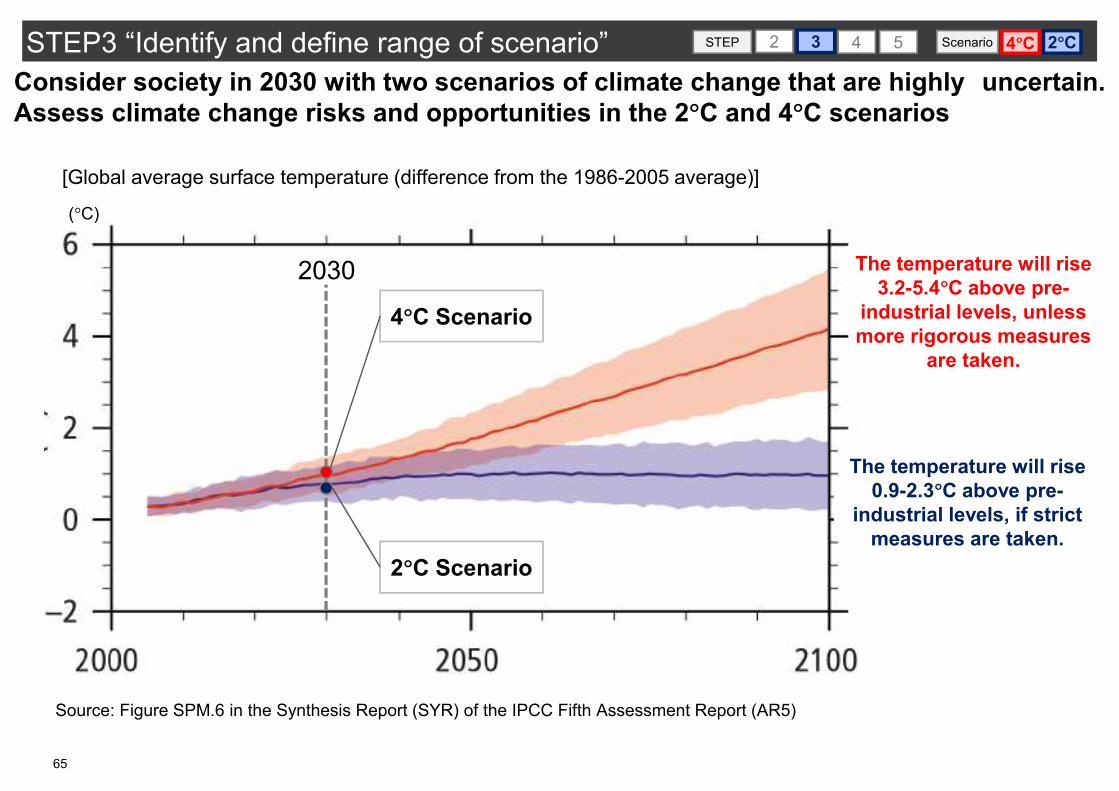
65
Source: Figure SPM.6 in the Synthesis Report (SYR) of the IPCC Fifth Assessment Report (AR5)
[Global average surface temperature (difference from the 1986-2005 average)]
( C)
2030
4 C Scenario
2 C Scenario
Consider society in 2030 with two scenarios of climate change that are highly uncertain. Assess climate change risks and opportunities in the 2 C and 4 C scenarios
STEP3 “Identify and define range of scenario” 4 C 2 C4 5 ScenarioSTEP 2 3
The temperature will rise 0.9-2.3 C above pre-
industrial levels, if strict measures are taken.
The temperature will rise 3.2-5.4 C above pre-
industrial levels, unless more rigorous measures
are taken.

Further action in light of global warming impacts
Preparation for possible changes in forestation areas and materials (with an eye to the latter half of the 21st century)Governments’ deforestation prevention regulations and policy will change supply change, and raise forest management and logging costs.
66
Increased forest fires and pests will
increase costs.
(region: xxx)Increased fires and pests will raise timber prices.
(region: xxx)Flooding and soil drainage will reduce timber supply and raise timber prices. There will be risk of suspension of factory operations.
Action
Secure suppliers with an eye to changes
in forestation areas
Prepare disaster prevention measures for forest fire and
flooding (Collaboration with
suppliers)
No new entry
Action
Industry/Sumitomo Forestry
Develop tougher productsReview supply chain
Accelerating shift to alternative materials
Timber will be replaced by metals for building structures (as a result of increased demand for heavy duty materials)
Alternatives
Changes in material needs in response to
extreme weather eventsFrequent extreme weather events will increase demand for heavy duty building materials.Changes in forestation areas and materials will require the Company to reconsider suppliers and business partners.
ActionUnderstand buyers’ needs, and procure materials and develop
products to meet the needs
Regulations remaining at the
present level
(region: xxx)Government introduce forest protection regulations and policy to achieve NDC target. They may stipulate stricter regulations
(region: xxx)No regulations on forest absorption in relation to NDC. The government will maintain the present level of operators’ obligations to return emission rights when logging under the emissions trading scheme.
ActionGather up-to-date information about
government regulationsSecure transparency of
supply chains
Action Change business portfolio
(No particular action needed)
Intensified consumer
boycottNGOs will label logging as unhealthy acts, pushing anti-logging protests and consumer boycotts
Other stakeholders
ActionPromote dialogue with
NGOs and otherenvironmental groups
Participate in initiatives
Timber & building material industry
In the 4 C scenario, increased forest fires and pests by global warming change supply chains
STEP3 “Identify and define range of scenario” 4 C 2 CScenario4 52 3STEP
CustomerGovernment
Supplier New entry
World in the 2030s in the 4 C scenario (example)
Timber & Building Materials
Timber & Building Materials
Housing and ConstructionHousing and Construction

Preparation for possible changes in forestation areas and materialsSecuring of suppliers with an eye to stricter regulations and inflated pricesReduction in new housing starts due to ageing society with lower birth rate
67
Stricter regulations will increase
timber material costs.Increased forest fires
and pests willincrease costs
OverallStricter regulations will lead to higher logging tax rates and reduced material productions. This will increase sales costs and procurement costs.
(region: xxx)Forestation areas will shift slightly to north, increased forest fires and pests will raise timber prices.
Timber & building material industry
ActionSecure suppliers with an eye
to higher logging tax ratesPrepare measures for
disaster prevention arising from forest fires
Increased demand from biomass power generation
New entries supplying biomass materials and power generation
ActionDevelop a network contributing to transport
cost reductionsand suitable for the local production for
local consumption model
More use of carbon-free materials (including wood)
Use of waste materials and new materials (bioplastics, CNF, etc.) in preparation for reduced supply
Higher environment consciousness
More use of biomassChanges in supply volume will encourage development of materials and new approaches.Increased demand for biomass fuel
ActionIncrease the share and
secure domestic materialsSupply materials to biomass
power generationPromote forest certification
and forestation
Much stricter government regulations
OverallStricter regulations on natural forest loggingSpread of the idea of “Net Zero Deforestation”
(Region: xxx)The government will set stricter forest protection regulations and policy against logging with the target deforestation rate under 350h/year.
Action Gather up-to-date information about
government regulationsSecure transparency of
supply chain
Action Develop new materials and approaches
Changes in investment and
financingInvestors and financial institutions will change their stance in accordance with the quality of forest management (reforestation, etc.).
Action Promote forest certificates and plantation forests
World in the 2030s in the 2 C scenario (example)
Action Promptly secure promising regions (resilient regions, etc.)
In the 2 C scenario, stricter forest regulations and increased forest fires will have impacts
STEP3 “Identify and define range of scenario”
Industry/Sumitomo Forestry
Alternatives
Customer Government
Otherstakeholders
Supplier New entry
4 C 2 CScenario4 52 3STEP Timber & Building Materials
Timber & Building Materials
Housing and ConstructionHousing and Construction
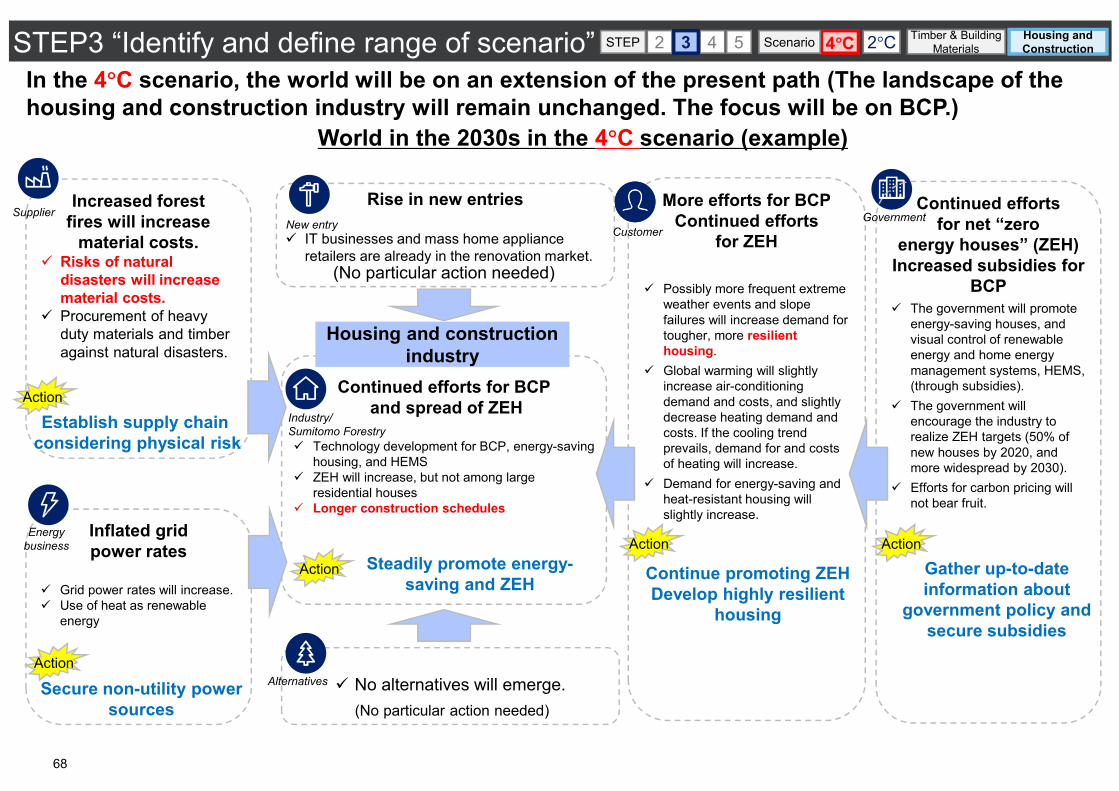
World in the 2030s in the 4 C scenario (example)
68
Increased forest fires will increase
material costs.Risks of natural disasters will increase material costs.Procurement of heavy duty materials and timber against natural disasters.
Action
Establish supply chainconsidering physical risk
Supplier
Inflated grid power rates
Grid power rates will increase.Use of heat as renewable energy
Action
Secure non-utility power sources
Energybusiness
Rise in new entries
IT businesses and mass home appliance retailers are already in the renovation market.
New entry
(No particular action needed)
Continued efforts for BCPand spread of ZEH
Technology development for BCP, energy-saving housing, and HEMSZEH will increase, but not among large residential housesLonger construction schedules
Action
Industry/Sumitomo Forestry
Steadily promote energy-saving and ZEH
No alternatives will emerge.Alternatives
(No particular action needed)
More efforts for BCPContinued efforts
for ZEH
Possibly more frequent extreme weather events and slope failures will increase demand for tougher, more resilient housing.Global warming will slightly increase air-conditioning demand and costs, and slightly decrease heating demand and costs. If the cooling trend prevails, demand for and costs of heating will increase.Demand for energy-saving and heat-resistant housing will slightly increase.
Customer
Action
Continue promoting ZEHDevelop highly resilient
housing
Continued efforts for net “zero
energy houses” (ZEH)Increased subsidies for
BCPThe government will promote energy-saving houses, and visual control of renewable energy and home energy management systems, HEMS, (through subsidies).The government will encourage the industry to realize ZEH targets (50% of new houses by 2020, and more widespread by 2030).Efforts for carbon pricing will not bear fruit.
Action
Government
Gather up-to-date information about
government policy and secure subsidies
In the 4 C scenario, the world will be on an extension of the present path (The landscape of the housing and construction industry will remain unchanged. The focus will be on BCP.)
STEP3 “Identify and define range of scenario”
Housing and construction industry
4 C 2 CScenario4 52 3STEP Timber & Building Materials
Timber & Building Materials
Housing and ConstructionHousing and Construction
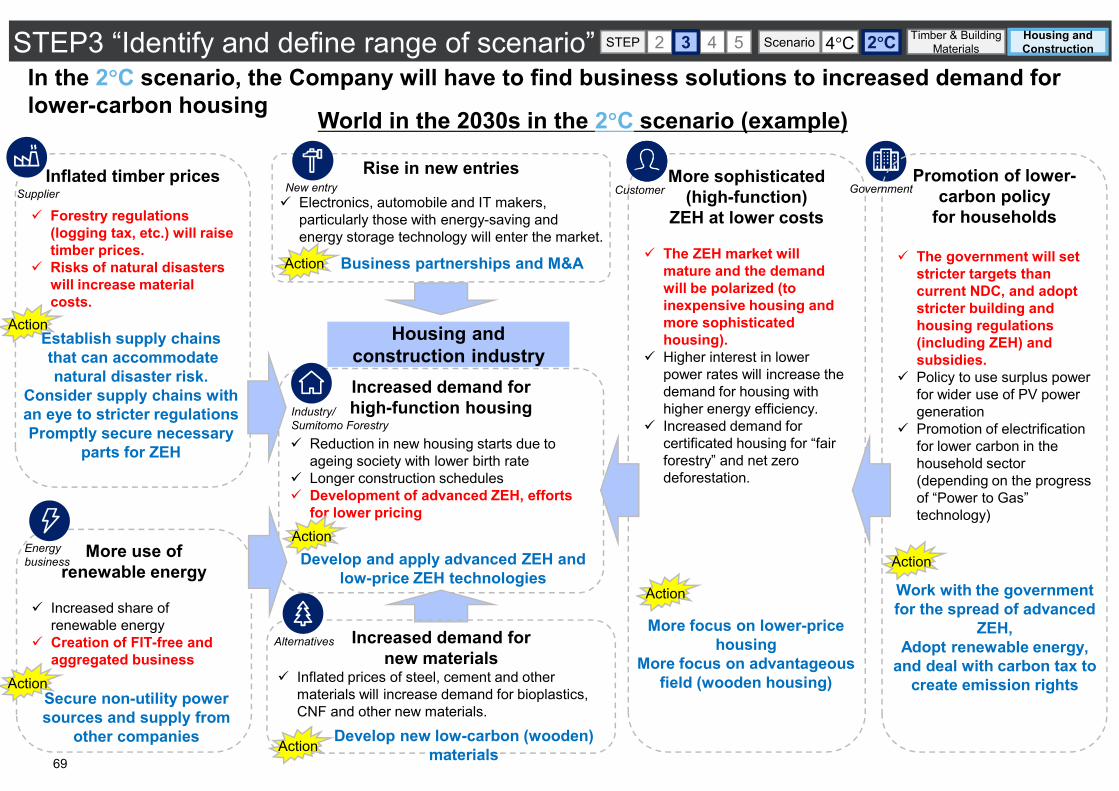
Housing and construction industry
STEP3 “Identify and define range of scenario”
69
Inflated timber prices
Forestry regulations (logging tax, etc.) will raise timber prices.Risks of natural disasters will increase material costs.
ActionEstablish supply chainsthat can accommodate natural disaster risk.
Consider supply chains with an eye to stricter regulationsPromptly secure necessary
parts for ZEH
Supplier
More use of renewable energy
Increased share of renewable energyCreation of FIT-free and aggregated business
ActionSecure non-utility power sources and supply from
other companies
Energybusiness
Rise in new entries
Electronics, automobile and IT makers, particularly those with energy-saving and energy storage technology will enter the market.
Increased demand for high-function housing
Reduction in new housing starts due to ageing society with lower birth rateLonger construction schedulesDevelopment of advanced ZEH, efforts for lower pricing
Action
Industry/ Sumitomo Forestry
Develop and apply advanced ZEH and low-price ZEH technologies
Increased demand for new materials
Inflated prices of steel, cement and other materials will increase demand for bioplastics, CNF and other new materials.
Alternatives
More sophisticated (high-function)
ZEH at lower costs
The ZEH market will mature and the demand will be polarized (to inexpensive housing and more sophisticated housing).Higher interest in lower power rates will increase the demand for housing with higher energy efficiency.Increased demand for certificated housing for “fair forestry” and net zero deforestation.
Customer
Action
More focus on lower-price housing
More focus on advantageous field (wooden housing)
Promotion of lower-carbon policy
for households
The government will set stricter targets than current NDC, and adopt stricter building and housing regulations (including ZEH) and subsidies.Policy to use surplus power for wider use of PV power generationPromotion of electrification for lower carbon in the household sector (depending on the progress of “Power to Gas” technology)
Action
Government
Work with the government for the spread of advanced
ZEH,Adopt renewable energy,
and deal with carbon tax to create emission rights
ActionDevelop new low-carbon (wooden)
materials
Action Business partnerships and M&A
New entry
World in the 2030s in the 2 C scenario (example)
In the 2 C scenario, the Company will have to find business solutions to increased demand for lower-carbon housing
4 C 2 CScenario4 52 3STEP Timber & Building Materials
Timber & Building Materials
Housing and ConstructionHousing and Construction
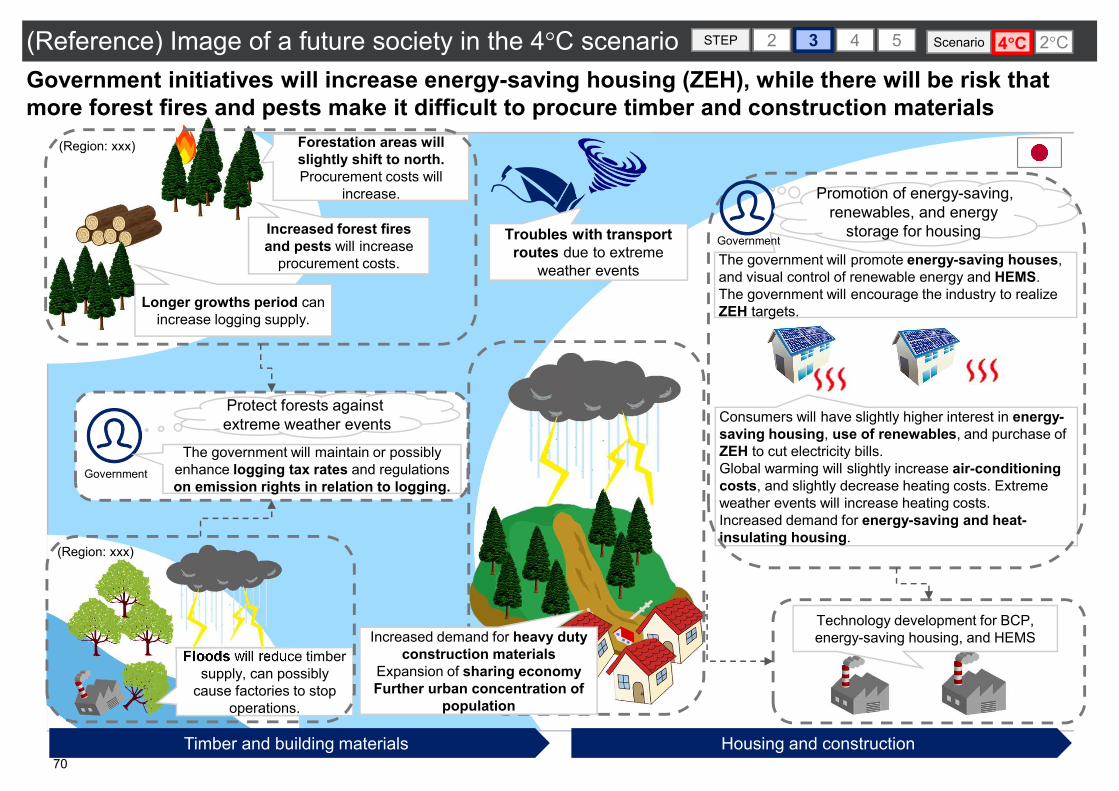
Forestation areas will slightly shift to north.Procurement costs will
increase.
Increased forest fires and pests will increase
procurement costs.
Longer growths period can increase logging supply.
Floods will reduce timber supply, can possibly
cause factories to stop operations.
Troubles with transport routes due to extreme
weather events
The government will maintain or possibly enhance logging tax rates and regulations on emission rights in relation to logging.
Protect forests against extreme weather events
Government
Technology development for BCP, energy-saving housing, and HEMS
Consumers will have slightly higher interest in energy-saving housing, use of renewables, and purchase of ZEH to cut electricity bills.Global warming will slightly increase air-conditioning costs, and slightly decrease heating costs. Extreme weather events will increase heating costs.Increased demand for energy-saving and heat-insulating housing.
Promotion of energy-saving, renewables, and energy
storage for housing
Increased demand for heavy dutyconstruction materials
Expansion of sharing economyFurther urban concentration of
population
Timber and building materials Housing and construction
Government initiatives will increase energy-saving housing (ZEH), while there will be risk that more forest fires and pests make it difficult to procure timber and construction materials
(Reference) Image of a future society in the 4 C scenario 4 C 2 CScenario4 52 3STEP
(Region: xxx)
(Region: xxx)
70
The government will promote energy-saving houses, and visual control of renewable energy and HEMS.The government will encourage the industry to realize ZEH targets.
Government
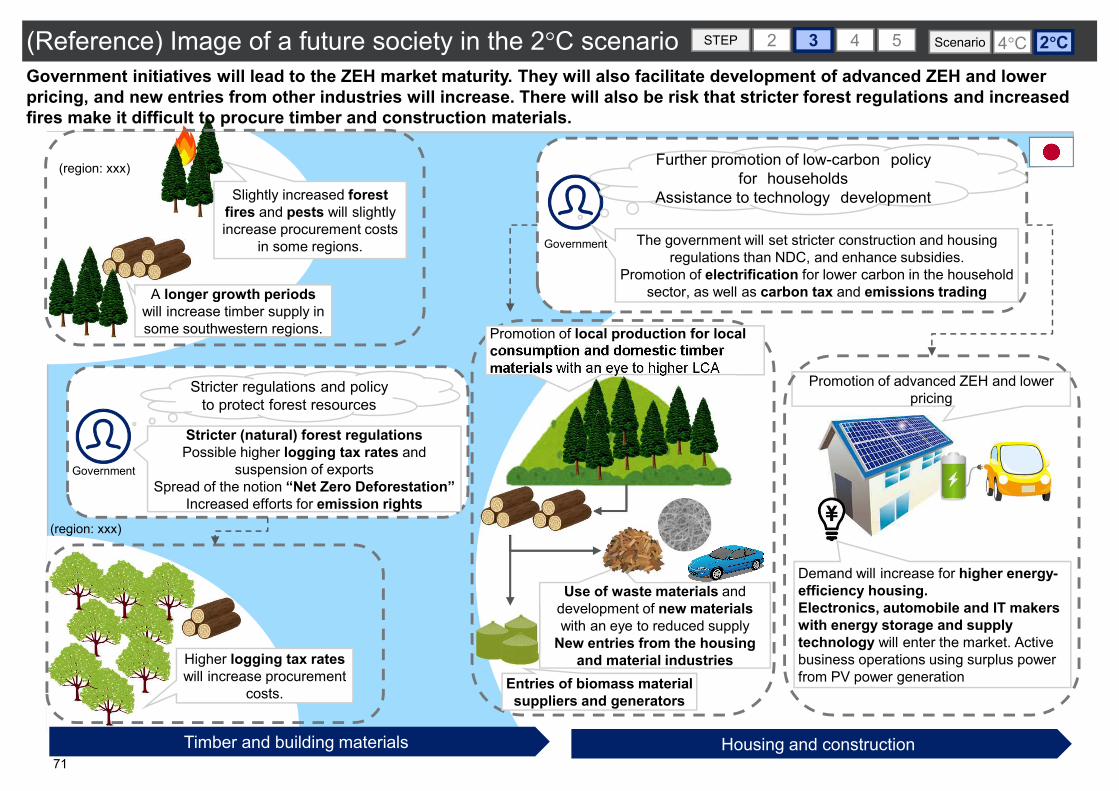
Slightly increased forest fires and pests will slightly increase procurement costs
in some regions.
A longer growth periods will increase timber supply in some southwestern regions.
Higher logging tax rates will increase procurement
costs.
Stricter (natural) forest regulationsPossible higher logging tax rates and
suspension of exportsSpread of the notion “Net Zero Deforestation”
Increased efforts for emission rights
Stricter regulations and policy to protect forest resources
Government
The government will set stricter construction and housing regulations than NDC, and enhance subsidies.
Promotion of electrification for lower carbon in the household sector, as well as carbon tax and emissions trading
Further promotion of low-carbon policy for households
Assistance to technology development
Government
Use of waste materials and development of new materials with an eye to reduced supply
New entries from the housing and material industries
Timber and building materials Housing and construction
Entries of biomass material suppliers and generators
Promotion of local production for local consumption and domestic timber materials with an eye to higher LCA
Demand will increase for higher energy-efficiency housing.Electronics, automobile and IT makers with energy storage and supply technology will enter the market. Active business operations using surplus power from PV power generation
Promotion of advanced ZEH and lower pricing
Government initiatives will lead to the ZEH market maturity. They will also facilitate development of advanced ZEH and lower pricing, and new entries from other industries will increase. There will also be risk that stricter forest regulations and increased fires make it difficult to procure timber and construction materials.
(Reference) Image of a future society in the 2 C scenario 4 C 2 CScenario4 52 3STEP
(region: xxx)
(region: xxx)
71

Present2030
Sources4 C 2 C
National carbonemissions targets/policies
Government targets
Indonesia deforestation325ha (the 2030 target) 450ha (assumed) 300ha (assumed) Indonesia NDC
Regulations on logging in natural forests None
Country targets (20-100%) (Assumptions)
Forest protection policy
Forest protection policy(likely to be logging tax) (Malaysia: $12/m3) (n.a.: unpredictable) (n.a.: unpredictable) (to be considered)
Building policy ZEH targets
New housing starts xxx unit (present level) xxx unit(opportunity loss of xx%) (Assumptions)
Share of ZEH ZEH: xxx%xxx%,
Advanced ZEH: xxx%
(Assumptions)
Subsidies for renewableenergies, etc.
Subsidy amountShare of biomass power generation
Energy mix in Japan1.7% 3.7% 4.6%
Agency for Natural Resources and Energy, “Challenges to
the 2030 Energy Mix - Overall Picture”Changes in
energy mix
Rise in average temperatures
Changes in vegetation and increase in fires
Forest fire area0.951%/year
(Canada)1.594%/year 1.690%/year
Natural Resources Canada Forest Change indicators ”Fire
regime”(RCP2.6, RCP8.5)
Increase in forest pests (n.a.: data unavailable) (n.a.: unpredictable) (n.a.: unpredictable) (to be considered)
Changes in precipitation and weather patterns
Flooding risk $405m/year(Indonesia) $875m/year $405m/year WRI "The Aqueduct Global
Flood analyzer"
Severer extreme weather event
Frequency of torrential rains
Event probability: 0.3 times/year
(Japan)0.6 times/year
(around 2100)(n.a.: data unavailable)
Ministry of the Environment, “Synthesis Report on
Observations, Projections and Impact Assessments of Climate Change, 2018”
1
Define the world in selected scenarios based on IEA and other scientific groundsSTEP3 “Identify and define range of scenario” 2 C4 52 3 ScenarioSTEP 4 C
72

73
Scientific forecasts Recognition of forestry companies
[Key indicator: Annual area burned]A rise in temperatures will increase the number of large fires, having great impacts both in the 2 C and 4 C scenarios.
Companies cited Comments (extracts)
STORAENSOUPM
Higher risks of forest fires: Not yet occurred in northwestern Russia, where the company procures materials, but possible future risks (UPM)
BramblesImpacts of unforeseeable cyclones, fires, earthquakes and other natural disasters (Brambles)
Forest fire risk recognition among worldwide companies
STORAENSO: A forest products company providing products in over 30 countries worldwide. A leading company in the global marketUPM: A forest industry company having production plants in 13 countries, strong in business fields combining bioenergy and forestry industriesBrambles: A supply-chain logistics company doing business in over 60 countries worldwide
2℃
Annual area burned (qualitative)
Present Forest fires in the central part of the continent
2030 Large scale forest firescentral region
2050 Forest fires also inthe northwest
Source: Natural Resources Canada, “Forest Change Indicators, Fire Regime RCP 2.6 scenario”
World leading forest companies recognize that climate change is causing more forest fires.
4 52 3STEP
Annual area burned by large fires in Canada
Annual area burned by large fires (Area burned/year)
Source: CDP response
CDP response on climate change risks
1
0.951% 1.594%~1.690
Present 2030 2050
4 C 1.873%~3.045%
Timber & Building Materials
Timber & Building Materials
Housing and ConstructionHousing and Construction
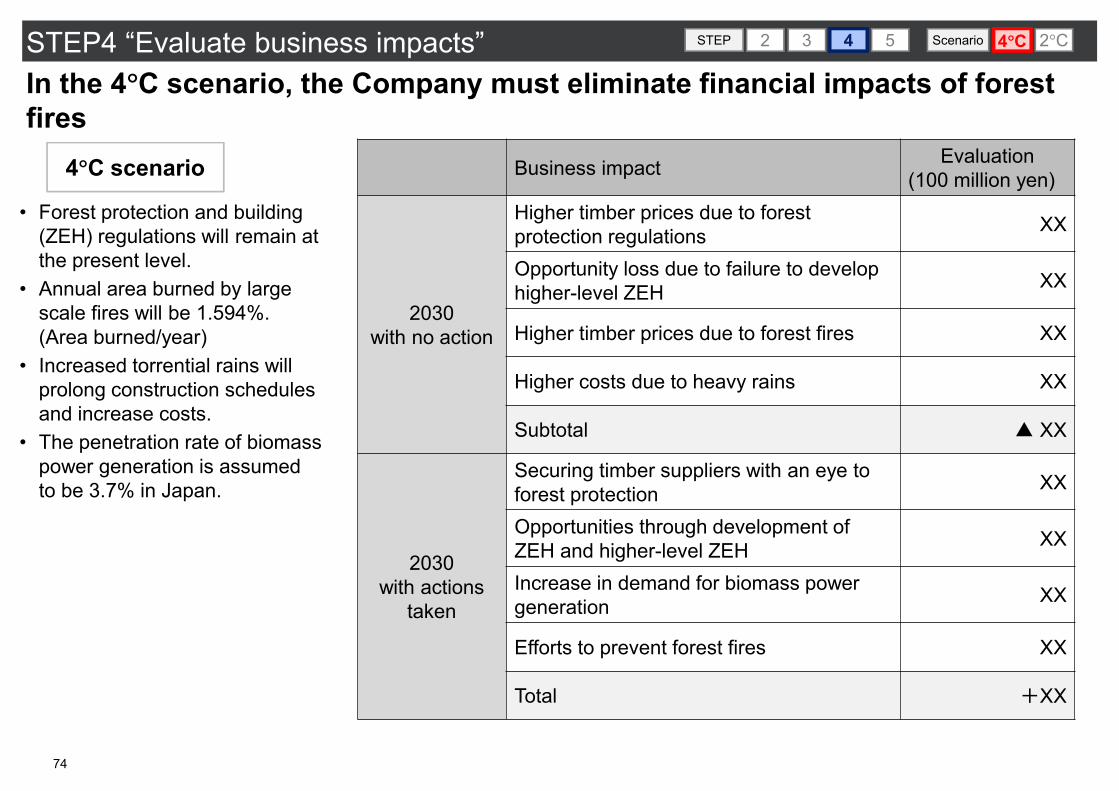
Business impact Evaluation(100 million yen)
2030with no action
Higher timber prices due to forest protection regulations XX
Opportunity loss due to failure to develop higher-level ZEH XX
Higher timber prices due to forest fires XX
Higher costs due to heavy rains XX
Subtotal ▲ XX
2030with actions
taken
Securing timber suppliers with an eye to forest protection XX
Opportunities through development of ZEH and higher-level ZEH XX
Increase in demand for biomass power generation XX
Efforts to prevent forest fires XX
Total +XX
74
4 C scenario
• Forest protection and building (ZEH) regulations will remain at the present level.
• Annual area burned by large scale fires will be 1.594%. (Area burned/year)
• Increased torrential rains will prolong construction schedules and increase costs.
• The penetration rate of biomass power generation is assumed to be 3.7% in Japan.
In the 4 C scenario, the Company must eliminate financial impacts of forest fires
STEP4 “Evaluate business impacts” 4 52 3STEP 2 CScenario 4 C
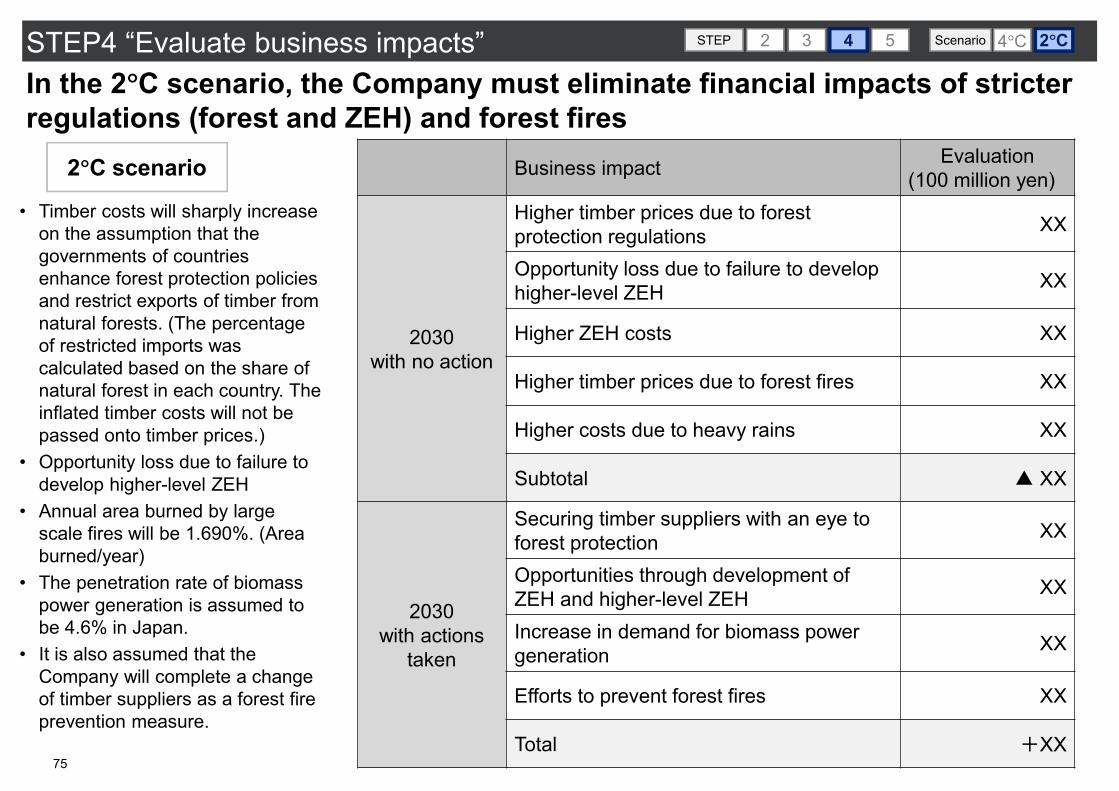
75
In the 2 C scenario, the Company must eliminate financial impacts of stricter regulations (forest and ZEH) and forest fires
STEP4 “Evaluate business impacts” 4 52 3STEP 2 CScenario 4 C
2 C scenario
• Timber costs will sharply increase on the assumption that the governments of countries enhance forest protection policies and restrict exports of timber from natural forests. (The percentage of restricted imports was calculated based on the share of natural forest in each country. The inflated timber costs will not be passed onto timber prices.)
• Opportunity loss due to failure to develop higher-level ZEH
• Annual area burned by large scale fires will be 1.690%. (Area burned/year)
• The penetration rate of biomass power generation is assumed to be 4.6% in Japan.
• It is also assumed that the Company will complete a change of timber suppliers as a forest fire prevention measure.
Business impact Evaluation(100 million yen)
2030with no action
Higher timber prices due to forest protection regulations XX
Opportunity loss due to failure to develop higher-level ZEH XX
Higher ZEH costs XX
Higher timber prices due to forest fires XX
Higher costs due to heavy rains XX
Subtotal ▲ XX
2030with actions
taken
Securing timber suppliers with an eye to forest protection XX
Opportunities through development of ZEH and higher-level ZEH XX
Increase in demand for biomass power generation XX
Efforts to prevent forest fires XX
Total +XX

76
2. Scenario Analysis - Practice Examples(i) ITOCHU Corporation(ii) Mitsui O.S.K. Lines, Ltd.(iii) Japan Airlines Co., Ltd(iv) MITSUBISHI MOTORS CORPORATION(v) Sumitomo Forestry Co., Ltd.(vi) Tokyu Fudosan Holdings Corporation
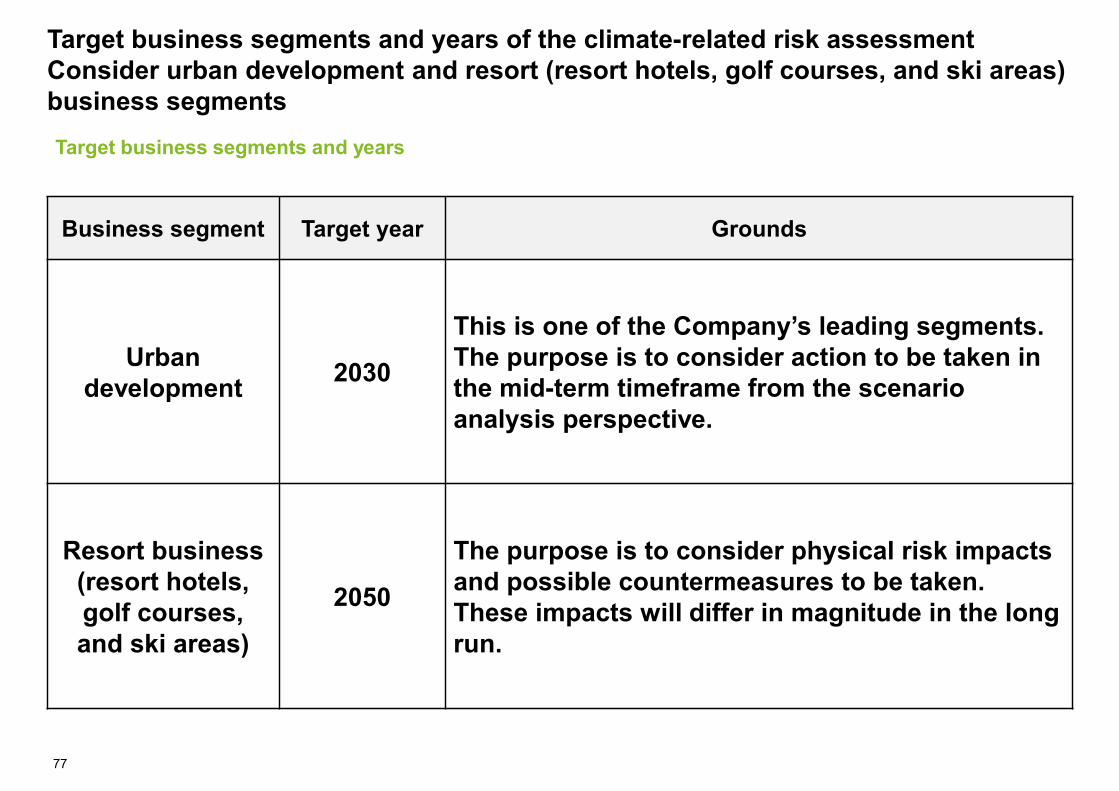
Target business segments and years of the climate-related risk assessmentConsider urban development and resort (resort hotels, golf courses, and ski areas) business segments
Business segment Target year Grounds
Urban development 2030
This is one of the Company’s leading segments. The purpose is to consider action to be taken in the mid-term timeframe from the scenario analysis perspective.
Resort business(resort hotels, golf courses, and ski areas)
2050
The purpose is to consider physical risk impacts and possible countermeasures to be taken. These impacts will differ in magnitude in the long run.
Target business segments and years
77
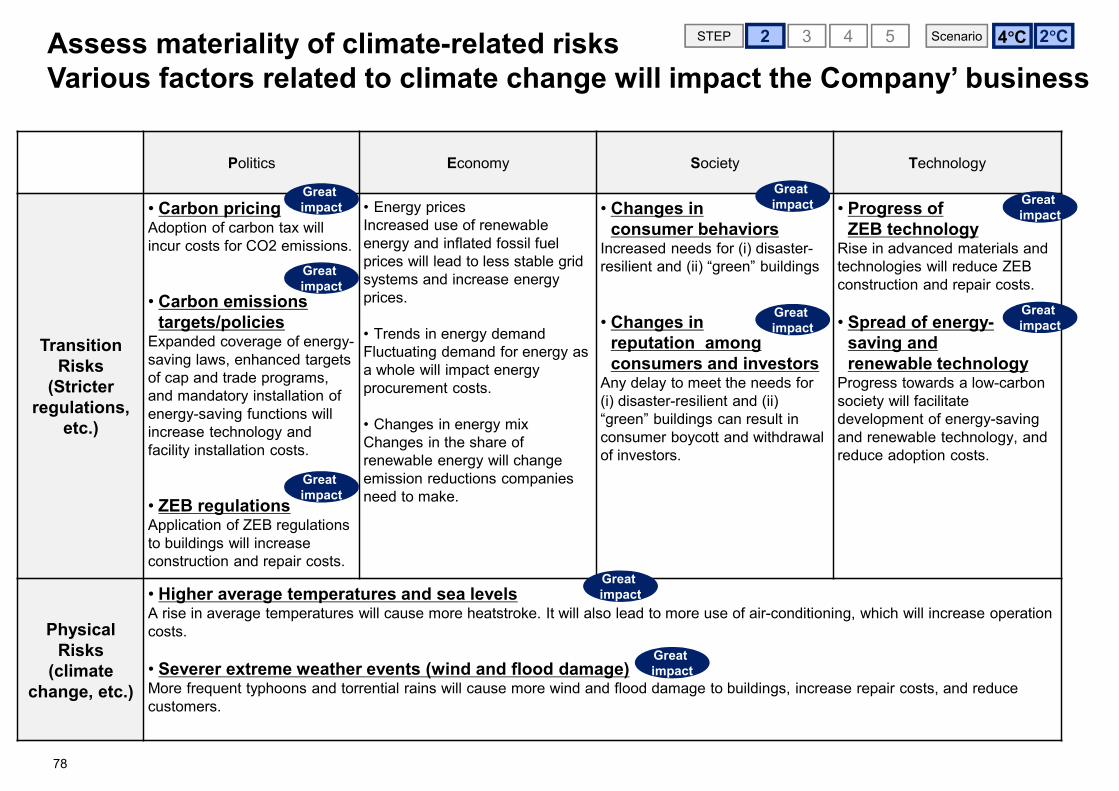
Assess materiality of climate-related risksVarious factors related to climate change will impact the Company’ business
4 C 2 C4 52 3 ScenarioSTEP
Politics Economy Society Technology
Transition Risks
(Stricter regulations,
etc.)
• Carbon pricingAdoption of carbon tax will incur costs for CO2 emissions.
• Carbon emissions targets/policies
Expanded coverage of energy-saving laws, enhanced targets of cap and trade programs, and mandatory installation of energy-saving functions will increase technology and facility installation costs.
• ZEB regulationsApplication of ZEB regulations to buildings will increase construction and repair costs.
• Energy pricesIncreased use of renewable energy and inflated fossil fuel prices will lead to less stable grid systems and increase energy prices.
• Trends in energy demandFluctuating demand for energy as a whole will impact energy procurement costs.
• Changes in energy mixChanges in the share of renewable energy will change emission reductions companies need to make.
• Changes in consumer behaviors
Increased needs for (i) disaster-resilient and (ii) “green” buildings
• Changes in reputation among consumers and investors
Any delay to meet the needs for (i) disaster-resilient and (ii) “green” buildings can result in consumer boycott and withdrawal of investors.
• Progress of ZEB technology
Rise in advanced materials and technologies will reduce ZEB construction and repair costs.
• Spread of energy-saving and renewable technology
Progress towards a low-carbon society will facilitate development of energy-saving and renewable technology, and reduce adoption costs.
Physical Risks
(climate change, etc.)
• Higher average temperatures and sea levelsA rise in average temperatures will cause more heatstroke. It will also lead to more use of air-conditioning, which will increase operation costs.
• Severer extreme weather events (wind and flood damage)More frequent typhoons and torrential rains will cause more wind and flood damage to buildings, increase repair costs, and reduce customers.
Great impact
Great impact
Great impact
Great impact
Great impact
Great impact
Great impact
Great impact
Great impact
78
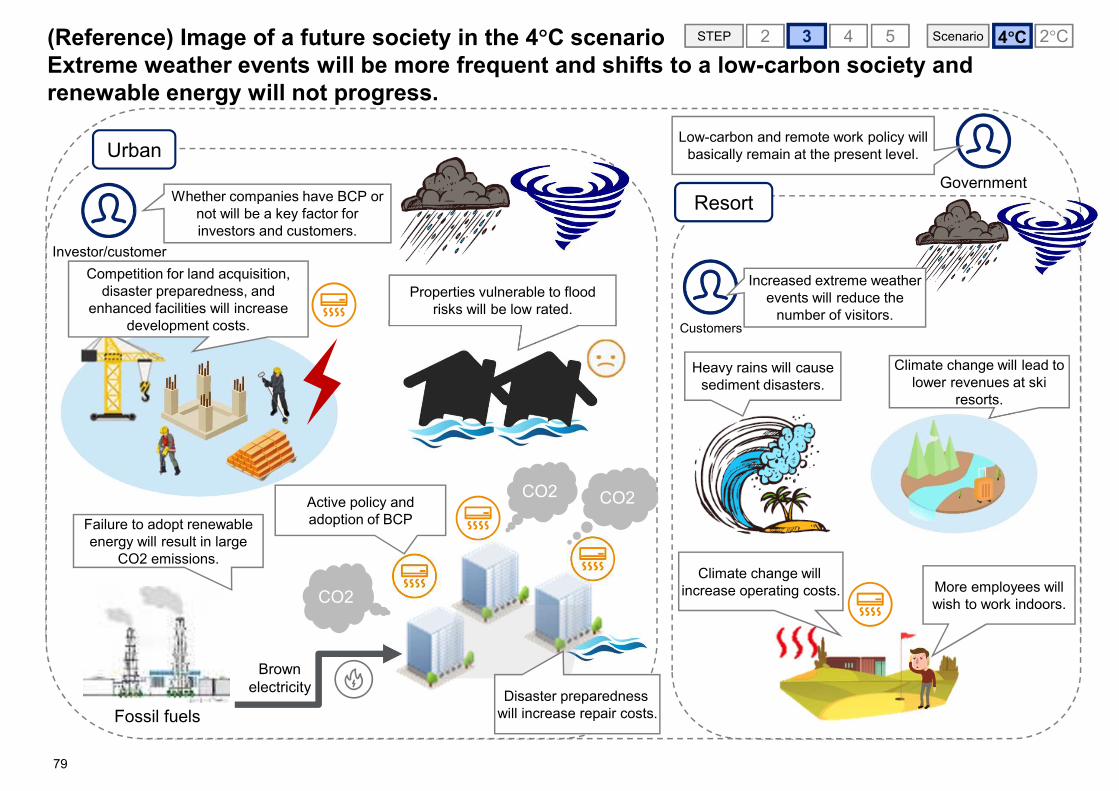
(Reference) Image of a future society in the 4 C scenarioExtreme weather events will be more frequent and shifts to a low-carbon society and renewable energy will not progress.
UrbanGovernment
Low-carbon and remote work policy will basically remain at the present level.
Competition for land acquisition, disaster preparedness, and
enhanced facilities will increase development costs.
Properties vulnerable to flood risks will be low rated.
Fossil fuels
Failure to adopt renewable energy will result in large
CO2 emissions.
Investor/customer
Whether companies have BCP or not will be a key factor for investors and customers.
Heavy rains will cause sediment disasters.
Climate change will lead to lower revenues at ski
resorts.
Resort
Climate change will increase operating costs.
4 C 2 C4 52 3 ScenarioSTEP
Brownelectricity
CO2
CO2CO2Active policy and adoption of BCP
Disaster preparedness will increase repair costs.
Customers
Increased extreme weather events will reduce the
number of visitors.
More employees will wish to work indoors.
79
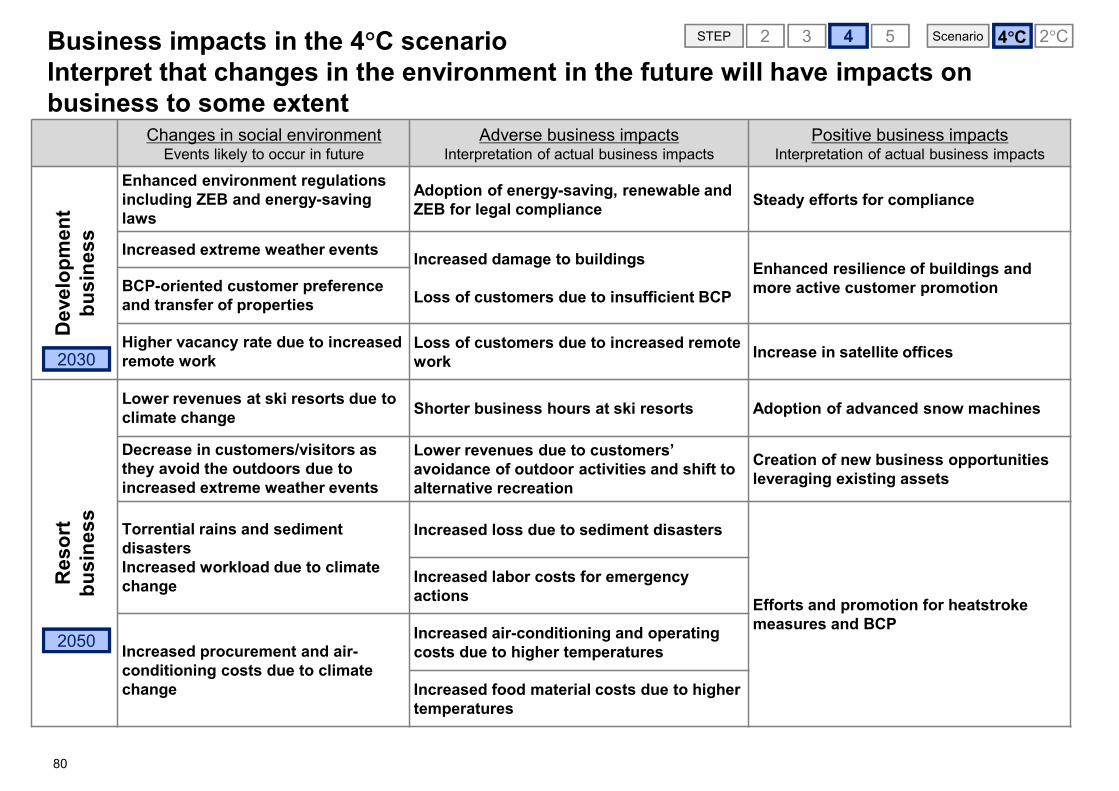
Business impacts in the 4 C scenarioInterpret that changes in the environment in the future will have impacts on business to some extent
Changes in social environmentEvents likely to occur in future
Adverse business impactsInterpretation of actual business impacts
Positive business impactsInterpretation of actual business impacts
Dev
elop
men
t bu
sine
ss
Enhanced environment regulations including ZEB and energy-saving laws
Adoption of energy-saving, renewable and ZEB for legal compliance Steady efforts for compliance
Increased extreme weather events Increased damage to buildings
Loss of customers due to insufficient BCP
Enhanced resilience of buildings and more active customer promotionBCP-oriented customer preference
and transfer of properties
Higher vacancy rate due to increased remote work
Loss of customers due to increased remote work Increase in satellite offices
Res
ort
busi
ness
Lower revenues at ski resorts due to climate change Shorter business hours at ski resorts Adoption of advanced snow machines
Decrease in customers/visitors as they avoid the outdoors due to increased extreme weather events
Lower revenues due to customers’ avoidance of outdoor activities and shift to alternative recreation
Creation of new business opportunities leveraging existing assets
Torrential rains and sediment disastersIncreased workload due to climate change
Increased loss due to sediment disasters
Efforts and promotion for heatstroke measures and BCP
Increased labor costs for emergency actions
Increased procurement and air-conditioning costs due to climate change
Increased air-conditioning and operating costs due to higher temperatures
Increased food material costs due to higher temperatures
2030
2050
4 C 2 C4 52 3 ScenarioSTEP
80
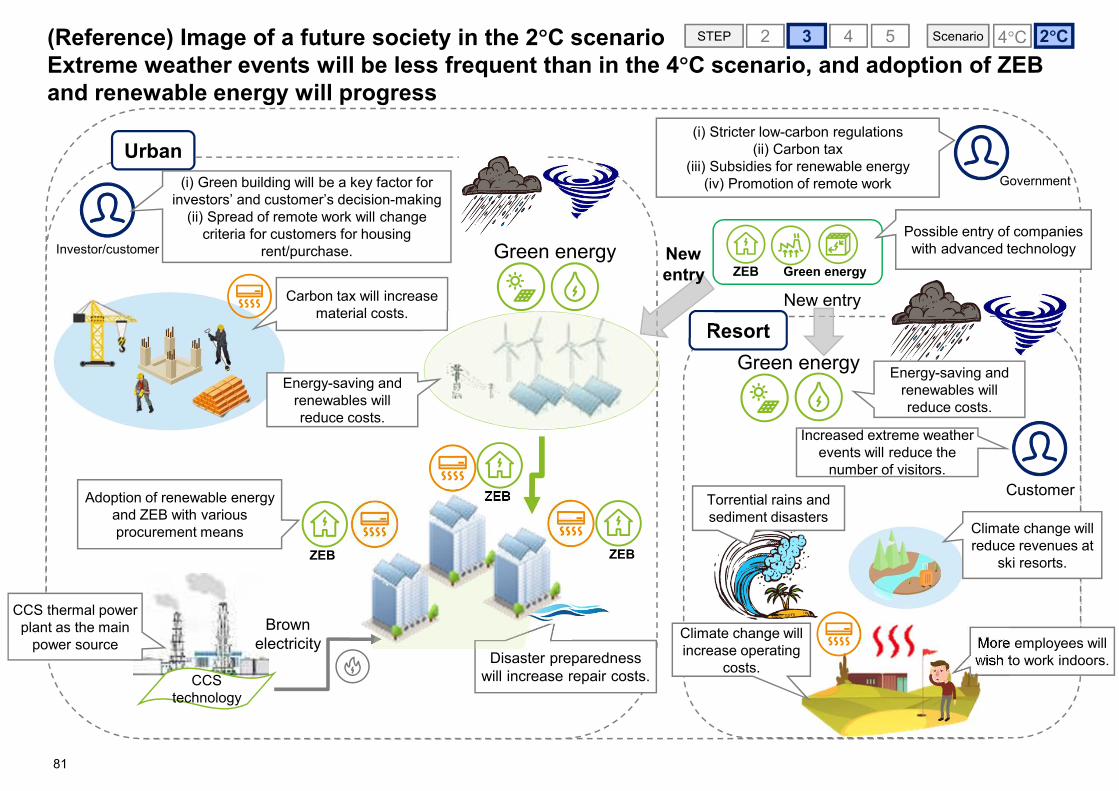
(Reference) Image of a future society in the 2 C scenarioExtreme weather events will be less frequent than in the 4 C scenario, and adoption of ZEB and renewable energy will progress
Urban
Resort
Government
(i) Stricter low-carbon regulations(ii) Carbon tax
(iii) Subsidies for renewable energy(iv) Promotion of remote work
Carbon tax will increase material costs.
Disaster preparedness will increase repair costs.
Adoption of renewable energy and ZEB with various procurement means
Investor/customer
(i) Green building will be a key factor for investors’ and customer’s decision-making
(ii) Spread of remote work will change criteria for customers for housing
rent/purchase.
CCS technology
Green energyZEB Green energy
Possible entry of companies with advanced technology
New entry
New entry
Torrential rains and sediment disasters
Climate change will reduce revenues at
ski resorts.
More employees will wish to work indoors.
4 C 2 C4 52 3 ScenarioSTEP
Energy-saving and renewables will reduce costs.
ZEB ZEB
ZEB
CCS thermal power plant as the main
power source
Green energy Energy-saving and renewables will reduce costs.
Climate change will increase operating
costs.
Customer
Increased extreme weather events will reduce the
number of visitors.
81
Brownelectricity
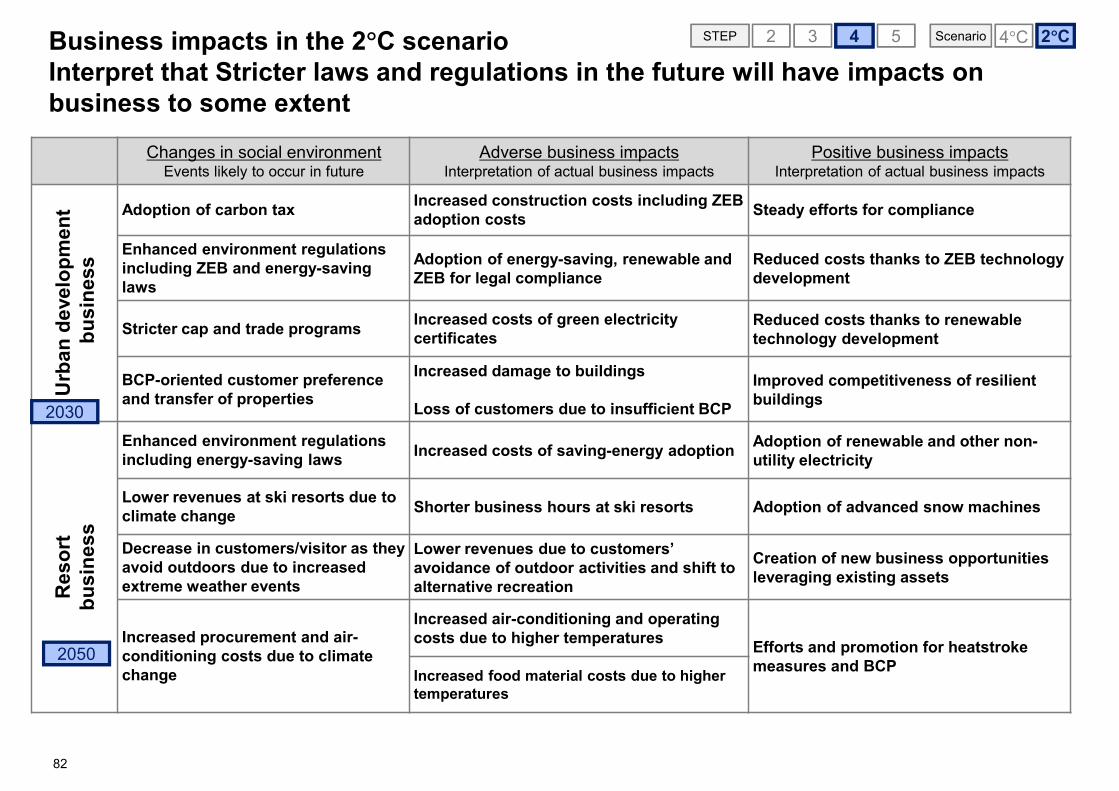
Business impacts in the 2 C scenarioInterpret that Stricter laws and regulations in the future will have impacts on business to some extent
Changes in social environmentEvents likely to occur in future
Adverse business impactsInterpretation of actual business impacts
Positive business impactsInterpretation of actual business impacts
Urb
an d
evel
opm
ent
busi
ness
Adoption of carbon tax Increased construction costs including ZEB adoption costs Steady efforts for compliance
Enhanced environment regulations including ZEB and energy-saving laws
Adoption of energy-saving, renewable and ZEB for legal compliance
Reduced costs thanks to ZEB technology development
Stricter cap and trade programs Increased costs of green electricity certificates
Reduced costs thanks to renewable technology development
BCP-oriented customer preference and transfer of properties
Increased damage to buildings
Loss of customers due to insufficient BCP
Improved competitiveness of resilient buildings
Res
ort
busi
ness
Enhanced environment regulations including energy-saving laws Increased costs of saving-energy adoption Adoption of renewable and other non-
utility electricity
Lower revenues at ski resorts due to climate change Shorter business hours at ski resorts Adoption of advanced snow machines
Decrease in customers/visitor as they avoid outdoors due to increased extreme weather events
Lower revenues due to customers’ avoidance of outdoor activities and shift to alternative recreation
Creation of new business opportunities leveraging existing assets
Increased procurement and air-conditioning costs due to climate change
Increased air-conditioning and operating costs due to higher temperatures Efforts and promotion for heatstroke
measures and BCPIncreased food material costs due to higher temperatures
4 52 3 ScenarioSTEP
2030
4 C 2 C
2050
82
3. Publicly Available Scenario Analysis
Chapter 3. Publicly Available Scenario AnalysisThis chapter presents corporate efforts for scenario analysis in accordance with the steps recommended by the TCFD recommendations.
83
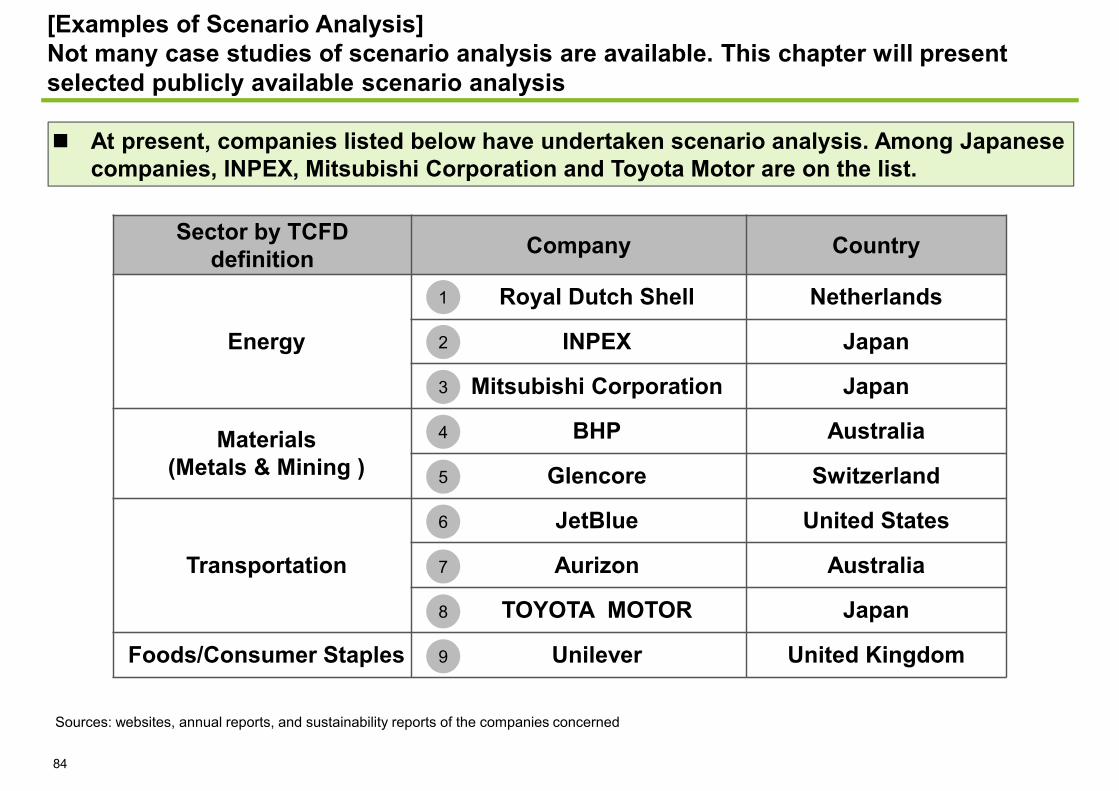
Sector by TCFD definition Company Country
Energy
Royal Dutch Shell Netherlands
INPEX Japan
Mitsubishi Corporation Japan
Materials(Metals & Mining )
BHP Australia
Glencore Switzerland
Transportation
JetBlue United States
Aurizon Australia
TOYOTA MOTOR Japan
Foods/Consumer Staples Unilever United Kingdom
[Examples of Scenario Analysis]Not many case studies of scenario analysis are available. This chapter will present selected publicly available scenario analysis
At present, companies listed below have undertaken scenario analysis. Among Japanese companies, INPEX, Mitsubishi Corporation and Toyota Motor are on the list.
1
2
3
4
5
6
7
8
Sources: websites, annual reports, and sustainability reports of the companies concerned
84
9

Royal Dutch Shell scenario analysis
[Royal Dutch Shell (Energy) (1/2)]The Company sets three scenarios incorporating government policy of different levels.In FY2017, the Company adopted a new scenario “Sky”, “Well below 2 C - The Paris ambition”
ScenarioMountainsGovernments around the world steadily and gently promote political and economic reforms.
OceansMarkets and citizens gain more initiatives, and changes take place at varied paces depending on the speed of deregulation.
SkyThe scenario complies with the target “below 2℃” of the Paris Agreement. It assumes that carbon emissions from the energy sector will be net-zero by the target year 2070.
FeaturesExtensive report on scenario analysis comprised 96 pages. Reference to the TCFD recommendations
In 2013, Shell published its original scenario “New Lens”, a pioneering scenario work.
The report features comments from CEO/Head of Shell Scenarios on the importance of scenarios.
The scenarios originally developed were praised by the Massachusetts Institute of Technology (MIT).
The report makes the most of scenarios and analyzes climate-related impacts on the world and the industry.
Source: Royal Dutch Shell, “Shell Scenarios Sky” 2 C Scenario
1
85
4 52 3STEP

The future world in 2070 in the Sky scenario
Royal Dutch Shell scenario analysis
[Royal Dutch Shell (Energy) (2/2)]The Company analyses the future world in 2070 and clarifies concerns that could arise when comparing to the present situation.
A change in consumer mindset means that people preferentially choose low-carbon, high-efficiency options to meet their energy service needs. A step-change in the efficiency of energy use leads to gains above historical trends.Carbon-pricing mechanisms are adopted by governments globally over the 2020s, leading to a meaningful cost of CO2 embedded within consumer goods and services.The rate of electrification of final energy more than triples, with global electricity generation reaching a level nearly five times today’s level.New energy sources grow up to fifty-fold, with primary energy from renewables eclipsing fossil fuels in the 2050s.Some 10,000 large carbon capture and storage (CCS) facilities are built, compared to fewer than 50 operating in 2020.Net-zero deforestation is achieved. In addition, reforesting an area the size of Brazil offers the possibility of limiting warming to 1.5℃.
Challenges for a 21st century scenarioEnergy demand is risingEfficiency can have unexpected consequencesCoal remains popularSome parts of the energy system are “stubborn”Some technologies are “stalled”Systems transformations are unpredictable and take timeGiven the time frame of 2070, there can be no slippage
Source: Royal Dutch Shell, “Shell Scenarios Sky”
1
86
4 52 3STEP

Vision 2040Increase our corporate value by conducting operations flexiblyCreate a global gas value chainAim for renewable energy projects to account for 10% of its project portfolio in the long termDevelop technology for the practical application of CCS
The Company sets four climate-change scenarios consisting of IEA’s and its own scenarios.
[INPEX (Energy) (1/2)]The Company sets four climate-change scenarios based on two key factors, “policy” and “technology”.
Source: INPEX Corporation, “Sustainability Report 2018”, August 2018.
The INPEX Low-carbon Society Scenarios
Low-carbon Transition Plan Based on Scenario Analysis
2
87
4 52 3STEP
Scenario (to 2040) Enhanced policy level Technological progress levelIEA New Policies
ScenarioPreserving actual NDC trends after 2025
Level of actual NDC plus announced technological progress in each country
Technology progress scenario
Preserving actual NDC trends after 2025
Technology of solar, wind and EVs will progress more than those of the IEA New Policies Scenario due to decreasing the cost
Wake-up scenario Strengthen NDCs greatlyenhanced by 2025
Technological progress level : Same as IEA New Policies Scenario through 2025; thereafter the 2 C scenario level
2 C scenario Strengthen NDCs greatly enhanced by 2020
Energy efficiency improvements and CCS largely contribute to emissions reduction in addition to expansion of solar and wind power, and EVs according to technology development
Medium-term Business Plan 2018–2022Reduce production costs to $5/bbl (excluding royalties) for oil and natural gas upstream businessesMaintain financial and corporate resilience even if the crude oil price drop to US$50/bblPromote development of natural gas, enhance renewable energy initiativesManage emissions from operations
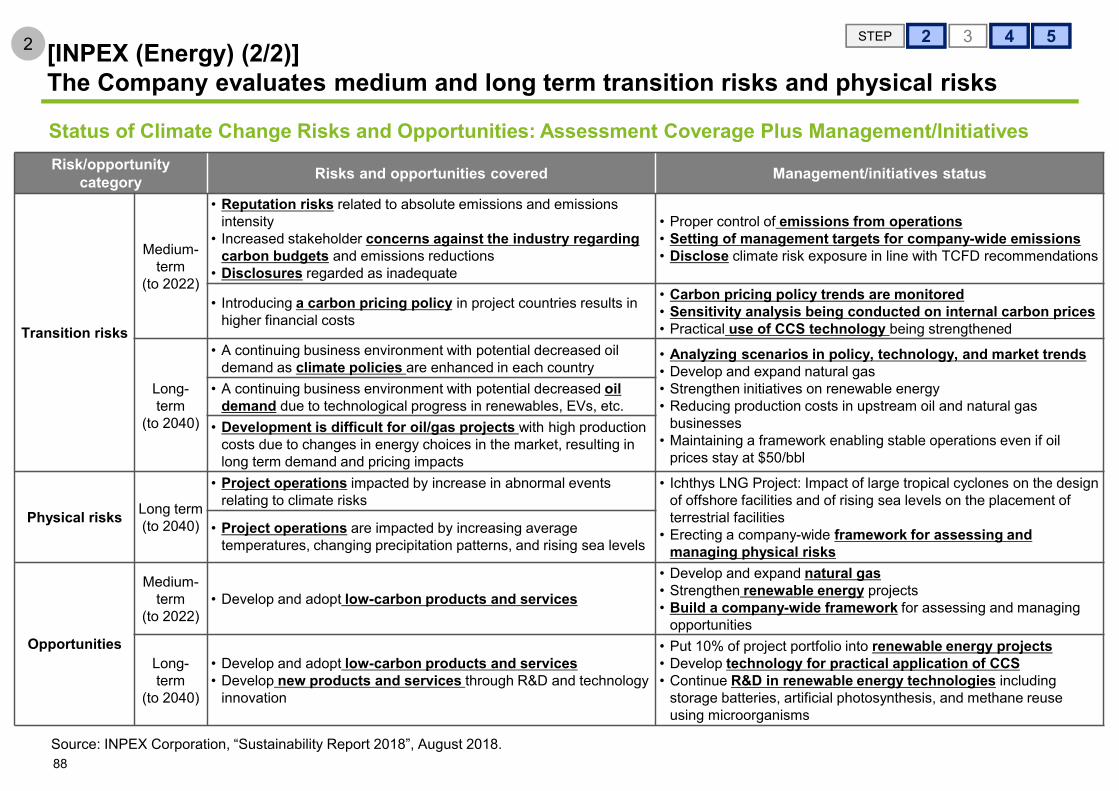
Status of Climate Change Risks and Opportunities: Assessment Coverage Plus Management/Initiatives
[INPEX (Energy) (2/2)]The Company evaluates medium and long term transition risks and physical risks
Source: INPEX Corporation, “Sustainability Report 2018”, August 2018.
2
88
4 52 3STEP
Risk/opportunitycategory Risks and opportunities covered Management/initiatives status
Transition risks
Medium-term
(to 2022)
• Reputation risks related to absolute emissions and emissions intensity
• Increased stakeholder concerns against the industry regarding carbon budgets and emissions reductions
• Disclosures regarded as inadequate
• Proper control of emissions from operations• Setting of management targets for company-wide emissions• Disclose climate risk exposure in line with TCFD recommendations
• Introducing a carbon pricing policy in project countries results in higher financial costs
• Carbon pricing policy trends are monitored• Sensitivity analysis being conducted on internal carbon prices• Practical use of CCS technology being strengthened
Long-term
(to 2040)
• A continuing business environment with potential decreased oil demand as climate policies are enhanced in each country
• Analyzing scenarios in policy, technology, and market trends• Develop and expand natural gas• Strengthen initiatives on renewable energy• Reducing production costs in upstream oil and natural gas
businesses• Maintaining a framework enabling stable operations even if oil
prices stay at $50/bbl
• A continuing business environment with potential decreased oil demand due to technological progress in renewables, EVs, etc.
• Development is difficult for oil/gas projects with high production costs due to changes in energy choices in the market, resulting in long term demand and pricing impacts
Physical risks Long term(to 2040)
• Project operations impacted by increase in abnormal events relating to climate risks
• Ichthys LNG Project: Impact of large tropical cyclones on the design of offshore facilities and of rising sea levels on the placement of terrestrial facilities
• Erecting a company-wide framework for assessing and managing physical risks
• Project operations are impacted by increasing average temperatures, changing precipitation patterns, and rising sea levels
Opportunities
Medium-term
(to 2022)• Develop and adopt low-carbon products and services
• Develop and expand natural gas• Strengthen renewable energy projects• Build a company-wide framework for assessing and managing
opportunities
Long-term
(to 2040)
• Develop and adopt low-carbon products and services• Develop new products and services through R&D and technology
innovation
• Put 10% of project portfolio into renewable energy projects• Develop technology for practical application of CCS• Continue R&D in renewable energy technologies including
storage batteries, artificial photosynthesis, and methane reuse using microorganisms

[Mitsubishi Corporation (Trading Company) (1/3)]The Company discloses its climate-change risk and opportunity assessment process
Source: Mitsubishi Corporation, “ESG Data Book 2018”
3
89
2 3STEP
Disclosure of the scenario analysis process
The report provides the definition of scenarios used for scenario analysis and the process of assessing climate-related risks that have business impacts.
4 5
© 2019. For information, contact Deloitte Tohmatsu Consulting LLC.
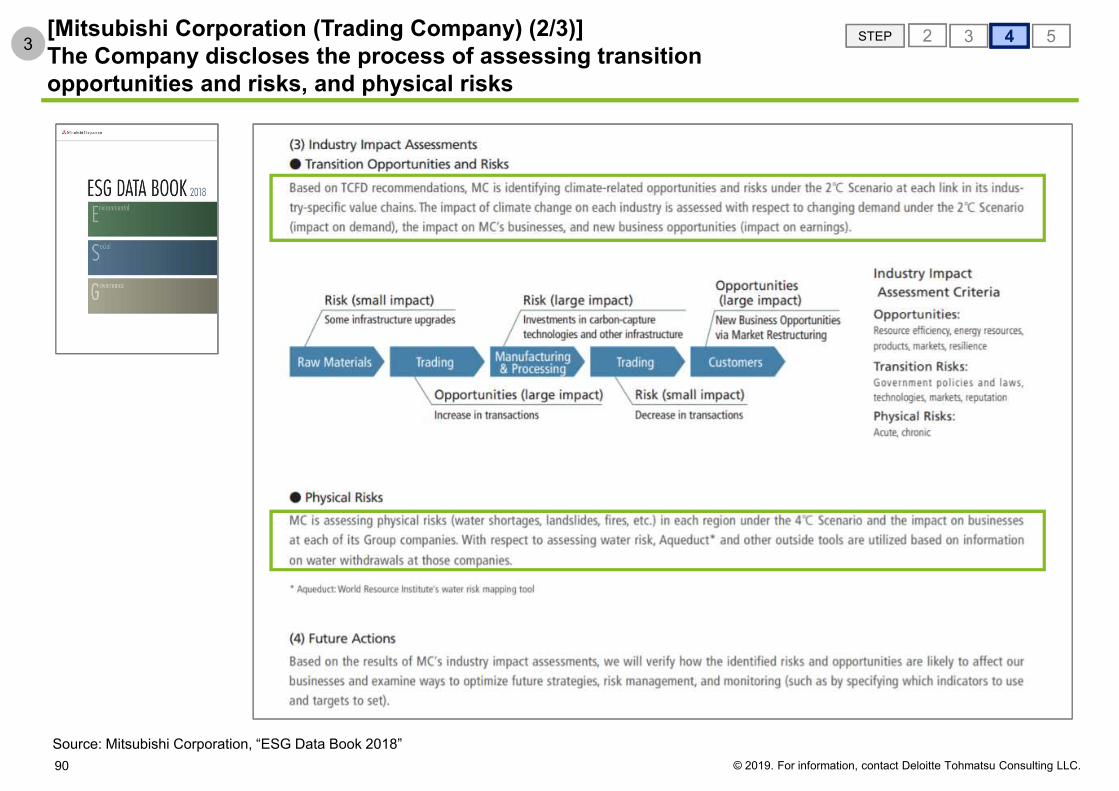
[Mitsubishi Corporation (Trading Company) (2/3)]The Company discloses the process of assessing transition opportunities and risks, and physical risks
Source: Mitsubishi Corporation, “ESG Data Book 2018”
3
90
STEP 542 3
© 2019. For information, contact Deloitte Tohmatsu Consulting LLC.
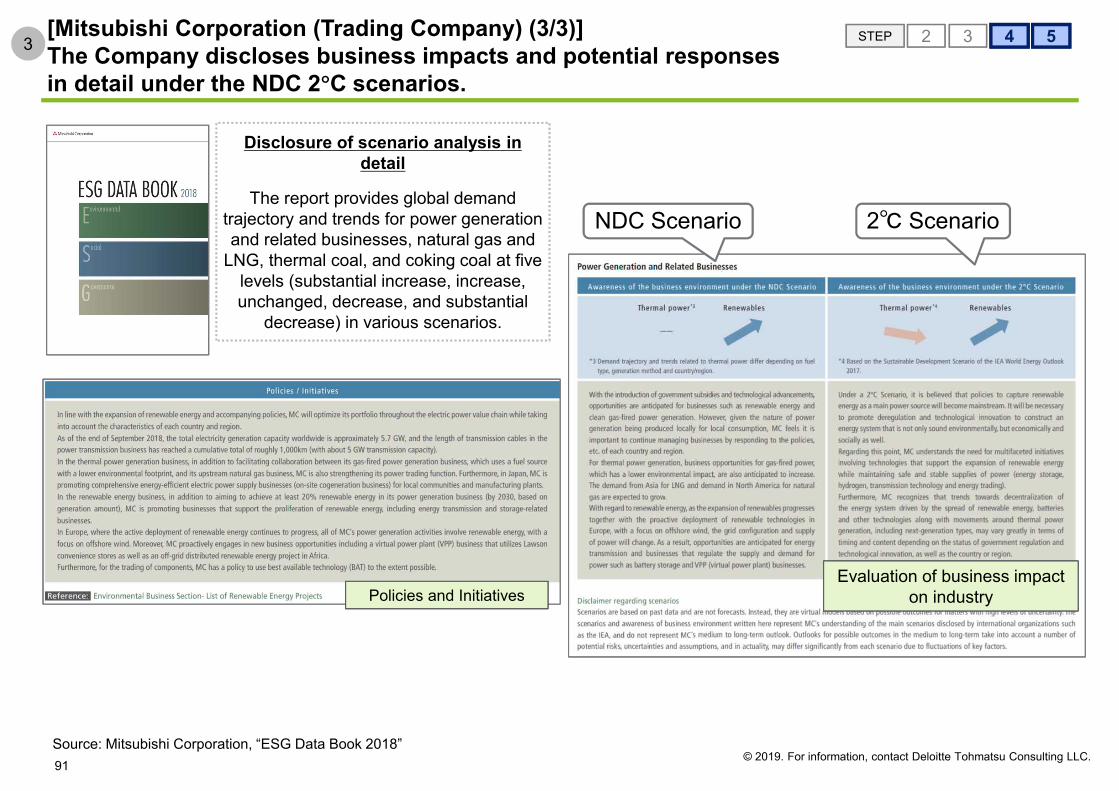
[Mitsubishi Corporation (Trading Company) (3/3)]The Company discloses business impacts and potential responses in detail under the NDC 2 C scenarios.
Source: Mitsubishi Corporation, “ESG Data Book 2018”
3
91
Disclosure of scenario analysis in detail
The report provides global demand trajectory and trends for power generation and related businesses, natural gas and
LNG, thermal coal, and coking coal at five levels (substantial increase, increase, unchanged, decrease, and substantial
decrease) in various scenarios.
Evaluation of business impact on industry
4 52 3STEP
NDC Scenario 2℃ Scenario
Policies and Initiatives
© 2019. For information, contact Deloitte Tohmatsu Consulting LLC.

[BHB Billiton (Materials) (1/3)]The Company has developed four scenarios in terms of the levels of cooperation and technology available at each country. It also adopts a Global Accord scenario towards a 2 C target.
Feat
ures
Scen
ario
s
The Company reports on scenario analysis and refers to the TCFDrecommendations.The report covers various events under four scenarios including the 2 C scenario (Global Accord) recommended by the TCFD recommendations.The report assumes a scenario where shock events will prompt a rapid transition to a largely decarbonized world in accordance with Global Accord scenario.The report concludes that strict environment regulations and emission costs will impact their commodities, but that BHP Billiton’s scenario remains attractive.
A New Gear: Innovation delivers step-change growth in developed economiesClosed Doors: National self-interest drives economic policy leading to low growthGlobal Accord: High cooperation and commitment to limit emissions will facilitate technology development. There is a transition to a 2 CworldTwo Giants: U.S. and China-led hubs drive technology-enabled growth
2 C ScenarioSource: BHP Billiton, “Portfolio Analysis 2015”
4
Features of scenario analysis, and scenarios used
92
4 52 3STEP
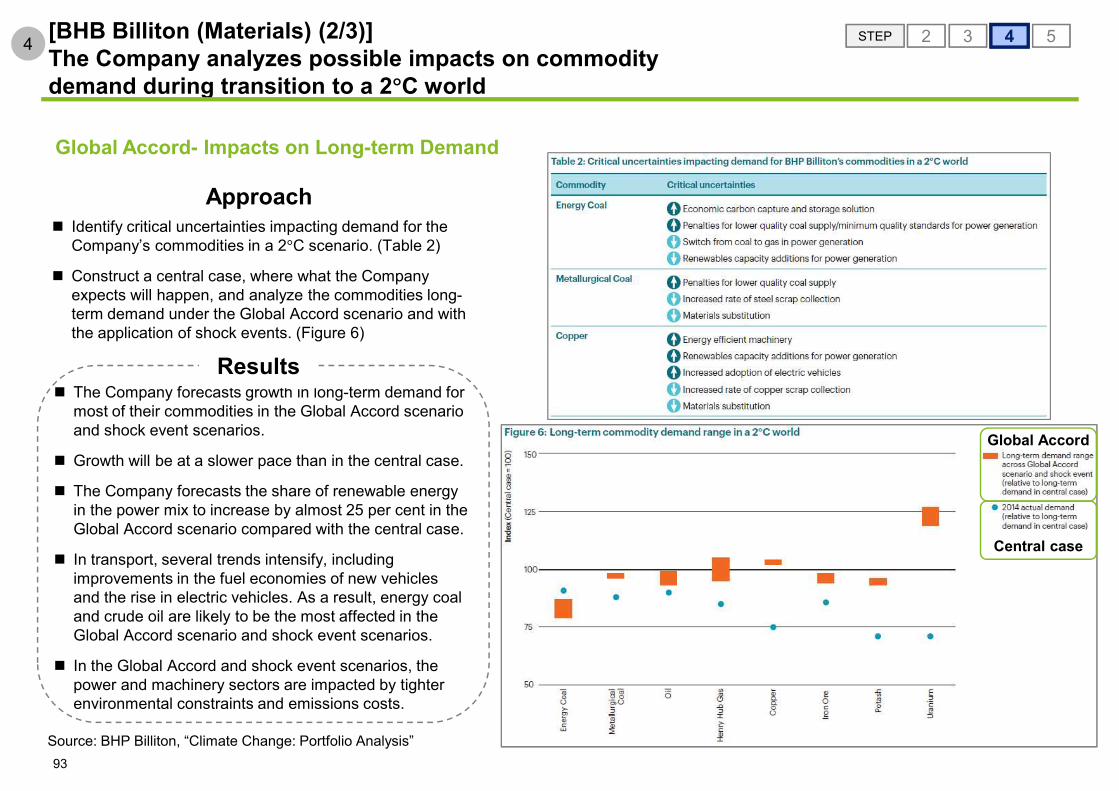
Global Accord- Impacts on Long-term Demand
[BHB Billiton (Materials) (2/3)]The Company analyzes possible impacts on commodity demand during transition to a 2 C world
ApproachIdentify critical uncertainties impacting demand for the Company’s commodities in a 2 C scenario. (Table 2)
Construct a central case, where what the Company expects will happen, and analyze the commodities long-term demand under the Global Accord scenario and with the application of shock events. (Figure 6)
The Company forecasts growth in long-term demand for most of their commodities in the Global Accord scenario and shock event scenarios.
Growth will be at a slower pace than in the central case.
The Company forecasts the share of renewable energy in the power mix to increase by almost 25 per cent in the Global Accord scenario compared with the central case.
In transport, several trends intensify, including improvements in the fuel economies of new vehicles and the rise in electric vehicles. As a result, energy coal and crude oil are likely to be the most affected in the Global Accord scenario and shock event scenarios.
In the Global Accord and shock event scenarios, the power and machinery sectors are impacted by tighter environmental constraints and emissions costs.
Results
Central case
Global Accord
Source: BHP Billiton, “Climate Change: Portfolio Analysis”
4
93
4 52 3STEP
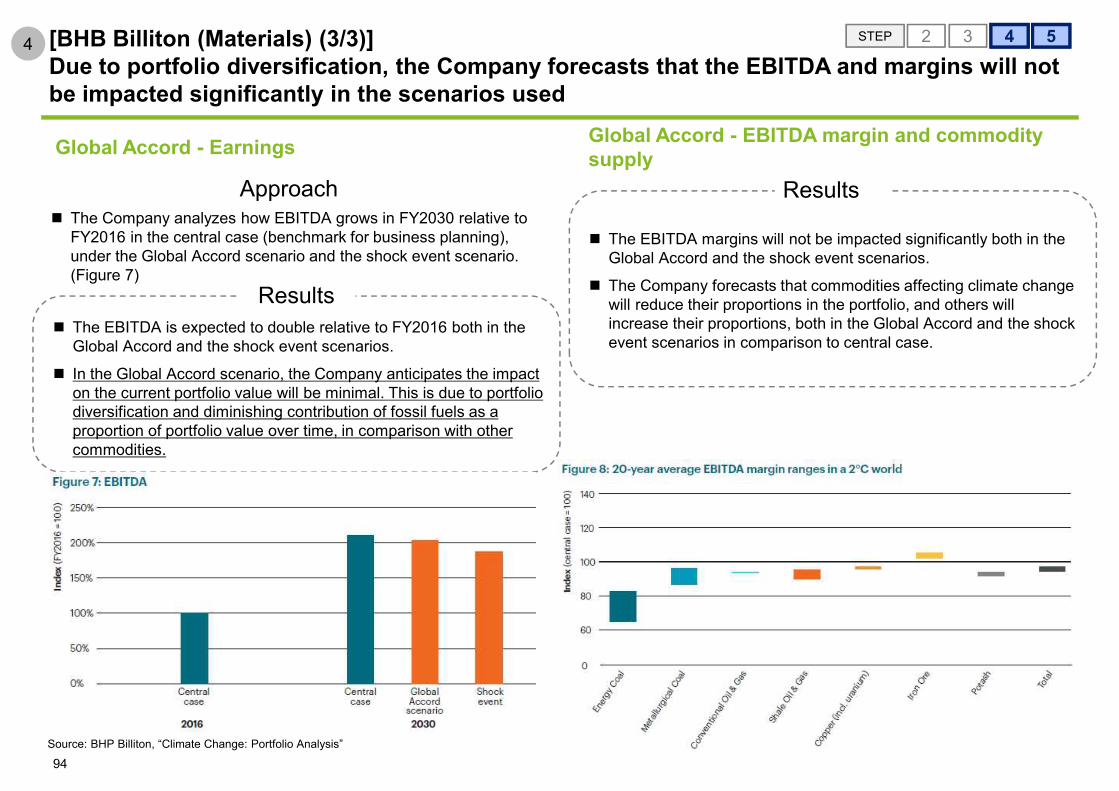
Global Accord - Earnings
[BHB Billiton (Materials) (3/3)]Due to portfolio diversification, the Company forecasts that the EBITDA and margins will not be impacted significantly in the scenarios used
Global Accord - EBITDA margin and commodity supply
Results
The EBITDA margins will not be impacted significantly both in the Global Accord and the shock event scenarios.
The Company forecasts that commodities affecting climate change will reduce their proportions in the portfolio, and others will increase their proportions, both in the Global Accord and the shock event scenarios in comparison to central case.
ApproachThe Company analyzes how EBITDA grows in FY2030 relative to FY2016 in the central case (benchmark for business planning), under the Global Accord scenario and the shock event scenario. (Figure 7)
ResultsThe EBITDA is expected to double relative to FY2016 both in the Global Accord and the shock event scenarios.
In the Global Accord scenario, the Company anticipates the impact on the current portfolio value will be minimal. This is due to portfolio diversification and diminishing contribution of fossil fuels as a proportion of portfolio value over time, in comparison with other commodities.
Source: BHP Billiton, “Climate Change: Portfolio Analysis”
4
94
4 52 3STEP
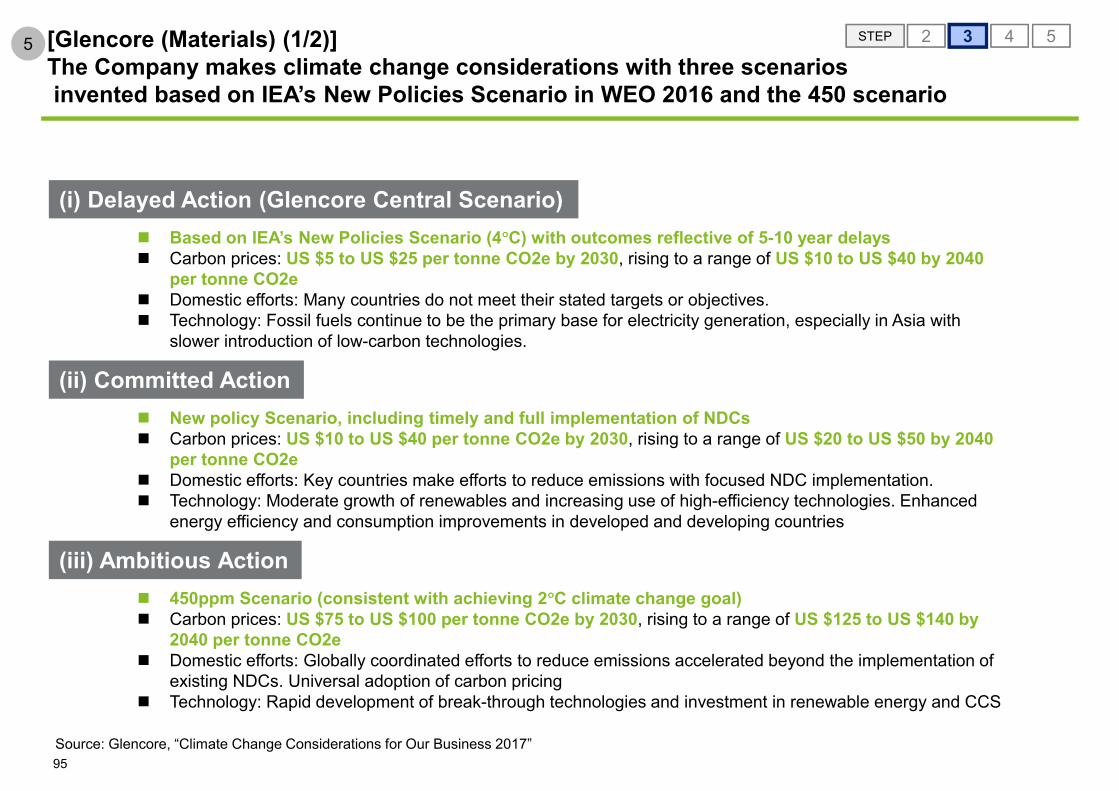
[Glencore (Materials) (1/2)]The Company makes climate change considerations with three scenariosinvented based on IEA’s New Policies Scenario in WEO 2016 and the 450 scenario
450ppm Scenario (consistent with achieving 2 C climate change goal)Carbon prices: US $75 to US $100 per tonne CO2e by 2030, rising to a range of US $125 to US $140 by 2040 per tonne CO2eDomestic efforts: Globally coordinated efforts to reduce emissions accelerated beyond the implementation of existing NDCs. Universal adoption of carbon pricingTechnology: Rapid development of break-through technologies and investment in renewable energy and CCS
New policy Scenario, including timely and full implementation of NDCsCarbon prices: US $10 to US $40 per tonne CO2e by 2030, rising to a range of US $20 to US $50 by 2040 per tonne CO2eDomestic efforts: Key countries make efforts to reduce emissions with focused NDC implementation.Technology: Moderate growth of renewables and increasing use of high-efficiency technologies. Enhanced energy efficiency and consumption improvements in developed and developing countries
Based on IEA’s New Policies Scenario (4 C) with outcomes reflective of 5-10 year delaysCarbon prices: US $5 to US $25 per tonne CO2e by 2030, rising to a range of US $10 to US $40 by 2040 per tonne CO2eDomestic efforts: Many countries do not meet their stated targets or objectives.Technology: Fossil fuels continue to be the primary base for electricity generation, especially in Asia with slower introduction of low-carbon technologies.
(i) Delayed Action (Glencore Central Scenario)
(ii) Committed Action
(iii) Ambitious Action
Source: Glencore, “Climate Change Considerations for Our Business 2017”
5
95
4 52 3STEP
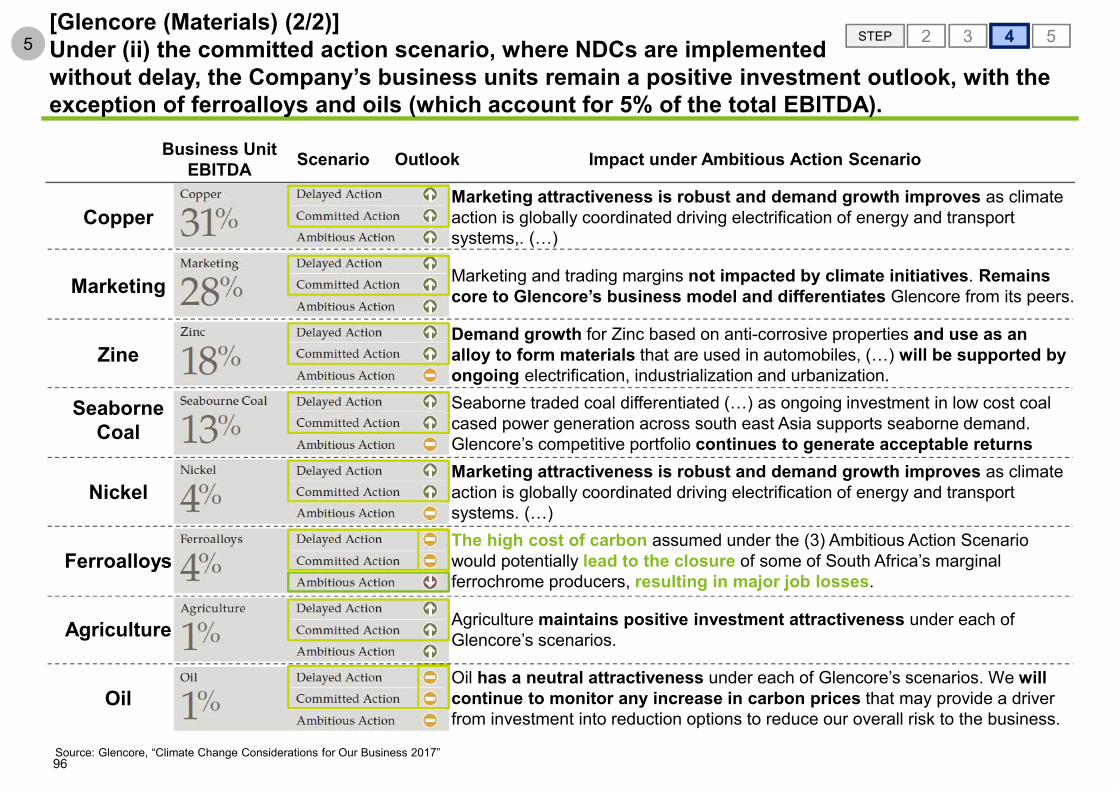
[Glencore (Materials) (2/2)]Under (ii) the committed action scenario, where NDCs are implemented without delay, the Company’s business units remain a positive investment outlook, with the exception of ferroalloys and oils (which account for 5% of the total EBITDA).
Marketing attractiveness is robust and demand growth improves as climate action is globally coordinated driving electrification of energy and transport systems,. (…)
Marketing and trading margins not impacted by climate initiatives. Remains core to Glencore’s business model and differentiates Glencore from its peers.
Demand growth for Zinc based on anti-corrosive properties and use as an alloy to form materials that are used in automobiles, (…) will be supported by ongoing electrification, industrialization and urbanization.Seaborne traded coal differentiated (…) as ongoing investment in low cost coal cased power generation across south east Asia supports seaborne demand. Glencore’s competitive portfolio continues to generate acceptable returns
The high cost of carbon assumed under the (3) Ambitious Action Scenario would potentially lead to the closure of some of South Africa’s marginal ferrochrome producers, resulting in major job losses.
Marketing attractiveness is robust and demand growth improves as climate action is globally coordinated driving electrification of energy and transport systems. (…)
Agriculture maintains positive investment attractiveness under each of Glencore’s scenarios.
Oil has a neutral attractiveness under each of Glencore’s scenarios. We will continue to monitor any increase in carbon prices that may provide a driver from investment into reduction options to reduce our overall risk to the business.
Business UnitEBITDA Scenario Outlook Impact under Ambitious Action Scenario
Copper
Marketing
Zine
Seaborne Coal
Nickel
Ferroalloys
Agriculture
Oil
Source: Glencore, “Climate Change Considerations for Our Business 2017”
5
96
4 52 3STEP

[jetBlue (Transportation) (1/2)]The Company analyzes impacts of climate-change risks and opportunities using a 2 C scenario as part of enterprise risk management (ERM)
Corporate profile: jetBlue Airways CorporationA U.S. low-cost airline headquartered in New York City and the sixth-largest airline in the U.S. JetBlue Airways operates some 1,000 flights daily and serves over 100 domestic and international destinations in 17 countries including the Caribbean,Central America and South America.
Purpose of the report:The report is designed to provide stakeholders with information about the Company’s environmental, social, and governance (ESG) performance that helps them understand the issues and trends affecting the Company’s business and how they prepare for them. It also aims to disclose information in line with the SASB and TCFD.
Identify risks to the Company
Why the Company is resilient (examples)• In 2017, three large hurricanes resulted in more than 2,500 cancelled flights and disrupted
normal operations for 30 consecutive days. Property damage was estimated at more than $200 billion, the costliest on record.
• Despite the disruption caused by the multiple hurricanes, only 1.4% of the Company’s available seat miles were cancelled in 2017 as a result of these events.
• Even a major hurricane is typically a short-term localized event. The Company was able to mitigate revenue loss from cancelled flights by redeploying flights to other destinations, which were not hit by extreme weather events.
• Due to more accurate hurricane forecasting models, the Company is able to move planes out of storm paths earlier than in the past.
Transition RisksPolicy & Legal
Higher fuel and/or carbon pricesAdditional emissions-reporting obligationsMandates on and regulation of existing products and services
Technology Cost to transition to lower-emissions technologySubstitute lower-emission options from existing products and services
Market Increased concerns of stakeholders around lower carbon service offeringsIncreased cost of materials
Reputation Shifts in consumer preferences between brands and/or modes of transportation for tourism destinationsStigmatization of sectorIncreased stakeholder concern or negative stakeholder feedback
Physical Risks
AcuteMore frequent and severe weather events (e.g., hurricanes and snow storms) leading to business interruption and damage across operations and supply chains
ChronicLong-term shifts in climate patters, possibly resulting in new storm patterns, coastal flooding, and chronic heat waves that potentially affect airports
The report gives accounts of ESG risks and specific cases (including a hurricane’s devastating impact). The report also explains the management of and resilience to risks and the reasons in the SASB or TCFD framework.The Company started scenario analysis in FY2017 and expresses its intention to continue the analysis in the coming five years.
6
97
4 52 3STEP
Source: jetBlue, “A Sustainability Accounting Standards Board (SASB) and Task Force on Climate-related Financial Disclosure (TCFD) Report”
jetBlue ”A Sustainability Accounting Standards Board (SASB) andTask Force on Climate-related Financial Disclosure (TCFD) Report”

jetBlue ”A Sustainability Accounting Standards Board (SASB) andTask Force on Climate-related Financial Disclosure (TCFD) Report”
[jetBlue (Transportation) (2/2)]The Company presents potential financial risk impacts qualitatively, and explains corporate strategy and mitigation measures.
Source: jetBlue, “A Sustainability Accounting Standards Board (SASB) and Task Force on Climate-related Financial Disclosure (TCFD) Report”
Transition Risk Physical Risk
6
98
4 52 3STEP
Climate-related Risk Potential Financial Impact
Strategy and Mitigation Measures
Policy & Legal
• Increased climate change related regulation and policies resulting in:
Higher fuel and/or carbon prices
Additional emissions-reporting obligations
Mandates on and regulation of existing products and services
• Higher compliance and mitigation costs
Preparation for Regulatory Change
• Implementation of monitoring, data aggregation, and calculations required by new regulations before mandated implementation
• Reporting in accordance withSASB, TCFD, and other reporting schemes
• Proactive emissions offsetting to establish relationships and processes
• Engagement with regulations and industry organizations
• Cost reduction activities
Enhanced Data Analytics
• Monitor fuel consumption and resulting carbon emissions
• Model or forecast carbon-related costs to determine economic impact
Climate-related Risk Potential Financial Impact
Strategy and Mitigation Measures
Acute
• More frequent and severe weather events(e.g., hurricanes and snow storms) leading to business interruption and damage across operations and supply chain (including aircrafts and/or fuel supply)
• Loss of revenues
• Increased costs in the form of operationalstrain, customer compensation, and crewmember overtime pay
• Established operating procedures that allow us to cancel flights early if we predict that extreme weather will impact safety, inconvenience customers, or disrupt crewmembers’ ability to perform
• Coastal assessments and management plans
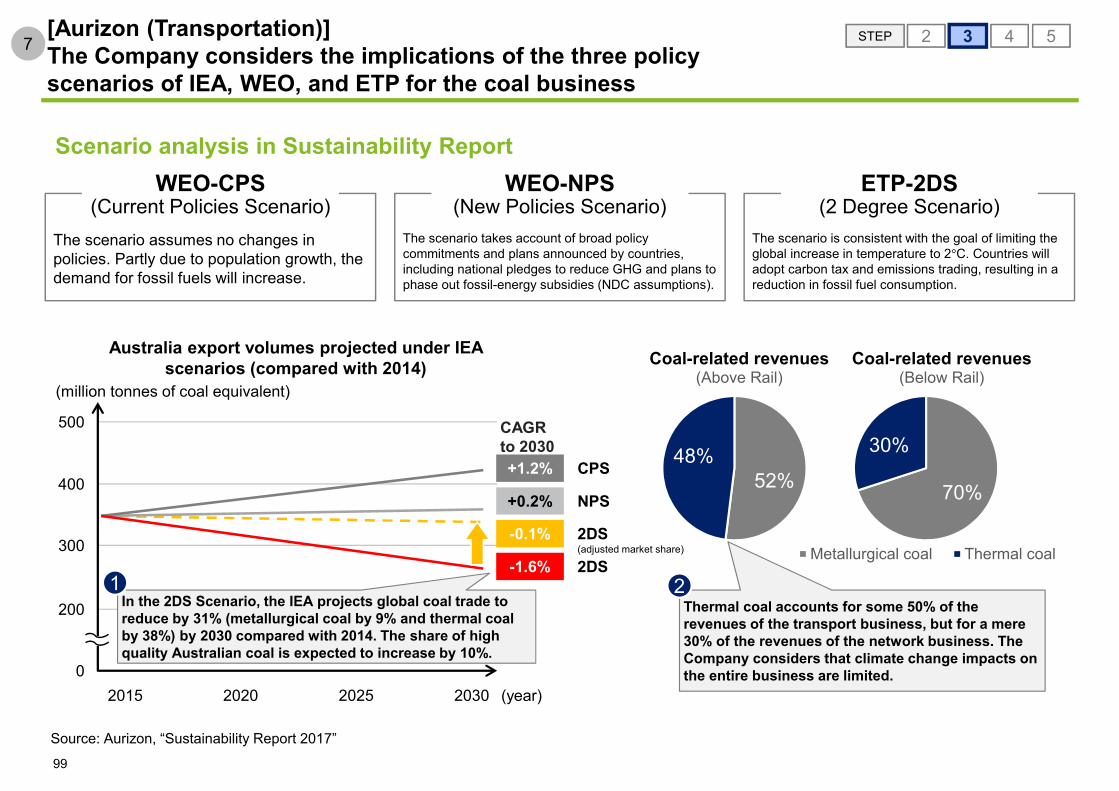
[Aurizon (Transportation)]The Company considers the implications of the three policy scenarios of IEA, WEO, and ETP for the coal business
Scenario analysis in Sustainability Report
Source: Aurizon, “Sustainability Report 2017”
The scenario assumes no changes in policies. Partly due to population growth, the demand for fossil fuels will increase.
The scenario takes account of broad policy commitments and plans announced by countries, including national pledges to reduce GHG and plans to phase out fossil-energy subsidies (NDC assumptions).
The scenario is consistent with the goal of limiting the global increase in temperature to 2 C. Countries will adopt carbon tax and emissions trading, resulting in a reduction in fossil fuel consumption.
70%
30%
Coal-related revenues(Below Rail)
Metallurgical coal Thermal coal
2025 20302015 20200
200
300
400
500
(million tonnes of coal equivalent)
(year)
+1.2%
+0.2%
-0.1%
-1.6%
CAGR to 2030
CPS
NPS
2DS (adjusted market share)
2DS
Australia export volumes projected under IEA scenarios (compared with 2014)
In the 2DS Scenario, the IEA projects global coal trade to reduce by 31% (metallurgical coal by 9% and thermal coal by 38%) by 2030 compared with 2014. The share of high quality Australian coal is expected to increase by 10%.
52%48%
Coal-related revenues(Above Rail)
Thermal coal accounts for some 50% of the revenues of the transport business, but for a mere 30% of the revenues of the network business. The Company considers that climate change impacts on the entire business are limited.
1 2
7
99
4 52 3STEP
WEO-CPS(Current Policies Scenario)
WEO-NPS(New Policies Scenario)
ETP-2DS(2 Degree Scenario)
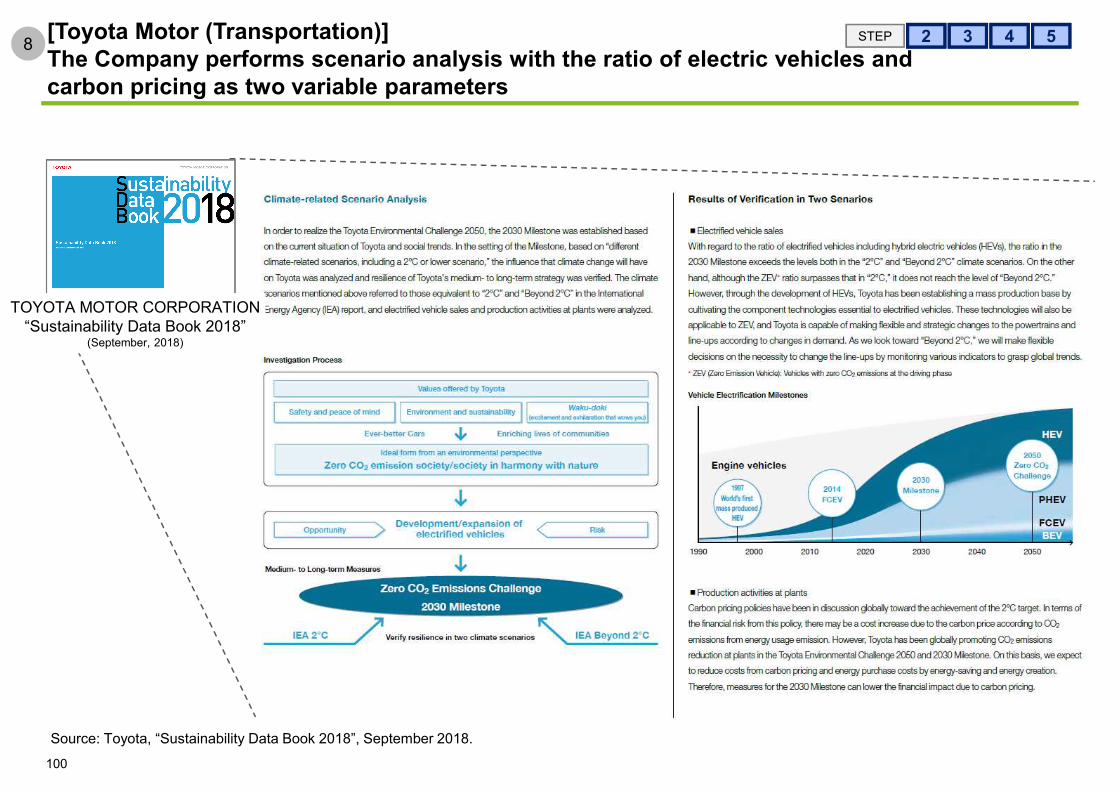
[Toyota Motor (Transportation)]The Company performs scenario analysis with the ratio of electric vehicles and carbon pricing as two variable parameters
Source: Toyota, “Sustainability Data Book 2018”, September 2018.
8
100
4 52 3STEP
TOYOTA MOTOR CORPORATION“Sustainability Data Book 2018”
(September, 2018)
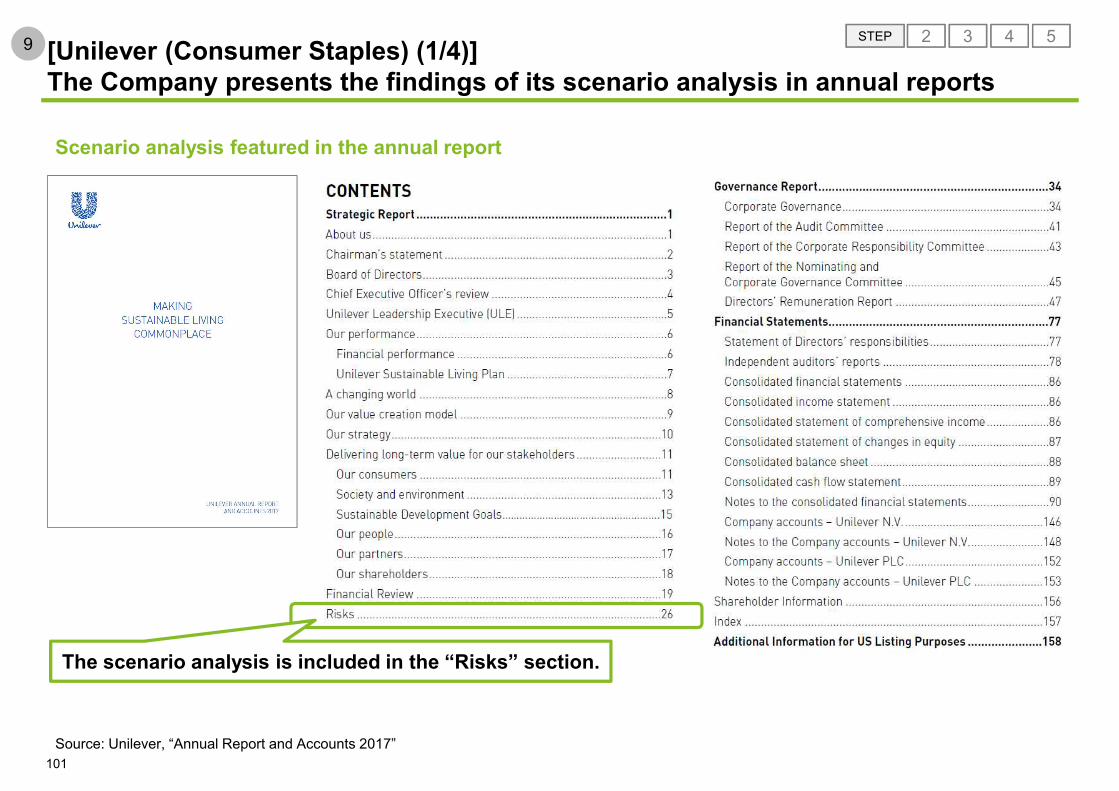
Scenario analysis featured in the annual report
[Unilever (Consumer Staples) (1/4)]The Company presents the findings of its scenario analysis in annual reports
The scenario analysis is included in the “Risks” section.
Source: Unilever, “Annual Report and Accounts 2017”
9
101
4 52 3STEP
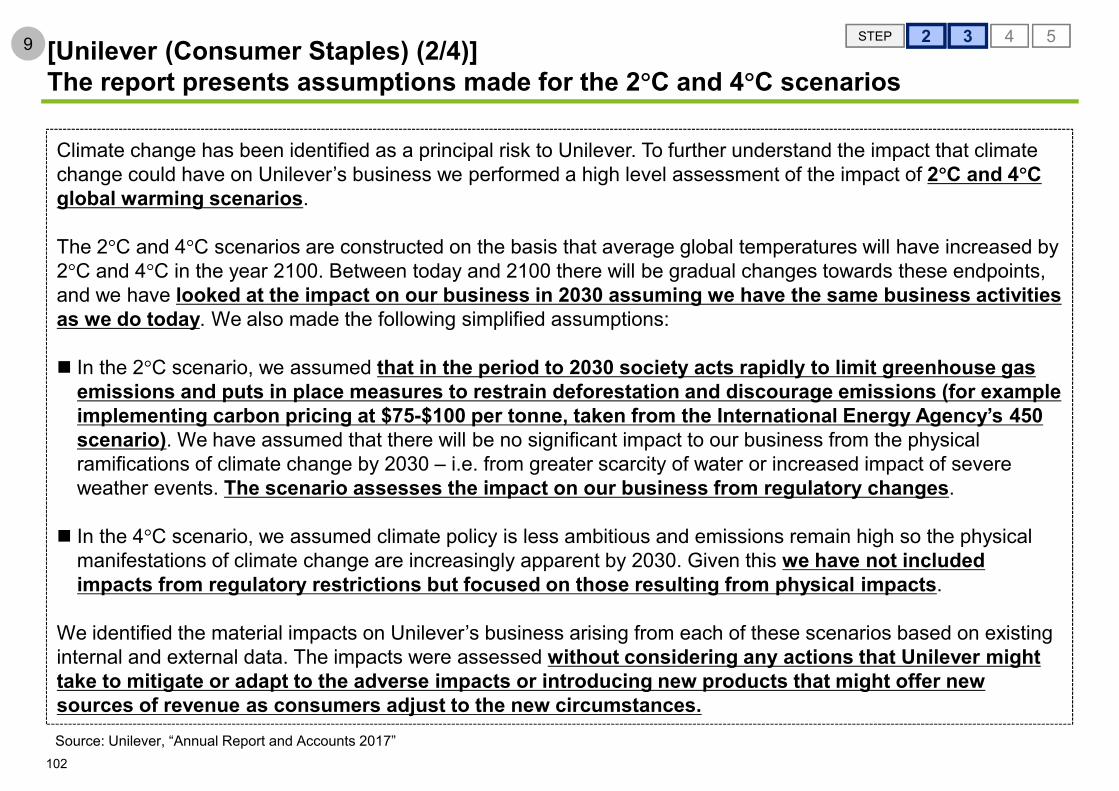
[Unilever (Consumer Staples) (2/4)]The report presents assumptions made for the 2 C and 4 C scenarios
Source: Unilever, “Annual Report and Accounts 2017”
9
102
4 52 3STEP
Climate change has been identified as a principal risk to Unilever. To further understand the impact that climatechange could have on Unilever’s business we performed a high level assessment of the impact of 2 C and 4 C global warming scenarios.
The 2 C and 4 C scenarios are constructed on the basis that average global temperatures will have increased by 2 C and 4 C in the year 2100. Between today and 2100 there will be gradual changes towards these endpoints, and we have looked at the impact on our business in 2030 assuming we have the same business activities as we do today. We also made the following simplified assumptions:
In the 2 C scenario, we assumed that in the period to 2030 society acts rapidly to limit greenhouse gas emissions and puts in place measures to restrain deforestation and discourage emissions (for example implementing carbon pricing at $75-$100 per tonne, taken from the International Energy Agency’s 450 scenario). We have assumed that there will be no significant impact to our business from the physical ramifications of climate change by 2030 – i.e. from greater scarcity of water or increased impact of severe weather events. The scenario assesses the impact on our business from regulatory changes.
In the 4 C scenario, we assumed climate policy is less ambitious and emissions remain high so the physical manifestations of climate change are increasingly apparent by 2030. Given this we have not included impacts from regulatory restrictions but focused on those resulting from physical impacts.
We identified the material impacts on Unilever’s business arising from each of these scenarios based on existing internal and external data. The impacts were assessed without considering any actions that Unilever might take to mitigate or adapt to the adverse impacts or introducing new products that might offer new sources of revenue as consumers adjust to the new circumstances.

[Unilever (Consumer Staples) (3/4)]The report presents the findings of analysis under the 2 C and 4 C scenarios
Source: Unilever, “Annual Report and Accounts 2017”
9
103
4 52 3STEP
The main Impacts of the 2 C scenario were as follows:Carbon pricing is introduced in key countries and hence there are increases in both manufacturing costs and the costs of raw materials such as dairy ingredients and the metals used in packagingZero net deforestation requirements are introduced and a shift to sustainable agriculture puts pressure on agricultural production, raising the price of certain raw materials
The main impacts of the 4 C scenario were as follows:Chronic and acute water stress reduces agricultural productivity in some regions, raising prices of raw materialsIncreased frequency of extreme weather (storms and floods) causes increased incidence of disruption to our manufacturing and distribution networksTemperature increase and extreme weather events reduce economic activity, GDP growth and hence sales levels fall
Our analysis shows that, without action, both scenarios present financial risks to Unilever by 2030, predominantly due to increased costs. However, while there are financial risks that would need to be managed, we would not have to materially change our business model. The most significant impacts of both scenarios are on our supply chain where costs of raw materials and packaging rise due to carbon pricing and rapid shift to sustainable agriculture in a 2 C scenario and due to chronic water stress and extreme weather in a 4 C scenario. The impacts on sales and our own manufacturing operations are relatively small.
The results of this analysis confirm the importance of doing further work to ensure that we understand the critical dependencies of climate change on our business and to ensure we have action plans in place to help mitigate these risks and thus prepare the business for the future environment in which we will operate. We plan to conduct further analysis on the impact of climate change on our agricultural supply chain and the impact of changing weather patterns (including both persistent effects such as droughts and the temporary effects of storms) on critical markets and manufacturing.
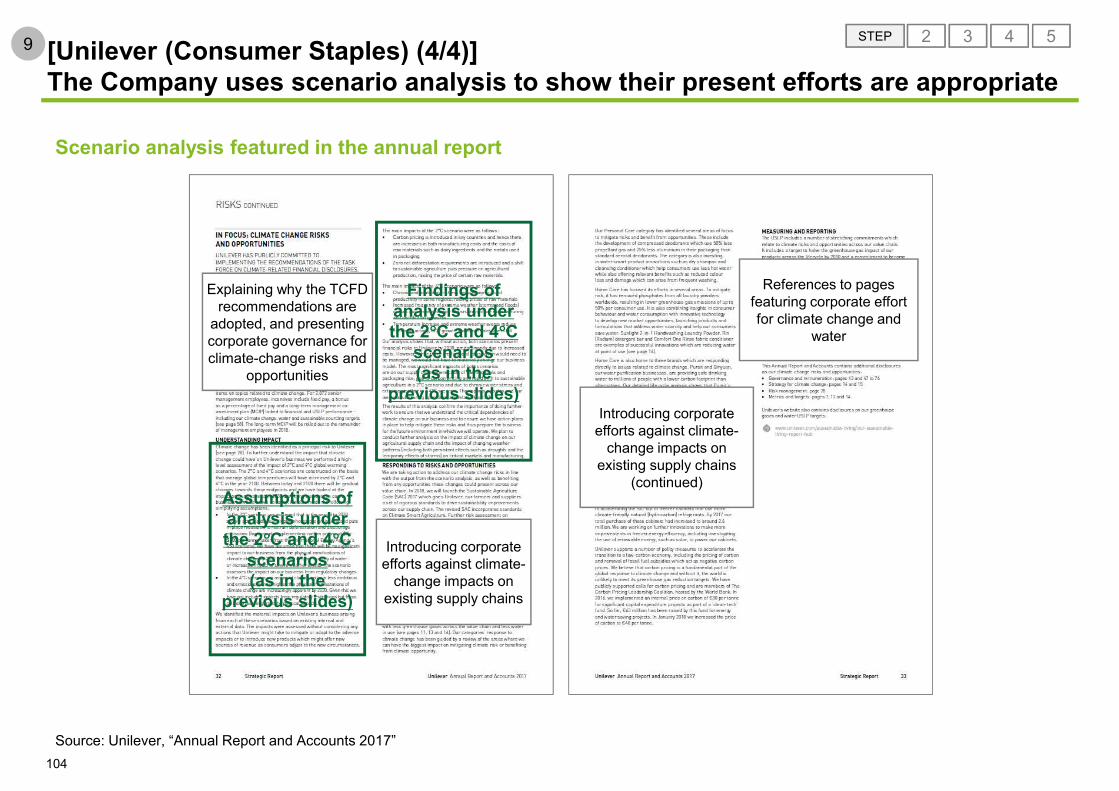
Scenario analysis featured in the annual report
[Unilever (Consumer Staples) (4/4)]The Company uses scenario analysis to show their present efforts are appropriate
Assumptions of analysis under the 2 C and 4 C
scenarios(as in the
previous slides)
Findings of analysis under the 2 C and 4 C
scenarios(as in the
previous slides)
Introducing corporate efforts against climate-
change impacts on existing supply chains
References to pages featuring corporate effortfor climate change and
water
Explaining why the TCFD recommendations are
adopted, and presenting corporate governance for climate-change risks and
opportunities
Introducing corporate efforts against climate-
change impacts on existing supply chains
(continued)
Source: Unilever, “Annual Report and Accounts 2017”
9
104
4 52 3STEP
Chapter 4 References on Degree of Risk Importance in Selected Sectors This chapter provides materials for scenario analysis, part of which were used for assessment of the degree of risk importance under the Ministry’s support program.
105
4. References on Degree of Risk Importance in Selected Sectors i. Energy Sectorii. Transportation Sector (Maritime
Transportation, Passenger Air Transportation, Automobiles)
iii. Buildings/Forest Products Sector
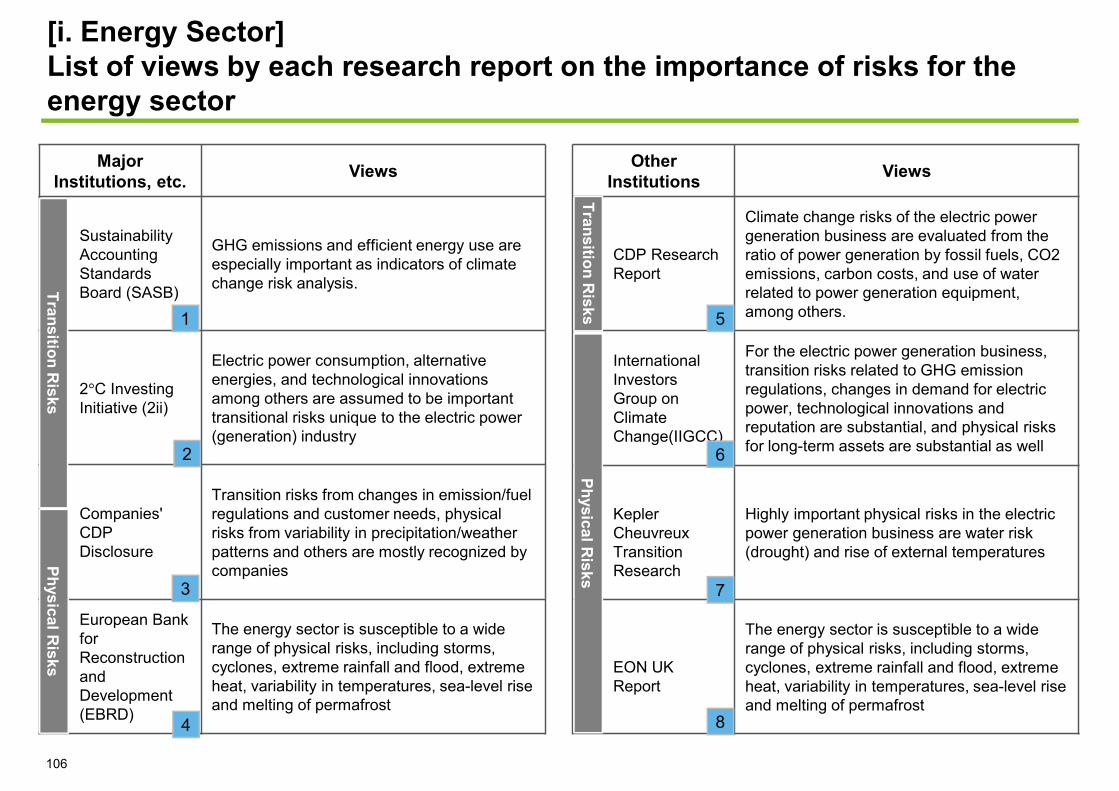
[i. Energy Sector]List of views by each research report on the importance of risks for the energy sector
Major Institutions, etc. Views
Sustainability Accounting Standards Board (SASB)
GHG emissions and efficient energy use are especially important as indicators of climate change risk analysis.
2 C Investing Initiative (2ii)
Electric power consumption, alternative energies, and technological innovations among others are assumed to be important transitional risks unique to the electric power (generation) industry
Companies' CDP Disclosure
Transition risks from changes in emission/fuel regulations and customer needs, physical risks from variability in precipitation/weather patterns and others are mostly recognized by companies
European Bank for Reconstruction and Development (EBRD)
The energy sector is susceptible to a wide range of physical risks, including storms, cyclones, extreme rainfall and flood, extreme heat, variability in temperatures, sea-level rise and melting of permafrost
Transition Risks
Physical Risks
1
2
3
4
Other Institutions Views
CDP Research Report
Climate change risks of the electric power generation business are evaluated from the ratio of power generation by fossil fuels, CO2 emissions, carbon costs, and use of water related to power generation equipment, among others.
International Investors Group on Climate Change(IIGCC)
For the electric power generation business, transition risks related to GHG emission regulations, changes in demand for electric power, technological innovations and reputation are substantial, and physical risks for long-term assets are substantial as well
Kepler Cheuvreux Transition Research
Highly important physical risks in the electric power generation business are water risk (drought) and rise of external temperatures
EON UK Report
The energy sector is susceptible to a wide range of physical risks, including storms, cyclones, extreme rainfall and flood, extreme heat, variability in temperatures, sea-level rise and melting of permafrost
Transition Risks
Physical Risks
5
6
7
8
106
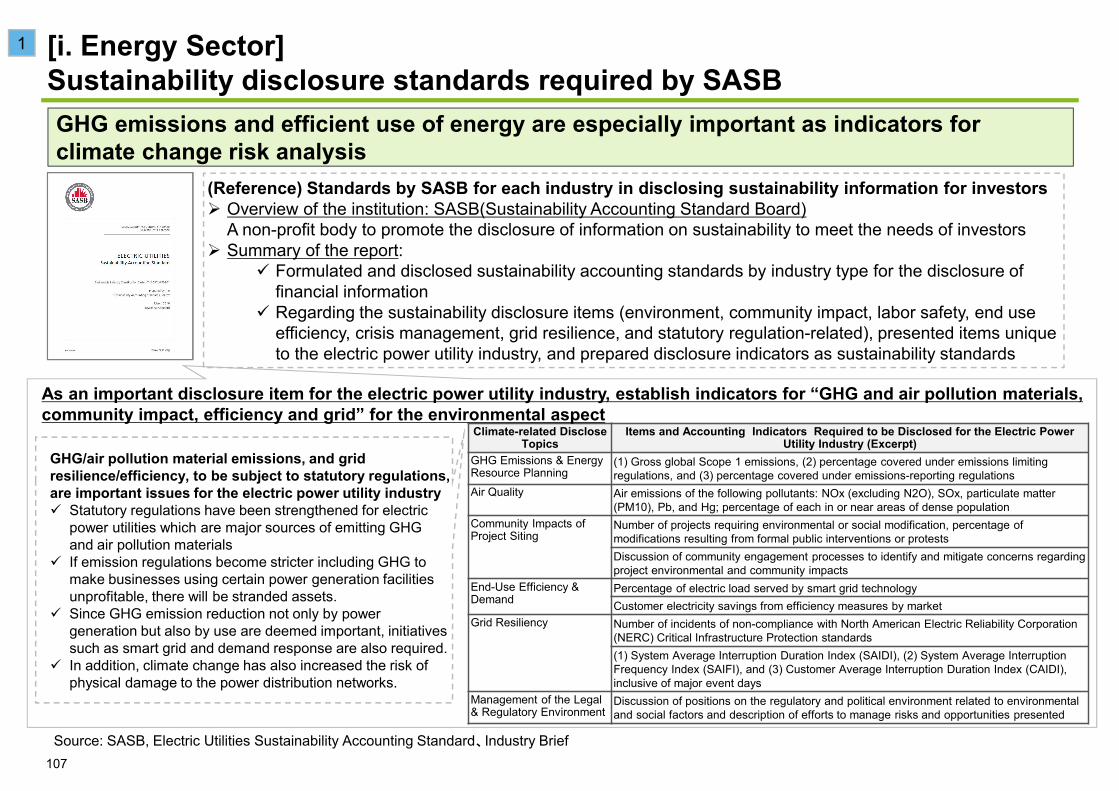
Source: SASB, Electric Utilities Sustainability Accounting Standard、Industry Brief
Climate-related Disclose Topics
Items and Accounting Indicators Required to be Disclosed for the Electric Power Utility Industry (Excerpt)
GHG Emissions & Energy Resource Planning
(1) Gross global Scope 1 emissions, (2) percentage covered under emissions limiting regulations, and (3) percentage covered under emissions-reporting regulations
Air Quality Air emissions of the following pollutants: NOx (excluding N2O), SOx, particulate matter (PM10), Pb, and Hg; percentage of each in or near areas of dense population
Community Impacts of Project Siting
Number of projects requiring environmental or social modification, percentage of modifications resulting from formal public interventions or protestsDiscussion of community engagement processes to identify and mitigate concerns regarding project environmental and community impacts
End-Use Efficiency & Demand
Percentage of electric load served by smart grid technologyCustomer electricity savings from efficiency measures by market
Grid Resiliency Number of incidents of non-compliance with North American Electric Reliability Corporation (NERC) Critical Infrastructure Protection standards(1) System Average Interruption Duration Index (SAIDI), (2) System Average Interruption Frequency Index (SAIFI), and (3) Customer Average Interruption Duration Index (CAIDI), inclusive of major event days
Management of the Legal & Regulatory Environment
Discussion of positions on the regulatory and political environment related to environmental and social factors and description of efforts to manage risks and opportunities presented
(Reference) Standards by SASB for each industry in disclosing sustainability information for investorsOverview of the institution: SASB(Sustainability Accounting Standard Board)A non-profit body to promote the disclosure of information on sustainability to meet the needs of investors Summary of the report:
Formulated and disclosed sustainability accounting standards by industry type for the disclosure of financial informationRegarding the sustainability disclosure items (environment, community impact, labor safety, end use efficiency, crisis management, grid resilience, and statutory regulation-related), presented items unique to the electric power utility industry, and prepared disclosure indicators as sustainability standards
As an important disclosure item for the electric power utility industry, establish indicators for “GHG and air pollution materials, community impact, efficiency and grid” for the environmental aspect
GHG/air pollution material emissions, and grid resilience/efficiency, to be subject to statutory regulations, are important issues for the electric power utility industry
Statutory regulations have been strengthened for electric power utilities which are major sources of emitting GHG and air pollution materialsIf emission regulations become stricter including GHG to make businesses using certain power generation facilities unprofitable, there will be stranded assets.Since GHG emission reduction not only by power generation but also by use are deemed important, initiatives such as smart grid and demand response are also required.In addition, climate change has also increased the risk of physical damage to the power distribution networks.
[i. Energy Sector]Sustainability disclosure standards required by SASB
1
107
GHG emissions and efficient use of energy are especially important as indicators for climate change risk analysis

[i. Energy Sector]Transition Risk Scenarios by 2ii
Trends BackgroundConsumption is expected to increase globally
Demand changes will respond mainly to efficiency measures, and macroeconomic and demographic factors. These factors imply that dynamics in developed and developing economies will be different, with the demand in the latter increasing at a higher pace In some countries.
Fuel Switch The shift from fossil fuels to renewable energy-based power is going to be driven by three main forces: The increase of thermal coal, gas and CO2 prices, the support from policymakers for the development of new low-carbon technologies and the decreasing marginal costs of renewable power production. Under both the LCT and the ACT scenarios, the total share of fossil fuels will decrease. Under the ACT the share of renewables need to surpass that of fossil fuels to achieve the 2 C target.
Policy- and market induced technology change
Incentives from policymakers will enable the transition from a fossil fuel-based economy to a renewable based one. Policy instruments such as subsidies, taxes and levies can be put in place to enable this transition. Most of the countries under scope have already started to incentivize renewables and/or disincentivize fossil fuels-based power generation as part of their strategy to achieve their long-term renewables share targets. In addition to policies, changes in the relative economics of renewabletechnologies versus fossil fuels are similarly expected to drive fuel switching.
(Reference) Transition risk scenario by 2 C investing initiative for companies responding to TCFD recommendations
Overview of the institution: 2 C investing initiativeA think tank developing climate change risk indicators and policy options in the financial markets Purpose of the report:
To present transition scenarios in line with TCFD recommendations, which companies can refer to when conducting financial risk analysis and scenario analysis (ACT (ambitious climate transition) assuming +2 C world and LCT (limited climate transition) with +3-4 C)To establish important parameters for each of 8 sectors with large energy consumption, such as the electric power industry and automobile industry, and consider how parameters should be based on the existing scenarios such as IEA.
Deriving 5 risk analysis parameters based on the expected trend of the electric power (generation) industry toward low carbonization
Category Parameters
Production & Technology
#1 Electricity production (TWh)#2 Electricity capacity (GW)
Market pricing#3 Levelised costs of electricity(EUR/Mwh)
Policy Mandates, Incentives & Taxes #4 Subsidies (EUR/Mwh)
#5 Effective carbon rates (EUR/tCO2)
108
Electric power consumption, alternative fuels, and technological innovations among others are important transition risks unique to the electric power (generation) industry
2
Source: 2ii.& The CO-Firm. “The Transition Risk-O-Meter”. 2017.
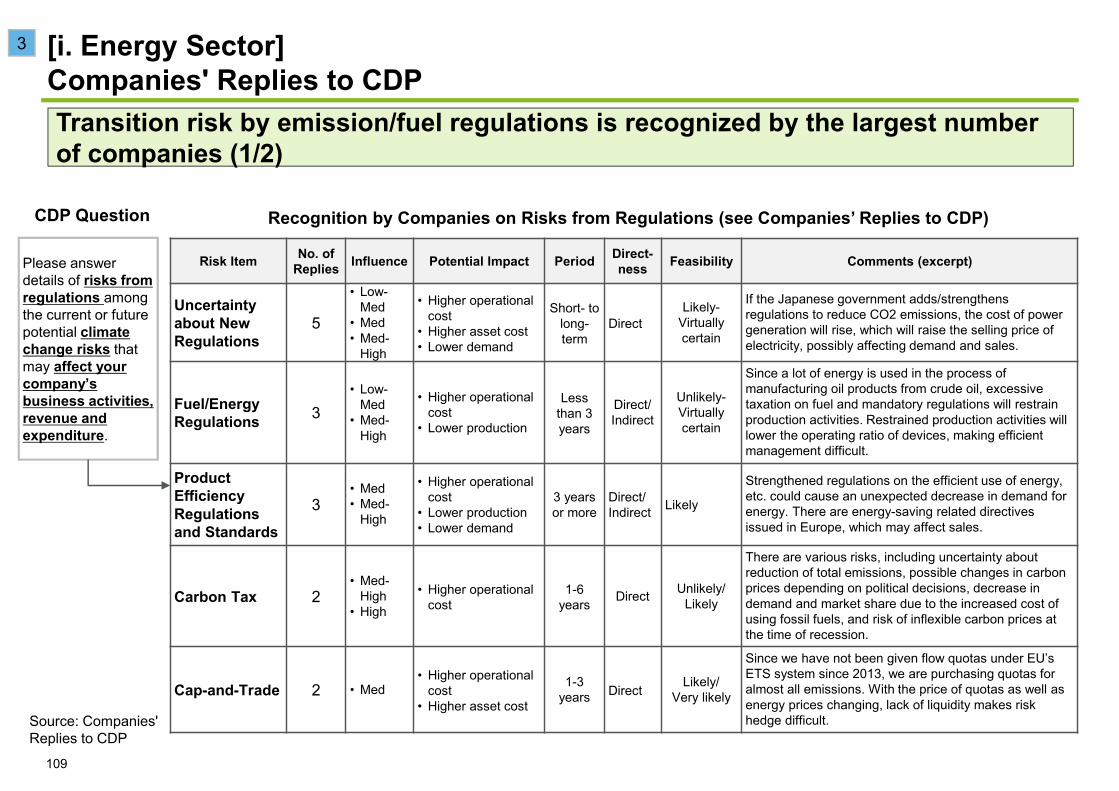
[i. Energy Sector]Companies' Replies to CDP
Risk Item No. of Replies Influence Potential Impact Period Direct-
ness Feasibility Comments (excerpt)
Uncertainty about New Regulations
5
• Low-Med
• Med• Med-
High
• Higher operational cost
• Higher asset cost• Lower demand
Short- to long-term
DirectLikely-
Virtuallycertain
If the Japanese government adds/strengthens regulations to reduce CO2 emissions, the cost of power generation will rise, which will raise the selling price of electricity, possibly affecting demand and sales.
Fuel/Energy Regulations 3
• Low-Med
• Med-High
• Higher operational cost
• Lower production
Less than 3 years
Direct/Indirect
Unlikely-Virtually certain
Since a lot of energy is used in the process of manufacturing oil products from crude oil, excessive taxation on fuel and mandatory regulations will restrain production activities. Restrained production activities will lower the operating ratio of devices, making efficient management difficult.
Product Efficiency Regulations and Standards
3• Med• Med-
High
• Higher operational cost
• Lower production• Lower demand
3 years or more
Direct/Indirect Likely
Strengthened regulations on the efficient use of energy, etc. could cause an unexpected decrease in demand for energy. There are energy-saving related directives issued in Europe, which may affect sales.
Carbon Tax 2• Med-
High• High
• Higher operational cost
1-6 years Direct Unlikely/
Likely
There are various risks, including uncertainty about reduction of total emissions, possible changes in carbon prices depending on political decisions, decrease in demand and market share due to the increased cost of using fossil fuels, and risk of inflexible carbon prices at the time of recession.
Cap-and-Trade 2 • Med• Higher operational
cost• Higher asset cost
1-3 years Direct Likely/
Very likely
Since we have not been given flow quotas under EU’s ETS system since 2013, we are purchasing quotas for almost all emissions. With the price of quotas as well as energy prices changing, lack of liquidity makes risk hedge difficult.
Recognition by Companies on Risks from Regulations (see Companies’ Replies to CDP)
Please answer details of risks from regulations among the current or future potential climate change risks that may affect your company’s business activities, revenue and expenditure.
CDP Question
109
Transition risk by emission/fuel regulations is recognized by the largest number of companies (1/2)
3
Source: Companies' Replies to CDP
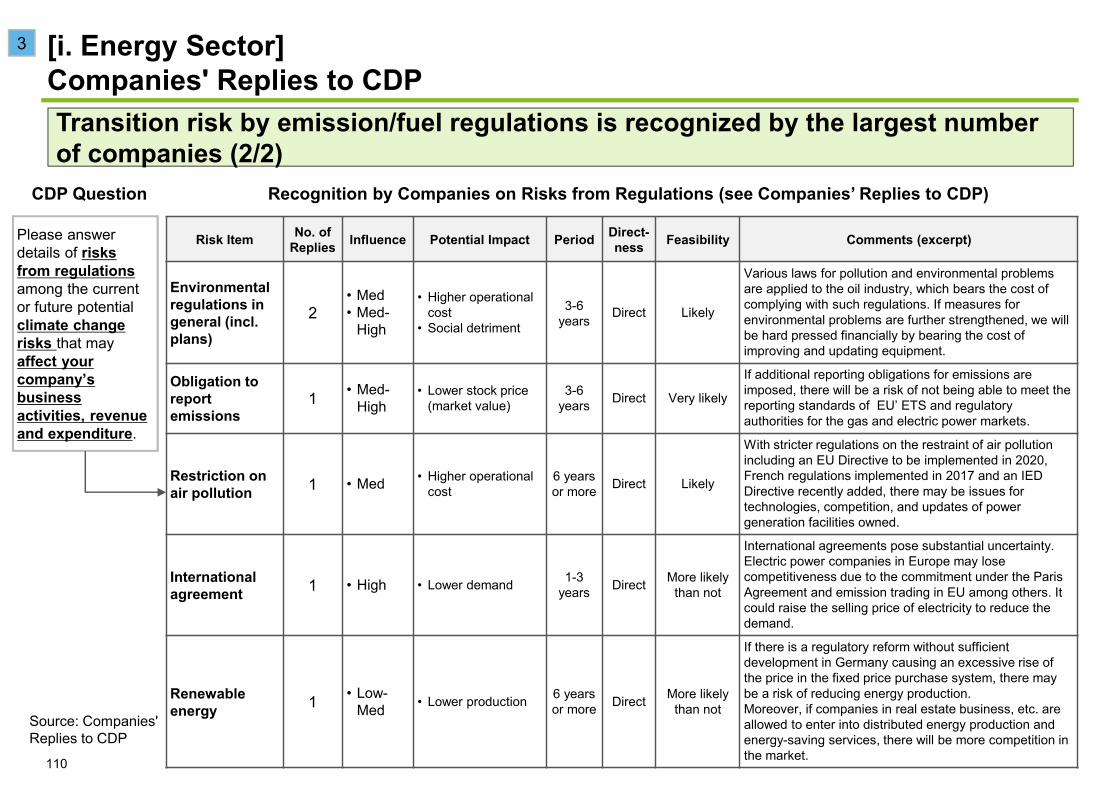
[i. Energy Sector]Companies' Replies to CDP
Risk Item No. of Replies Influence Potential Impact Period Direct-
ness Feasibility Comments (excerpt)
Environmental regulations in general (incl. plans)
2• Med• Med-
High
• Higher operational cost
• Social detriment
3-6 years Direct Likely
Various laws for pollution and environmental problems are applied to the oil industry, which bears the cost of complying with such regulations. If measures for environmental problems are further strengthened, we will be hard pressed financially by bearing the cost of improving and updating equipment.
Obligation to report emissions
1 • Med-High
• Lower stock price (market value)
3-6 years Direct Very likely
If additional reporting obligations for emissions are imposed, there will be a risk of not being able to meet the reporting standards of EU’ ETS and regulatory authorities for the gas and electric power markets.
Restriction on air pollution 1 • Med • Higher operational
cost6 years or more Direct Likely
With stricter regulations on the restraint of air pollution including an EU Directive to be implemented in 2020, French regulations implemented in 2017 and an IED Directive recently added, there may be issues for technologies, competition, and updates of power generation facilities owned.
International agreement 1 • High • Lower demand 1-3
years Direct More likely than not
International agreements pose substantial uncertainty. Electric power companies in Europe may lose competitiveness due to the commitment under the Paris Agreement and emission trading in EU among others. It could raise the selling price of electricity to reduce the demand.
Renewable energy 1 • Low-
Med • Lower production 6 years or more Direct More likely
than not
If there is a regulatory reform without sufficientdevelopment in Germany causing an excessive rise of the price in the fixed price purchase system, there may be a risk of reducing energy production. Moreover, if companies in real estate business, etc. are allowed to enter into distributed energy production and energy-saving services, there will be more competition in the market.
Recognition by Companies on Risks from Regulations (see Companies’ Replies to CDP)
Please answer details of risks from regulations among the current or future potential climate change risks that may affect your company’s business activities, revenue and expenditure.
CDP Question
110
3
Transition risk by emission/fuel regulations is recognized by the largest number of companies (2/2)
Source: Companies' Replies to CDP
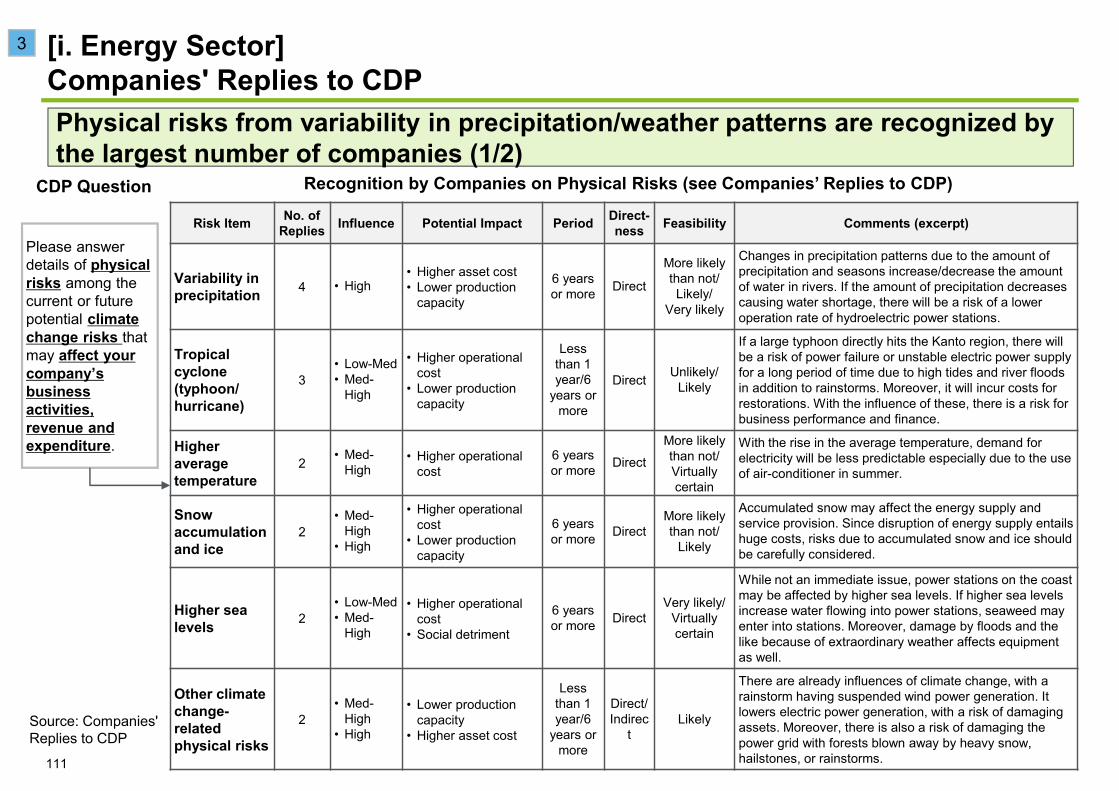
[i. Energy Sector]Companies' Replies to CDP
Source: Companies' Replies to CDP
Recognition by Companies on Physical Risks (see Companies’ Replies to CDP)CDP Question
Please answer details of physical risks among the current or future potential climate change risks that may affect your company’s business activities, revenue and expenditure.
Risk Item No. of Replies Influence Potential Impact Period Direct-
ness Feasibility Comments (excerpt)
Variability in precipitation 4 • High
• Higher asset cost• Lower production
capacity
6 years or more Direct
More likely than not/Likely/
Very likely
Changes in precipitation patterns due to the amount of precipitation and seasons increase/decrease the amount of water in rivers. If the amount of precipitation decreases causing water shortage, there will be a risk of a lower operation rate of hydroelectric power stations.
Tropical cyclone (typhoon/ hurricane)
3• Low-Med• Med-
High
• Higher operational cost
• Lower production capacity
Less than 1 year/6
years or more
Direct Unlikely/Likely
If a large typhoon directly hits the Kanto region, there will be a risk of power failure or unstable electric power supply for a long period of time due to high tides and river floods in addition to rainstorms. Moreover, it will incur costs for restorations. With the influence of these, there is a risk for business performance and finance.
Higher average temperature
2 • Med-High
• Higher operational cost
6 years or more Direct
More likelythan not/Virtuallycertain
With the rise in the average temperature, demand for electricity will be less predictable especially due to the use of air-conditioner in summer.
Snow accumulation and ice
2• Med-
High• High
• Higher operational cost
• Lower production capacity
6 years or more Direct
More likelythan not/
Likely
Accumulated snow may affect the energy supply and service provision. Since disruption of energy supply entails huge costs, risks due to accumulated snow and ice should be carefully considered.
Higher sea levels 2
• Low-Med• Med-
High
• Higher operational cost
• Social detriment
6 years or more Direct
Very likely/Virtually certain
While not an immediate issue, power stations on the coast may be affected by higher sea levels. If higher sea levels increase water flowing into power stations, seaweed mayenter into stations. Moreover, damage by floods and the like because of extraordinary weather affects equipment as well.
Other climate change-related physical risks
2• Med-
High• High
• Lower production capacity
• Higher asset cost
Less than 1 year/6
years or more
Direct/Indirec
tLikely
There are already influences of climate change, with a rainstorm having suspended wind power generation. It lowers electric power generation, with a risk of damaging assets. Moreover, there is also a risk of damaging the power grid with forests blown away by heavy snow, hailstones, or rainstorms.111
3
Physical risks from variability in precipitation/weather patterns are recognized by the largest number of companies (1/2)
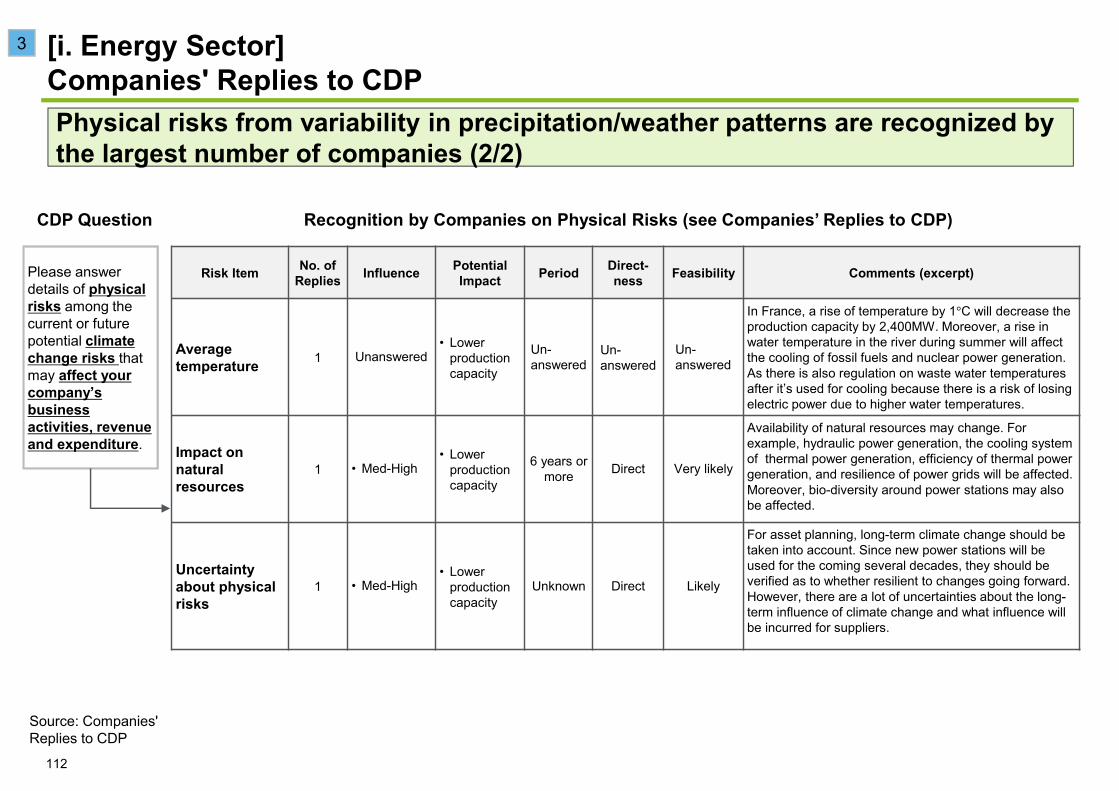
[i. Energy Sector]Companies' Replies to CDP
Recognition by Companies on Physical Risks (see Companies’ Replies to CDP)CDP Question
Please answer details of physicalrisks among the current or future potential climate change risks that may affect your company’s business activities, revenue and expenditure.
Risk Item No. of Replies Influence Potential
Impact Period Direct-ness Feasibility Comments (excerpt)
Average temperature 1 Unanswered
• Lower production capacity
Un-answered
Un-answered
Un-answered
In France, a rise of temperature by 1 C will decrease the production capacity by 2,400MW. Moreover, a rise in water temperature in the river during summer will affect the cooling of fossil fuels and nuclear power generation. As there is also regulation on waste water temperatures after it’s used for cooling because there is a risk of losing electric power due to higher water temperatures.
Impact on natural resources
1 • Med-High• Lower
production capacity
6 years or more Direct Very likely
Availability of natural resources may change. For example, hydraulic power generation, the cooling system of thermal power generation, efficiency of thermal power generation, and resilience of power grids will be affected.Moreover, bio-diversity around power stations may also be affected.
Uncertainty about physical risks
1 • Med-High• Lower
production capacity
Unknown Direct Likely
For asset planning, long-term climate change should be taken into account. Since new power stations will be used for the coming several decades, they should be verified as to whether resilient to changes going forward.However, there are a lot of uncertainties about the long-term influence of climate change and what influence will be incurred for suppliers.
112
3
Physical risks from variability in precipitation/weather patterns are recognized by the largest number of companies (2/2)
Source: Companies' Replies to CDP
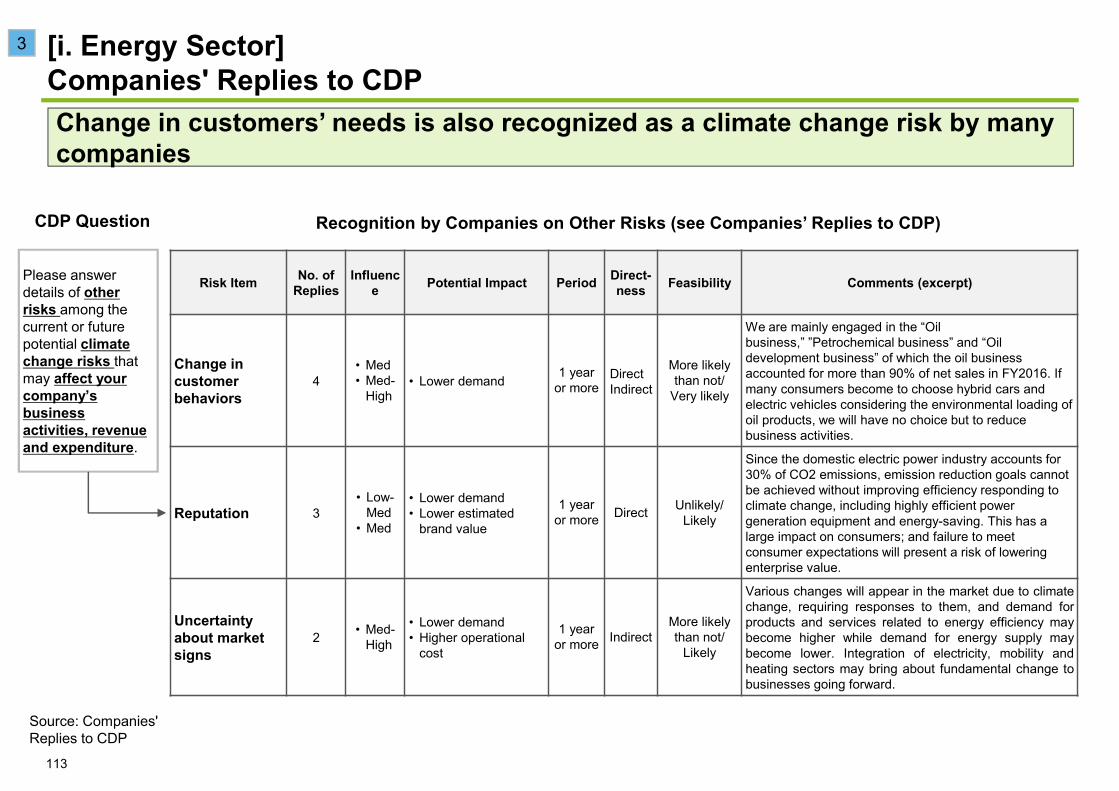
[i. Energy Sector]Companies' Replies to CDP
Recognition by Companies on Other Risks (see Companies’ Replies to CDP)CDP Question
Please answer details of other risks among the current or future potential climate change risks that may affect your company’s business activities, revenue and expenditure.
Risk Item No. of Replies
Influence Potential Impact Period Direct-
ness Feasibility Comments (excerpt)
Change in customerbehaviors
4• Med• Med-
High• Lower demand 1 year
or moreDirectIndirect
More likely than not/
Very likely
We are mainly engaged in the “Oil business,” ”Petrochemical business” and “Oil development business” of which the oil business accounted for more than 90% of net sales in FY2016. If many consumers become to choose hybrid cars and electric vehicles considering the environmental loading of oil products, we will have no choice but to reduce business activities.
Reputation 3• Low-
Med• Med
• Lower demand• Lower estimated
brand value
1 year or more Direct Unlikely/
Likely
Since the domestic electric power industry accounts for 30% of CO2 emissions, emission reduction goals cannot be achieved without improving efficiency responding to climate change, including highly efficient power generation equipment and energy-saving. This has a large impact on consumers; and failure to meet consumer expectations will present a risk of lowering enterprise value.
Uncertainty about market signs
2 • Med-High
• Lower demand• Higher operational
cost
1 year or more Indirect
More likely than not/
Likely
Various changes will appear in the market due to climatechange, requiring responses to them, and demand forproducts and services related to energy efficiency maybecome higher while demand for energy supply maybecome lower. Integration of electricity, mobility andheating sectors may bring about fundamental change tobusinesses going forward.
113
3
Change in customers’ needs is also recognized as a climate change risk by many companies
Source: Companies' Replies to CDP
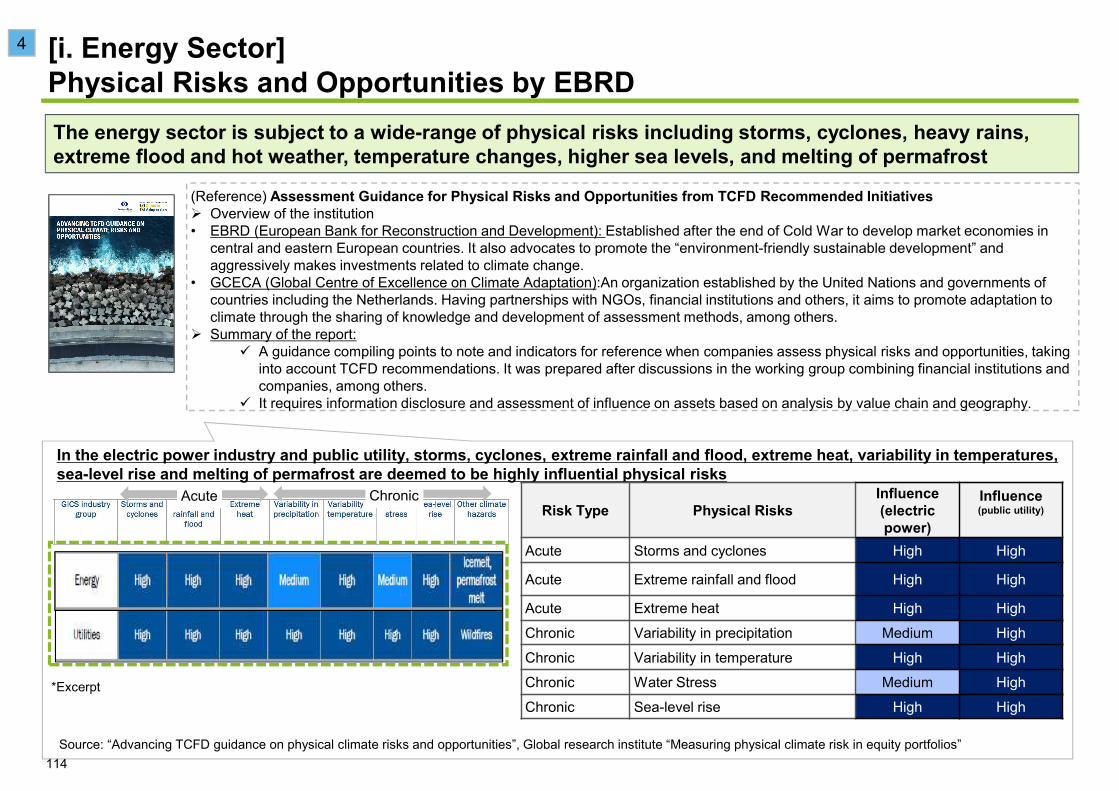
[i. Energy Sector] Physical Risks and Opportunities by EBRD
(Reference) Assessment Guidance for Physical Risks and Opportunities from TCFD Recommended InitiativesOverview of the institution
• EBRD (European Bank for Reconstruction and Development): Established after the end of Cold War to develop market economies in central and eastern European countries. It also advocates to promote the “environment-friendly sustainable development” and aggressively makes investments related to climate change.
• GCECA (Global Centre of Excellence on Climate Adaptation):An organization established by the United Nations and governments of countries including the Netherlands. Having partnerships with NGOs, financial institutions and others, it aims to promote adaptation to climate through the sharing of knowledge and development of assessment methods, among others.Summary of the report:
A guidance compiling points to note and indicators for reference when companies assess physical risks and opportunities, taking into account TCFD recommendations. It was prepared after discussions in the working group combining financial institutions and companies, among others. It requires information disclosure and assessment of influence on assets based on analysis by value chain and geography.
In the electric power industry and public utility, storms, cyclones, extreme rainfall and flood, extreme heat, variability in temperatures, sea-level rise and melting of permafrost are deemed to be highly influential physical risks
Source: “Advancing TCFD guidance on physical climate risks and opportunities”, Global research institute “Measuring physical climate risk in equity portfolios”
Risk Type Physical RisksInfluence (electric power)
Influence(public utility)
Acute Storms and cyclones High High
Acute Extreme rainfall and flood High High
Acute Extreme heat High High
Chronic Variability in precipitation Medium High
Chronic Variability in temperature High High
Chronic Water Stress Medium High
Chronic Sea-level rise High High*Excerpt
ChronicAcute
114
4
The energy sector is subject to a wide-range of physical risks including storms, cyclones, heavy rains, extreme flood and hot weather, temperature changes, higher sea levels, and melting of permafrost
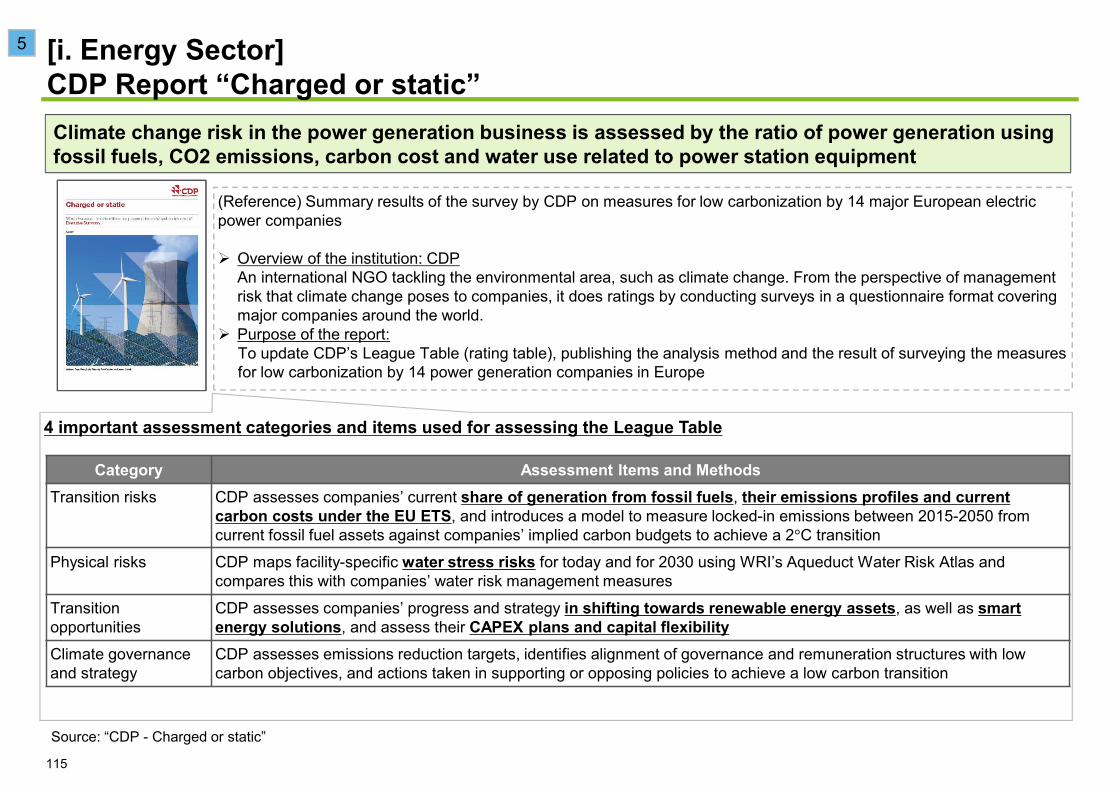
[i. Energy Sector]CDP Report “Charged or static”
(Reference) Summary results of the survey by CDP on measures for low carbonization by 14 major European electric power companies
Overview of the institution: CDPAn international NGO tackling the environmental area, such as climate change. From the perspective of management risk that climate change poses to companies, it does ratings by conducting surveys in a questionnaire format covering major companies around the world.Purpose of the report:To update CDP’s League Table (rating table), publishing the analysis method and the result of surveying the measures for low carbonization by 14 power generation companies in Europe
4 important assessment categories and items used for assessing the League Table
Source: “CDP - Charged or static”
Category Assessment Items and MethodsTransition risks CDP assesses companies’ current share of generation from fossil fuels, their emissions profiles and current
carbon costs under the EU ETS, and introduces a model to measure locked-in emissions between 2015-2050 from current fossil fuel assets against companies’ implied carbon budgets to achieve a 2 C transition
Physical risks CDP maps facility-specific water stress risks for today and for 2030 using WRI’s Aqueduct Water Risk Atlas and compares this with companies’ water risk management measures
Transitionopportunities
CDP assesses companies’ progress and strategy in shifting towards renewable energy assets, as well as smart energy solutions, and assess their CAPEX plans and capital flexibility
Climate governance and strategy
CDP assesses emissions reduction targets, identifies alignment of governance and remuneration structures with low carbon objectives, and actions taken in supporting or opposing policies to achieve a low carbon transition
115
5
Climate change risk in the power generation business is assessed by the ratio of power generation using fossil fuels, CO2 emissions, carbon cost and water use related to power station equipment
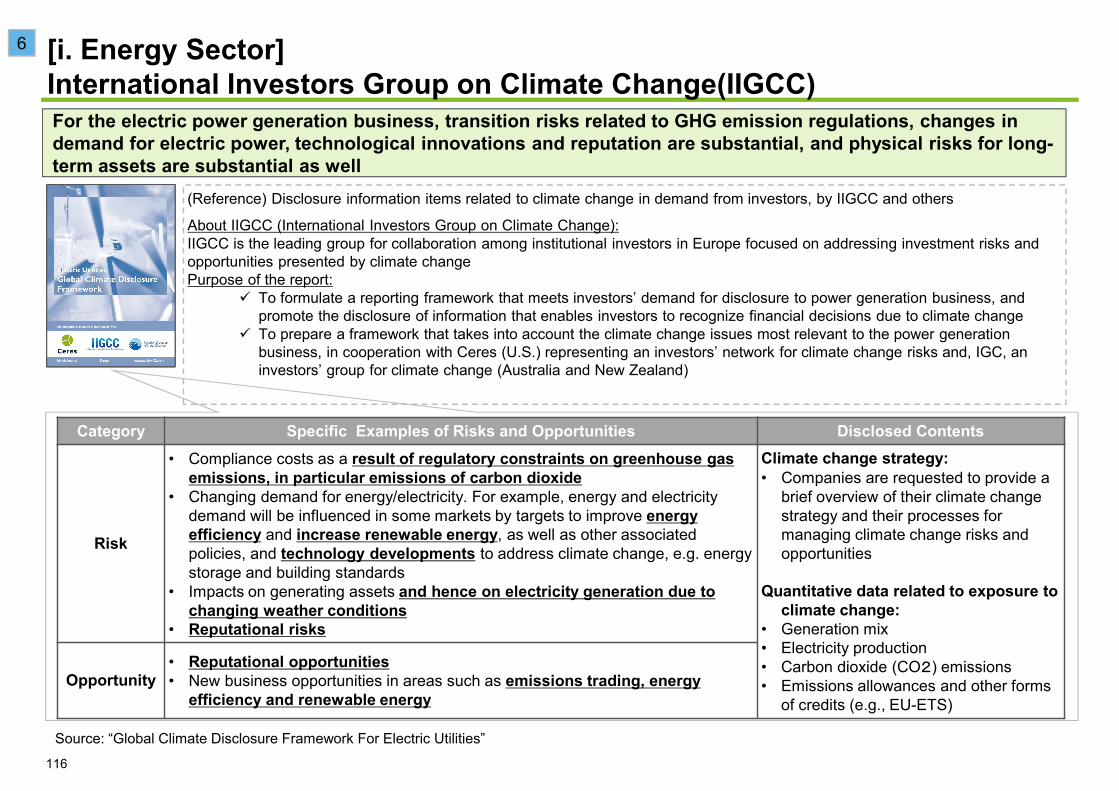
[i. Energy Sector] International Investors Group on Climate Change(IIGCC)
(Reference) Disclosure information items related to climate change in demand from investors, by IIGCC and others
About IIGCC (International Investors Group on Climate Change):IIGCC is the leading group for collaboration among institutional investors in Europe focused on addressing investment risks and opportunities presented by climate changePurpose of the report:
To formulate a reporting framework that meets investors’ demand for disclosure to power generation business, and promote the disclosure of information that enables investors to recognize financial decisions due to climate change To prepare a framework that takes into account the climate change issues most relevant to the power generation business, in cooperation with Ceres (U.S.) representing an investors’ network for climate change risks and, IGC, an investors’ group for climate change (Australia and New Zealand)
Source: “Global Climate Disclosure Framework For Electric Utilities”
Category Specific Examples of Risks and Opportunities Disclosed Contents
Risk
• Compliance costs as a result of regulatory constraints on greenhouse gas emissions, in particular emissions of carbon dioxide
• Changing demand for energy/electricity. For example, energy and electricity demand will be influenced in some markets by targets to improve energy efficiency and increase renewable energy, as well as other associated policies, and technology developments to address climate change, e.g. energy storage and building standards
• Impacts on generating assets and hence on electricity generation due to changing weather conditions
• Reputational risks
Climate change strategy:• Companies are requested to provide a
brief overview of their climate change strategy and their processes for managing climate change risks and opportunities
Quantitative data related to exposure to climate change:
• Generation mix• Electricity production• Carbon dioxide (CO2) emissions• Emissions allowances and other forms
of credits (e.g., EU-ETS)Opportunity
• Reputational opportunities• New business opportunities in areas such as emissions trading, energy
efficiency and renewable energy
116
6
For the electric power generation business, transition risks related to GHG emission regulations, changes in demand for electric power, technological innovations and reputation are substantial, and physical risks for long-term assets are substantial as well
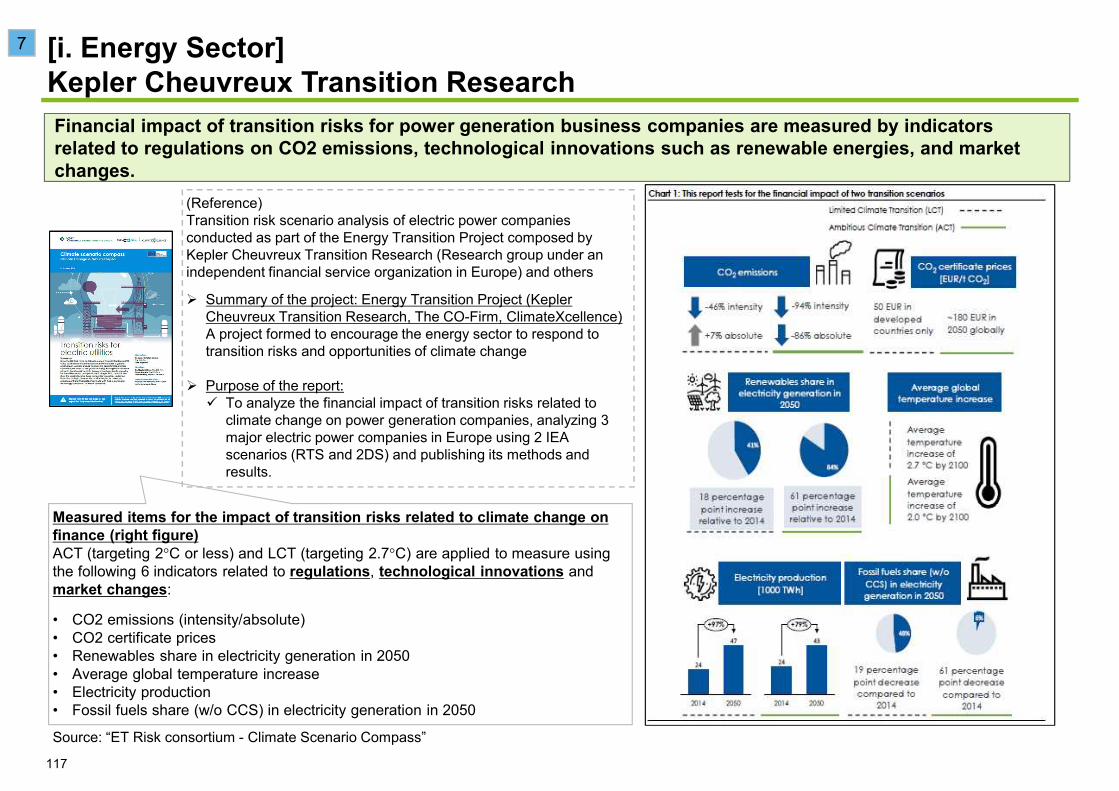
[i. Energy Sector] Kepler Cheuvreux Transition Research
(Reference)Transition risk scenario analysis of electric power companies conducted as part of the Energy Transition Project composed by Kepler Cheuvreux Transition Research (Research group under an independent financial service organization in Europe) and others
Summary of the project: Energy Transition Project (KeplerCheuvreux Transition Research, The CO-Firm, ClimateXcellence)A project formed to encourage the energy sector to respond to transition risks and opportunities of climate change
Purpose of the report:To analyze the financial impact of transition risks related to climate change on power generation companies, analyzing 3 major electric power companies in Europe using 2 IEA scenarios (RTS and 2DS) and publishing its methods and results.
Measured items for the impact of transition risks related to climate change on finance (right figure)ACT (targeting 2 C or less) and LCT (targeting 2.7 C) are applied to measure using the following 6 indicators related to regulations, technological innovations and market changes:
• CO2 emissions (intensity/absolute)• CO2 certificate prices• Renewables share in electricity generation in 2050• Average global temperature increase• Electricity production• Fossil fuels share (w/o CCS) in electricity generation in 2050
Source: “ET Risk consortium - Climate Scenario Compass”
117
7
Financial impact of transition risks for power generation business companies are measured by indicators related to regulations on CO2 emissions, technological innovations such as renewable energies, and market changes.
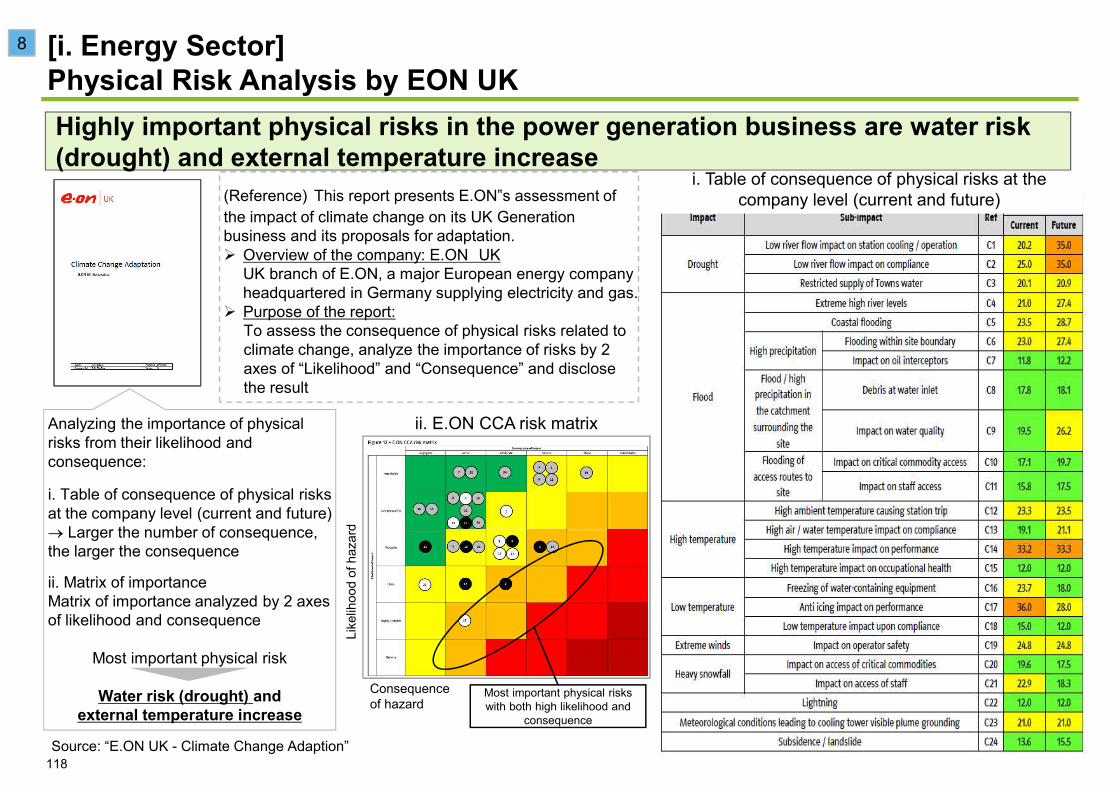
[i. Energy Sector] Physical Risk Analysis by EON UK
(Reference) This report presents E.ON‟s assessment of the impact of climate change on its UK Generation business and its proposals for adaptation.
Overview of the company: E.ON UKUK branch of E.ON, a major European energy company headquartered in Germany supplying electricity and gas. Purpose of the report:To assess the consequence of physical risks related to climate change, analyze the importance of risks by 2 axes of “Likelihood” and “Consequence” and disclose the result
Analyzing the importance of physical risks from their likelihood and consequence:
i. Table of consequence of physical risks at the company level (current and future)
Larger the number of consequence, the larger the consequence
ii. Matrix of importanceMatrix of importance analyzed by 2 axes of likelihood and consequence
Most important physical risk
Water risk (drought) and external temperature increase
Source: “E.ON UK - Climate Change Adaption”
Consequence of hazard
Like
lihoo
d of
haz
ard
Most important physical risks with both high likelihood and
consequence
i. Table of consequence of physical risks at the company level (current and future)
ii. E.ON CCA risk matrix
118
8
Highly important physical risks in the power generation business are water risk (drought) and external temperature increase

Chapter 4 Reference on Degree of Risk Importance in Selected SectorsThis chapter provides materials for scenario analysis, part of which were used for assessment of the degree of risk importance under the Ministry’s support program
119
4. References on Degree of Risk Importance in Selected Sectorsi. Energy Sectorii. Transportation Sector (Maritime Transportation,
Passenger Air Transportation, Automobiles)iii. Buildings/Forest Products Sector
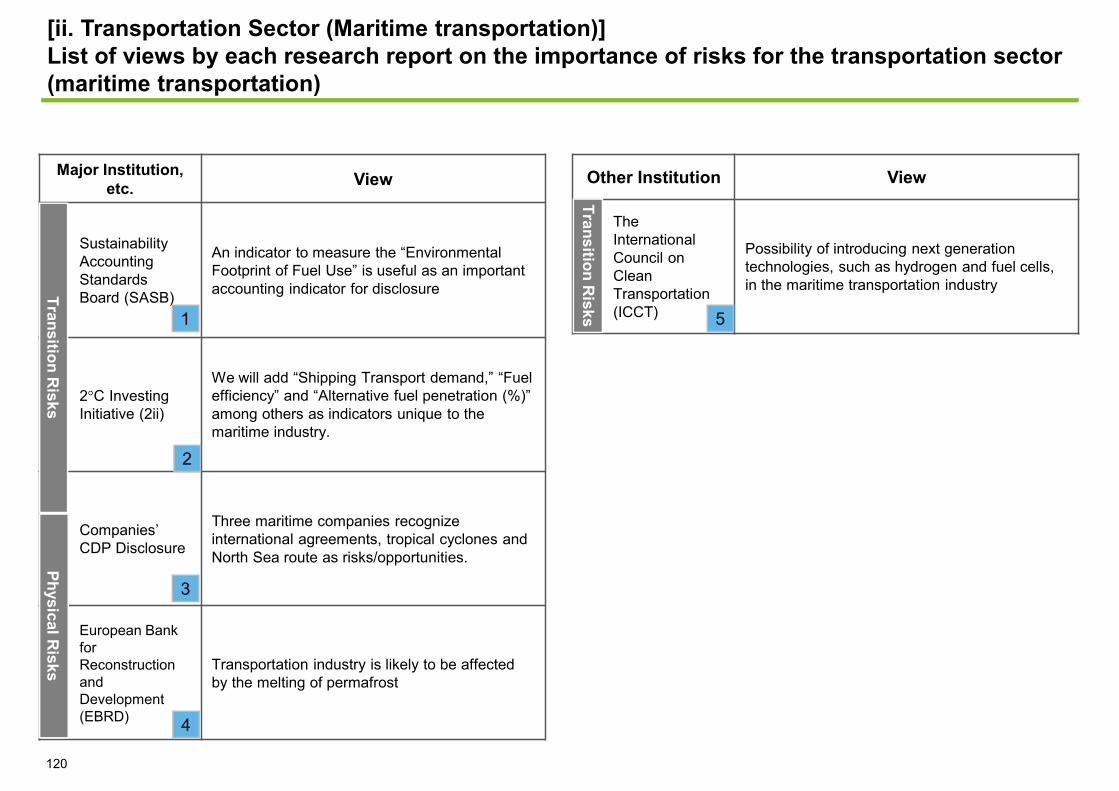
[ii. Transportation Sector (Maritime transportation)]List of views by each research report on the importance of risks for the transportation sector (maritime transportation)
Major Institution, etc. View
Sustainability Accounting Standards Board (SASB)
An indicator to measure the “Environmental Footprint of Fuel Use” is useful as an important accounting indicator for disclosure
2 C Investing Initiative (2ii)
We will add “Shipping Transport demand,” “Fuel efficiency” and “Alternative fuel penetration (%)” among others as indicators unique to the maritime industry.
Companies’ CDP Disclosure
Three maritime companies recognize international agreements, tropical cyclones and North Sea route as risks/opportunities.
European Bank for Reconstruction and Development (EBRD)
Transportation industry is likely to be affected by the melting of permafrost
Transition Risks
Physical Risks
1
2
3
4
Other Institution View
The International Council on Clean Transportation (ICCT)
Possibility of introducing next generation technologies, such as hydrogen and fuel cells, in the maritime transportation industry
Transition Risks 5
120

(Reference) Standards by SASB for each industry concerning information disclosure to investors on sustainability
Overview of the institutionSASB (Sustainability Accounting Standard Board)A non-profit body to promote the disclosure of information on sustainability to meet the needs of investors
Summary of the reportFormulating and publishing sustainability accounting standards of each industry for the disclosure of financial informationFor the two environmental disclosure items (Environment, Leadership and Governance), presenting items unique to the maritime industry and preparing disclosure indicators as standards for sustainability
As important disclosure items for the maritime industry, 5 indicators were established for the “Environmental Footprint of Fuel Use”
[ii. Transportation Sector (Maritime transportation)]SASB Information Disclosure Standards for Sustainability
Source: SASB. ”Marine Transportation Research Brief”, “Marine Transportation Sustainability Accounting Standard”. 2014.
Topic Accounting MetricEnvironmentalFootprint of Fuel Use
Gross global Scope 1 emissions
Description of strategy of plan to manage emissions, emissions reduction targets, and an analysis of performance against those targets
Total energy consumed, percentage from heavy fuel oil, percentage from renewables
Air emissions for the pollutants
Energy Efficiency Design Index(EEDI)* for new ships
Disclosure TopicsImportant Disclosure Items for the Maritime
Industry
Environment Environmental Footprint of Fuel Use
Ecological Impacts
Leadership and Governance
Business Ethics
Accidents & Safety Management
Since the maritime industry depends on heavy oil, fuel cost increase and GHG/air pollution materials, regulations are matters of grave concernUse of fuel-efficient engines and fuel otherthan heavy oil is required.
*Indicators referred to in TCFD Guidance
An indicator to measure the “Environmental Footprint of Fuel Use” is useful as an important accounting indicator for disclosure
1
121
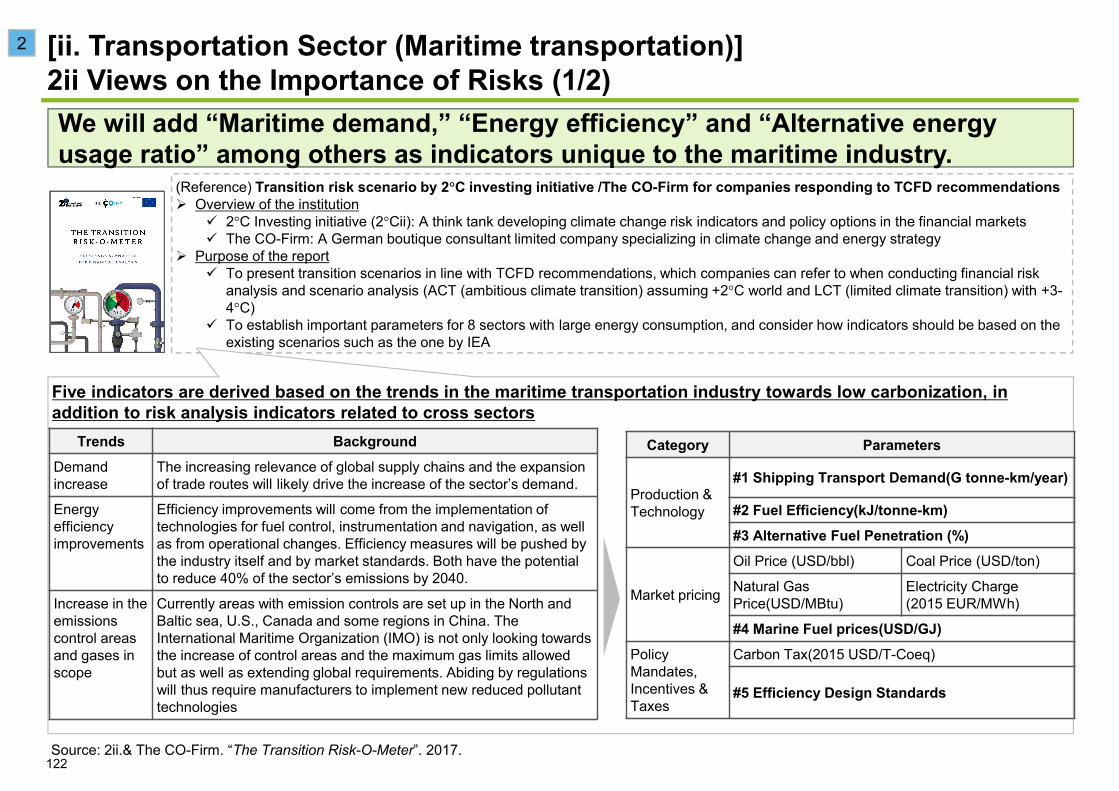
[ii. Transportation Sector (Maritime transportation)]2ii Views on the Importance of Risks (1/2)
(Reference) Transition risk scenario by 2 C investing initiative /The CO-Firm for companies responding to TCFD recommendationsOverview of the institution
2 C Investing initiative (2 Cii): A think tank developing climate change risk indicators and policy options in the financial markets The CO-Firm: A German boutique consultant limited company specializing in climate change and energy strategy
Purpose of the reportTo present transition scenarios in line with TCFD recommendations, which companies can refer to when conducting financial risk analysis and scenario analysis (ACT (ambitious climate transition) assuming +2 C world and LCT (limited climate transition) with +3-4 C)To establish important parameters for 8 sectors with large energy consumption, and consider how indicators should be based on the existing scenarios such as the one by IEA
Five indicators are derived based on the trends in the maritime transportation industry towards low carbonization, in addition to risk analysis indicators related to cross sectors
Source: 2ii.& The CO-Firm. “The Transition Risk-O-Meter”. 2017.
Trends BackgroundDemand increase
The increasing relevance of global supply chains and the expansion of trade routes will likely drive the increase of the sector’s demand.
Energy efficiency improvements
Efficiency improvements will come from the implementation of technologies for fuel control, instrumentation and navigation, as well as from operational changes. Efficiency measures will be pushed by the industry itself and by market standards. Both have the potential to reduce 40% of the sector’s emissions by 2040.
Increase in the emissions control areas and gases in scope
Currently areas with emission controls are set up in the North and Baltic sea, U.S., Canada and some regions in China. The International Maritime Organization (IMO) is not only looking towards the increase of control areas and the maximum gas limits allowed but as well as extending global requirements. Abiding by regulations will thus require manufacturers to implement new reduced pollutant technologies
Category Parameters
Production & Technology
#1 Shipping Transport Demand(G tonne-km/year)
#2 Fuel Efficiency(kJ/tonne-km)#3 Alternative Fuel Penetration (%)
Market pricing
Oil Price (USD/bbl) Coal Price (USD/ton)
Natural Gas Price(USD/MBtu)
Electricity Charge(2015 EUR/MWh)
#4 Marine Fuel prices(USD/GJ)PolicyMandates, Incentives & Taxes
Carbon Tax(2015 USD/T-Coeq)
#5 Efficiency Design Standards
We will add “Maritime demand,” “Energy efficiency” and “Alternative energy usage ratio” among others as indicators unique to the maritime industry.
122
2

#1 Shipping Transport demand(G tonne-km/year)“Under the ACT, demand for oil and coal transport is expected to reach its peak in 2018 and decline to 2000 levels by 2050. Demand for fossil liquid-bulk will decline by 28% through 2040 compare to 2015 levels. Likewise, bulk coal transport will decline by 52% through 2040 from 2015.”
#2 Fuel efficiency(kJ/tonne-km)
“The ACT sees the maximum reduction in fuel consumption for the dry-bulk segment with an average sector abatement of 52% by 2040 from 2010 levels.”
#3 Alternative fuel penetration (%)“In the ACT scenario, technological advancements and bio-availability allow the penetration of biofuels starting in 2020 and reaching a share of 20% by 2040. Hydrogen will be used starting in 2030 occupying a share of 6% by 2040 in the ACT.”
#4 Marine Fuel Prices(USD/GJ)
#5 Efficiency Standards
Demand for oil and coal will peak in 2018 and decrease to the level of 2000 in 2050
In 2040, fuel consumption for the dry-bulk segment will decrease by 52% of that in 2010.
“HFO will remain as the lowest cost option, but from 2020, its use alongside with emission abatement technologies will be required to comply with emissions regulations.”
“EEDI compliance at current values is not sufficient to be aligned in with the ACT or the LCT. Additional carbon intensity reduction mechanisms are needed (i.e. technical measures, alternative fuels, carbon offsets).”
The penetration of biofuels will start in 2020 to reach a 20% share by 2040, while hydrogen will be used starting in 2030 occupying a 6% share by 2040
Although heavy oil will be cheap even in 2040, emission abatement technologies will need to be introduced under regulations from 2020.
[ii. Transportation Sector (Maritime transportation)]2ii Views on the Importance of Risks (2/2)
Whereas EEDI will gradually impose stricter reduction rates, additional regulations and methods will be needed to achieve emission reduction targets.
Indicators unique to the maritime transportation industry and future forecast
123
2
Source: 2ii.& The CO-Firm. “The Transition Risk-O-Meter”. 2017.
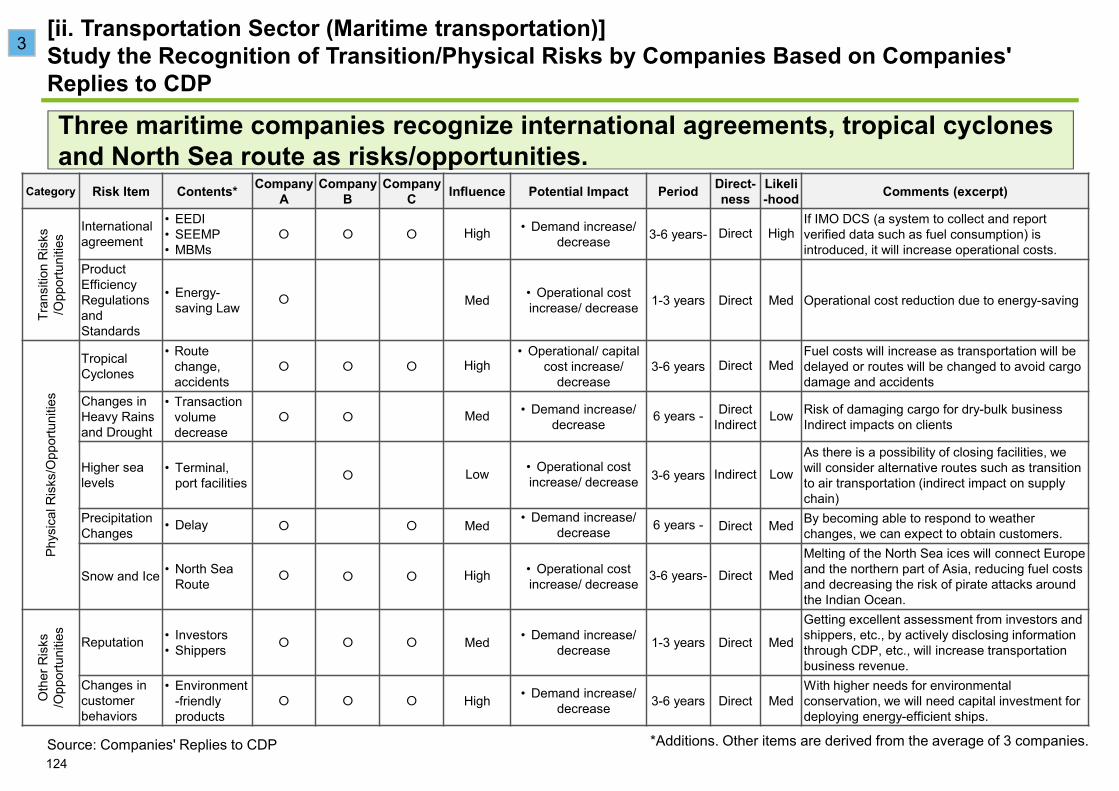
Category Risk Item Contents* Company A
Company B
Company C Influence Potential Impact Period Direct-
nessLikeli-hood Comments (excerpt)
Tran
sitio
n R
isks
/O
ppor
tuni
ties
International agreement
• EEDI• SEEMP• MBMs
High • Demand increase/ decrease 3-6 years- Direct High
If IMO DCS (a system to collect and report verified data such as fuel consumption) is introduced, it will increase operational costs.
Product Efficiency Regulations and Standards
• Energy-saving Law Med • Operational cost
increase/ decrease 1-3 years Direct Med Operational cost reduction due to energy-saving
Phys
ical
Ris
ks/O
ppor
tuni
ties
Tropical Cyclones
• Route change, accidents
High• Operational/ capital
cost increase/ decrease
3-6 years Direct MedFuel costs will increase as transportation will be delayed or routes will be changed to avoid cargo damage and accidents
Changes in Heavy Rains and Drought
• Transaction volume decrease
Med • Demand increase/decrease 6 years - Direct
Indirect Low Risk of damaging cargo for dry-bulk business Indirect impacts on clients
Higher sea levels
• Terminal, port facilities Low • Operational cost
increase/ decrease 3-6 years Indirect Low
As there is a possibility of closing facilities, we will consider alternative routes such as transition to air transportation (indirect impact on supply chain)
Precipitation Changes • Delay Med • Demand increase/
decrease 6 years - Direct Med By becoming able to respond to weather changes, we can expect to obtain customers.
Snow and Ice • North Sea Route High • Operational cost
increase/ decrease 3-6 years- Direct Med
Melting of the North Sea ices will connect Europe and the northern part of Asia, reducing fuel costs and decreasing the risk of pirate attacks around the Indian Ocean.
Oth
er R
isks
/Opp
ortu
nitie
s
Reputation • Investors• Shippers Med • Demand increase/
decrease 1-3 years Direct Med
Getting excellent assessment from investors and shippers, etc., by actively disclosing information through CDP, etc., will increase transportation business revenue.
Changes in customer behaviors
• Environment-friendly products
High • Demand increase/ decrease 3-6 years Direct Med
With higher needs for environmental conservation, we will need capital investment for deploying energy-efficient ships.
Source: Companies' Replies to CDP *Additions. Other items are derived from the average of 3 companies.
Three maritime companies recognize international agreements, tropical cyclones and North Sea route as risks/opportunities.
[ii. Transportation Sector (Maritime transportation)]Study the Recognition of Transition/Physical Risks by Companies Based on Companies' Replies to CDP
3
124
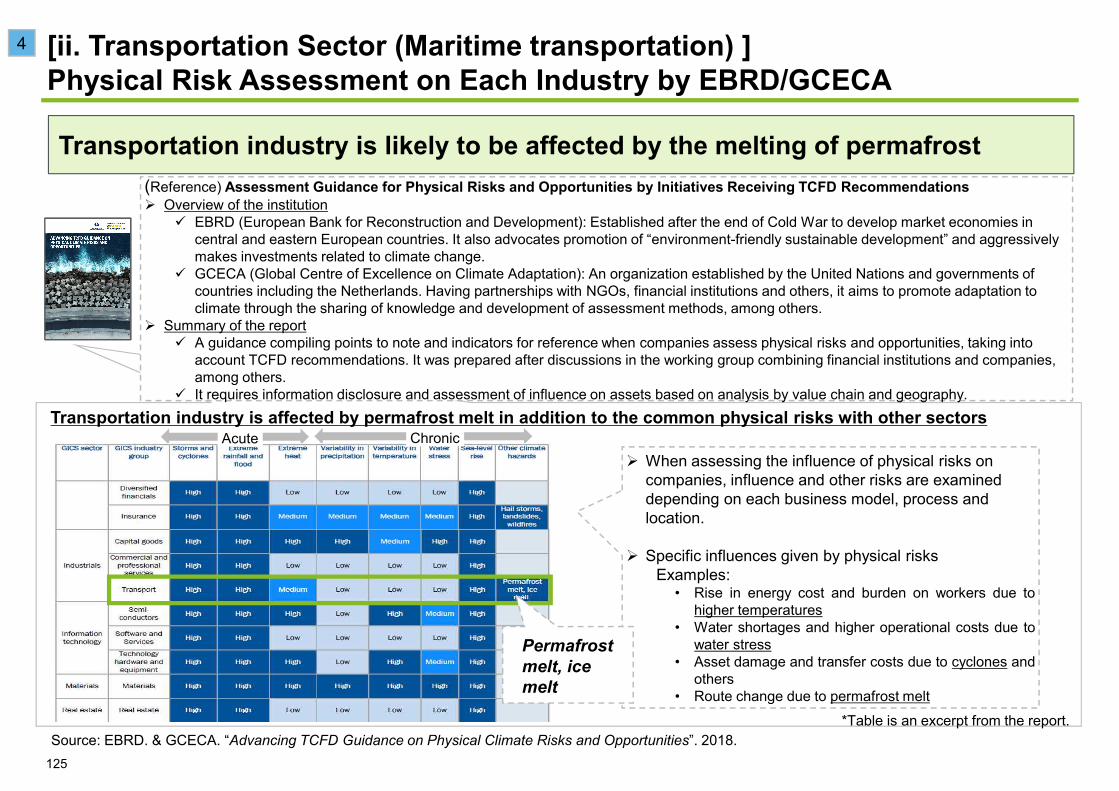
[ii. Transportation Sector (Maritime transportation) ]Physical Risk Assessment on Each Industry by EBRD/GCECA
Transportation industry is affected by permafrost melt in addition to the common physical risks with other sectors
Source: EBRD. & GCECA. “Advancing TCFD Guidance on Physical Climate Risks and Opportunities”. 2018.
When assessing the influence of physical risks on companies, influence and other risks are examined depending on each business model, process and location.
Specific influences given by physical risksExamples:
• Rise in energy cost and burden on workers due tohigher temperatures
• Water shortages and higher operational costs due towater stress
• Asset damage and transfer costs due to cyclones andothers
• Route change due to permafrost melt
ChronicAcute
*Table is an excerpt from the report.
Permafrost melt, ice melt
4
Transportation industry is likely to be affected by the melting of permafrost
125
(Reference) Assessment Guidance for Physical Risks and Opportunities by Initiatives Receiving TCFD RecommendationsOverview of the institution
EBRD (European Bank for Reconstruction and Development): Established after the end of Cold War to develop market economies incentral and eastern European countries. It also advocates promotion of “environment-friendly sustainable development” and aggressively makes investments related to climate change. GCECA (Global Centre of Excellence on Climate Adaptation): An organization established by the United Nations and governments of countries including the Netherlands. Having partnerships with NGOs, financial institutions and others, it aims to promote adaptation to climate through the sharing of knowledge and development of assessment methods, among others.
Summary of the reportA guidance compiling points to note and indicators for reference when companies assess physical risks and opportunities, taking into account TCFD recommendations. It was prepared after discussions in the working group combining financial institutions and companies, among others. It requires information disclosure and assessment of influence on assets based on analysis by value chain and geography.
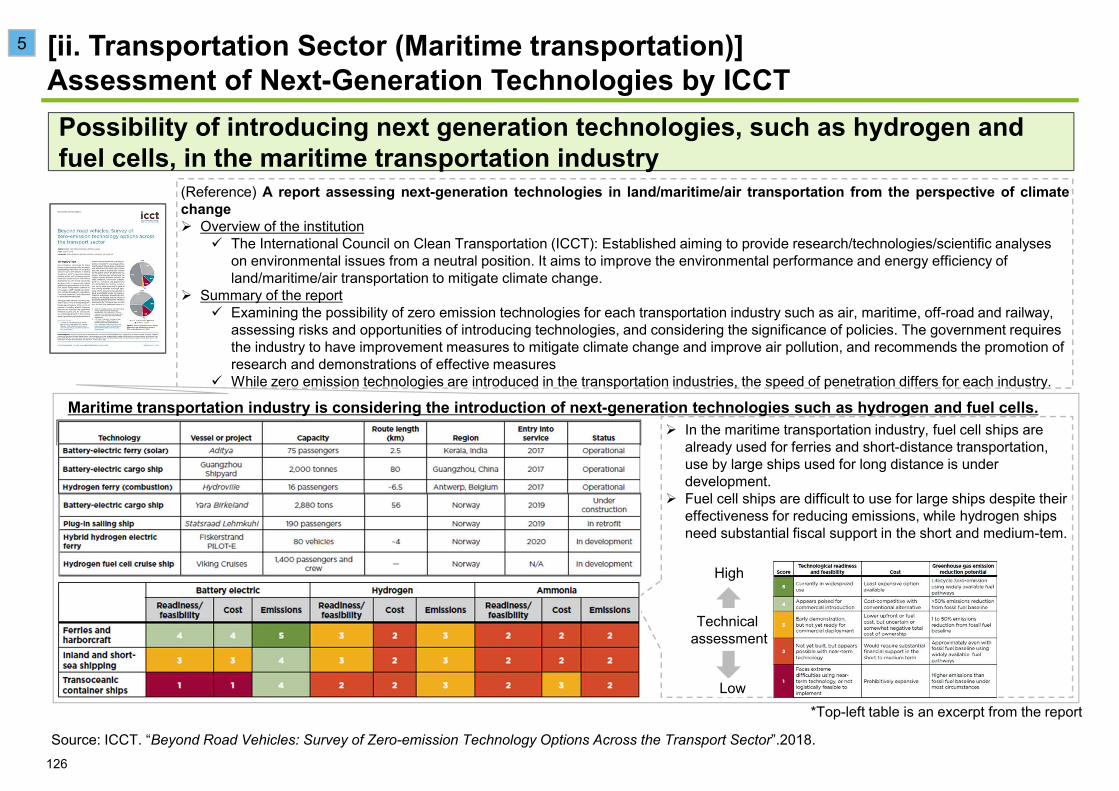
(Reference) A report assessing next-generation technologies in land/maritime/air transportation from the perspective of climatechange
Overview of the institutionThe International Council on Clean Transportation (ICCT): Established aiming to provide research/technologies/scientific analyses on environmental issues from a neutral position. It aims to improve the environmental performance and energy efficiency of land/maritime/air transportation to mitigate climate change.
Summary of the reportExamining the possibility of zero emission technologies for each transportation industry such as air, maritime, off-road and railway, assessing risks and opportunities of introducing technologies, and considering the significance of policies. The government requires the industry to have improvement measures to mitigate climate change and improve air pollution, and recommends the promotion of research and demonstrations of effective measures While zero emission technologies are introduced in the transportation industries, the speed of penetration differs for each industry.
Maritime transportation industry is considering the introduction of next-generation technologies such as hydrogen and fuel cells.
[ii. Transportation Sector (Maritime transportation)]Assessment of Next-Generation Technologies by ICCT
Source: ICCT. “Beyond Road Vehicles: Survey of Zero-emission Technology Options Across the Transport Sector”.2018.
In the maritime transportation industry, fuel cell ships are already used for ferries and short-distance transportation, use by large ships used for long distance is under development. Fuel cell ships are difficult to use for large ships despite their effectiveness for reducing emissions, while hydrogen ships need substantial fiscal support in the short and medium-tem.
*Top-left table is an excerpt from the report
Technical assessment
High
Low
5
Possibility of introducing next generation technologies, such as hydrogen and fuel cells, in the maritime transportation industry
126
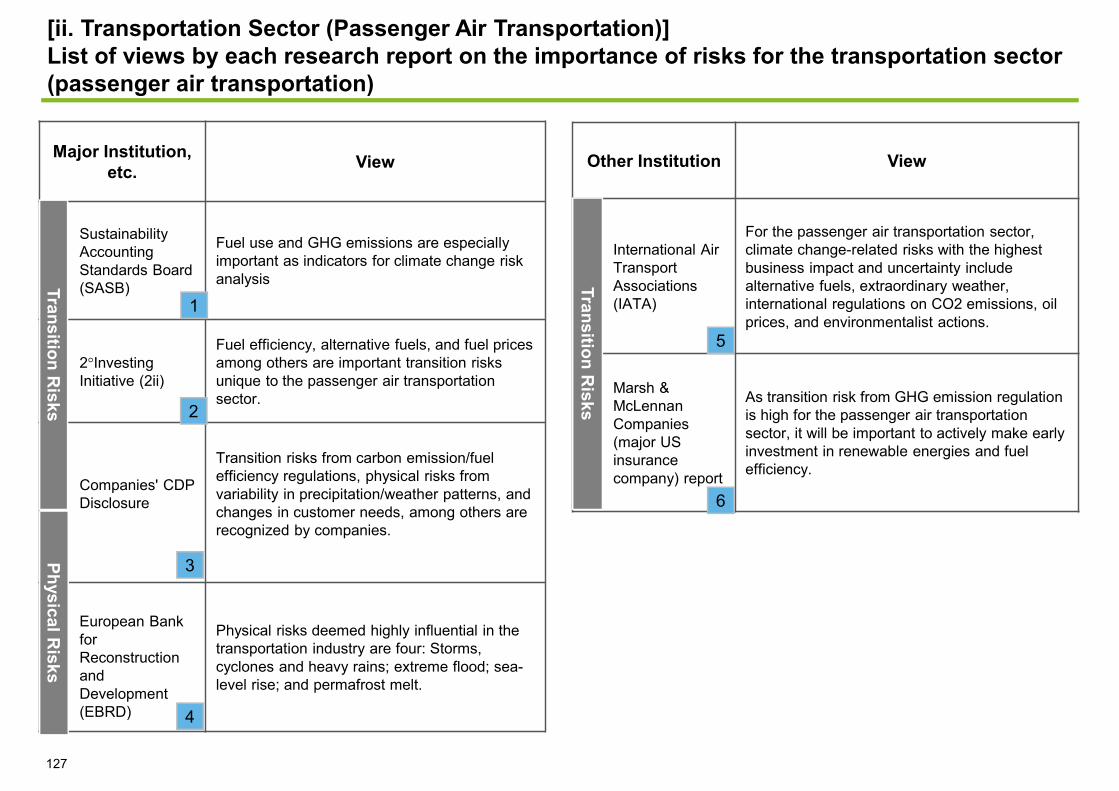
[ii. Transportation Sector (Passenger Air Transportation)]List of views by each research report on the importance of risks for the transportation sector (passenger air transportation)
Major Institution, etc. View
Sustainability Accounting Standards Board (SASB)
Fuel use and GHG emissions are especially important as indicators for climate change risk analysis
2 Investing Initiative (2ii)
Fuel efficiency, alternative fuels, and fuel prices among others are important transition risks unique to the passenger air transportation sector.
Companies' CDP Disclosure
Transition risks from carbon emission/fuel efficiency regulations, physical risks from variability in precipitation/weather patterns, and changes in customer needs, among others are recognized by companies.
European Bank for Reconstruction and Development (EBRD)
Physical risks deemed highly influential in the transportation industry are four: Storms, cyclones and heavy rains; extreme flood; sea-level rise; and permafrost melt.
Transition Risks
Physical Risks
1
2
3
4
Other Institution View
International Air Transport Associations (IATA)
For the passenger air transportation sector, climate change-related risks with the highest business impact and uncertainty include alternative fuels, extraordinary weather, international regulations on CO2 emissions, oil prices, and environmentalist actions.
Marsh & McLennan Companies (major US insurance company) report
As transition risk from GHG emission regulationis high for the passenger air transportation sector, it will be important to actively make early investment in renewable energies and fuel efficiency.
Transition Risks
5
127
6
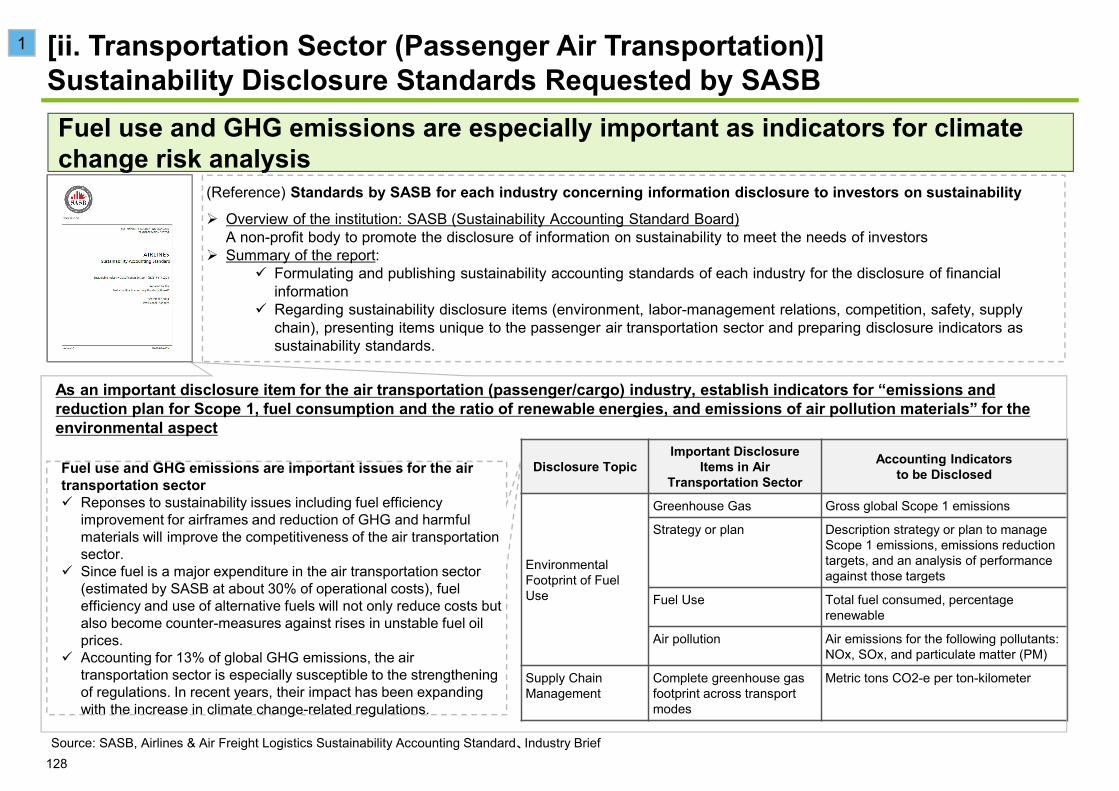
Source: SASB, Airlines & Air Freight Logistics Sustainability Accounting Standard、Industry Brief
Disclosure TopicImportant Disclosure
Items in Air Transportation Sector
Accounting Indicators to be Disclosed
EnvironmentalFootprint of Fuel Use
Greenhouse Gas Gross global Scope 1 emissions
Strategy or plan Description strategy or plan to manage Scope 1 emissions, emissions reduction targets, and an analysis of performance against those targets
Fuel Use Total fuel consumed, percentage renewable
Air pollution Air emissions for the following pollutants: NOx, SOx, and particulate matter (PM)
Supply Chain Management
Complete greenhouse gas footprint across transport modes
Metric tons CO2-e per ton-kilometer
(Reference) Standards by SASB for each industry concerning information disclosure to investors on sustainabilityOverview of the institution: SASB (Sustainability Accounting Standard Board)A non-profit body to promote the disclosure of information on sustainability to meet the needs of investors Summary of the report:
Formulating and publishing sustainability accounting standards of each industry for the disclosure of financial information Regarding sustainability disclosure items (environment, labor-management relations, competition, safety, supply chain), presenting items unique to the passenger air transportation sector and preparing disclosure indicators as sustainability standards.
As an important disclosure item for the air transportation (passenger/cargo) industry, establish indicators for “emissions and reduction plan for Scope 1, fuel consumption and the ratio of renewable energies, and emissions of air pollution materials” for the environmental aspect
Fuel use and GHG emissions are important issues for the air transportation sector
Reponses to sustainability issues including fuel efficiency improvement for airframes and reduction of GHG and harmful materials will improve the competitiveness of the air transportationsector.Since fuel is a major expenditure in the air transportation sector (estimated by SASB at about 30% of operational costs), fuel efficiency and use of alternative fuels will not only reduce costs but also become counter-measures against rises in unstable fuel oil prices. Accounting for 13% of global GHG emissions, the air transportation sector is especially susceptible to the strengthening of regulations. In recent years, their impact has been expanding with the increase in climate change-related regulations.
[ii. Transportation Sector (Passenger Air Transportation)]Sustainability Disclosure Standards Requested by SASBFuel use and GHG emissions are especially important as indicators for climate change risk analysis
1
128
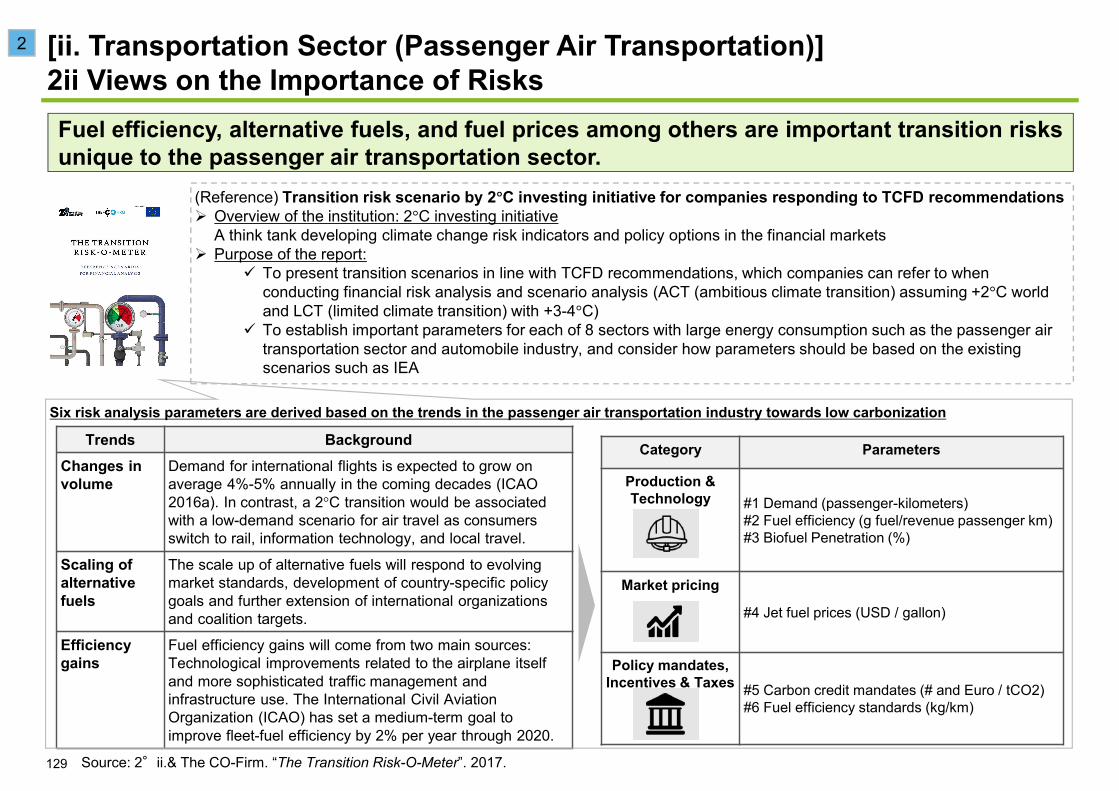
Trends BackgroundChanges in volume
Demand for international flights is expected to grow on average 4%-5% annually in the coming decades (ICAO 2016a). In contrast, a 2 C transition would be associated with a low-demand scenario for air travel as consumers switch to rail, information technology, and local travel.
Scaling of alternative fuels
The scale up of alternative fuels will respond to evolving market standards, development of country-specific policy goals and further extension of international organizations and coalition targets.
Efficiency gains
Fuel efficiency gains will come from two main sources: Technological improvements related to the airplane itself and more sophisticated traffic management and infrastructure use. The International Civil Aviation Organization (ICAO) has set a medium-term goal to improve fleet-fuel efficiency by 2% per year through 2020.
(Reference) Transition risk scenario by 2 C investing initiative for companies responding to TCFD recommendationsOverview of the institution: 2 C investing initiativeA think tank developing climate change risk indicators and policy options in the financial marketsPurpose of the report:
To present transition scenarios in line with TCFD recommendations, which companies can refer to when conducting financial risk analysis and scenario analysis (ACT (ambitious climate transition) assuming +2 C world and LCT (limited climate transition) with +3-4 C)To establish important parameters for each of 8 sectors with large energy consumption such as the passenger air transportation sector and automobile industry, and consider how parameters should be based on the existing scenarios such as IEA
Six risk analysis parameters are derived based on the trends in the passenger air transportation industry towards low carbonization
Category Parameters
Production & Technology #1 Demand (passenger-kilometers)
#2 Fuel efficiency (g fuel/revenue passenger km)#3 Biofuel Penetration (%)
Market pricing
#4 Jet fuel prices (USD / gallon)
Policy mandates, Incentives & Taxes #5 Carbon credit mandates (# and Euro / tCO2)
#6 Fuel efficiency standards (kg/km)
[ii. Transportation Sector (Passenger Air Transportation)]2ii Views on the Importance of RisksFuel efficiency, alternative fuels, and fuel prices among others are important transition risks unique to the passenger air transportation sector.
2
129 Source: 2°ii.& The CO-Firm. “The Transition Risk-O-Meter”. 2017.
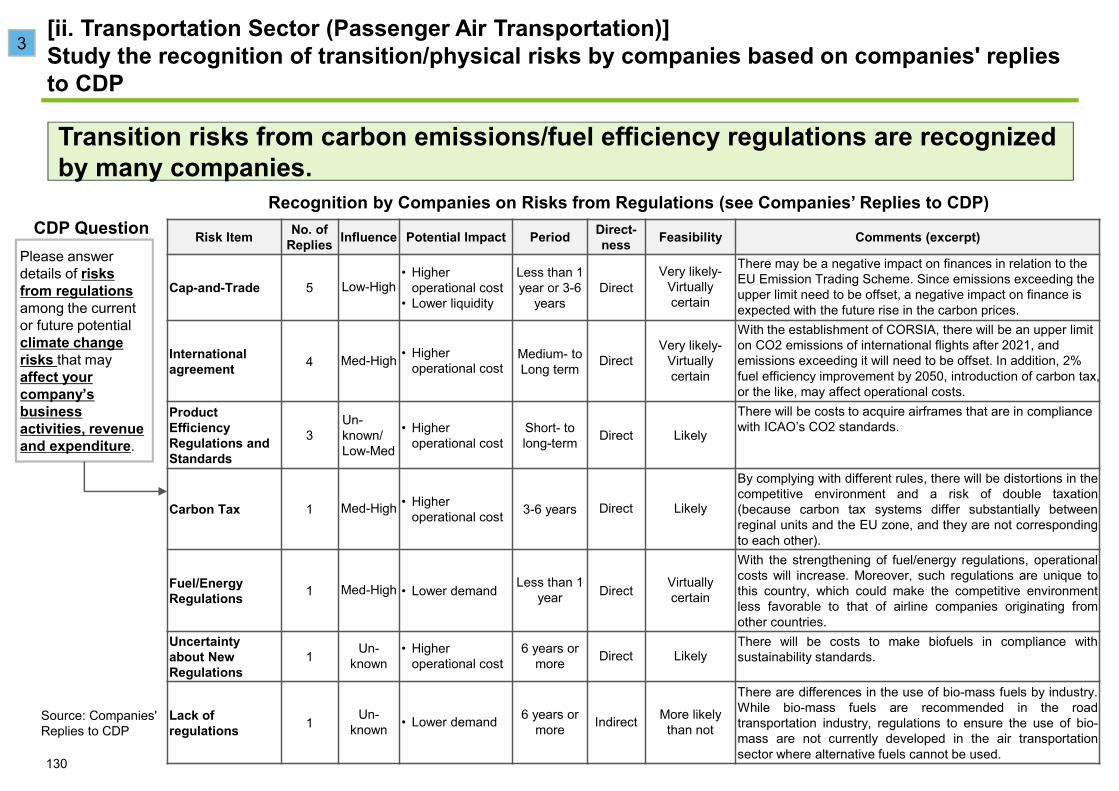
Risk Item No. of Replies Influence Potential Impact Period Direct-
ness Feasibility Comments (excerpt)
Cap-and-Trade 5 Low-High• Higher
operational cost• Lower liquidity
Less than 1 year or 3-6
yearsDirect
Very likely-Virtuallycertain
There may be a negative impact on finances in relation to the EU Emission Trading Scheme. Since emissions exceeding the upper limit need to be offset, a negative impact on finance is expected with the future rise in the carbon prices.
International agreement 4 Med-High • Higher
operational costMedium- to Long term Direct
Very likely-Virtually certain
With the establishment of CORSIA, there will be an upper limit on CO2 emissions of international flights after 2021, and emissions exceeding it will need to be offset. In addition, 2% fuel efficiency improvement by 2050, introduction of carbon tax, or the like, may affect operational costs.
Product Efficiency Regulations and Standards
3Un-known/ Low-Med
• Higher operational cost
Short- to long-term Direct Likely
There will be costs to acquire airframes that are in compliance with ICAO’s CO2 standards.
Carbon Tax 1 Med-High • Higher operational cost 3-6 years Direct Likely
By complying with different rules, there will be distortions in thecompetitive environment and a risk of double taxation(because carbon tax systems differ substantially betweenreginal units and the EU zone, and they are not correspondingto each other).
Fuel/Energy Regulations 1 Med-High • Lower demand Less than 1
year Direct Virtually certain
With the strengthening of fuel/energy regulations, operationalcosts will increase. Moreover, such regulations are unique tothis country, which could make the competitive environmentless favorable to that of airline companies originating fromother countries.
Uncertainty about New Regulations
1 Un-known
• Higher operational cost
6 years or more Direct Likely
There will be costs to make biofuels in compliance withsustainability standards.
Lack of regulations 1 Un-
known • Lower demand 6 years or more Indirect More likely
than not
There are differences in the use of bio-mass fuels by industry.While bio-mass fuels are recommended in the roadtransportation industry, regulations to ensure the use of bio-mass are not currently developed in the air transportationsector where alternative fuels cannot be used.
Source: Companies' Replies to CDP
Recognition by Companies on Risks from Regulations (see Companies’ Replies to CDP)
Please answer details of risks from regulations among the current or future potential climate change risks that may affect your company’s business activities, revenue and expenditure.
CDP Question
[ii. Transportation Sector (Passenger Air Transportation)]Study the recognition of transition/physical risks by companies based on companies' replies to CDP
3
Transition risks from carbon emissions/fuel efficiency regulations are recognized by many companies.
130
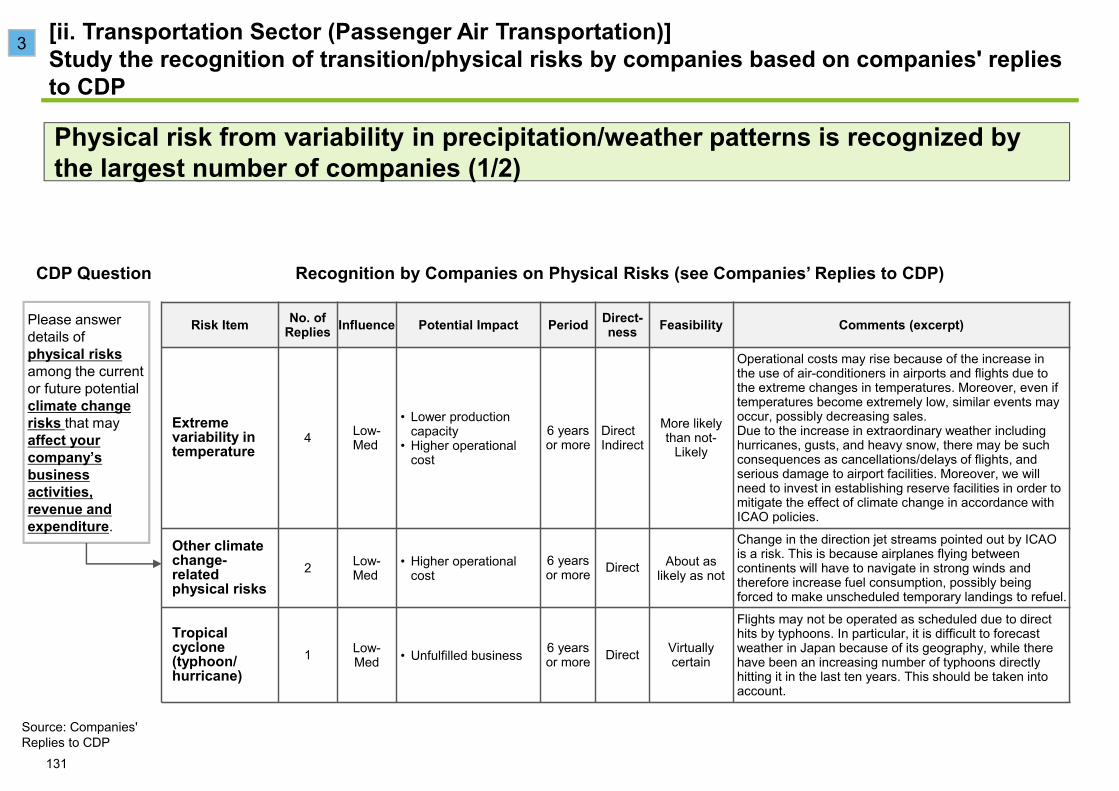
Source: Companies' Replies to CDP
Recognition by Companies on Physical Risks (see Companies’ Replies to CDP)CDP Question
Please answer details of physical risks among the current or future potential climate change risks that may affect your company’s business activities, revenue and expenditure.
Risk Item No. of Replies Influence Potential Impact Period Direct-
ness Feasibility Comments (excerpt)
Extreme variability in temperature
4 Low-Med
• Lower production capacity
• Higher operational cost
6 years or more
DirectIndirect
More likely than not-
Likely
Operational costs may rise because of the increase in the use of air-conditioners in airports and flights due to the extreme changes in temperatures. Moreover, even if temperatures become extremely low, similar events may occur, possibly decreasing sales.Due to the increase in extraordinary weather includinghurricanes, gusts, and heavy snow, there may be such consequences as cancellations/delays of flights, and serious damage to airport facilities. Moreover, we will need to invest in establishing reserve facilities in order to mitigate the effect of climate change in accordance with ICAO policies.
Other climate change-related physical risks
2 Low-Med
• Higher operational cost
6 years or more Direct About as
likely as not
Change in the direction jet streams pointed out by ICAO is a risk. This is because airplanes flying between continents will have to navigate in strong winds and therefore increase fuel consumption, possibly being forced to make unscheduled temporary landings to refuel.
Tropical cyclone (typhoon/ hurricane)
1 Low-Med • Unfulfilled business 6 years
or more Direct Virtually certain
Flights may not be operated as scheduled due to direct hits by typhoons. In particular, it is difficult to forecast weather in Japan because of its geography, while there have been an increasing number of typhoons directly hitting it in the last ten years. This should be taken into account.
[ii. Transportation Sector (Passenger Air Transportation)]Study the recognition of transition/physical risks by companies based on companies' replies to CDP
Physical risk from variability in precipitation/weather patterns is recognized by the largest number of companies (1/2)
131
3
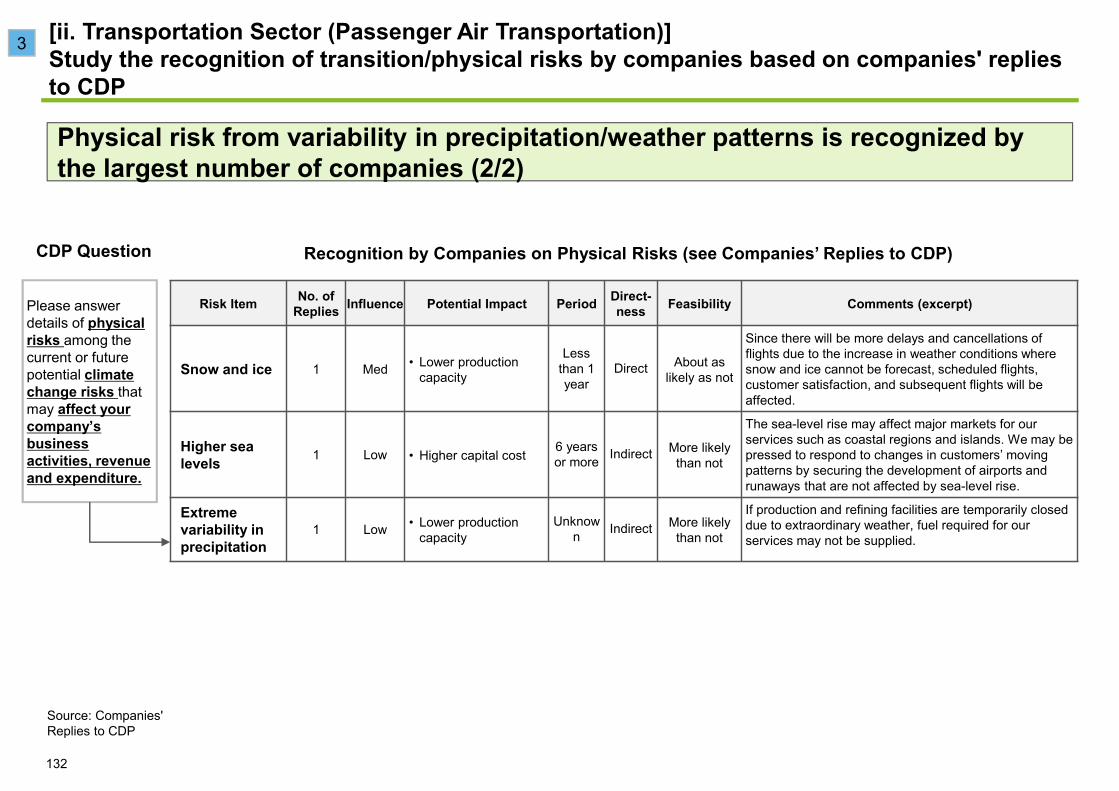
Source: Companies' Replies to CDP
Recognition by Companies on Physical Risks (see Companies’ Replies to CDP)CDP Question
Please answer details of physical risks among the current or future potential climate change risks that may affect your company’s business activities, revenue and expenditure.
Risk Item No. of Replies Influence Potential Impact Period Direct-
ness Feasibility Comments (excerpt)
Snow and ice 1 Med • Lower production capacity
Less than 1 year
Direct About as likely as not
Since there will be more delays and cancellations of flights due to the increase in weather conditions where snow and ice cannot be forecast, scheduled flights, customer satisfaction, and subsequent flights will be affected.
Higher sea levels 1 Low • Higher capital cost 6 years
or more Indirect More likely than not
The sea-level rise may affect major markets for our services such as coastal regions and islands. We may be pressed to respond to changes in customers’ moving patterns by securing the development of airports and runaways that are not affected by sea-level rise.
Extreme variability in precipitation
1 Low • Lower production capacity
Unknown Indirect More likely
than not
If production and refining facilities are temporarily closed due to extraordinary weather, fuel required for our services may not be supplied.
[ii. Transportation Sector (Passenger Air Transportation)]Study the recognition of transition/physical risks by companies based on companies' replies to CDP
Physical risk from variability in precipitation/weather patterns is recognized by the largest number of companies (2/2)
132
3
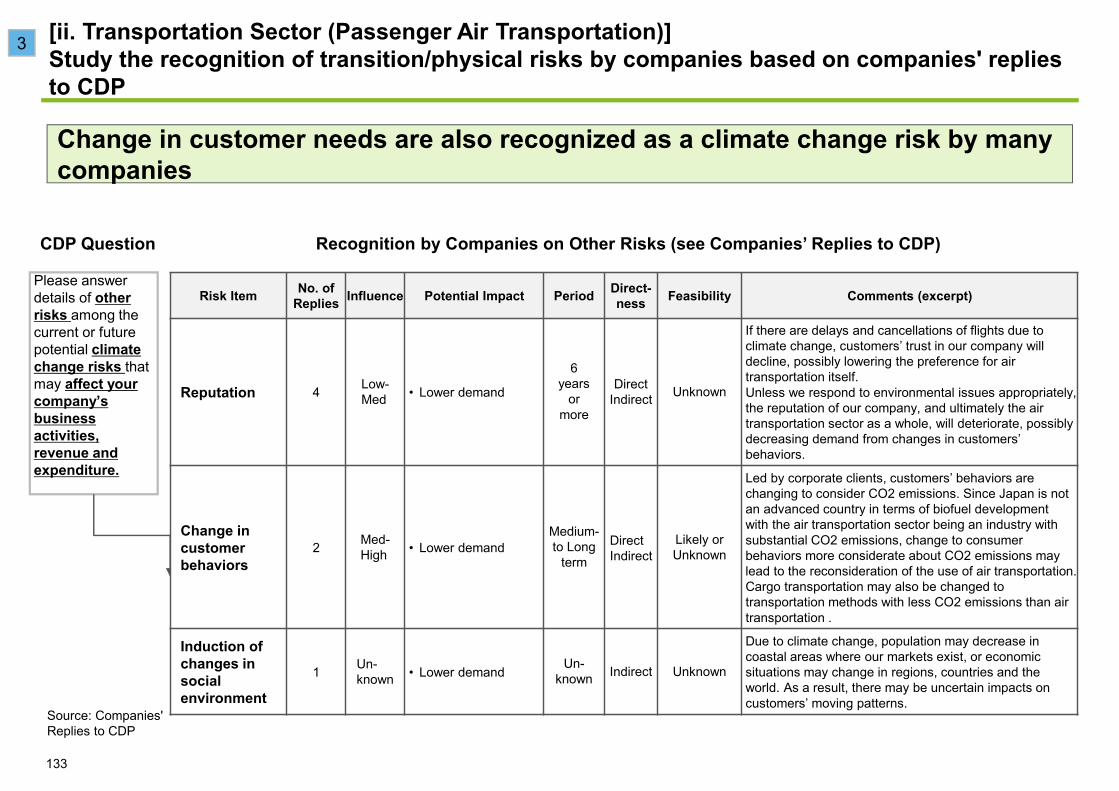
Source: Companies' Replies to CDP
Recognition by Companies on Other Risks (see Companies’ Replies to CDP)CDP Question
Please answer details of other risks among the current or future potential climate change risks that may affect your company’s business activities, revenue and expenditure.
Risk Item No. of Replies Influence Potential Impact Period Direct-
ness Feasibility Comments (excerpt)
Reputation 4 Low-Med • Lower demand
6 years
or more
DirectIndirect Unknown
If there are delays and cancellations of flights due to climate change, customers’ trust in our company will decline, possibly lowering the preference for air transportation itself.Unless we respond to environmental issues appropriately, the reputation of our company, and ultimately the air transportation sector as a whole, will deteriorate, possibly decreasing demand from changes in customers’ behaviors.
Change in customer behaviors
2 Med-High • Lower demand
Medium-to Long
termDirectIndirect
Likely or Unknown
Led by corporate clients, customers’ behaviors are changing to consider CO2 emissions. Since Japan is not an advanced country in terms of biofuel developmentwith the air transportation sector being an industry with substantial CO2 emissions, change to consumer behaviors more considerate about CO2 emissions may lead to the reconsideration of the use of air transportation. Cargo transportation may also be changed to transportation methods with less CO2 emissions than air transportation .
Induction of changes in social environment
1 Un-known • Lower demand Un-
known Indirect Unknown
Due to climate change, population may decrease in coastal areas where our markets exist, or economic situations may change in regions, countries and the world. As a result, there may be uncertain impacts on customers’ moving patterns.
[ii. Transportation Sector (Passenger Air Transportation)]Study the recognition of transition/physical risks by companies based on companies' replies to CDP
Change in customer needs are also recognized as a climate change risk by many companies
133
3

In the transportation industry, storms, cyclones, heavy rains, extreme flood, sea-level rise, and permafrost melt are deemed highly influential physical risks.
Source: "Advancing TCFD guidance on physical climate risks and opportunities”, Global research institute “Measuring physical climate risk in equity portfolios”
Type Physical Risks Influence
Acute Storms and cyclones High
Acute Extreme rainfall and flood High
Acute Extreme heat Medium
Chronic Variability in precipitation Low
Chronic Variability in temperature Low
Chronic Water Stress Low
Chronic Sea-level rise High
Influences given by physical risks differ depending on business characteristics such as water and energy consumptionExamples of specific influences given by physical risks:• Rise in energy cost and burden
on workers due to higher temperatures
• Water shortages and higher operational costs due to water stress
• Asset damage and transfer costs due to cyclones and others
*Excerpt
ChronicAcute
[ii. Transportation Sector (Passenger Air Transportation)]Physical Risk Assessment on Each Industry by EBRD and Others Physical risks deemed highly influential in the transportation industry are four: Storms, cyclones and heavy rains; extreme flood; sea-level rise; and permafrost melt.
4
134
(Reference) Assessment Guidance for Physical Risks and Opportunities from TCFD RecommendationsOverview of the institution
• EBRD (European Bank for Reconstruction and Development): Established after the end of Cold War to develop market economies in central and eastern European countries. It also advocates to promote the “environment-friendly sustainable development” and aggressively makes investments related to climate change.
• GCECA (Global Centre of Excellence on Climate Adaptation): An organization established by the United Nations and governments of countries including the Netherlands. Having partnerships with NGOs, financial institutions and others, it aims to promote adaptation to climate through the sharing of knowledge and development of assessment methods, among others.Summary of the report:
A guidance compiling points to note and indicators for reference when companies assess physical risks and opportunities, taking into account TCFD recommendations. It was prepared after discussions in the working group combining financial institutions and companies, among others. It requires information disclosure and assessment of influence on assets based on analysis by value chain and geography.
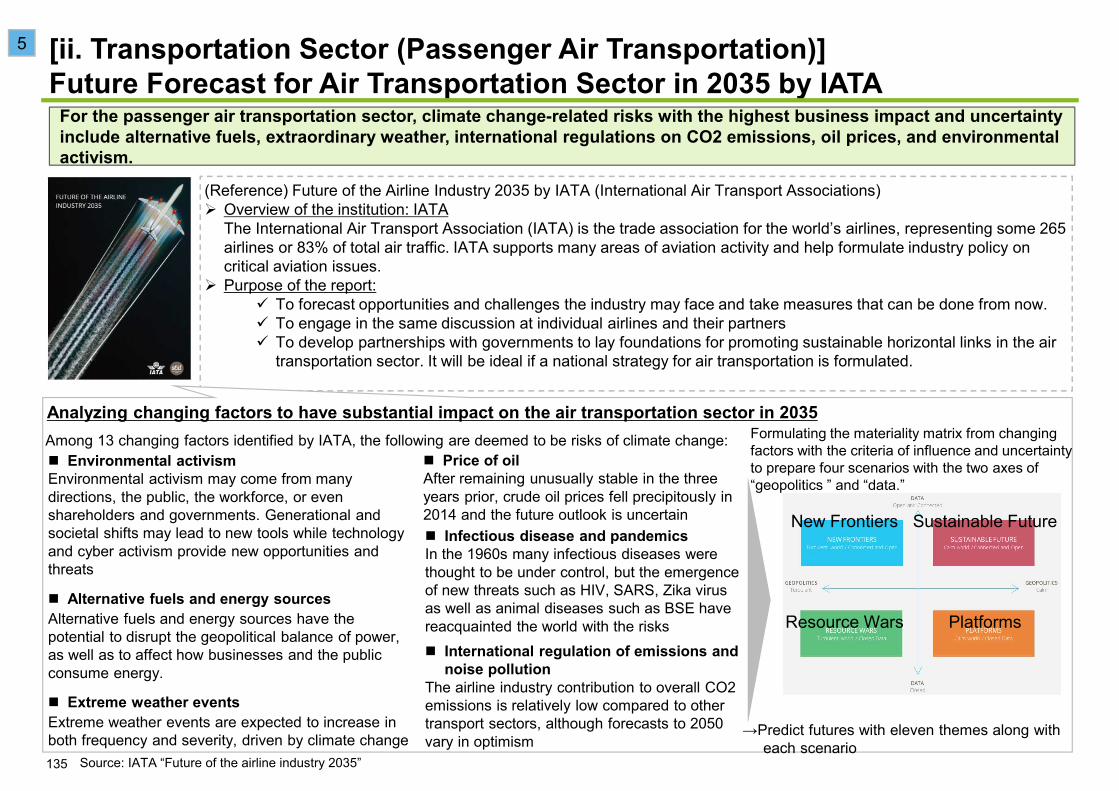
(Reference) Future of the Airline Industry 2035 by IATA (International Air Transport Associations)Overview of the institution: IATAThe International Air Transport Association (IATA) is the trade association for the world’s airlines, representing some 265 airlines or 83% of total air traffic. IATA supports many areas of aviation activity and help formulate industry policy on critical aviation issues.Purpose of the report:
To forecast opportunities and challenges the industry may face and take measures that can be done from now. To engage in the same discussion at individual airlines and their partnersTo develop partnerships with governments to lay foundations for promoting sustainable horizontal links in the air transportation sector. It will be ideal if a national strategy for air transportation is formulated.
Analyzing changing factors to have substantial impact on the air transportation sector in 2035
Source: IATA “Future of the airline industry 2035”
Among 13 changing factors identified by IATA, the following are deemed to be risks of climate change:Environmental activism
Environmental activism may come from many directions, the public, the workforce, or even shareholders and governments. Generational and societal shifts may lead to new tools while technology and cyber activism provide new opportunities and threats
Extreme weather eventsExtreme weather events are expected to increase in both frequency and severity, driven by climate change
Infectious disease and pandemicsIn the 1960s many infectious diseases were thought to be under control, but the emergence of new threats such as HIV, SARS, Zika virus as well as animal diseases such as BSE have reacquainted the world with the risks
International regulation of emissions and noise pollution
The airline industry contribution to overall CO2 emissions is relatively low compared to other transport sectors, although forecasts to 2050 vary in optimism
Formulating the materiality matrix from changing factors with the criteria of influence and uncertainty to prepare four scenarios with the two axes of “geopolitics ” and “data.”
→Predict futures with eleven themes along with each scenario
Price of oilAfter remaining unusually stable in the three years prior, crude oil prices fell precipitously in 2014 and the future outlook is uncertain
Alternative fuels and energy sourcesAlternative fuels and energy sources have the potential to disrupt the geopolitical balance of power, as well as to affect how businesses and the public consume energy.
New Frontiers Sustainable Future
Resource Wars Platforms
[ii. Transportation Sector (Passenger Air Transportation)]Future Forecast for Air Transportation Sector in 2035 by IATA
For the passenger air transportation sector, climate change-related risks with the highest business impact and uncertainty include alternative fuels, extraordinary weather, international regulations on CO2 emissions, oil prices, and environmental activism.
5
135

(Reference) Climate change resilience handbook by a major U.S. insurance company Marsh & McLennanOverview of the company:Marsh & McLennanA major insurance group company headquartered in New York, U.S., providing advisory and solutions in the areas of risk, strategy and human capital.Purpose of the report:
It states measures, with case studies, for business strategy, financial strategy, and risk management to increase resilience to climate change risksIt states strategic issues for climate change risks in each industry of retail supermarkets, electric power, airlines and energy industries.
Explaining risks and opportunities of emission regulations for the air transportation sector
Source: “Climate Resilience 2018 Handbook ”
Opportunities: With the promotion of expanded use of renewable jet fuels by regulations, early strategic actions will create opportunities.
Measures to implement opportunities (examples)• Gradually expand the use of bio-refinery renewable jet fuels to
reduce fuel cost and increase their availability. • Collaborate with airports and airframe manufacturers to develop
airframes and structures capable of efficient fuel transportation, while meeting manufacturing requirements of engines.
• Use government funds to allocate resources actively to R&D in sustainable renewable fuels
Risks: GHG emissions are expected to increase in proportion to demand for airlines, which will be about double the current level by 2035. As emission regulations are planned to be in place within several years, it is required to further move to renewable energies. In addition, emission cost to be offset by CORSIA scheme* is expected to be lower than variable cost of energy.
*Carbon Offsetting and Reduction Scheme for International Aviation:
[ii. Transportation Sector (Passenger Air Transportation)]Measures by US Insurance Company to Increase Resilience to Climate ChangeAs transition risk from GHG emission regulation is high for the passenger air transportation sector, it will be important to actively make early investment in renewable energies and fuel efficiency.
6
136
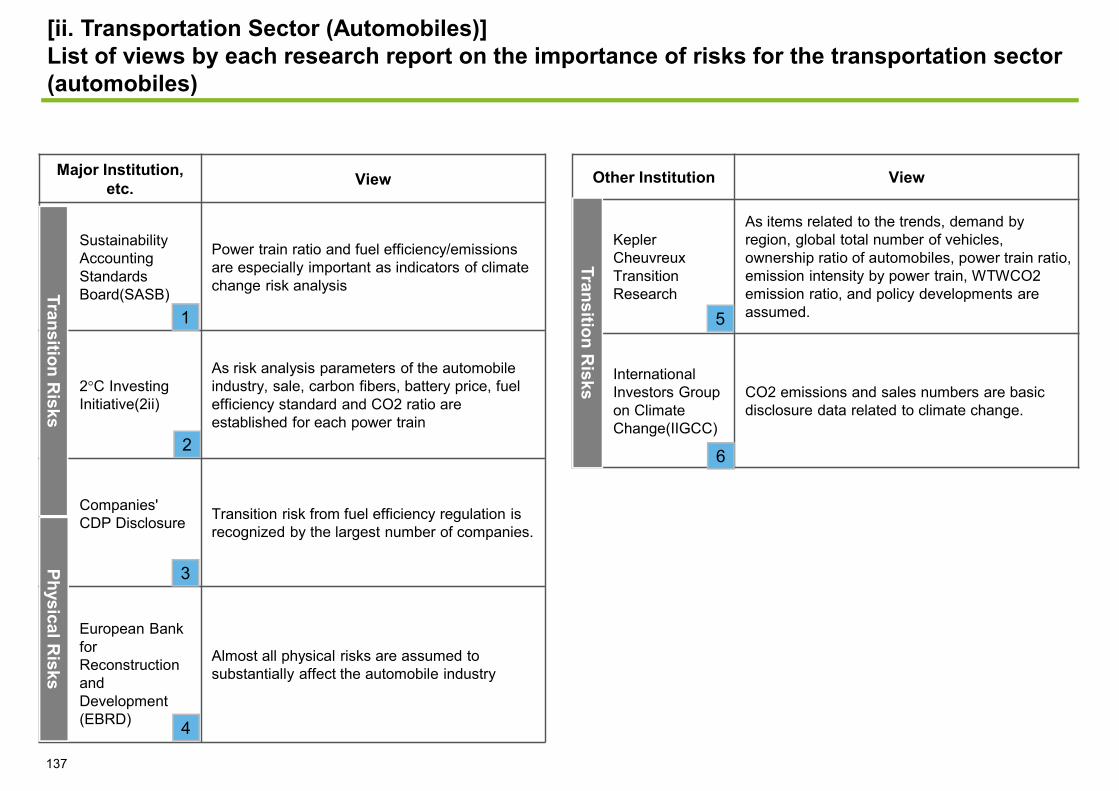
[ii. Transportation Sector (Automobiles)]List of views by each research report on the importance of risks for the transportation sector (automobiles)
Major Institution, etc. View
Sustainability Accounting Standards Board(SASB)
Power train ratio and fuel efficiency/emissions are especially important as indicators of climate change risk analysis
2 C Investing Initiative(2ii)
As risk analysis parameters of the automobile industry, sale, carbon fibers, battery price, fuel efficiency standard and CO2 ratio are established for each power train
Companies' CDP Disclosure Transition risk from fuel efficiency regulation is
recognized by the largest number of companies.
European Bank for Reconstruction and Development (EBRD)
Almost all physical risks are assumed to substantially affect the automobile industry
Transition Risks
Physical Risks
1
2
3
4
Other Institution View
Kepler Cheuvreux Transition Research
As items related to the trends, demand by region, global total number of vehicles, ownership ratio of automobiles, power train ratio, emission intensity by power train, WTWCO2 emission ratio, and policy developments are assumed.
International Investors Group on Climate Change(IIGCC)
CO2 emissions and sales numbers are basic disclosure data related to climate change.
Transition Risks
5
137
6

[ii. Transportation Sector (Automobiles)]Sustainability Disclosure Standards Requested by SASB
Source: SASB, ”Automobiles Sustainability Accounting Standard”、Industry Brief(2014)
Topics Accounting Indicators Required to be Disclosed
FuelEconomy & Use-phase Emissions
Sales-weighted average passenger fleet fuel economy, consumption, or emissions, by region
Number of (1) zero emission vehicles (ZEV) sold, (2) hybrid vehicles sold, and (3) plug-in hybrid vehicles sold
Disclosure TopicsImportant Disclosure Items for Automobile
IndustryEnvironment Materials Efficiency &
Recycling
Social Capital Product Safety
Human Capital Labor Relations
Business Model & Innovation
Fuel Economy & Use-phase Emissions
Leadership and Governance
Materials Sourcing
(Reference) Standards by SASB for each industry concerning information disclosure to investors on sustainability Overview of the institution: SASB (Sustainability Accounting Standard Board)A non-profit body to promote the disclosure of information on sustainability to meet the needs of investorsSummary of the report:
Formulating and publishing sustainability accounting standards of each industry for the disclosure of financial information Regarding five environmental disclosure items (environment, social impacts, human resources, business models and innovations, leadership and governance), presenting items unique to the automobile industry and preparing disclosure indicators as sustainability standards.
Regarding GHG emissions as an important disclosure item for the automobile industry, two indicators related to “fuel efficiency and emissions” are established
For other environment-related items, “Material efficiency and recycle” arising from the scarcity of resources are established as disclosure items.Disclosure items for parts and the rental sector are also published, in addition to the automobile sector. For both, disclosure is required for items related to material efficiency and recycle, and fuel efficiency.
Response to GHG emissions is an important issue for the automobile industry
Accumulation of GHG emitted by automobiles will have a substantial effect on climate change on a global scaleTo reduce the risk of decreasing competitiveness and demand, it is necessary to meet fuel and emission standards required by the society.In fact, regulations on emissions and fuel efficiency for vehicles are increasingly becoming stricter globally.
Power train ratio and fuel efficiency/emissions are especially important as indicators of climate change risk analysis
1
138
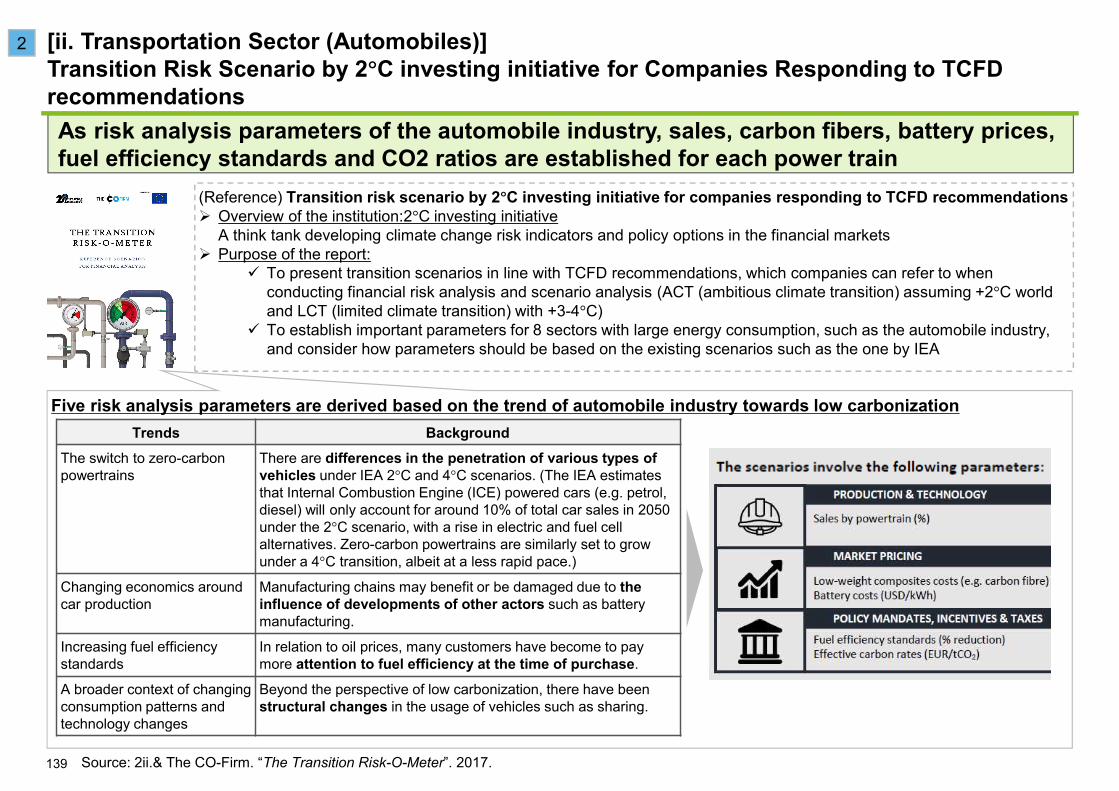
[ii. Transportation Sector (Automobiles)]Transition Risk Scenario by 2 C investing initiative for Companies Responding to TCFD recommendations
Trends BackgroundThe switch to zero-carbon powertrains
There are differences in the penetration of various types of vehicles under IEA 2 C and 4 C scenarios. (The IEA estimates that Internal Combustion Engine (ICE) powered cars (e.g. petrol, diesel) will only account for around 10% of total car sales in 2050 under the 2 C scenario, with a rise in electric and fuel cell alternatives. Zero-carbon powertrains are similarly set to grow under a 4 C transition, albeit at a less rapid pace.)
Changing economics around car production
Manufacturing chains may benefit or be damaged due to the influence of developments of other actors such as battery manufacturing.
Increasing fuel efficiency standards
In relation to oil prices, many customers have become to pay more attention to fuel efficiency at the time of purchase.
A broader context of changingconsumption patterns and technology changes
Beyond the perspective of low carbonization, there have been structural changes in the usage of vehicles such as sharing.
(Reference) Transition risk scenario by 2 C investing initiative for companies responding to TCFD recommendationsOverview of the institution:2 C investing initiativeA think tank developing climate change risk indicators and policy options in the financial marketsPurpose of the report:
To present transition scenarios in line with TCFD recommendations, which companies can refer to when conducting financial risk analysis and scenario analysis (ACT (ambitious climate transition) assuming +2 C world and LCT (limited climate transition) with +3-4 C)To establish important parameters for 8 sectors with large energy consumption, such as the automobile industry, and consider how parameters should be based on the existing scenarios such as the one by IEA
Five risk analysis parameters are derived based on the trend of automobile industry towards low carbonization
As risk analysis parameters of the automobile industry, sales, carbon fibers, battery prices, fuel efficiency standards and CO2 ratios are established for each power train
2
139 Source: 2ii.& The CO-Firm. “The Transition Risk-O-Meter”. 2017.
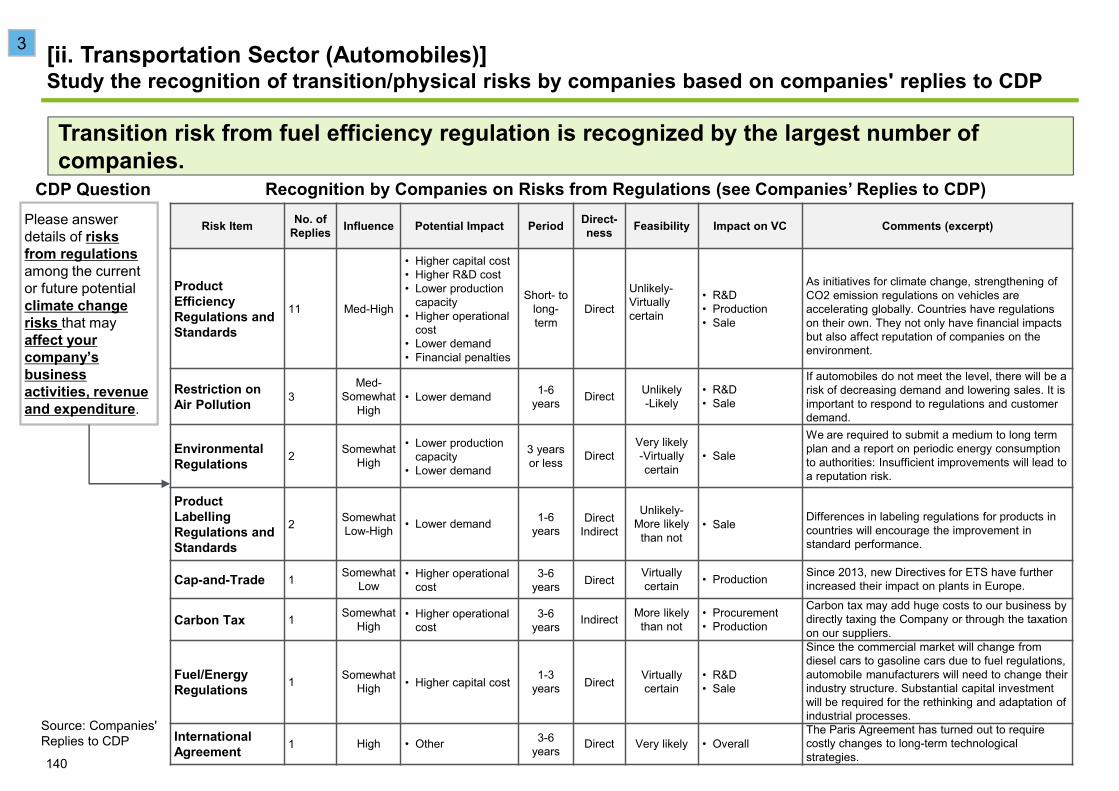
Transition risk from fuel efficiency regulation is recognized by the largest number of companies.
[ii. Transportation Sector (Automobiles)]Study the recognition of transition/physical risks by companies based on companies' replies to CDP
Risk Item No. of Replies Influence Potential Impact Period Direct-
ness Feasibility Impact on VC Comments (excerpt)
Product Efficiency Regulations and Standards
11 Med-High
• Higher capital cost• Higher R&D cost• Lower production
capacity• Higher operational
cost• Lower demand• Financial penalties
Short- to long-term
Direct
Unlikely-Virtually certain
• R&D• Production• Sale
As initiatives for climate change, strengthening of CO2 emission regulations on vehicles are accelerating globally. Countries have regulations on their own. They not only have financial impacts but also affect reputation of companies on the environment.
Restriction on Air Pollution 3
Med-Somewhat
High• Lower demand 1-6
years Direct Unlikely-Likely
• R&D• Sale
If automobiles do not meet the level, there will be a risk of decreasing demand and lowering sales. It is important to respond to regulations and customer demand.
Environmental Regulations 2 Somewhat
High
• Lower production capacity
• Lower demand
3 years or less Direct
Very likely-Virtually certain
• Sale
We are required to submit a medium to long term plan and a report on periodic energy consumption to authorities: Insufficient improvements will lead to a reputation risk.
Product Labelling Regulations and Standards
2 Somewhat Low-High • Lower demand 1-6
yearsDirect
Indirect
Unlikely-More likely
than not• Sale Differences in labeling regulations for products in
countries will encourage the improvement in standard performance.
Cap-and-Trade 1 Somewhat Low
• Higher operational cost
3-6 years Direct Virtually
certain • Production Since 2013, new Directives for ETS have further increased their impact on plants in Europe.
Carbon Tax 1 Somewhat High
• Higher operational cost
3-6 years Indirect More likely
than not• Procurement• Production
Carbon tax may add huge costs to our business by directly taxing the Company or through the taxation on our suppliers.
Fuel/Energy Regulations 1 Somewhat
High • Higher capital cost 1-3 years Direct Virtually
certain• R&D• Sale
Since the commercial market will change from diesel cars to gasoline cars due to fuel regulations, automobile manufacturers will need to change their industry structure. Substantial capital investment will be required for the rethinking and adaptation of industrial processes.
International Agreement 1 High • Other 3-6
years Direct Very likely • OverallThe Paris Agreement has turned out to require costly changes to long-term technological strategies.
Source: Companies' Replies to CDP
Recognition by Companies on Risks from Regulations (see Companies’ Replies to CDP)Please answer details of risks from regulations among the current or future potential climate change risks that may affect your company’s business activities, revenue and expenditure.
CDP Question
3
140

Source: Companies' Replies to CDP
Please answer details of risk from regulations among the current or future potential climate change risks that may affect your company’s business activities, revenue and expenditure
Risk Item No. of Replies Influence Potential Impact Period Direct-
ness Feasibility Impact on VC Comments (excerpt)
Changes in Heavy Rains and Drought
9 Low-High• Lower
production capacity
Short-to long-
term
DirectIndirect
Unlikely-Very likely
•Procurement• Production• Sale
Typhoons, floods and droughts among others cause substantial damage to operations. We are currently operating in regions with extreme climate risks including India and Thailand, while having suffered a considerable loss due to a cyclone in the past.
Changes in Natural Resources
3 Low-Med • Higher operational cost
1-3 years
DirectIndirect
About as likely as not-More likely
than not
• Procurement• Production
We may see the shortage of water, metal resources and the like, possibly leading to unstable supply. Due to the spread of supply chains all over the world, there will be a still higher risk of natural resources shortage.
Extreme variability in temperature
3 Low-Med
• Lower production capacity
• Lower demand
Short-to long-
term
DirectIndirect
Likely-More likely
than not
• Procurement• Production• Sale
Extreme temperatures and weather phenomena will occur due to climate change. Such extreme changes could incur damage to production sites and transportation infrastructure among others.
Changes in Precipitation Patterns
2
Somewhat Low-
Somewhat High
• Lower production capacity
Short-to long-
term
DirectIndirect Likely •Procurement
•Production
There are extraordinary weather conditions all over the world that seem to have been caused by climate change. In particular, if facilities of main suppliers are affected by typhoons and floods with the effect of heavy rains, delivery may be delayed and operating ratio may be decreased and possibly making it impossible to maintainstable operations.
Tropical cyclone (typhoon/ hurricane)
1 High• Lower
production capacity
1 year or less Indirect Likely • Procurement
• Production
As climate change continues to raise the sea surface temperatures, strong tropical storms will increase in the Asian region, leading to floods of rivers, possibly putting our operations and supply chains in danger.
Transition risk from fuel efficiency regulation is recognized by the largest number of companies.
[ii. Transportation Sector (Automobiles)]Study the recognition of transition/physical risks by companies based on companies' replies to CDP
Recognition by Companies on Risks from Regulations (see Companies’ Replies to CDP)CDP Question
141
3

Source: Companies' Replies to CDP
Please answer details of risk from regulations among the current or future potential climate change risks that may affect your company’s business activities, revenue and expenditure.
Risk Item No. of Replies Influence Potential
Impact Period Direct-ness Feasibility Impact on
VC Comments (excerpt)
Change in customer behaviors
7Med-Somewhat High
• Lower demand
Short- to long-term
DirectIndirect
About as likely as not-Very likely
• R&D• Sale
Changes in consumer behaviors will decrease theshare in the market and profit. For example, fuelprices and tax incentives are thought to affectcustomer behaviors.
Reputation 3 Somewhat High
• Lower demand
1-6 years
DirectIndirect
Likely-Very likely • Sale
Consumers are concerned about climate change,and companies unable to respond to it will invite thedecline of their trust and brand, possibly decreasingthe number of cars sold and damaging companycapital.
Changes in Socio-economic Conditions
1 Med • Lower demand
3-6 years Direct Likely • Sale
Due to the decrease in purchasing power,consumers tend to hesitate to buy new cars, andrather seek new mobility services to optimize theuse of individual cars.
Uncertainty of Market Signals
1 Somewhat High
• Response to regulations
1 year or less Direct Likely • Sale
When gasoline prices are high, consumers maychoose trains and other transportation means ratherthan automobiles.
Transition risk from fuel efficiency regulation is recognized by the largest number of companies.
[ii. Transportation Sector (Automobiles)]Study the recognition of transition/physical risks by companies based on companies' replies to CDP
Recognition by Companies on Risks from Regulations (see Companies’ Replies to CDP)CDP Question
142
3

The number of items of physical risks that have substantial effects on the automobile industry is next to those of the material industry, the public infrastructure industry, and the food production industry.
[ii. Transportation Sector (Automobiles)]EBRD Assessment Guidance on Physical Risks and Opportunities
Source: EBRE, ”Advancing TCFD guidance on physical climate risks and opportunities”(2018), Global research institute “Measuring physical climate risk in equity portfolios”(2017)
Influences from physical risks differ depending on business characteristics such as water and energy consumption
Examples of specific influences given by physical risks:
• Rise in energy cost and burden on workers due to higher temperatures
• Water shortage and higher operational cost due to water stress
• Asset damage and transfer costs due to cyclones and others
*Table on the left is an excerpt.
ChronicAcute
4
Almost all physical risks are assumed to substantially affect the automobile industry
143
(Reference) Assessment Guidance for Physical Risks and Opportunities by Initiatives Receiving TCFD recommendationsOverview of the institution:
• EBRD (European Bank for Reconstruction and Development): Established after the end of Cold War to develop market economies in central and eastern European countries. It also advocates promotion of the “environment-friendly sustainable development” and aggressively makes investments related to climate change.
• GCECA (Global Centre of Excellence on Climate Adaptation): An organization established by the United Nations and governments of countries including the Netherlands. Having partnerships with NGOs, financial institutions and others, it aims to promote adaptation to climate through the sharing of knowledge and development of assessment methods, among others.Summary of the report:
A guidance compiling points to note and indicators for reference when companies assess physical risks and opportunities, taking into account TCFD recommendations. It was prepared after discussions in the working group combining financial institutions and companies, among others. It requires information disclosure and assessment of influence on assets based on analysis by value chain and geography.
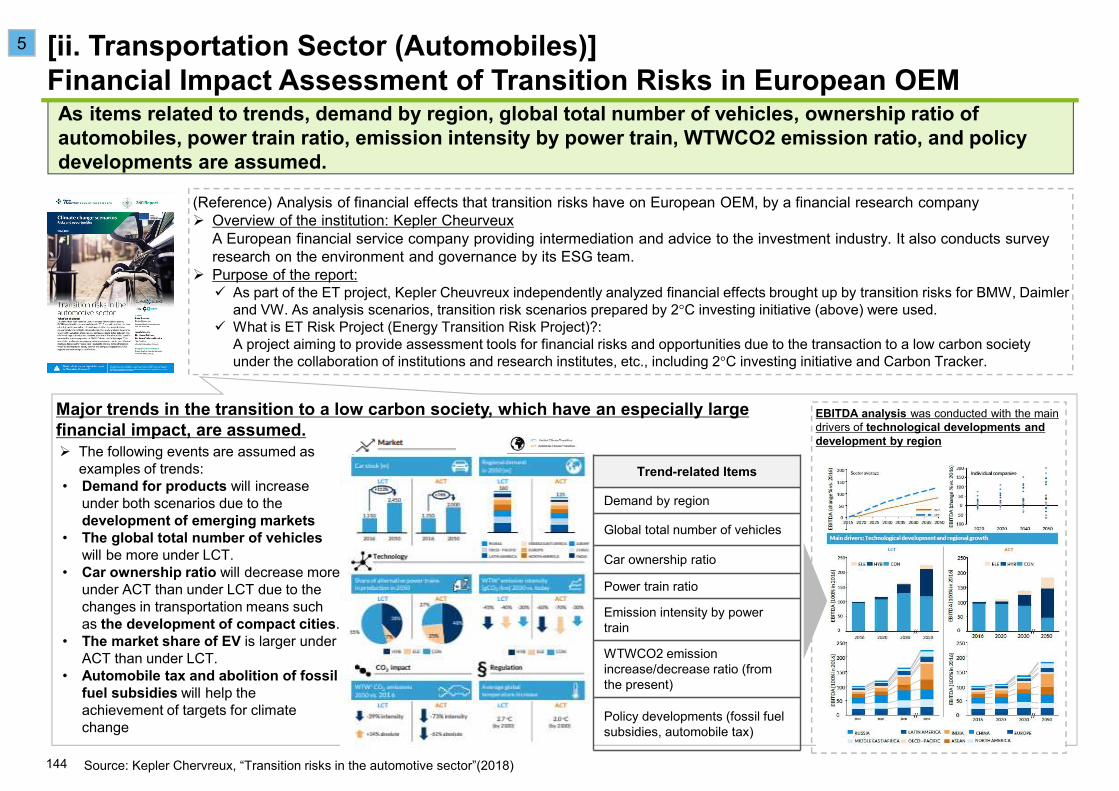
(Reference) Analysis of financial effects that transition risks have on European OEM, by a financial research companyOverview of the institution: Kepler CheurveuxA European financial service company providing intermediation and advice to the investment industry. It also conducts survey research on the environment and governance by its ESG team.Purpose of the report:
As part of the ET project, Kepler Cheuvreux independently analyzed financial effects brought up by transition risks for BMW, Daimler and VW. As analysis scenarios, transition risk scenarios prepared by 2 C investing initiative (above) were used.What is ET Risk Project (Energy Transition Risk Project)?:A project aiming to provide assessment tools for financial risks and opportunities due to the transaction to a low carbon society under the collaboration of institutions and research institutes, etc., including 2 C investing initiative and Carbon Tracker.
Major trends in the transition to a low carbon society, which have an especially large financial impact, are assumed.
[ii. Transportation Sector (Automobiles)]Financial Impact Assessment of Transition Risks in European OEM
Source: Kepler Chervreux, “Transition risks in the automotive sector”(2018)
The following events are assumed as examples of trends:
• Demand for products will increase under both scenarios due to the development of emerging markets
• The global total number of vehicleswill be more under LCT.
• Car ownership ratio will decrease more under ACT than under LCT due to the changes in transportation means such as the development of compact cities.
• The market share of EV is larger under ACT than under LCT.
• Automobile tax and abolition of fossil fuel subsidies will help the achievement of targets for climate change
EBITDA analysis was conducted with the main drivers of technological developments and development by region
Trend-related Items
Demand by region
Global total number of vehicles
Car ownership ratio
Power train ratio
Emission intensity by power train
WTWCO2 emission increase/decrease ratio (from the present)
Policy developments (fossil fuel subsidies, automobile tax)
As items related to trends, demand by region, global total number of vehicles, ownership ratio of automobiles, power train ratio, emission intensity by power train, WTWCO2 emission ratio, and policy developments are assumed.
5
144
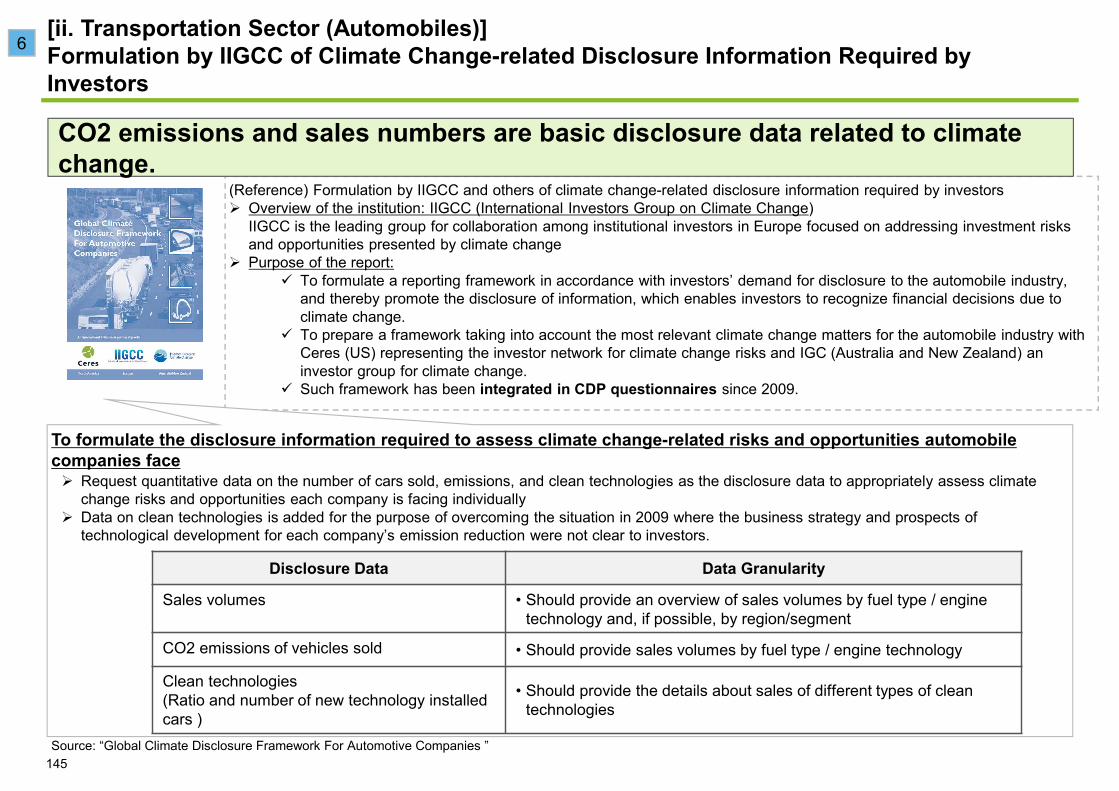
(Reference) Formulation by IIGCC and others of climate change-related disclosure information required by investorsOverview of the institution: IIGCC (International Investors Group on Climate Change)IIGCC is the leading group for collaboration among institutional investors in Europe focused on addressing investment risks and opportunities presented by climate changePurpose of the report:
To formulate a reporting framework in accordance with investors’ demand for disclosure to the automobile industry, and thereby promote the disclosure of information, which enables investors to recognize financial decisions due to climate change.To prepare a framework taking into account the most relevant climate change matters for the automobile industry with Ceres (US) representing the investor network for climate change risks and IGC (Australia and New Zealand) an investor group for climate change.Such framework has been integrated in CDP questionnaires since 2009.
To formulate the disclosure information required to assess climate change-related risks and opportunities automobile companies face
[ii. Transportation Sector (Automobiles)] Formulation by IIGCC of Climate Change-related Disclosure Information Required by Investors
Source: “Global Climate Disclosure Framework For Automotive Companies ”
Disclosure Data Data Granularity
Sales volumes • Should provide an overview of sales volumes by fuel type / engine technology and, if possible, by region/segment
CO2 emissions of vehicles sold • Should provide sales volumes by fuel type / engine technology
Clean technologies(Ratio and number of new technology installed cars )
• Should provide the details about sales of different types of clean technologies
Request quantitative data on the number of cars sold, emissions, and clean technologies as the disclosure data to appropriately assess climate change risks and opportunities each company is facing individuallyData on clean technologies is added for the purpose of overcoming the situation in 2009 where the business strategy and prospects of technological development for each company’s emission reduction were not clear to investors.
6
CO2 emissions and sales numbers are basic disclosure data related to climate change.
145
Chapter 4 References on Degree of Risk Importance in Selected SectorsThis chapter provides materials for scenario analysis, part of which were used for assessment of the degree of risk importance under the Ministry’s support program
146
4. References on Degree of Risk Importance in Selected Sectors i. Energy Sectorii. Transportation Sector (Maritime Transportation,
Passenger Air Transportation, Automobiles)iii. Buildings/Forest Products Sector
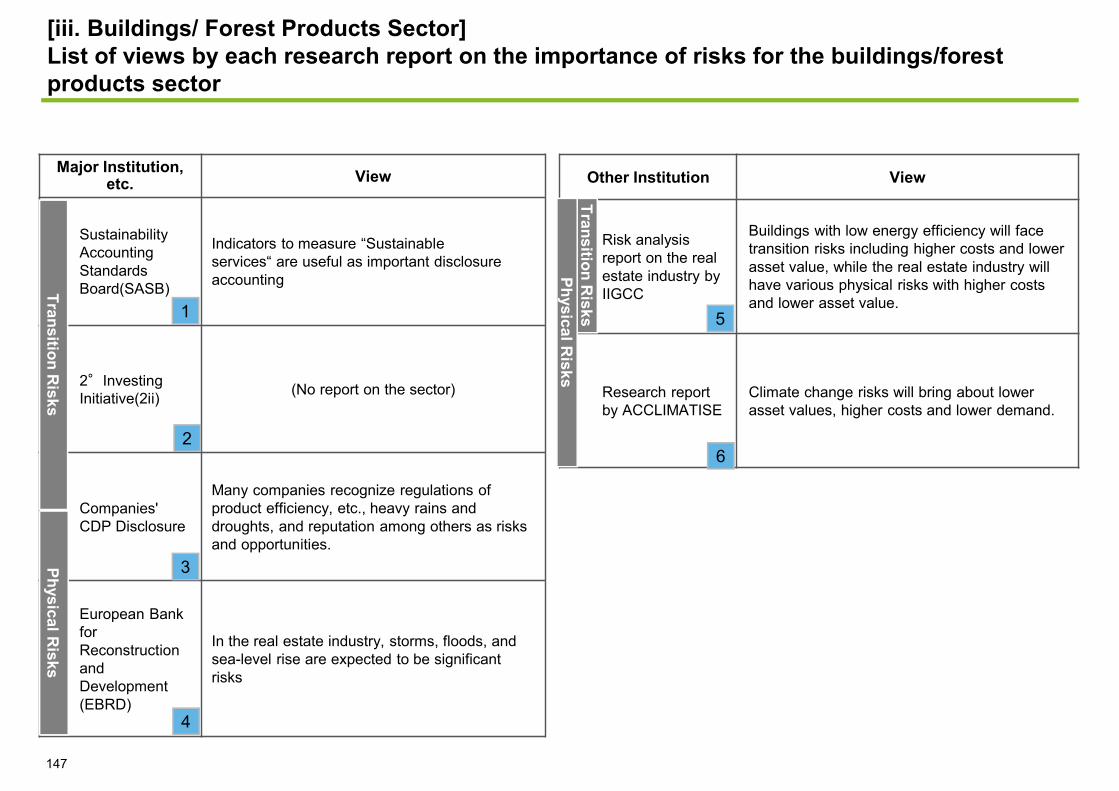
[iii. Buildings/ Forest Products Sector]List of views by each research report on the importance of risks for the buildings/forest products sector
Major Institution, etc. View
Sustainability Accounting Standards Board(SASB)
Indicators to measure “Sustainable services“ are useful as important disclosure accounting
2°Investing Initiative(2ii) (No report on the sector)
Companies' CDP Disclosure
Many companies recognize regulations of product efficiency, etc., heavy rains and droughts, and reputation among others as risks and opportunities.
European Bank for Reconstruction and Development (EBRD)
In the real estate industry, storms, floods, and sea-level rise are expected to be significant risks
Transition Risks
Physical Risks
1
2
3
4
Other Institution View
Risk analysis report on the real estate industry by IIGCC
Buildings with low energy efficiency will face transition risks including higher costs and lower asset value, while the real estate industry will have various physical risks with higher costs and lower asset value.
Research report by ACCLIMATISE
Climate change risks will bring about lower asset values, higher costs and lower demand.
Transition Risks 5
147
6
Physical Risks
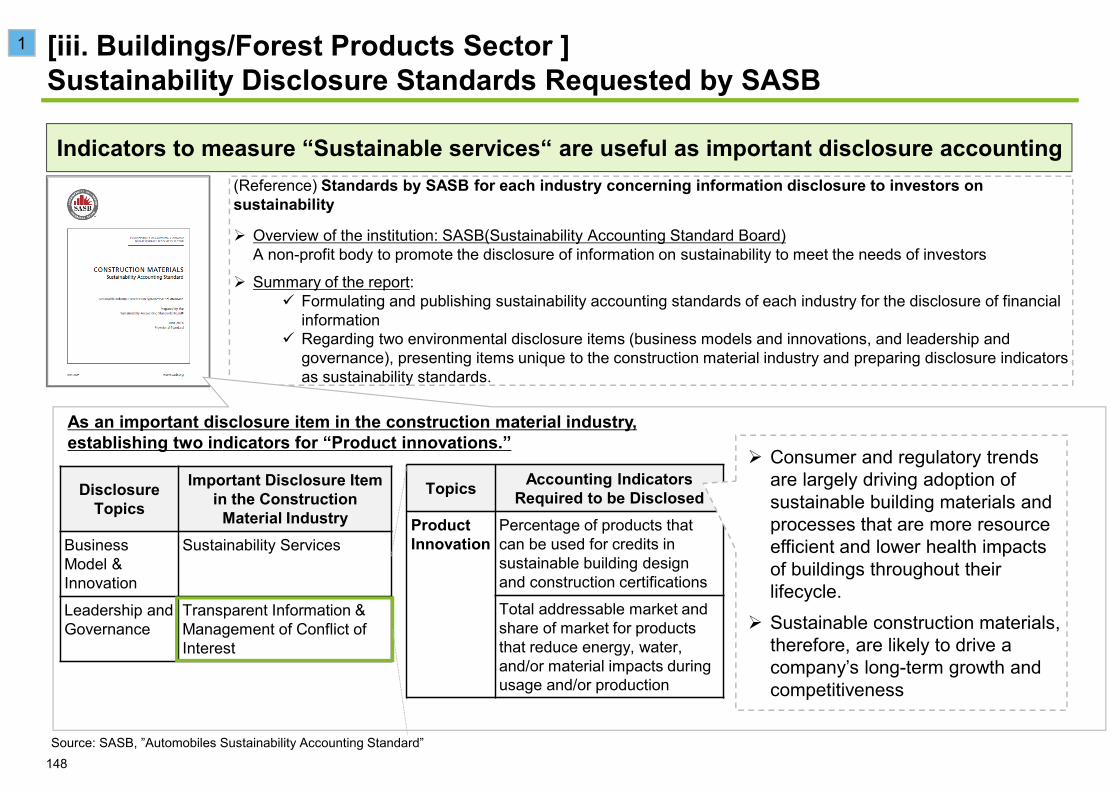
(Reference) Standards by SASB for each industry concerning information disclosure to investors on sustainability
Overview of the institution: SASB(Sustainability Accounting Standard Board)A non-profit body to promote the disclosure of information on sustainability to meet the needs of investors
Summary of the report:Formulating and publishing sustainability accounting standards of each industry for the disclosure of financial information Regarding two environmental disclosure items (business models and innovations, and leadership and governance), presenting items unique to the construction material industry and preparing disclosure indicators as sustainability standards.
As an important disclosure item in the construction material industry, establishing two indicators for “Product innovations.”
Source: SASB, ”Automobiles Sustainability Accounting Standard”
Topics Accounting Indicators Required to be Disclosed
ProductInnovation
Percentage of products that can be used for credits in sustainable building design and construction certifications
Total addressable market and share of market for products that reduce energy, water, and/or material impacts during usage and/or production
DisclosureTopics
Important Disclosure Item in the Construction
Material IndustryBusinessModel & Innovation
Sustainability Services
Leadership and Governance
Transparent Information & Management of Conflict of Interest
Consumer and regulatory trends are largely driving adoption of sustainable building materials and processes that are more resource efficient and lower health impacts of buildings throughout their lifecycle.Sustainable construction materials, therefore, are likely to drive a company’s long-term growth and competitiveness
[iii. Buildings/Forest Products Sector ]Sustainability Disclosure Standards Requested by SASB
Indicators to measure “Sustainable services“ are useful as important disclosure accounting
1
148
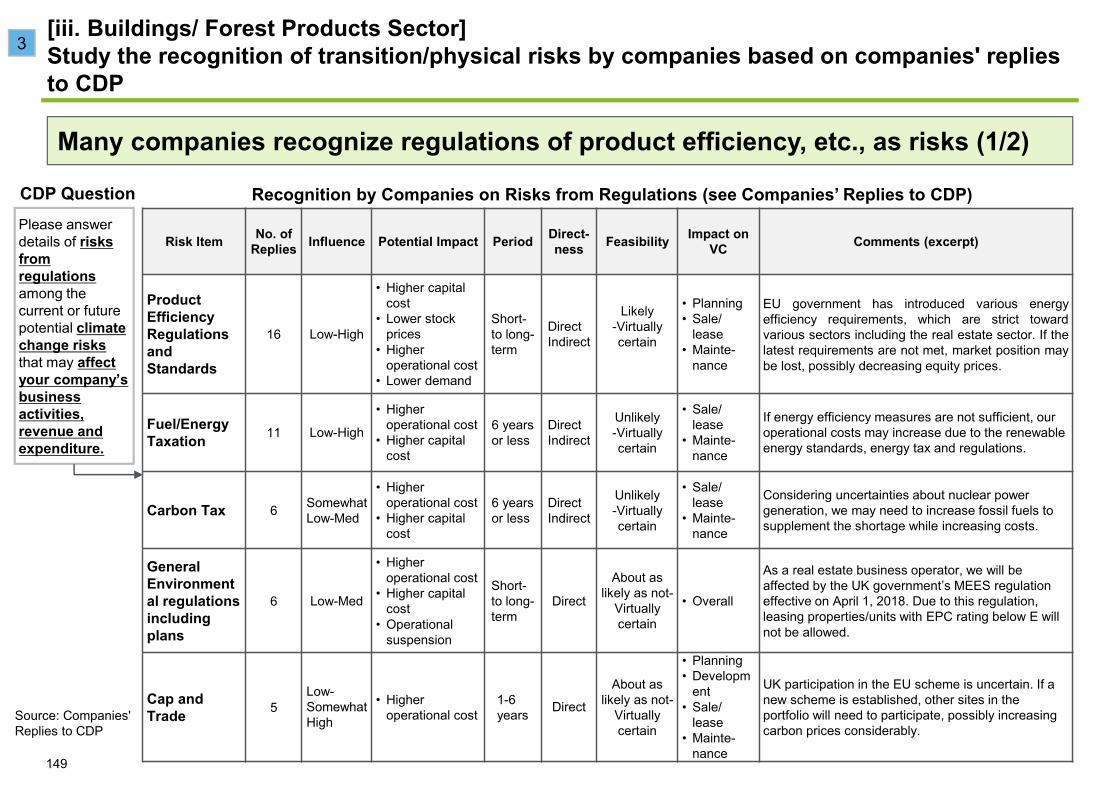
[iii. Buildings/ Forest Products Sector]Study the recognition of transition/physical risks by companies based on companies' replies to CDP
Risk Item No. of Replies Influence Potential Impact Period Direct-
ness Feasibility Impact on VC Comments (excerpt)
Product Efficiency Regulations and Standards
16 Low-High
• Higher capital cost
• Lower stock prices
• Higher operational cost
• Lower demand
Short-to long-term
DirectIndirect
Likely-Virtually certain
• Planning• Sale/
lease• Mainte-
nance
EU government has introduced various energyefficiency requirements, which are strict towardvarious sectors including the real estate sector. If thelatest requirements are not met, market position maybe lost, possibly decreasing equity prices.
Fuel/Energy Taxation 11 Low-High
• Higher operational cost
• Higher capital cost
6 years or less
DirectIndirect
Unlikely-Virtually certain
• Sale/ lease
• Mainte-nance
If energy efficiency measures are not sufficient, our operational costs may increase due to the renewable energy standards, energy tax and regulations.
Carbon Tax 6 Somewhat Low-Med
• Higher operational cost
• Higher capital cost
6 years or less
DirectIndirect
Unlikely-Virtually certain
• Sale/ lease
• Mainte-nance
Considering uncertainties about nuclear power generation, we may need to increase fossil fuels to supplement the shortage while increasing costs.
General Environmental regulations including plans
6 Low-Med
• Higher operational cost
• Higher capital cost
• Operational suspension
Short-to long-term
Direct
About as likely as not-
Virtually certain
• Overall
As a real estate business operator, we will be affected by the UK government’s MEES regulation effective on April 1, 2018. Due to this regulation, leasing properties/units with EPC rating below E will not be allowed.
Cap and Trade 5
Low-Somewhat High
• Higher operational cost
1-6 years Direct
About as likely as not-
Virtually certain
• Planning• Developm
ent• Sale/
lease• Mainte-
nance
UK participation in the EU scheme is uncertain. If a new scheme is established, other sites in the portfolio will need to participate, possibly increasing carbon prices considerably.
Source: Companies' Replies to CDP
Recognition by Companies on Risks from Regulations (see Companies’ Replies to CDP)Please answer details of risks from regulations among the current or future potential climate change risks that may affect your company’s business activities, revenue and expenditure.
CDP Question
3
149
Many companies recognize regulations of product efficiency, etc., as risks (1/2)

[iii. Buildings/ Forest Products Sector ]Study the recognition of transition/physical risks by companies based on companies' replies to CDP
Risk Item No. of Replies Influence Potential
Impact Period Direct-ness Feasibility Impact on VC Comments (excerpt)
Obligation to Report Emissions
5Low-
Somewhat High
• Higher operational cost
3 years or less Direct
About as likely as not-
Virtually certain
• Maintenance
Various emission regulations are implemented in many parts of the world. If reporting obligations continue to increase, it may increase our operational costs.
International Agreement 3
Somewhat Low-
Somewhat High
• Higher operational cost
3 years or more Direct
About as likely as not-Very likely
• Planning• Maintenance
If the UK is excluded from the EU scheme, energy imports from the EU will be restricted, incurring a risk of building closures and the suspension of customer businesses.
Uncertainties Surrounding New Regulations
3 High • Operational suspension
Short-to long-term
DirectAbout as
likely as not-Likely
• Planning• Sale/lease
It will lead to an additional risk as to how governments will change their policies for the generation of renewable energies and the nation’s carbon emission reduction in accordance with the Paris Agreement.
Restriction on Air Pollution 1 Low • Higher
capital cost1 year or less Direct More likely
than not• Planning• Sale/lease
Laws regulating air pollution may affect plants and other facilities in the Company’s real estate.
Product Labelling Regulations and Standards
1 Somewhat Low
• Lower demand
• Assets becoming obsolete
3-6 years Direct About as
likely as not• Planning• Sale/lease
Energy certificates such as LEED and ENERGY STAR stipulate the minimum permissible energy rating.
Source: Companies' Replies to CDP
Recognition by Companies on Risks from Regulations (see Companies’ Replies to CDP)
Please answer details of risks from regulations among the current or future potential climate change risks that may affect your company’s business activities, revenue and expenditure.
CDP Question
3
150
Many companies recognize regulations of product efficiency, etc., as risks (2/2)
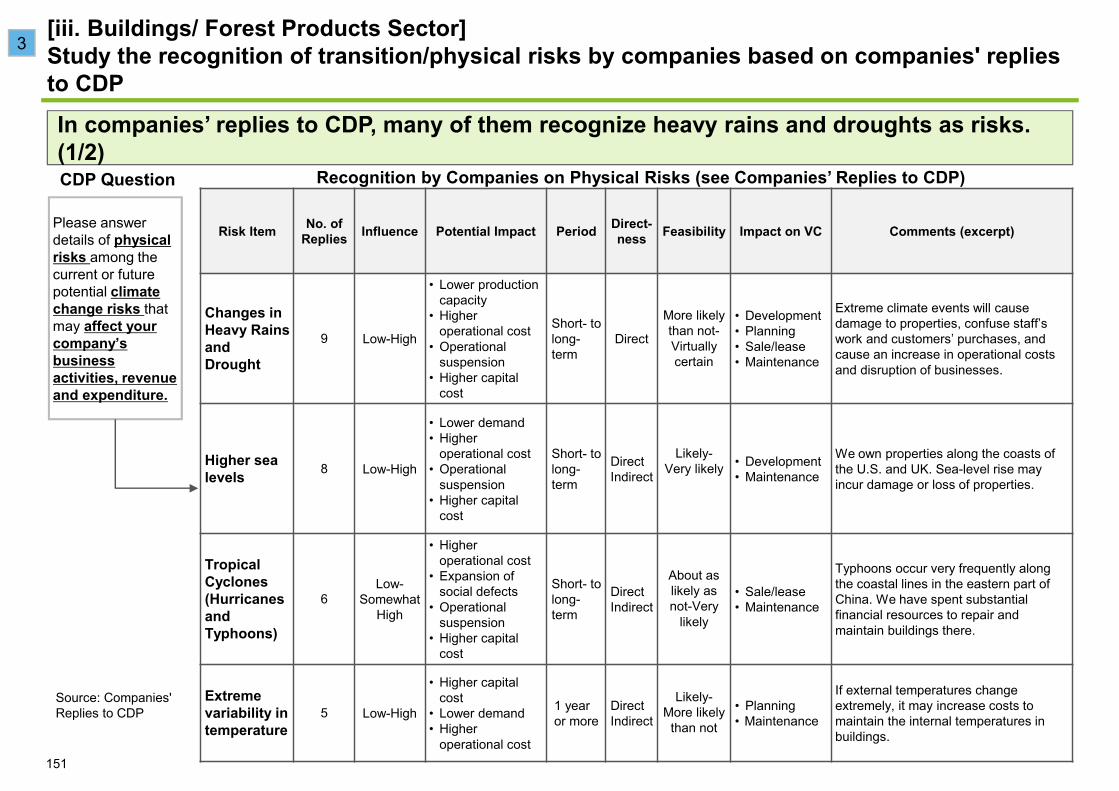
Source: Companies' Replies to CDP
Recognition by Companies on Physical Risks (see Companies’ Replies to CDP)CDP Question
Please answer details of physical risks among the current or future potential climate change risks that may affect your company’s business activities, revenue and expenditure.
Risk Item No. of Replies Influence Potential Impact Period Direct-
ness Feasibility Impact on VC Comments (excerpt)
Changes in Heavy Rains and Drought
9 Low-High
• Lower production capacity
• Higher operational cost
• Operational suspension
• Higher capital cost
Short- to long-term
Direct
More likely than not-Virtually certain
• Development• Planning• Sale/lease• Maintenance
Extreme climate events will cause damage to properties, confuse staff’s work and customers’ purchases, and cause an increase in operational costs and disruption of businesses.
Higher sea levels 8 Low-High
• Lower demand• Higher
operational cost• Operational
suspension• Higher capital
cost
Short- to long-term
DirectIndirect
Likely-Very likely • Development
• Maintenance
We own properties along the coasts of the U.S. and UK. Sea-level rise may incur damage or loss of properties.
Tropical Cyclones (Hurricanes and Typhoons)
6Low-
Somewhat High
• Higher operational cost
• Expansion of social defects
• Operational suspension
• Higher capital cost
Short- to long-term
DirectIndirect
About as likely as not-Very
likely
• Sale/lease• Maintenance
Typhoons occur very frequently along the coastal lines in the eastern part of China. We have spent substantial financial resources to repair and maintain buildings there.
Extreme variability in temperature
5 Low-High
• Higher capital cost
• Lower demand• Higher
operational cost
1 year or more
DirectIndirect
Likely-More likely
than not
• Planning• Maintenance
If external temperatures change extremely, it may increase costs to maintain the internal temperatures in buildings.
[iii. Buildings/ Forest Products Sector]Study the recognition of transition/physical risks by companies based on companies' replies to CDP
3
151
In companies’ replies to CDP, many of them recognize heavy rains and droughts as risks. (1/2)
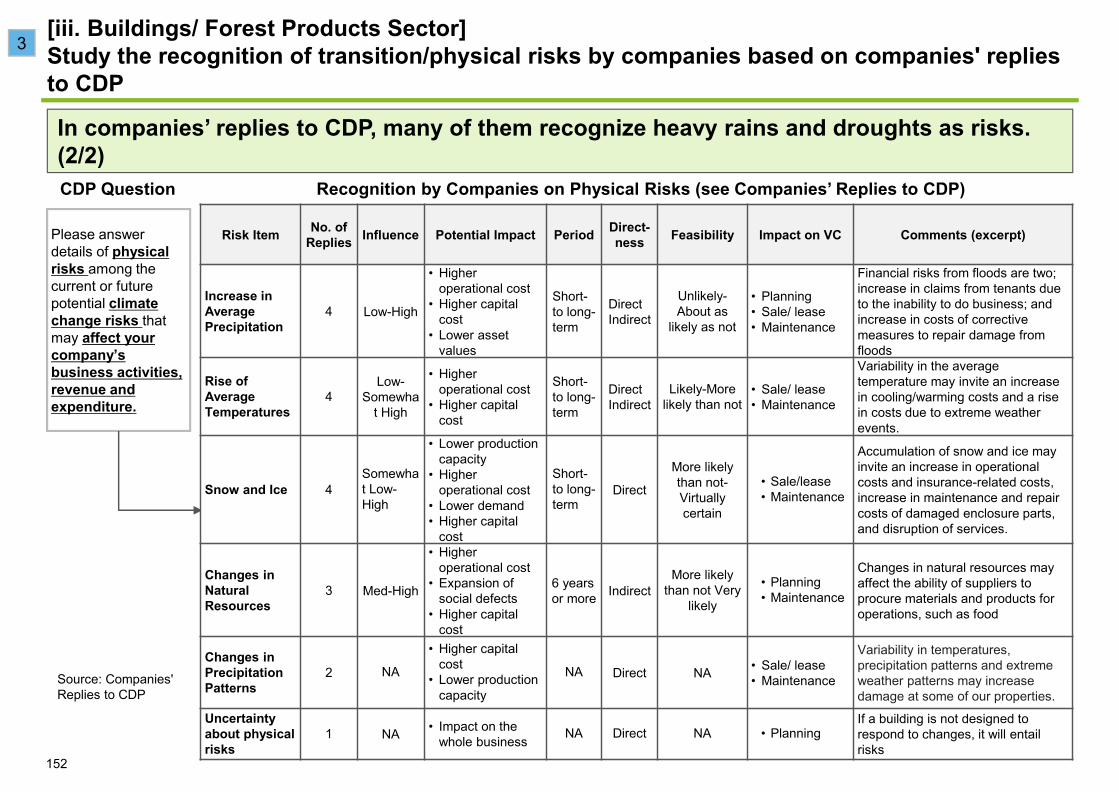
Source: Companies' Replies to CDP
Recognition by Companies on Physical Risks (see Companies’ Replies to CDP)CDP Question
Please answer details of physical risks among the current or future potential climate change risks that may affect your company’s business activities, revenue and expenditure.
Risk Item No. of Replies Influence Potential Impact Period Direct-
ness Feasibility Impact on VC Comments (excerpt)
Increase in Average Precipitation
4 Low-High
• Higher operational cost
• Higher capital cost
• Lower asset values
Short-to long-term
DirectIndirect
Unlikely-About as
likely as not
• Planning• Sale/ lease• Maintenance
Financial risks from floods are two; increase in claims from tenants due to the inability to do business; and increase in costs of corrective measures to repair damage from floods
Rise of Average Temperatures
4Low-
Somewhat High
• Higher operational cost
• Higher capital cost
Short-to long-term
DirectIndirect
Likely-More likely than not
• Sale/ lease• Maintenance
Variability in the average temperature may invite an increase in cooling/warming costs and a rise in costs due to extreme weather events.
Snow and Ice 4Somewhat Low-High
• Lower production capacity
• Higher operational cost
• Lower demand• Higher capital
cost
Short-to long-term
Direct
More likely than not-Virtually certain
• Sale/lease• Maintenance
Accumulation of snow and ice may invite an increase in operational costs and insurance-related costs, increase in maintenance and repair costs of damaged enclosure parts, and disruption of services.
Changes in Natural Resources
3 Med-High
• Higher operational cost
• Expansion of social defects
• Higher capital cost
6 years or more Indirect
More likely than not Very
likely
• Planning• Maintenance
Changes in natural resources may affect the ability of suppliers to procure materials and products for operations, such as food
Changes in Precipitation Patterns
2 NA
• Higher capital cost
• Lower production capacity
NA Direct NA • Sale/ lease• Maintenance
Variability in temperatures, precipitation patterns and extreme weather patterns may increase damage at some of our properties.
Uncertainty about physical risks
1 NA • Impact on the whole business NA Direct NA • Planning
If a building is not designed to respond to changes, it will entail risks
[iii. Buildings/ Forest Products Sector]Study the recognition of transition/physical risks by companies based on companies' replies to CDP
3
152
In companies’ replies to CDP, many of them recognize heavy rains and droughts as risks. (2/2)
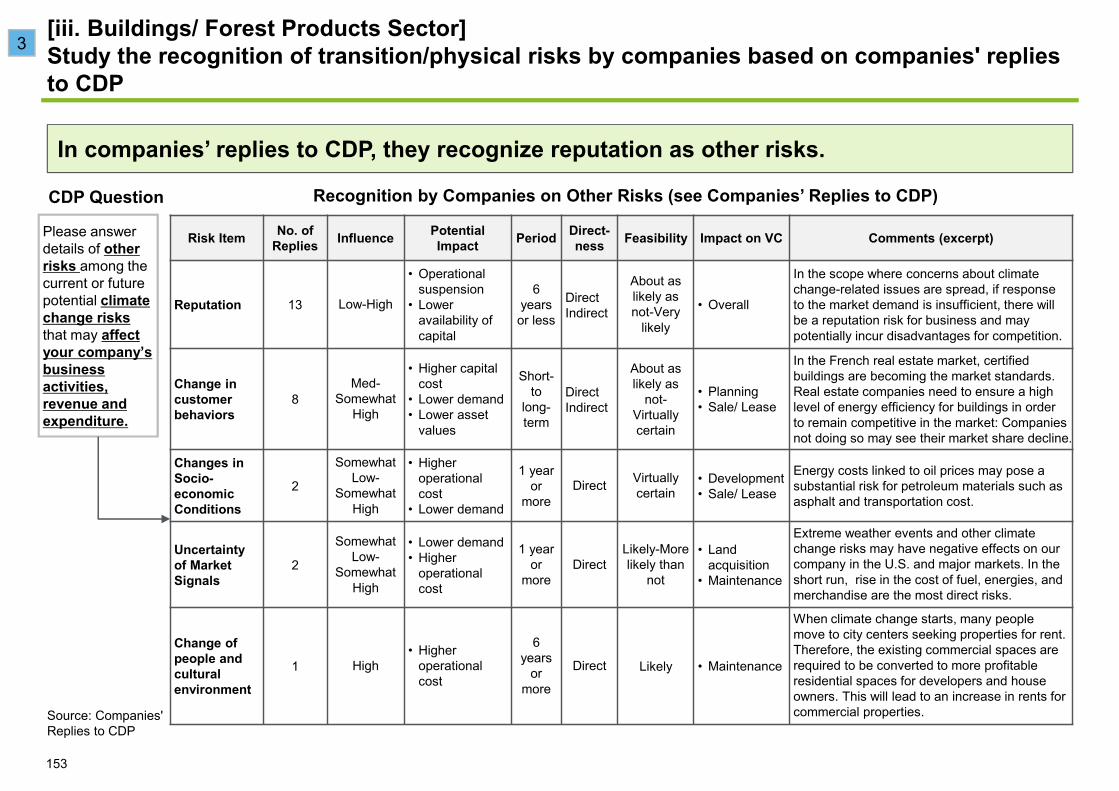
Source: Companies' Replies to CDP
Recognition by Companies on Other Risks (see Companies’ Replies to CDP)CDP Question
Please answer details of other risks among the current or future potential climate change risks that may affect your company’s business activities, revenue and expenditure.
Risk Item No. of Replies Influence Potential
Impact Period Direct-ness Feasibility Impact on VC Comments (excerpt)
Reputation 13 Low-High
• Operational suspension
• Lower availability of capital
6 years or less
DirectIndirect
About as likely as not-Very
likely
• Overall
In the scope where concerns about climate change-related issues are spread, if response to the market demand is insufficient, there will be a reputation risk for business and may potentially incur disadvantages for competition.
Change in customer behaviors
8Med-
Somewhat High
• Higher capital cost
• Lower demand• Lower asset
values
Short-to
long-term
DirectIndirect
About as likely as
not-Virtually certain
• Planning• Sale/ Lease
In the French real estate market, certified buildings are becoming the market standards. Real estate companies need to ensure a high level of energy efficiency for buildings in order to remain competitive in the market: Companies not doing so may see their market share decline.
Changes in Socio-economic Conditions
2
Somewhat Low-
Somewhat High
• Higher operational cost
• Lower demand
1 year or
moreDirect Virtually
certain• Development• Sale/ Lease
Energy costs linked to oil prices may pose a substantial risk for petroleum materials such as asphalt and transportation cost.
Uncertainty of Market Signals
2
Somewhat Low-
Somewhat High
• Lower demand• Higher
operational cost
1 year or
moreDirect
Likely-More likely than
not
• Land acquisition
• Maintenance
Extreme weather events and other climate change risks may have negative effects on our company in the U.S. and major markets. In the short run, rise in the cost of fuel, energies, and merchandise are the most direct risks.
Change of people and cultural environment
1 High• Higher
operational cost
6 years
or more
Direct Likely • Maintenance
When climate change starts, many people move to city centers seeking properties for rent. Therefore, the existing commercial spaces are required to be converted to more profitable residential spaces for developers and house owners. This will lead to an increase in rents for commercial properties.
[iii. Buildings/ Forest Products Sector]Study the recognition of transition/physical risks by companies based on companies' replies to CDP
3
153
In companies’ replies to CDP, they recognize reputation as other risks.
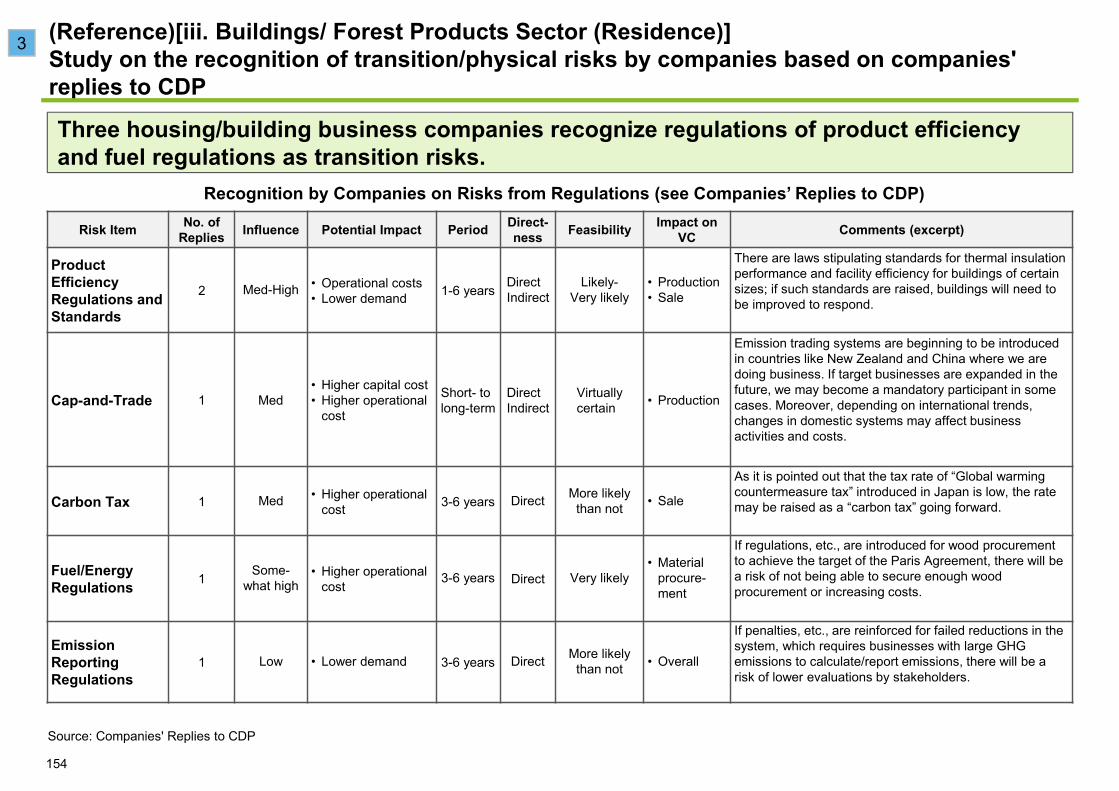
Risk Item No. of Replies Influence Potential Impact Period Direct-
ness Feasibility Impact on VC Comments (excerpt)
Product Efficiency Regulations and Standards
2 Med-High • Operational costs• Lower demand 1-6 years Direct
IndirectLikely-
Very likely• Production• Sale
There are laws stipulating standards for thermal insulation performance and facility efficiency for buildings of certain sizes; if such standards are raised, buildings will need to be improved to respond.
Cap-and-Trade 1 Med• Higher capital cost• Higher operational
cost
Short- to long-term
DirectIndirect
Virtually certain • Production
Emission trading systems are beginning to be introduced in countries like New Zealand and China where we are doing business. If target businesses are expanded in the future, we may become a mandatory participant in some cases. Moreover, depending on international trends, changes in domestic systems may affect business activities and costs.
Carbon Tax 1 Med • Higher operational cost 3-6 years Direct More likely
than not • Sale
As it is pointed out that the tax rate of “Global warming countermeasure tax” introduced in Japan is low, the rate may be raised as a “carbon tax” going forward.
Fuel/Energy Regulations 1 Some-
what high• Higher operational
cost 3-6 years Direct Very likely• Material
procure-ment
If regulations, etc., are introduced for wood procurement to achieve the target of the Paris Agreement, there will be a risk of not being able to secure enough wood procurement or increasing costs.
Emission Reporting Regulations
1 Low • Lower demand 3-6 years Direct More likely than not • Overall
If penalties, etc., are reinforced for failed reductions in the system, which requires businesses with large GHG emissions to calculate/report emissions, there will be a risk of lower evaluations by stakeholders.
Source: Companies' Replies to CDP
Recognition by Companies on Risks from Regulations (see Companies’ Replies to CDP)
(Reference)[iii. Buildings/ Forest Products Sector (Residence)]Study on the recognition of transition/physical risks by companies based on companies' replies to CDP
Three housing/building business companies recognize regulations of product efficiency and fuel regulations as transition risks.
3
154
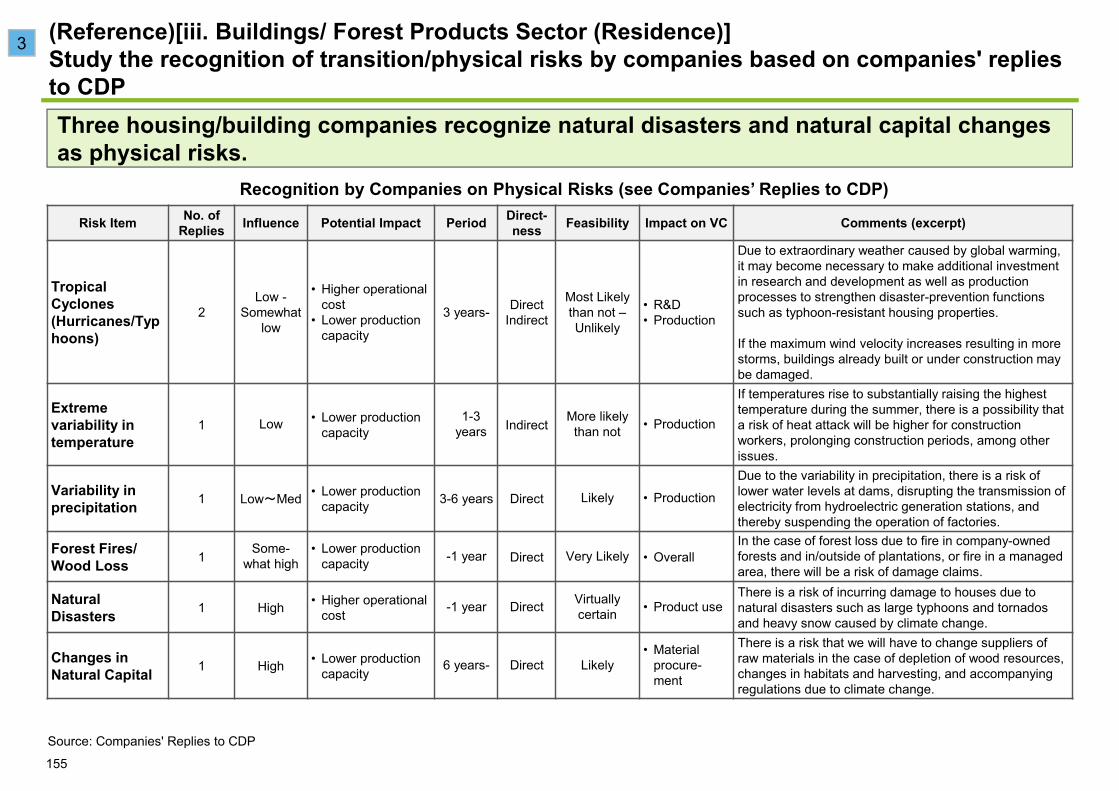
Risk Item No. of Replies Influence Potential Impact Period Direct-
ness Feasibility Impact on VC Comments (excerpt)
Tropical Cyclones(Hurricanes/Typhoons)
2Low -
Somewhat low
• Higher operational cost
• Lower production capacity
3 years- DirectIndirect
Most Likely than not –Unlikely
• R&D• Production
Due to extraordinary weather caused by global warming, it may become necessary to make additional investment in research and development as well as production processes to strengthen disaster-prevention functions such as typhoon-resistant housing properties.
If the maximum wind velocity increases resulting in more storms, buildings already built or under construction may be damaged.
Extreme variability in temperature
1 Low • Lower production capacity
1-3 years Indirect More likely
than not • Production
If temperatures rise to substantially raising the highest temperature during the summer, there is a possibility that a risk of heat attack will be higher for construction workers, prolonging construction periods, among other issues.
Variability in precipitation 1 Low~Med • Lower production
capacity 3-6 years Direct Likely • Production
Due to the variability in precipitation, there is a risk of lower water levels at dams, disrupting the transmission of electricity from hydroelectric generation stations, and thereby suspending the operation of factories.
Forest Fires/ Wood Loss 1 Some-
what high• Lower production
capacity -1 year Direct Very Likely • OverallIn the case of forest loss due to fire in company-owned forests and in/outside of plantations, or fire in a managed area, there will be a risk of damage claims.
Natural Disasters 1 High • Higher operational
cost -1 year Direct Virtuallycertain • Product use
There is a risk of incurring damage to houses due to natural disasters such as large typhoons and tornados and heavy snow caused by climate change.
Changes in Natural Capital 1 High • Lower production
capacity 6 years- Direct Likely• Material
procure-ment
There is a risk that we will have to change suppliers of raw materials in the case of depletion of wood resources, changes in habitats and harvesting, and accompanying regulations due to climate change.
Source: Companies' Replies to CDP
Recognition by Companies on Physical Risks (see Companies’ Replies to CDP)
(Reference)[iii. Buildings/ Forest Products Sector (Residence)]Study the recognition of transition/physical risks by companies based on companies' replies to CDPThree housing/building companies recognize natural disasters and natural capital changes as physical risks.
3
155

Risk Item No. of Replies Influence Potential Impact Period Direct-
ness Feasibility Impact on VC Comments (excerpt)
Change in customer behaviors
2Some-what High-High
• Higher operational cost
• Lower demand1 year- Direct
IndirectLikely-
Very likely
• Material procure-ment
• Sale• Product use
There is a possibility of a rise in procurement costs and securing of procurement sources if concerns about increases in CO2 emissions by environmentally-damaging development of forest resources are heightened, and consumers become inclined to use forest-certified wood.
If demand for life cycle carbon negative houses rises so much that we cannot deal with them, there is a risk of losing share to other companies. Moreover, there is a risk of increasing costs due to requests for making houses resilient and after-sale services in preparation for climate change.
Reputation 1 High • Lower demand 1-3 years Indirect Likely • Sale
Initiatives against illegal logging has been strengthened not only in developed countries but also in emerging countries. If our counterparties for wood fail to comply with these regulations, it will affect our company as the handling trading company with a risk of a decrease, etc., in sales and others by the decline of the brand.
Source: Companies' Replies to CDP
Recognition by Companies on Other Risks (see Companies’ Replies to CDP)
(Reference)[iii. Buildings/ Forest Products Sector (Residence)]Study the recognition of transition/physical risks by companies based on companies' replies to CDP
Three housing and building companies recognize assessments and reputation of customer behaviors as risks
3
156
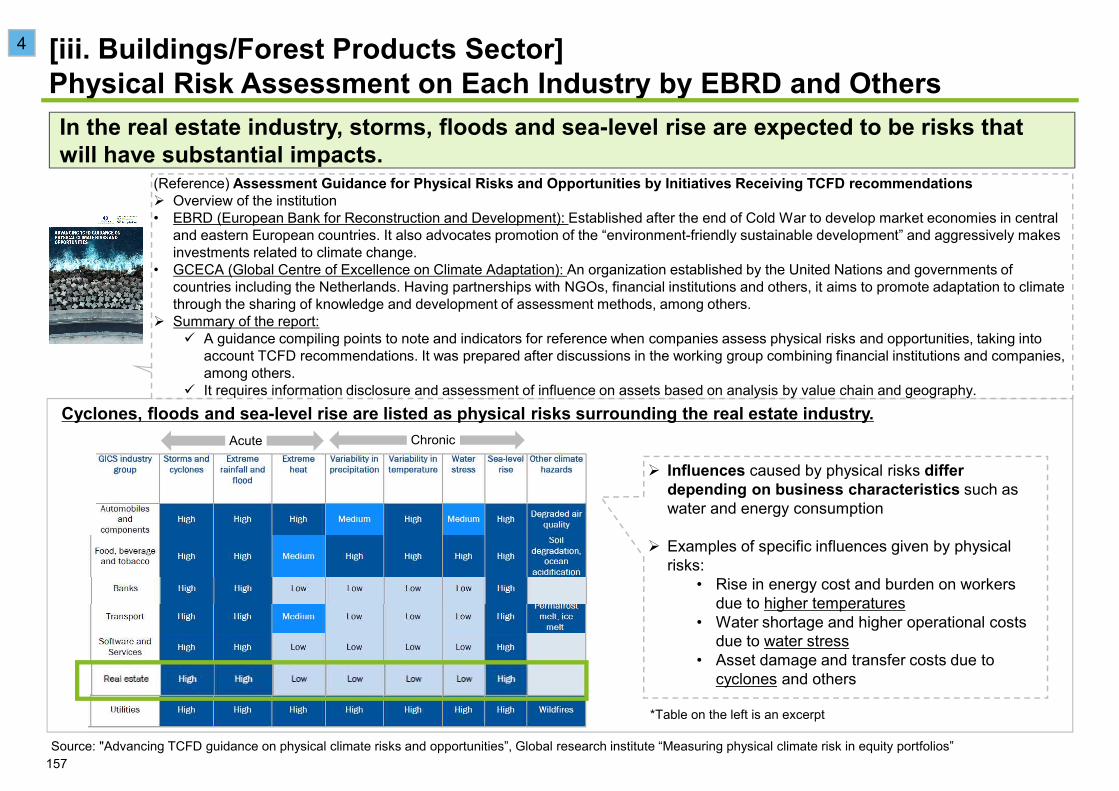
Cyclones, floods and sea-level rise are listed as physical risks surrounding the real estate industry.
Source: "Advancing TCFD guidance on physical climate risks and opportunities”, Global research institute “Measuring physical climate risk in equity portfolios”
Influences caused by physical risks differ depending on business characteristics such as water and energy consumption
Examples of specific influences given by physical risks:
• Rise in energy cost and burden on workers due to higher temperatures
• Water shortage and higher operational costs due to water stress
• Asset damage and transfer costs due to cyclones and others
*Table on the left is an excerpt
ChronicAcute
[iii. Buildings/Forest Products Sector]Physical Risk Assessment on Each Industry by EBRD and OthersIn the real estate industry, storms, floods and sea-level rise are expected to be risks that will have substantial impacts.
4
157
(Reference) Assessment Guidance for Physical Risks and Opportunities by Initiatives Receiving TCFD recommendationsOverview of the institution
• EBRD (European Bank for Reconstruction and Development): Established after the end of Cold War to develop market economies in central and eastern European countries. It also advocates promotion of the “environment-friendly sustainable development” and aggressively makes investments related to climate change.
• GCECA (Global Centre of Excellence on Climate Adaptation): An organization established by the United Nations and governments of countries including the Netherlands. Having partnerships with NGOs, financial institutions and others, it aims to promote adaptation to climate through the sharing of knowledge and development of assessment methods, among others.Summary of the report:
A guidance compiling points to note and indicators for reference when companies assess physical risks and opportunities, taking into account TCFD recommendations. It was prepared after discussions in the working group combining financial institutions and companies, among others. It requires information disclosure and assessment of influence on assets based on analysis by value chain and geography.
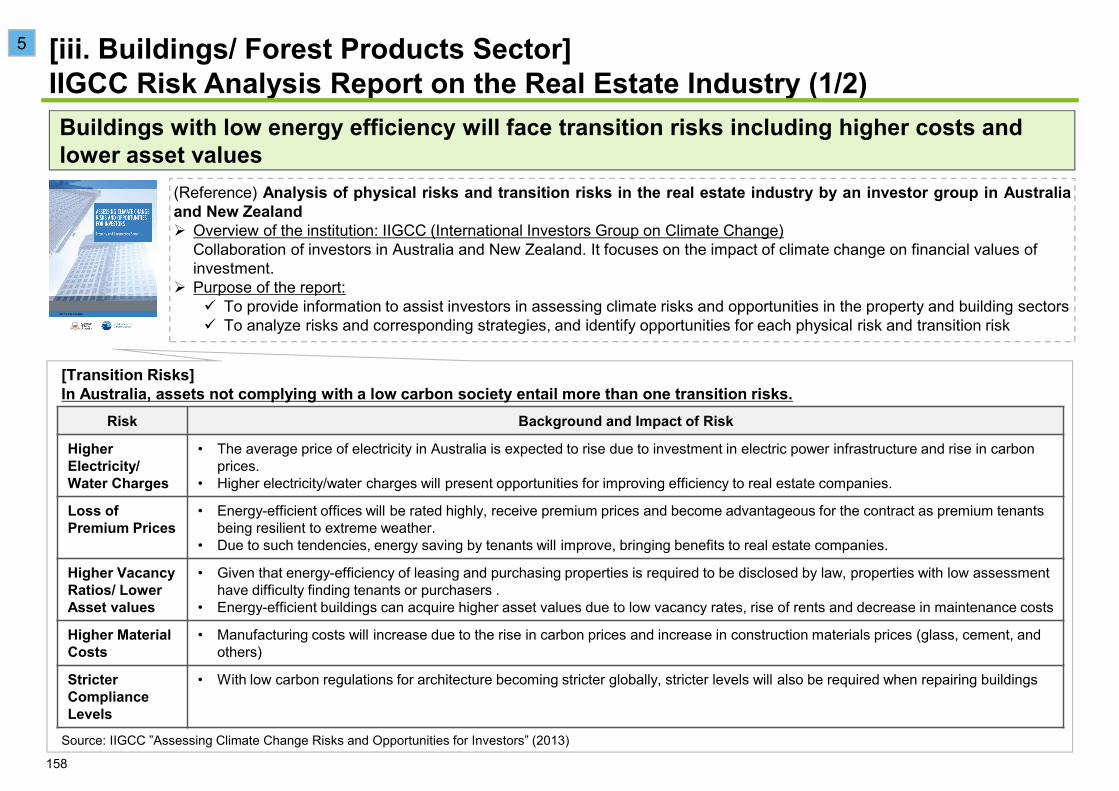
(Reference) Analysis of physical risks and transition risks in the real estate industry by an investor group in Australiaand New Zealand
Overview of the institution: IIGCC (International Investors Group on Climate Change)Collaboration of investors in Australia and New Zealand. It focuses on the impact of climate change on financial values of investment.Purpose of the report:
To provide information to assist investors in assessing climate risks and opportunities in the property and building sectorsTo analyze risks and corresponding strategies, and identify opportunities for each physical risk and transition risk
[Transition Risks]In Australia, assets not complying with a low carbon society entail more than one transition risks.
Source: IIGCC ”Assessing Climate Change Risks and Opportunities for Investors” (2013)
[iii. Buildings/ Forest Products Sector]IIGCC Risk Analysis Report on the Real Estate Industry (1/2)Buildings with low energy efficiency will face transition risks including higher costs and lower asset values
5
158
Risk Background and Impact of Risk
Higher Electricity/ Water Charges
• The average price of electricity in Australia is expected to rise due to investment in electric power infrastructure and rise in carbon prices.
• Higher electricity/water charges will present opportunities for improving efficiency to real estate companies.
Loss of Premium Prices
• Energy-efficient offices will be rated highly, receive premium prices and become advantageous for the contract as premium tenants being resilient to extreme weather.
• Due to such tendencies, energy saving by tenants will improve, bringing benefits to real estate companies.
Higher Vacancy Ratios/ Lower Asset values
• Given that energy-efficiency of leasing and purchasing properties is required to be disclosed by law, properties with low assessment have difficulty finding tenants or purchasers .
• Energy-efficient buildings can acquire higher asset values due to low vacancy rates, rise of rents and decrease in maintenance costs
Higher Material Costs
• Manufacturing costs will increase due to the rise in carbon prices and increase in construction materials prices (glass, cement, and others)
Stricter Compliance Levels
• With low carbon regulations for architecture becoming stricter globally, stricter levels will also be required when repairing buildings
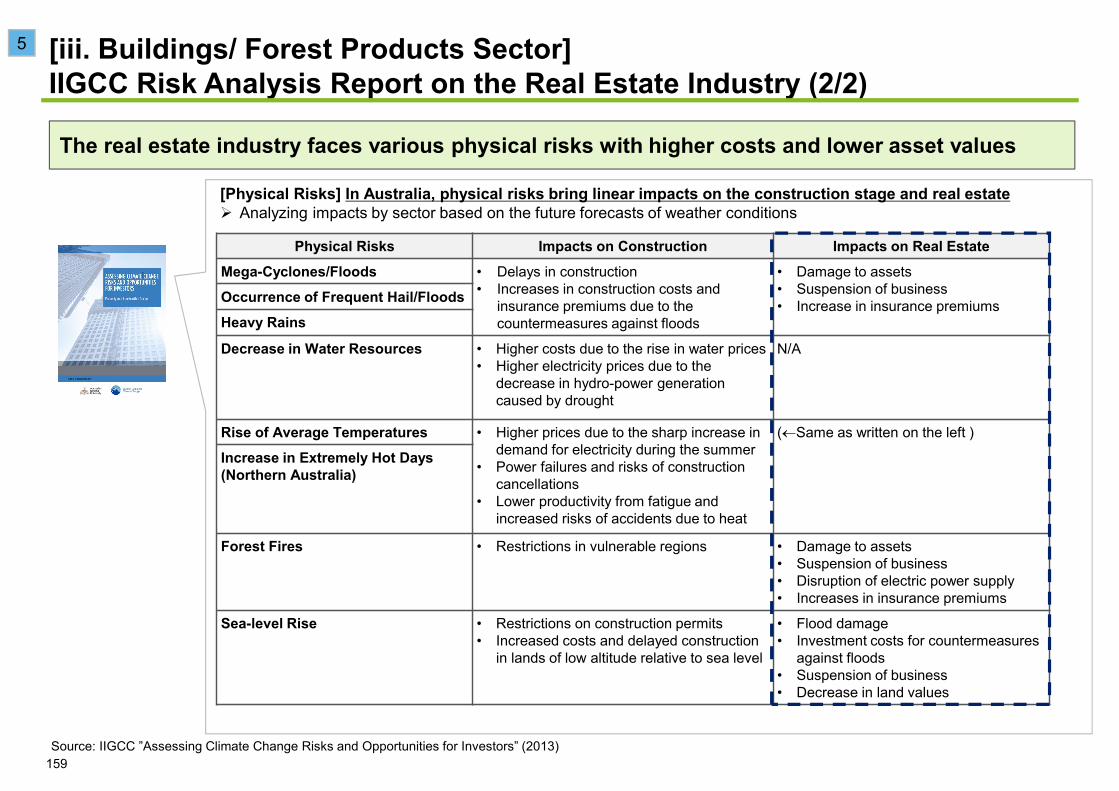
[Physical Risks] In Australia, physical risks bring linear impacts on the construction stage and real estateAnalyzing impacts by sector based on the future forecasts of weather conditions
Source: IIGCC ”Assessing Climate Change Risks and Opportunities for Investors” (2013)
Physical Risks Impacts on Construction Impacts on Real EstateMega-Cyclones/Floods • Delays in construction
• Increases in construction costs and insurance premiums due to the countermeasures against floods
• Damage to assets• Suspension of business • Increase in insurance premiumsOccurrence of Frequent Hail/Floods
Heavy Rains
Decrease in Water Resources • Higher costs due to the rise in water prices • Higher electricity prices due to the
decrease in hydro-power generation caused by drought
N/A
Rise of Average Temperatures • Higher prices due to the sharp increase in demand for electricity during the summer
• Power failures and risks of construction cancellations
• Lower productivity from fatigue and increased risks of accidents due to heat
( Same as written on the left )
Increase in Extremely Hot Days (Northern Australia)
Forest Fires • Restrictions in vulnerable regions • Damage to assets • Suspension of business • Disruption of electric power supply • Increases in insurance premiums
Sea-level Rise • Restrictions on construction permits • Increased costs and delayed construction
in lands of low altitude relative to sea level
• Flood damage • Investment costs for countermeasures
against floods • Suspension of business • Decrease in land values
[iii. Buildings/ Forest Products Sector]IIGCC Risk Analysis Report on the Real Estate Industry (2/2)
The real estate industry faces various physical risks with higher costs and lower asset values
5
159
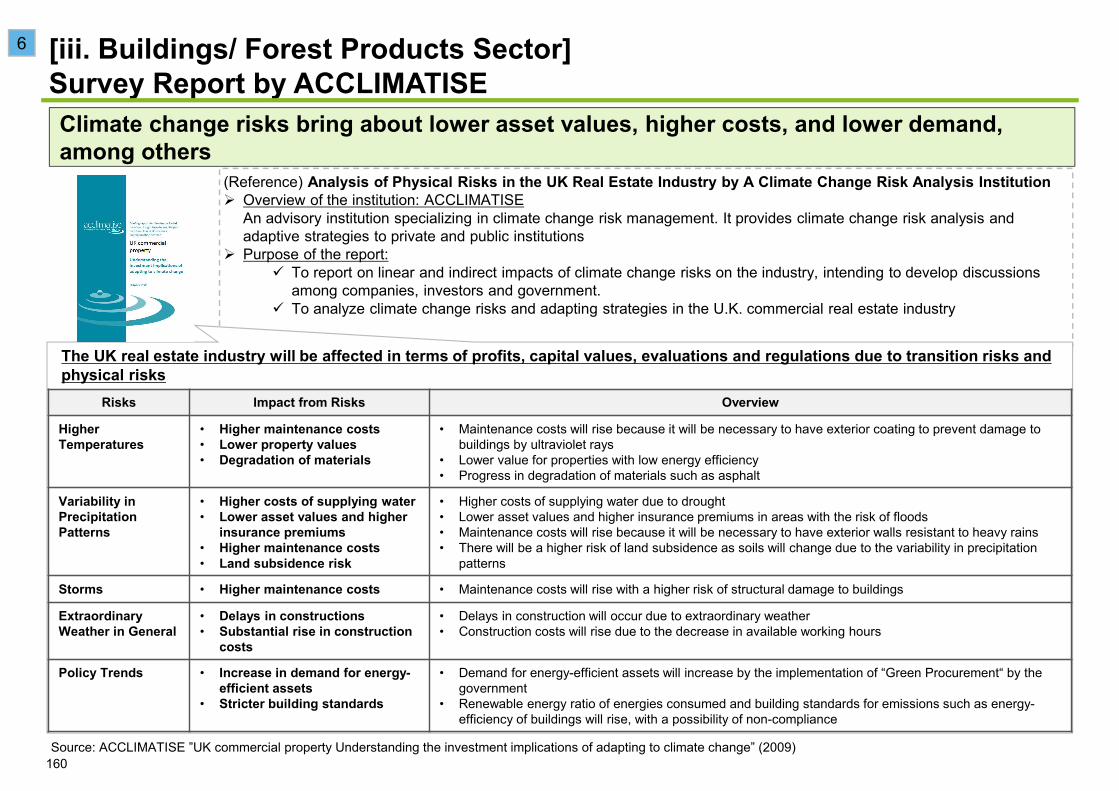
(Reference) Analysis of Physical Risks in the UK Real Estate Industry by A Climate Change Risk Analysis InstitutionOverview of the institution: ACCLIMATISEAn advisory institution specializing in climate change risk management. It provides climate change risk analysis and adaptive strategies to private and public institutions Purpose of the report:
To report on linear and indirect impacts of climate change risks on the industry, intending to develop discussions among companies, investors and government.To analyze climate change risks and adapting strategies in the U.K. commercial real estate industry
The UK real estate industry will be affected in terms of profits, capital values, evaluations and regulations due to transition risks and physical risks
Risks Impact from Risks Overview
Higher Temperatures
• Higher maintenance costs • Lower property values • Degradation of materials
• Maintenance costs will rise because it will be necessary to have exterior coating to prevent damage to buildings by ultraviolet rays
• Lower value for properties with low energy efficiency • Progress in degradation of materials such as asphalt
Variability in Precipitation Patterns
• Higher costs of supplying water • Lower asset values and higher
insurance premiums • Higher maintenance costs • Land subsidence risk
• Higher costs of supplying water due to drought • Lower asset values and higher insurance premiums in areas with the risk of floods• Maintenance costs will rise because it will be necessary to have exterior walls resistant to heavy rains• There will be a higher risk of land subsidence as soils will change due to the variability in precipitation
patterns
Storms • Higher maintenance costs • Maintenance costs will rise with a higher risk of structural damage to buildings
Extraordinary Weather in General
• Delays in constructions• Substantial rise in construction
costs
• Delays in construction will occur due to extraordinary weather • Construction costs will rise due to the decrease in available working hours
Policy Trends • Increase in demand for energy-efficient assets
• Stricter building standards
• Demand for energy-efficient assets will increase by the implementation of “Green Procurement“ by the government
• Renewable energy ratio of energies consumed and building standards for emissions such as energy-efficiency of buildings will rise, with a possibility of non-compliance
Source: ACCLIMATISE ”UK commercial property Understanding the investment implications of adapting to climate change” (2009)
[iii. Buildings/ Forest Products Sector]Survey Report by ACCLIMATISEClimate change risks bring about lower asset values, higher costs, and lower demand, among others
6
160
Contact Us
Climate Change Policy Division, Global Environmental Bureau, Ministry of the Environment, Japan.
This report is supported by Deloitte Tohmatsu Consulting LLC.