prabhatdairy: the bread and butter of the dairy industryprabhatdairy: the bread and butter of the...
TRANSCRIPT
Prabhat Dairy:The Bread and Butter of the Dairy IndustryHEC CONSULTANTS:
MARJOLAINE BERGERON, FELICIA PARR, RYAN WILSON, REBECA YANG

Introduction
Founded in 1998 to capitalize on market opportunities
Largely B2C business, with gradual shift. Revenues:B2B: 89% (2012) vs. 70% (2016)B2C: 11% (2012) vs. 30% (2016)
IPO in 2015 raises 3 billion rupees
Largely operate out of Maharashtra, with limited presence in north and east of Mumbai
Competitive advantage: End to end involvement in the dairy industry (sourcing and selling)
Large market with substantial growth opportunities
Introduction Analysis Alternatives Recommendation Implementation Conclusion

HOW CAN PRABHAT DAIRY BEST GROW IN THE INDIAN DAIRY INDUSTRY?

RecommendationIntroduction Analysis Alternatives Recommendation Implementation Conclusion
• Increase cash flow• Consumer trends
Increase focus on B2C in order to achieve a 50/50 split
• Gujarat• Rajastan
1. Regional development in Maharashtra with geographic expansion to Tier 2 and Tier 3 cities in:
2. Product development in order to meet Tier 1 (Mumbai) needs in Maharastra

India’s Social LandscapeIntroduction Analysis Alternatives Recommendation Implementation Conclusion
Economy• Wealth disparity• Rural vs urban distribution• Growing economy• Growing middle class
Political• High government power• Governmental help to
Indian companies
Geographic• Difficult infrastructure• Tier 1-2-3 cities• Large country
Cultural• Multiple languages• Difference in preferences
(milk products)
Prabhat has been very successful in is own country. The company has an advantage
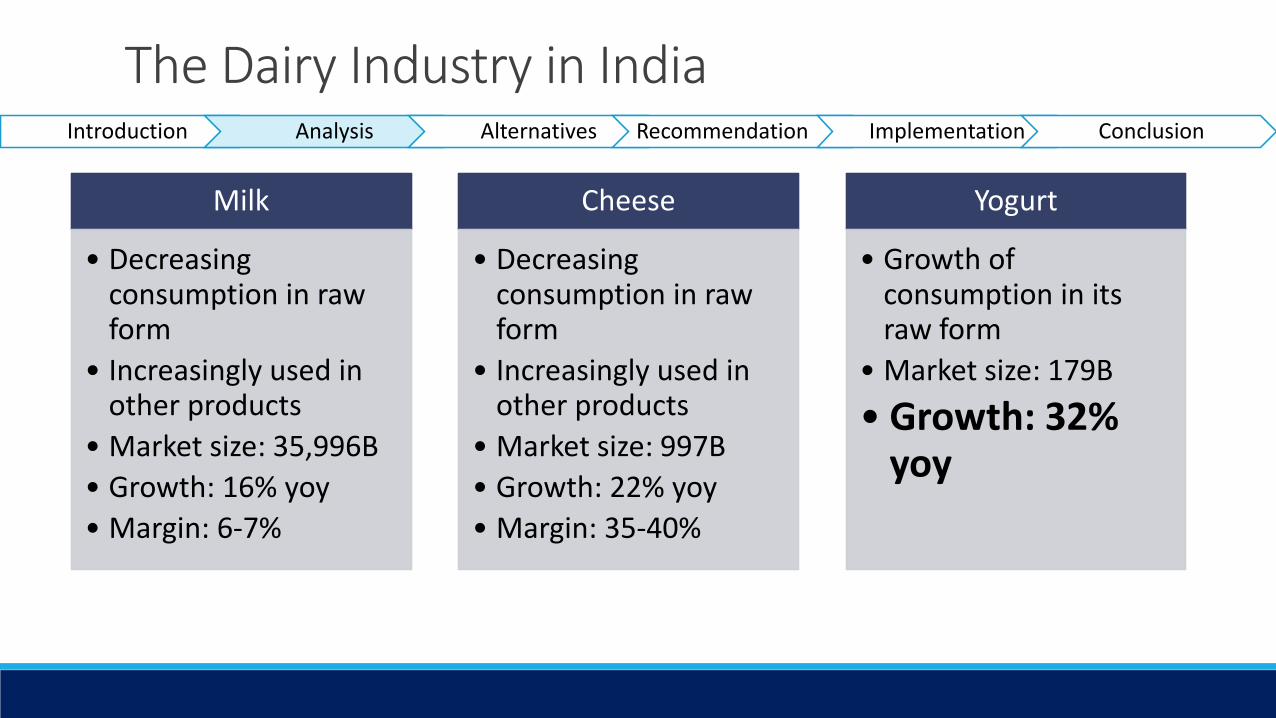
The Dairy Industry in IndiaIntroduction Analysis Alternatives Recommendation Implementation Conclusion
Milk
• Decreasing consumption in raw form
• Increasingly used in other products
• Market size: 35,996B• Growth: 16% yoy• Margin: 6-7%
Cheese
• Decreasing consumption in raw form
• Increasingly used in other products
• Market size: 997B• Growth: 22% yoy• Margin: 35-40%
Yogurt
• Growth of consumption in its raw form
• Market size: 179B• Growth: 32%
yoy
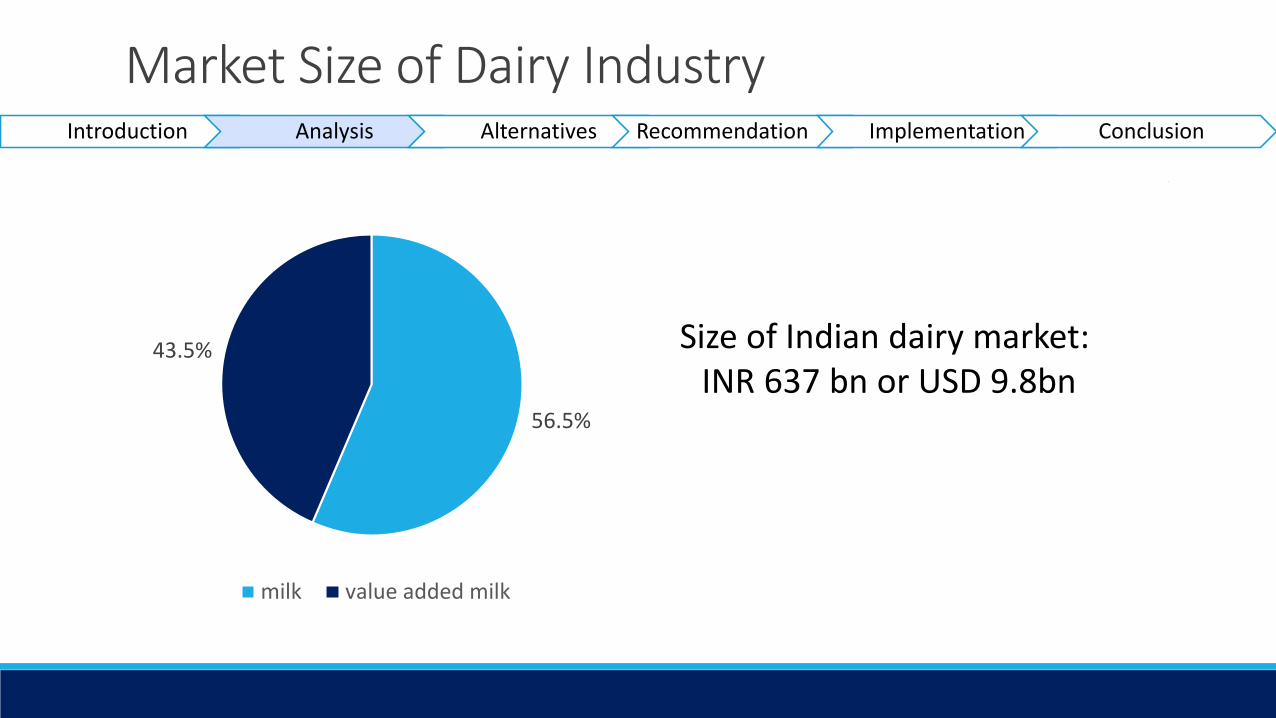
Market Size of Dairy IndustryIntroduction Analysis Alternatives Recommendation Implementation Conclusion
56.5%
43.5%
milk value added milk
Size of Indian dairy market: INR 637 bn or USD 9.8bn

Competitive LandscapeIntroduction Analysis Alternatives Recommendation Implementation Conclusion
Cooperatives• Highest market share• Highest market coverage• 10-15% milk
procurement players• Vertically integrated
Multinational companies (Danone, Nestle, Mondelez)• Value added market
mainly• Higher pricing (15%
more)
Private domestic players (pure play
dairy companies and dairy division)

CompetitionIntroduction Analysis Alternatives Recommendation Implementation Conclusion
Kwality Hatsun AgroPrabhat Parag
22.4% 23.6% 10.6% 25.5%Gross Margins
Competitors have different profiles and margins

The Dairy Industry : Supply ChainIntroduction Analysis Alternatives Recommendation Implementation Conclusion
Farmers
Milk Cooperatives
Own outlets, retail stores
Private Dairies
Own outlets, retail stores
Private Traders
Restaurants, private shops
Private milk vendors
Customers
• 7% supply growth vs. 10% demand
• Access to suppliers: 65 million farmers are outside of the cooperative system

Shift towards B2CIntroduction Analysis Alternatives Recommendation Implementation Conclusion
0 200 400 600 800 1000 1200 1400
2015
2016
Revenues in INR 10M
B2B B2C
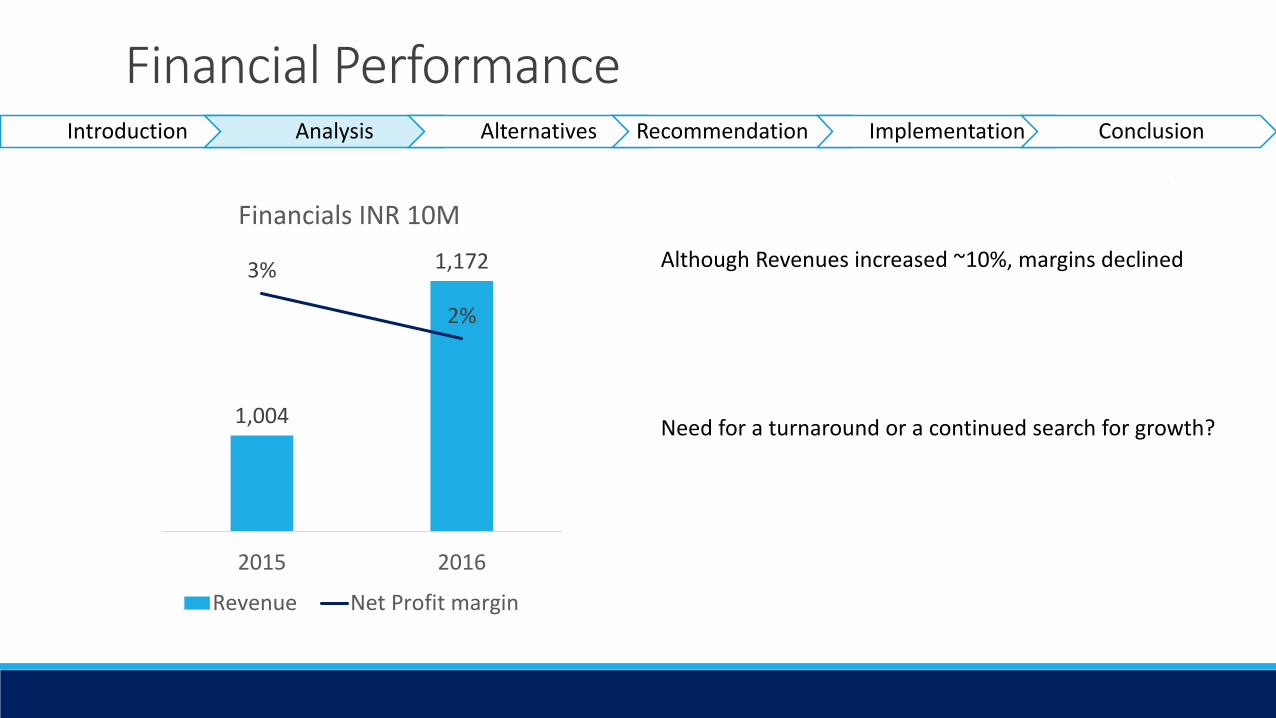
Financial PerformanceIntroduction Analysis Alternatives Recommendation Implementation Conclusion
1,004
1,1723%
2%
0%
1%
1%
2%
2%
3%
3%
900
950
1,000
1,050
1,100
1,150
1,200
2015 2016
Financials INR 10M
Revenue Net Profit margin
Although Revenues increased ~10%, margins declined
Need for a turnaround or a continued search for growth?

Prabhat Analysis
Present in both B2B and B2C marketsManufacturing plants (2016)
Product innovationDistribution network (milk collection
points + chilling center)Competitive pricing (15% lower)
Liquidity + cash flow difficultiesB2C branding (non-uniformity)
Only present in one state
Growing GDP per capita in IndiaGrowing demand for dairy products (10%
in India)Many Indian farmers are not part of
cooperativesProfitability in B2C market
Politically sensitive industryCompetitions (coop. And MNC’s)
Increasing price of cattle fodder + milk)Infrastructure in India not fully
developped
S W
O T
Introduction Analysis Alternatives Recommendation Implementation Conclusion
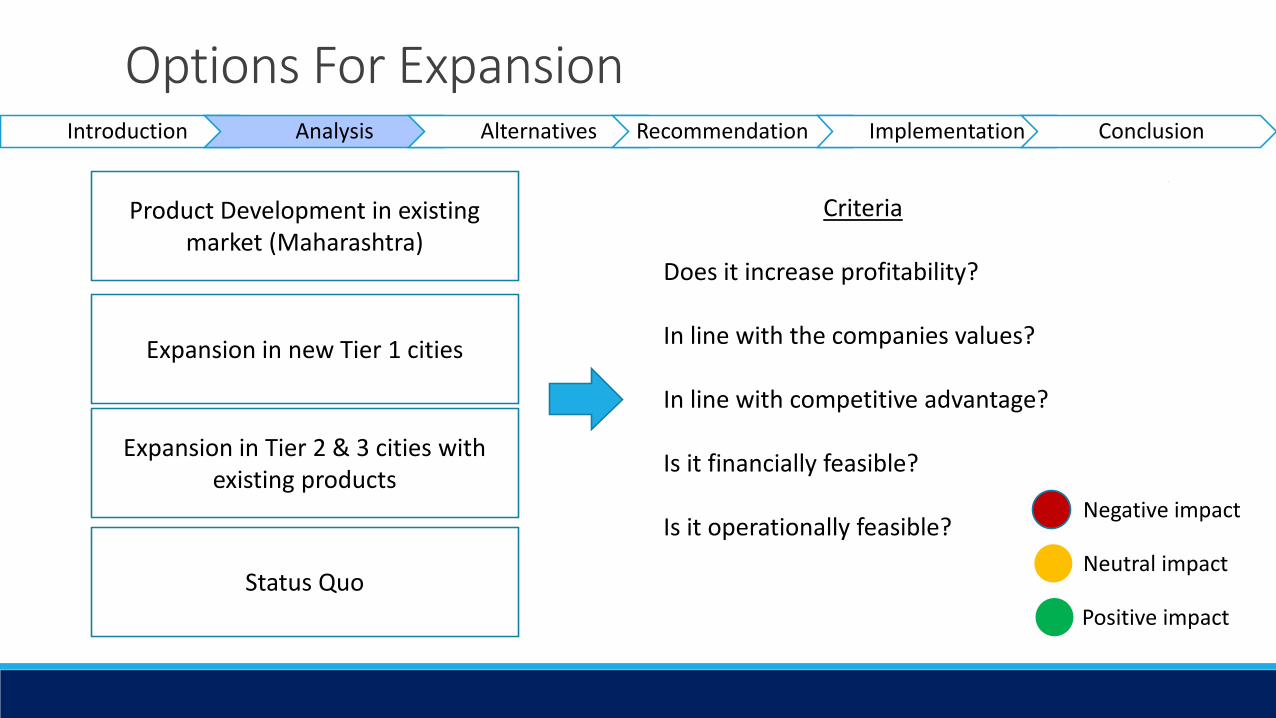
Options For Expansion
Product Development in existing market (Maharashtra)
Expansion in new Tier 1 cities
Expansion in Tier 2 & 3 cities with existing products
Status Quo
Criteria
Does it increase profitability?
In line with the companies values?
In line with competitive advantage?
Is it financially feasible?
Is it operationally feasible?Negative impact
Neutral impact
Positive impact
Introduction Analysis Alternatives Recommendation Implementation Conclusion

Alternative Evaluation
Alternatives Does it increaseprofitability?
Is it in line withcompanyvalues?
Is it in line withthe competitive
advantage?
Is it financiallyfeasible?
Is itoperationally
feasible?
ProductDevelopmentExpand to NEWTier 1 cities
Tier 2 & 3 citieswith existingproductsStatus Quo
Introduction Analysis Alternatives Recommendation Implementation Conclusion

RecommendationIntroduction Analysis Alternatives Recommendation Implementation Conclusion
• Increase cash flow• Consumer trends
Increase focus on B2C in order to achieve a 50/50 split
• Gujarat• Rajastan
1. Regional development in Maharashtra with geographic expansion to Tier 2 and Tier 3 cities in:
2. Product development in order to meet Tier 1 (Mumbai) needs in Maharastra

1 – Expand using existing productsIntroduction Analysis Alternatives Recommendation Implementation Conclusion
Easy access to 65M non-cooperative suppliers
Competitive pricing
Distribution channel success
Successful brand
Lower income consumers
Into Tier 2 and Tier 3 cities
3 states:- Maharashtra- Rajastan- Gujarat
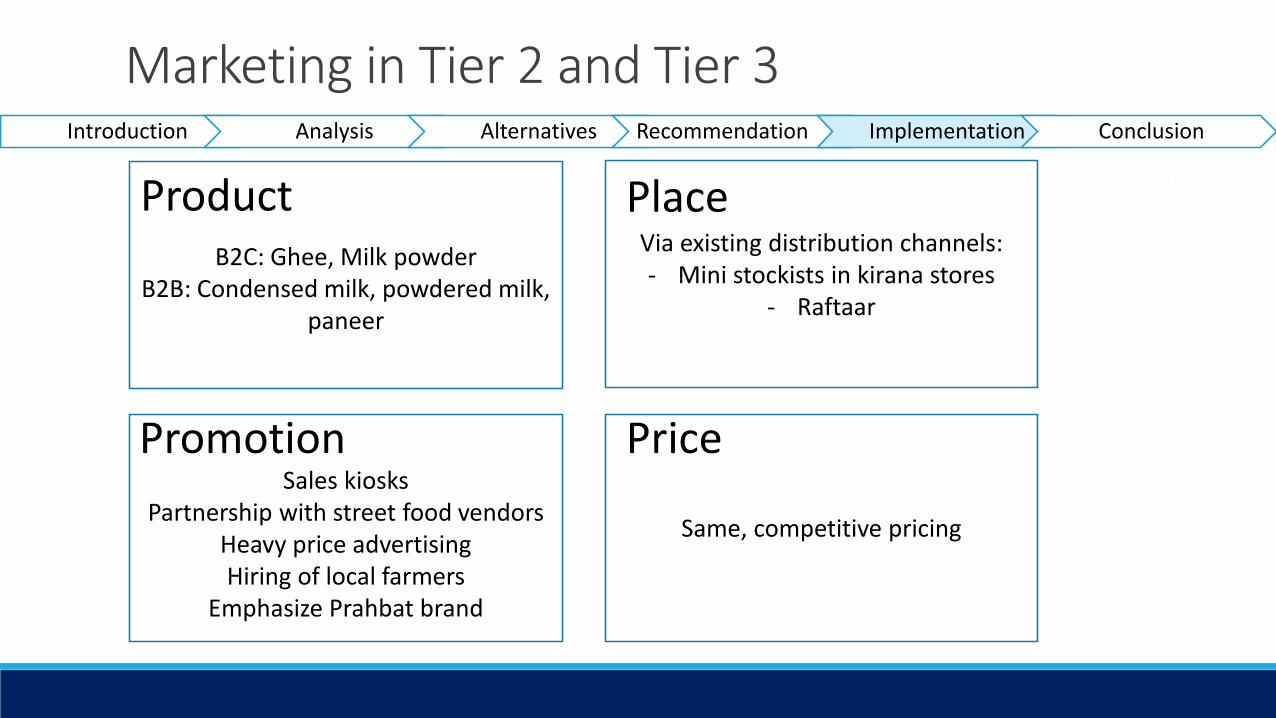
Marketing in Tier 2 and Tier 3 Introduction Analysis Alternatives Recommendation Implementation Conclusion
B2C: Ghee, Milk powderB2B: Condensed milk, powdered milk,
paneer
Via existing distribution channels:- Mini stockists in kirana stores
- Raftaar
Sales kiosksPartnership with street food vendors
Heavy price advertisingHiring of local farmers
Emphasize Prahbat brand
Same, competitive pricing
Product Place
Promotion Price

Implementation Timeline: Existing productsIntroduction Analysis Alternatives Recommendation Implementation Conclusion
2017H1
2017H2
2018H1
2018H2
2019H1
2019H2
2020H1
2020H2
2021H1
2021H2
Expansion into Tier 2 and Tier 3 in Maharastra
Implement existing distribution strategies
Develop marketing plan
Product launch
Product and marketing assessement
Expansion into Tier 2 and Tier 3 in Rajastan and Gujarat
Market research
Increase processing capacities
Develop distribution network
Launch in state 1 & 2

2 – Develop new product in MumbaiIntroduction Analysis Alternatives Recommendation Implementation Conclusion
Higher price sensitivity
Competitive pricing
Rapid growth in yogurt consumption projected
Successful brand
Higher end tastes
New, higher-end greek“Flava”yogurt product inMumbai as a pilot project

Marketing for “Flava” YogurtIntroduction Analysis Alternatives Recommendation Implementation Conclusion
Greek yogurt under “Flava” namePartnership with local grocery store
chain
Emphasize competitive pricingAdvertise health aspects
Under successful Flava nameHigh quality goods
Social media campaign – Make your own
340 Rupees
Product Place
Promotion Price

Implementation Timeline: New ProductIntroduction Analysis Alternatives Recommendation Implementation Conclusion
2017H1
2017H2
2018H1
2018H2
2019H1
2019H2
2020H1
2020H2
2021H1
2021H2
Market & operationsresearch
Research & development
Develop marketing plan
Product launch
Product and marketing assessement

What this recommendation means
Problem Our SolutionDevelop product offering for brand competencies?
Pilot Project: Develop new, higher end greekyogurt brand “Flava” to be in line with consumer trends
Where should you distribute in order to expand B2C presence?
Use existing distribution competencies for Tier 2 and Tier 3 cities and form partnership in grocery stores in Mumbai for new product
How can you increase profitability and enhance working capital?
Growth will increase working capitalPenetration of B2C markets with existing and new products will increase profitability
Introduction Analysis Alternatives Recommendation Implementation Conclusion
These solutions will help you be successful in meeting your goal of achieving 50-50 B2B: B2C

Financial AssumptionsIntroduction Analysis Alternatives Recommendation Implementation Conclusion
050
100150200250300350400450
2017 2018 2019 2020 2021
New product investments & expenses INR M
DistributionPersonnelMarketingMarket ResearchProduct Development
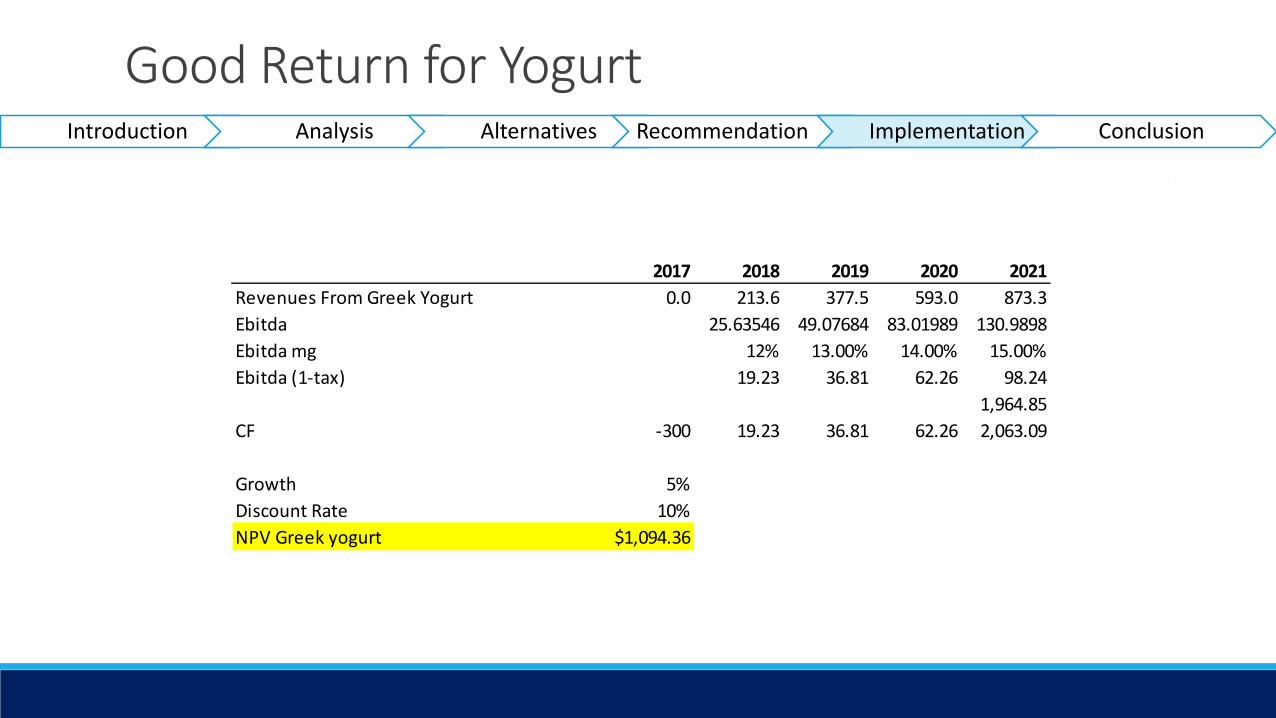
Good Return for YogurtIntroduction Analysis Alternatives Recommendation Implementation Conclusion
2017 2018 2019 2020 2021Revenues From Greek Yogurt 0.0 213.6 377.5 593.0 873.3Ebitda 25.63546 49.07684 83.01989 130.9898Ebitda mg 12% 13.00% 14.00% 15.00%Ebitda (1-tax) 19.23 36.81 62.26 98.24
1,964.85CF -300 19.23 36.81 62.26 2,063.09
Growth 5%Discount Rate 10%NPV Greek yogurt $1,094.36

Financial AssumptionsIntroduction Analysis Alternatives Recommendation Implementation Conclusion
020406080
100120140160
2017 2018 2019 2020 2021
Expansion T2&T3 investments & expenses INR M
LaunchesDistributionHigher Production CapabilitiesMarket Research

Good Return for ExpansionIntroduction Analysis Alternatives Recommendation Implementation Conclusion
2017 2018 2019 2020 2021Revenues From Expansion 358.9 768.1 986.2Ebitda 0 46.66069 107.535 147.9374Ebitda mg 12% 13.00% 14.00% 15.00%Ebitda (1-tax) 0.00 35.00 80.65 110.95
2,219.06CF -300 0.00 35.00 80.65 2,330.01
Growth 5%Discount Rate 10%NPV Expansion $1,255.41
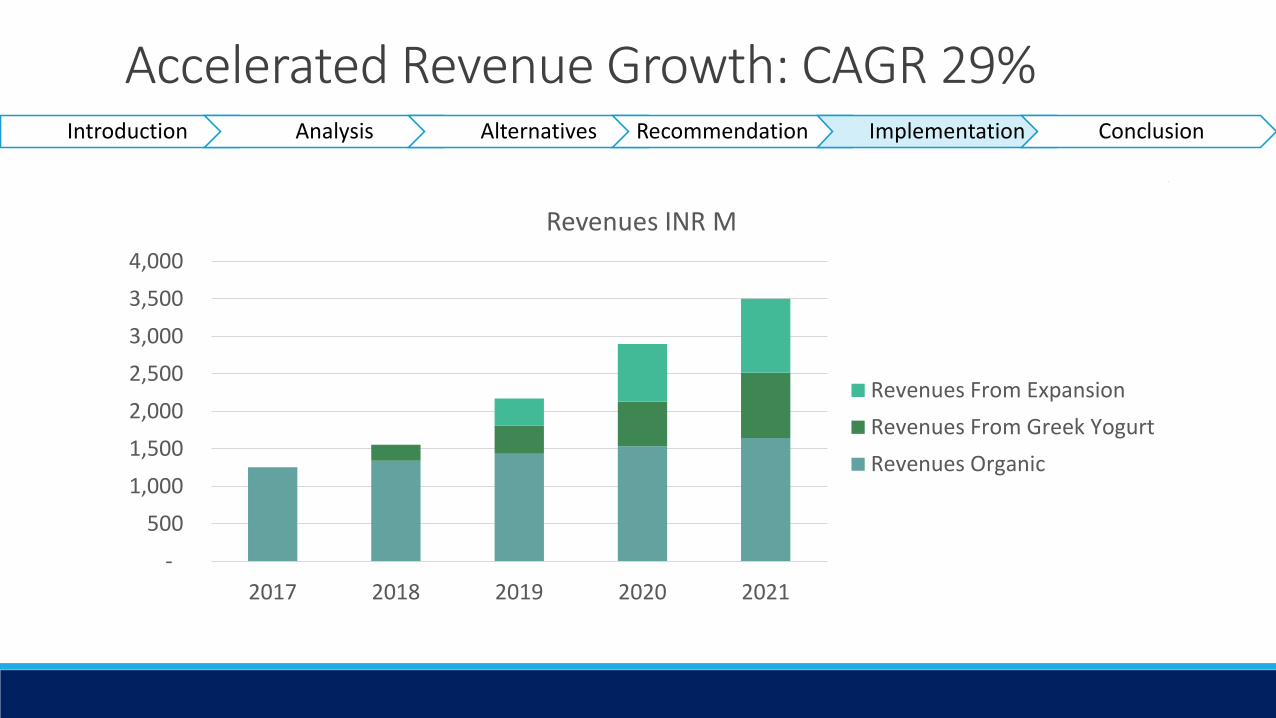
Accelerated Revenue Growth: CAGR 29%Introduction Analysis Alternatives Recommendation Implementation Conclusion
- 500
1,000 1,500 2,000 2,500 3,000 3,500 4,000
2017 2018 2019 2020 2021
Revenues INR M
Revenues From ExpansionRevenues From Greek YogurtRevenues Organic

Other Financial ConsiderationsIntroduction Analysis Alternatives Recommendation Implementation Conclusion
Working Capital: Natural increase due to investment and expansion phase◦ Will be addressed with negotiation with Business clients and higher revenues from B2C
Positioning with the Shareholders: Growth Company

Risk Analysis
Risk Prevention Mitigation Impact LikelihoodLow success with high end brand in Tier 1 cities
Test market (Mumbai) and marketing
Production withdrawalor focus marketing on lower priced items
Medium Medium
Production capacity does not meet demand
Market researchand testing
Follow-on issue for extra funding
Medium Low
Incumbents fight back and take market share
Competitive pricing Revisiting marketing mix
Medium High
New expansion negatively affects cash flow
Conservativecosting and budgeting
Percentage reduction in receivables to encourage payment
Medium Low
Introduction Analysis Alternatives Recommendation Implementation Conclusion

HOW CAN PRABHAT DAIRY BEST GROW IN THE INDIAN DAIRY INDUSTRY?

Looking forward
Prahbat Dairy exists in a market with significant opportunities
High levels of expected growth, but significant competition:◦ Multinationals◦ Cooperatives
Strong basis in Maharashtra to leverage upon
Recommendation:
1. Expand in 2 new provinces and offer all existing products in T2 & T3 cities
2. Test new product in Mumbai market (T1) with gradual phasing into other T1 cities
3. Supported by marketing initiatives and development of distribution network
Introduction Analysis Alternatives Recommendation Implementation Conclusion
Result: Revenue growth of over 29% year over year for the next 5 years

THANK YOU
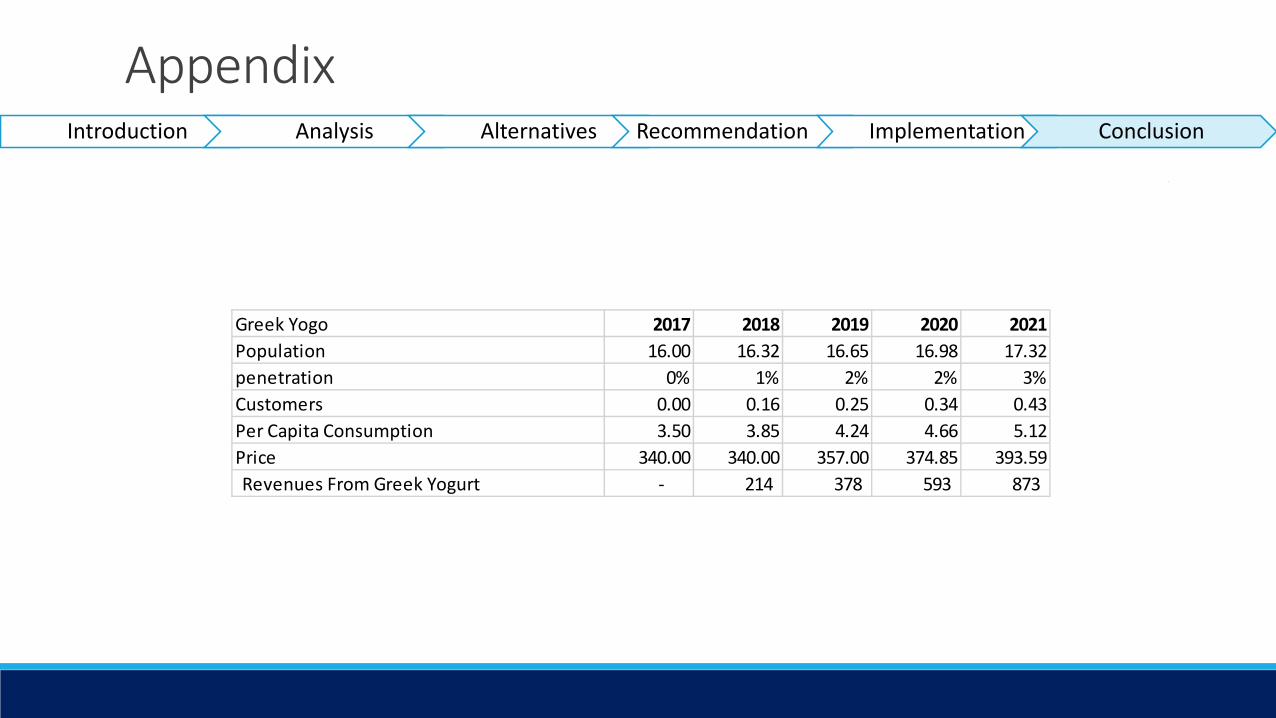
Appendix
Greek Yogo 2017 2018 2019 2020 2021Population 16.00 16.32 16.65 16.98 17.32penetration 0% 1% 2% 2% 3%Customers 0.00 0.16 0.25 0.34 0.43Per Capita Consumption 3.50 3.85 4.24 4.66 5.12Price 340.00 340.00 357.00 374.85 393.59Revenues From Greek Yogurt - 214 378 593 873
Introduction Analysis Alternatives Recommendation Implementation Conclusion

AppendixIntroduction Analysis Alternatives Recommendation Implementation Conclusion
New ProductOperating Expenses 2017 2018 2019 2020 2021Product Development 130Market Research 65Marketing 149.5 149.5 149.5 149.5 149.5Personnel 45.5 45.5 45.5 45.5 45.5Distribution 13 13 13 13 13Total 403 208 208 208 208
Capital Expenditures 300
Total Opex + Capex 1,535.00
Expansion T2 and T3 2017 2018 2019 2020 2021Market Research 65Higher Production Capabilities 32.5Distribution 65 65 65 65Launches 78 78Total 65 98 65 143 143
Capital Expenditures 300
Total Opex + Capex 814