pp # 8 - cesi abstract - res4africa · ! 2!...
TRANSCRIPT
! !!!!!!!! ! !
!
! 1!
!
!
!
This%paper%has%been%prepared%by:%
!
in%collaboration%with:%
RES4Africa!and!the!Kenyan!Working!Group!
!
!
Bruno% Cova,% Andrea% Prudenzi,% Claudia%Moroni,% Gabriele% Callegari,%CESI% ?% Luca%Marena,% Roberto% Vigotti,%RES4AFRICA% ?% Isaac% Kiva,% Kihara%Mungai,%Ministry0of0Energy0and0Petroleum% ?% Jeremiah% Kiplagat,% Patrick%Mwangi% Karimi,% John% Maina% Chege,% Christopher% Wesamba% Maende,% Amos% Nabaala,% Charles% Ndungu,%Edward% Omondi,% Oscar% Avukuse,% Julius% Charles% Kilonzi,% Boniface% Kinyanjui,%KPLC0=% Harness%Mukhongo,%KENGEN%?%Jonathan%Ronoh,%Nickson%Bukachi,%Leonard%Yegon,%ERC%?%Izael%Da%Silva,%Geoffrey%Ronoh,%Sarah%Odera,%Strathmore0University%?%Henry%Odedeh,%Harrison%Sungu,%Rex%Suda,%Bentlay%Nango,%KETRACO%?%James%Murithi,%REA.%
0
Abstract!
Kenya0is0rich0in0renewable0energy0resources,0namely0hydro,0wind,0solar,0biomass,0and0geothermal0
energy.0 This0 outstanding0 potential0 can0 be0 efficiently0 exploited0 in0 the0 power0 sector0 to0 boost0
generation0so0to0cope0with0the0strong0 load0growth0and0enhance0the0electrification0of0the0country0
that0is0still0poor0in0the0rural0areas.0However,0the0deployment0of0RES0generation,0especially0if0non=
programmable0 (NP)0 as0 in0 the0 case0 of0 PV0 and0 wind,0 shall0 be0 accurately0 designed0 to0 ensure0 the0
compliance0 with0 reliability0 standards0 and0 security0 constraints.0 In0 particular,0 flexibility0 of0 the0
generation0fleet0becomes0of0utmost0importance0for0following0the0load0pattern0and0for0dealing0with0
the0intermittency0of0wind0and0PV0generation.0
Integration!of!non=programmable!Renewable!Energy!in!the!National!Electric!System!of!Kenya!
! !!!!!!!! ! !
!
! 2!
Furthermore,0an0appropriate0design0of0Feed=in0Tariffs0or0other0 schemes0 (e.g.0auctions)0can0bring0
advantages0 in0 terms0 of0 reduced0 electricity0 costs0 with0 a0 consequent0 benefit0 for0 the0 country’s0
economy0and0society.0Indeed,0the0decreasing0upfront0investment0costs0on0PV0and0wind0plants0make0
these0forms0of0generation0attractive0for0the0investors0and0economically0fruitful0for0the0users.0
Finally,0the0role0of0the0transmission0grid0shall0not0be0neglected0to0avoid0occurrences0of0Renewable0
Energy0Sources0(RES)0generation0curtailments0due0to0network0bottlenecks.0
All0 the0 above0 aspects0 are0 addressed0 in0 an0 integrated0 way0 in0 this0 study,0 which0 examined0 the0
evolution0 of0 the0 Kenyan0 power0 system0 until0 the0 year0 20300 with0 different0 scenarios0 in0 order0 to0
account0for0uncertainties0in0the0generation0expansion0plans.0
The0 execution0of0 this0 study0has0been0 requested0by0 the0Kenyan0Ministry0of0Energy0and0Petroleum0
and0coordinated0by0RES4Africa.0
0
Objective!of!the!study!
The0 study0 is0 focused0 on0 the0 integration0 of0 non=programmable0 renewables0 into0 the0 Kenya’s0
electrical0 grid0 taking0 into0 account0 the0 development0 scenario0 until0 2030.0 The0 analysis0 has0 been0
carried0out0adopting0a0complete0generation0and0transmission0model0of0the0Kenyan0power0system.0
The0 demand0 trend,0 the0 evolution0 of0 the0 generation0 fleet0 and0 the0 transmission0 grid0 have0 been0
considered0 to0build0a0 future0base=case0 scenario.0 Several0 sensitivities0were0 investigated0versus0 the0
base=case0scenario0to0account0for0uncertainties0on0the0main0parameters0such0as0the0composition0of0
future0mix0of0generation.0
The0 results0 have0 been0 obtained0 through0 the0 application0 of0 state=of=the=art0 computational0 tools,0
developed0by0CESI,0simulating0the0system0reliability0with0a0probabilistic0algorithm0and0the0market0
mechanisms0with0a0deterministic0algorithm.0
0
Conclusions!
The0 study0 clearly0 shows0 that0 the0 deployment0 of0 Renewable0 Energy0 Sources0 (RES)0 generation,0
including0non=programmable0RES0such0as0wind0and0PV0power0plants,0brings0benefits0for0the0system0
in0 terms0 of0 enhanced0 reliability,0 reduced0 consumption0 of0 fossil0 fuels0 and0 reduction0 of0 system0
generation0costs.0Therefore0the0exploitation0of0outstanding0renewable0potential0resources0in0Kenya0
is0 very0 important0 to0 reduce0 dependency0 of0 energy0 supply0 of0 Kenya0 from0 other0 countries.0 This0
additional0benefit0plays0a0remarkable0strategic0role0in0the0Country’s0policy.0Furthermore,0benefits0
arise0 from0 the0 avoided0 emission0 of0 GHG,0 particularly0 CO2,0 that0 in0 the0 future0 could0 be0 traded0 as0
happens0 already0 in0 the0 European0 Union0 and0 in0 many0 states0 of0 the0 USA.0 The0 transmission0 grid0
expansion0 plan0 outlined0 in0 the0 Master0 Plan0 issued0 in0 20160 allows0 the0 development0 of0 RES0
generation0considered0 in0 the0 reference0 scenario0without0any0major0restrictions.0Nevertheless,0 the0
need0for0a0small0set0of0additional0reinforcements0has0been0detected.0The0additional0reinforcements0
are0 located0 in0specific0areas0(areas0of0Malindi,0Olkaria,0Rabai0and0Ngong0Hills)0and0can0be0easily0
integrated0in0the0transmission0grid0Master0Plan.0
The0 analyses0 clearly0 highlights0 that0 additional0 capacity0 of0 non=programmable0 (NP)0 RES0
generation00can0be0integrated,0on0top0of0the0projects0already0in0the0Country’s0pipeline,0provided0that0
adequate0measures0 are0 taken0 to0 ensure0 a0 flexibility0 in0 the0management0 of0 generation.0 Indeed,0 a0

! !!!!!!!! ! !
!
! 3!
critical0aspect0is0related0to0the0flexibility0of0the0generation0fleet0that0shall0be0able0to0cope0with0the0
daily0and0seasonal0load0patterns0as0well0as0the0intermittency0of0NP0RES.00
Finally,0a0suitable0evolution0to0lower0feed=in0tariffs0(FIT)0for0RES0generation0has0been0considered.0
An0alternative0scheme0can0be0based0on0auctions,0the0prices0of0which0shall0reflect0competitiveness0as0
well0as0cost0reduction0trend0of0RES0generation0investment.0The0breakeven0values0of0RES0generation0
FIT0evaluated0 in0the0various0scenarios,0or0alternatively0the0expected0auction0prices0 for0RES,0show0
already0today0the0potential0reduction0of0the0Country’s0generation0costs0for0the0final0users,0as0well0as0
the0economic0attractiveness0for0Independent0Power0Producers0(IPP)0investors.0
! !!!!!!!! ! !
!
! 4!
Introduction!
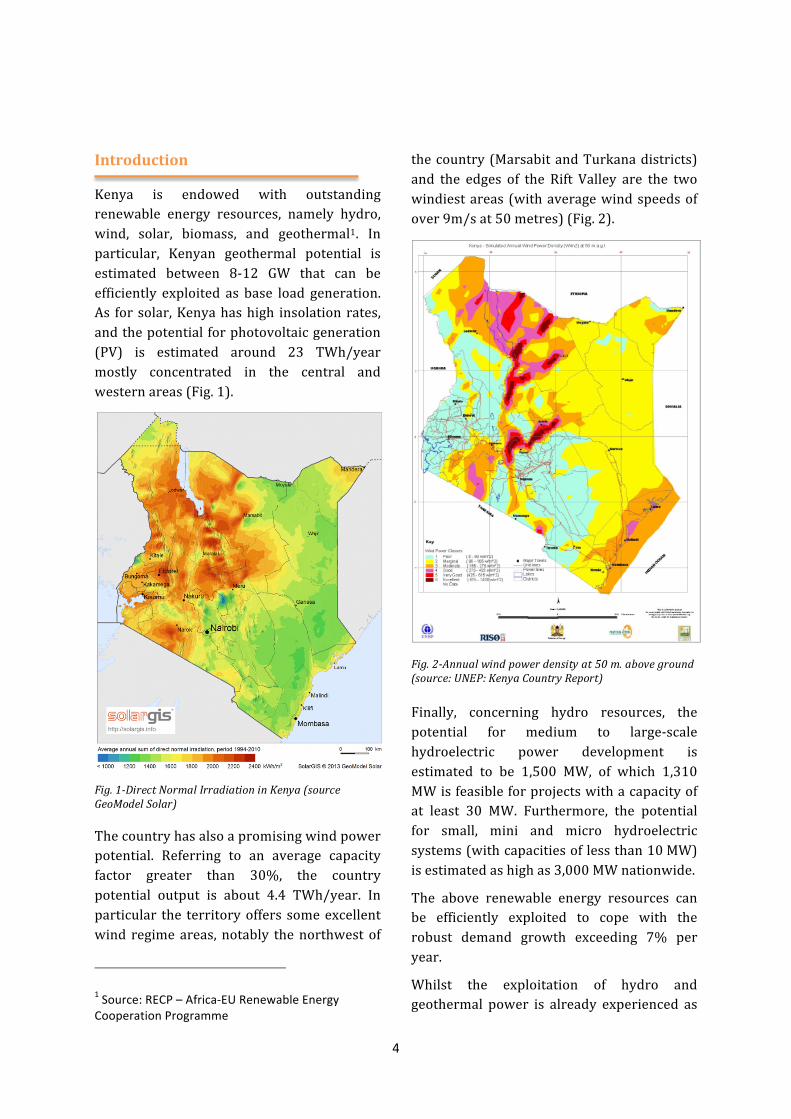
Kenya% is% endowed% with% outstanding%renewable% energy% resources,% namely% hydro,%wind,% solar,% biomass,% and% geothermal1.% In%particular,% Kenyan% geothermal% potential% is%estimated% between% 8?12% GW% that% can% be%efficiently% exploited% as% base% load% generation.%As% for% solar,%Kenya%has%high% insolation%rates,%and%the%potential%for%photovoltaic%generation%(PV)% is% estimated% around% 23% TWh/year%mostly% concentrated% in% the% central% and%western%areas%(Fig.%1).%
%
%
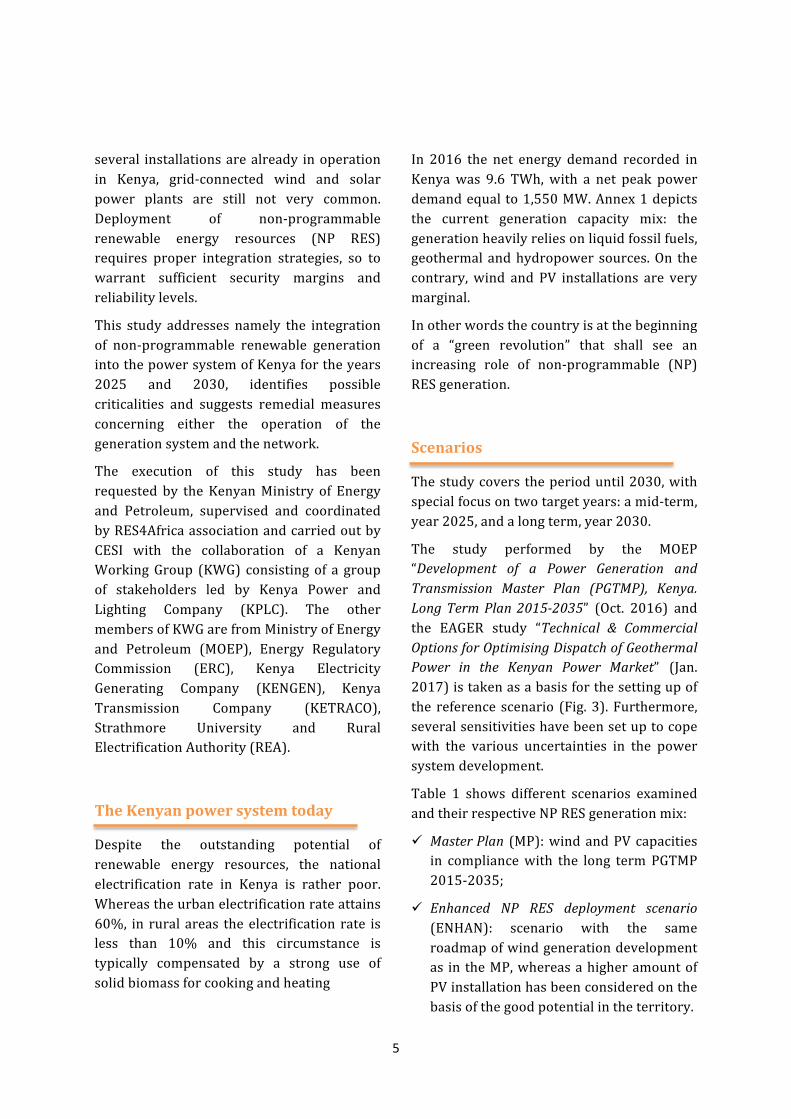
The%country%has%also%a%promising%wind%power%potential.% Referring% to% an% average% capacity%factor% greater% than% 30%,% the% country%potential% output% is% about% 4.4% TWh/year.% In%particular% the% territory%offers% some%excellent%wind% regime%areas,%notably% the%northwest%of%
!!!!!!!!!!!!!!!!!!!!!!!!!!!!!!!!!!!!!!!!!!!!!!!!!!!!!!!!!!!!!
1!Source:!RECP!–!Africa6EU!Renewable!Energy!Cooperation!Programme!
the%country%(Marsabit%and%Turkana%districts)%and% the% edges% of% the% Rift% Valley% are% the% two%windiest%areas% (with%average%wind%speeds%of%over%9m/s%at%50%metres)%(Fig.%2).%%
%
0
Finally,% concerning% hydro% resources,% the%potential% for% medium% to% large?scale%hydroelectric% power% development% is%estimated% to% be% 1,500% MW,% of% which% 1,310%MW%is%feasible%for%projects%with%a%capacity%of%at% least% 30% MW.% Furthermore,% the% potential%for% small,% mini% and% micro% hydroelectric%systems%(with%capacities%of%less%than%10%MW)%is%estimated%as%high%as%3,000%MW%nationwide.%
The% above% renewable% energy% resources% can%be% efficiently% exploited% to% cope% with% the%robust% demand% growth% exceeding% 7%% per%year.%
Whilst% the% exploitation% of% hydro% and%geothermal% power% is% already% experienced% as%
Fig.01=Direct0Normal0Irradiation0in0Kenya0(source0
GeoModel0Solar)0
Fig.02=Annual0wind0power0density0at0500m.0above0ground0
(source:0UNEP:0Kenya0Country0Report)0
! !!!!!!!! ! !
!
! 5!
several% installations%are%already% in%operation%in% Kenya,% grid?connected% wind% and% solar%power% plants% are% still% not% very% common.%Deployment% of% non?programmable%renewable% energy% resources% (NP% RES)%requires% proper% integration% strategies,% so% to%warrant% sufficient% security% margins% and%reliability%levels.%
This% study% addresses% namely% the% integration%of% non?programmable% renewable% generation%into%the%power%system%of%Kenya%for%the%years%2025% and% 2030,% identifies% possible%criticalities% and% suggests% remedial% measures%concerning% either% the% operation% of% the%generation%system%and%the%network.%
The% execution% of% this% study% has% been%requested% by% the%Kenyan%Ministry% of% Energy%and% Petroleum,% supervised% and% coordinated%by%RES4Africa%association%and%carried%out%by%CESI% with% the% collaboration% of% a% Kenyan%Working%Group% (KWG)% consisting%of% a% group%of% stakeholders% led% by% Kenya% Power% and%Lighting% Company% (KPLC).% The% other%members%of%KWG%are%from%Ministry%of%Energy%and% Petroleum% (MOEP),% Energy% Regulatory%Commission% (ERC),% Kenya% Electricity%Generating% Company% (KENGEN),% Kenya%Transmission% Company% (KETRACO),%Strathmore% University% and% Rural%Electrification%Authority%(REA).%
!
The!Kenyan!power!system!today!
Despite% the% outstanding% potential% of%renewable% energy% resources,% the% national%electrification% rate% in% Kenya% is% rather% poor.%Whereas%the%urban%electrification%rate%attains%60%,% in% rural% areas% the%electrification% rate% is%less% than% 10%% and% this% circumstance% is%typically% compensated% by% a% strong% use% of%solid%biomass%for%cooking%and%heating%
In% 2016% the% net% energy% demand% recorded% in%Kenya%was% 9.6% TWh,%with% a% net% peak% power%demand%equal%to%1,550%MW.%Annex%1%depicts%the% current% generation% capacity% mix:% the%generation%heavily%relies%on%liquid%fossil%fuels,%geothermal% and%hydropower% sources.%On% the%contrary,%wind% and% PV% installations% are% very%marginal.%%
In%other%words%the%country%is%at%the%beginning%of% a% “green% revolution”% that% shall% see% an%increasing% role% of% non?programmable% (NP)%RES%generation.%
!
Scenarios!
The%study%covers%the%period%until%2030,%with%special%focus%on%two%target%years:%a%mid?term,%year%2025,%and%a%long%term,%year%2030.%%
The% study% performed% by% the% MOEP%“Development0 of0 a0 Power0 Generation0 and0Transmission0 Master0 Plan0 (PGTMP),0 Kenya.0
Long0Term0Plan02015=2035”% (Oct.% 2016)% and%the% EAGER% study% “Technical0 &0 Commercial0Options0for0Optimising0Dispatch0of0Geothermal0
Power0 in0 the0 Kenyan0 Power0 Market”% (Jan.%2017)%is%taken%as%a%basis%for%the%setting%up%of%the% reference% scenario% (Fig.%3).% Furthermore,%several%sensitivities%have%been%set%up%to%cope%with% the% various% uncertainties% in% the% power%system%development.%%
Table% 1% shows% different% scenarios% examined%and%their%respective%NP%RES%generation%mix:%
!!Master0Plan% (MP):%wind%and%PV%capacities%in% compliance%with% the% long% term%PGTMP%2015?2035;%
!! Enhanced0 NP0 RES0 deployment0 scenario%(ENHAN):% scenario% with% the% same%roadmap%of%wind%generation%development%as% in% the%MP,%whereas%a%higher%amount%of%PV%installation%has%been%considered%on%the%basis%of%the%good%potential%in%the%territory.%
! !!!!!!!! ! !
!
! 6!
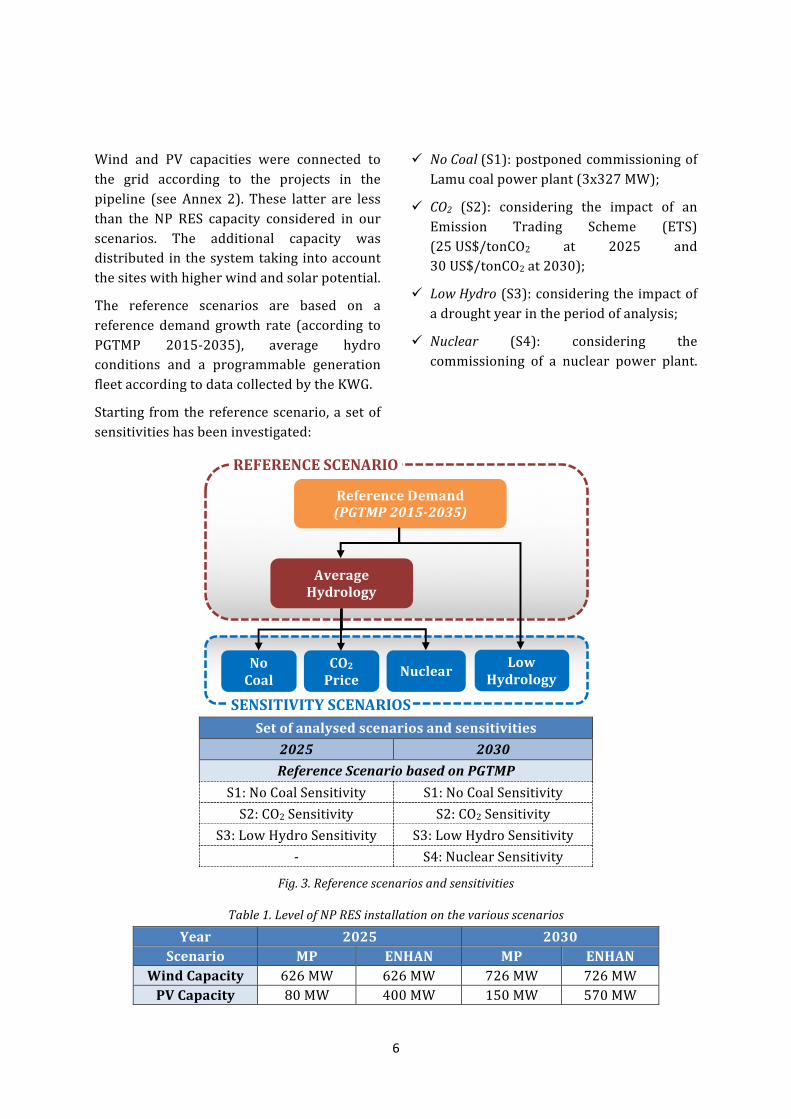
Wind% and% PV% capacities% were% connected% to%the% grid% according% to% the% projects% in% the%pipeline% (see% Annex% 2).% These% latter% are% less%than% the% NP% RES% capacity% considered% in% our%scenarios.% The% additional% capacity% was%distributed%in%the%system%taking%into%account%the%sites%with%higher%wind%and%solar%potential.%
The% reference% scenarios% are% based% on% a%reference%demand% growth% rate% (according% to%PGTMP% 2015?2035),% average% hydro%conditions% and% a% programmable% generation%fleet%according%to%data%collected%by%the%KWG.%
Starting% from%the%reference%scenario,%a%set%of%sensitivities%has%been%investigated:%
!! No0Coal0(S1):%postponed%commissioning%of%Lamu%coal%power%plant%(3x327%MW);%
!! CO2% (S2):% considering% the% impact% of% an%Emission% Trading% Scheme% (ETS)%(25%US$/tonCO2% at% 2025% and%30%US$/tonCO2%at%2030);%
!! Low0Hydro%(S3):%considering%the%impact%of%a%drought%year%in%the%period%of%analysis;%
!! Nuclear% (S4):% considering% the%commissioning% of% a% nuclear% power% plant.%
%Set!of!analysed!scenarios!and!sensitivities!
2025! 2030!Reference!Scenario!based!on!PGTMP%
S1:%No%Coal%Sensitivity% S1:%No%Coal%Sensitivity%S2:%CO2%Sensitivity% S2:%CO2%Sensitivity%
S3:%Low%Hydro%Sensitivity% S3:%Low%Hydro%Sensitivity%?% S4:%Nuclear%Sensitivity%
Fig.03.0Reference0scenarios0and0sensitivities0
Table01.0Level0of0NP0RES0installation0on0the0various0scenarios0
Year! 2025! 2030!Scenario! MP! ENHAN! MP! ENHAN!
Wind!Capacity! 626%MW% 626%MW% 726%MW% 726%MW%PV!Capacity! 80%MW% 400%MW% 150%MW% 570%MW%
0 0
Low Hydrology
No! Coal
CO2! Price
Average!!Hydrology
Nuclear
Reference!Demand (PGTMP!201592035)
REFERENCE!SCENARIO
SENSITIVITY!SCENARIOS
! !!!!!!!! ! !
!
! 7!
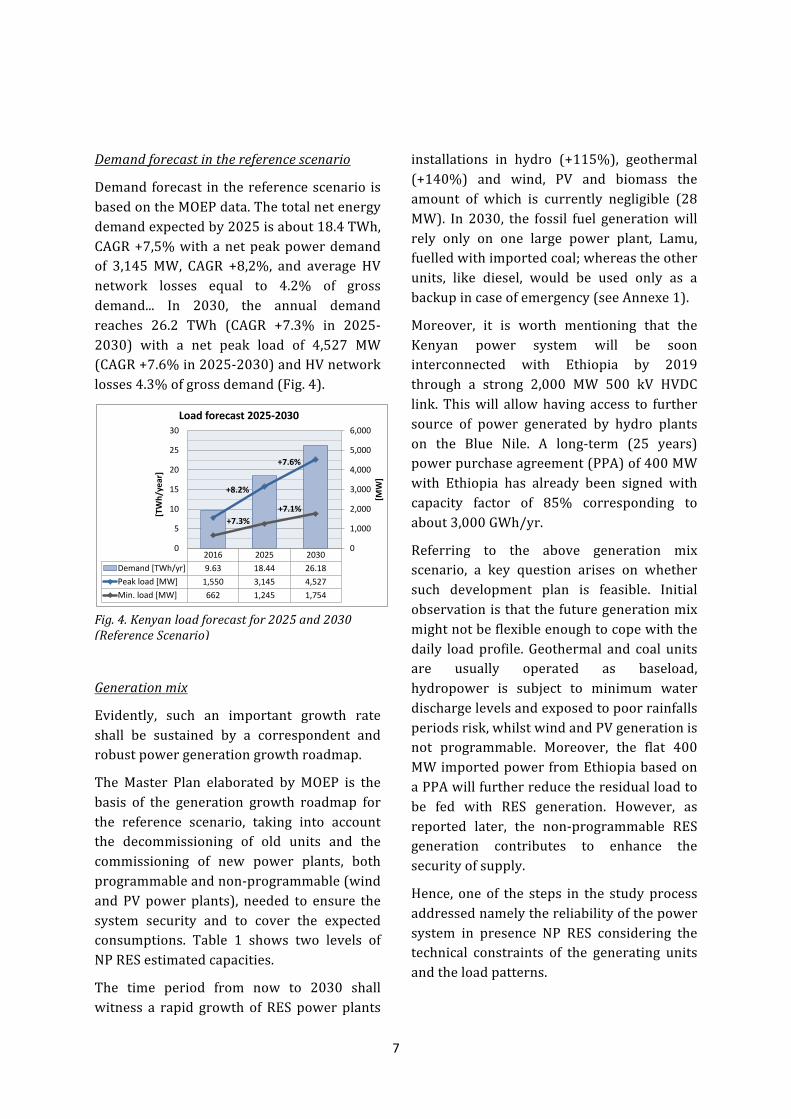
Demand0forecast0in0the0reference0scenario0
Demand% forecast% in% the%reference%scenario% is%based%on%the%MOEP%data.%The%total%net%energy%demand%expected%by%2025%is%about%18.4%TWh,%CAGR%+7,5%%with%a%net%peak%power%demand%of% 3,145% MW,% CAGR% +8,2%,% and% average% HV%network% losses% equal% to% 4.2%% of% gross%demand...% In% 2030,% the% annual% demand%reaches% 26.2% TWh% (CAGR% +7.3%% in% 2025?2030)% with% a% net% peak% load% of% 4,527% MW%(CAGR%+7.6%%in%2025?2030)%and%HV%network%losses%4.3%%of%gross%demand%(Fig.%4).%
%
0
0
Generation0mix0
Evidently,% such% an% important% growth% rate%shall% be% sustained% by% a% correspondent% and%robust%power%generation%growth%roadmap.%
The%Master% Plan% elaborated% by% MOEP% is% the%basis% of% the% generation% growth% roadmap% for%the% reference% scenario,% taking% into% account%the% decommissioning% of% old% units% and% the%commissioning% of% new% power% plants,% both%programmable%and%non?programmable%(wind%and% PV% power% plants),% needed% to% ensure% the%system% security% and% to% cover% the% expected%consumptions.% Table% 1% shows% two% levels% of%NP%RES%estimated%capacities.%
The% time% period% from% now% to% 2030% shall%witness% a% rapid% growth% of%RES%power% plants%
installations% in% hydro% (+115%),% geothermal%(+140%)% and% wind,% PV% and% biomass% the%amount% of% which% is% currently% negligible% (28%MW).% In% 2030,% the% fossil% fuel% generation%will%rely% only% on% one% large% power% plant,% Lamu,%fuelled%with%imported%coal;%whereas%the%other%units,% like% diesel,% would% be% used% only% as% a%backup%in%case%of%emergency%(see%Annexe%1).%
Moreover,% it% is% worth% mentioning% that% the%Kenyan% power% system% will% be% soon%interconnected% with% Ethiopia% by% 2019%through% a% strong% 2,000% MW% 500% kV% HVDC%link.% This%will% allow%having% access% to% further%source% of% power% generated% by% hydro% plants%on% the% Blue% Nile.% A% long?term% (25% years)%power%purchase%agreement%(PPA)%of%400%MW%with% Ethiopia% has% already% been% signed% with%capacity% factor% of% 85%% corresponding% to%about%3,000%GWh/yr.%
Referring% to% the% above% generation% mix%scenario,% a% key% question% arises% on% whether%such% development% plan% is% feasible.% Initial%observation%is%that%the%future%generation%mix%might%not%be%flexible%enough%to%cope%with%the%daily% load%profile.% Geothermal% and% coal% units%are% usually% operated% as% baseload,%hydropower% is% subject% to% minimum% water%discharge%levels%and%exposed%to%poor%rainfalls%periods%risk,%whilst%wind%and%PV%generation%is%not% programmable.% Moreover,% the% flat% 400%MW%imported%power%from%Ethiopia%based%on%a%PPA%will%further%reduce%the%residual%load%to%be% fed% with% RES% generation.% However,% as%reported% later,% the% non?programmable% RES%generation% contributes% to% enhance% the%security%of%supply.%
Hence,% one% of% the% steps% in% the% study%process%addressed%namely%the%reliability%of%the%power%system% in% presence% NP% RES% considering% the%technical% constraints% of% the% generating% units%and%the%load%patterns.%
!
2016 2025 2030Demand-[TWh/yr] 9.63 18.44 26.18Peak-load-[MW] 1,550 3,145 4,527Min.-load-[MW] 662 1,245 1,754
0
1,000
2,000
3,000
4,000
5,000
6,000
0
5
10
15
20
25
30
[MW]
[TWh/year]
Load/forecast/202572030
+8.2%
+7.6%
+7.3%+7.1%
Fig.04.0Kenyan0load0forecast0for020250and020300
(Reference0Scenario)0
! !!!!!!!! ! !
!
! 8!
System!reliability!For% the% target% years,% the% quantitative%evaluation% of% static% reliability% of% the% electric%power% system% (adequacy)% is% obtained%computing% risk% indexes.% They% are% evaluated%by% applying% a% probabilistic% procedure% that%allows% simulating% a% whole% year% taking% into%account% all% scheduled% and% forced% outages% of%generating%units%and%network%components%as%well% as% the% volatility% of% PV% and% wind%generation.% The% computational% tool% adopted%for%the%simulations%is%GRARE%(Grid%Reliability%and% Adequacy% Risk% Evaluator)2,% based% on% a%hybrid%Monte%Carlo%algorithm%and%developed%by% CESI% on% behalf% of% Terna,% the% Italian%Transmission%System%Operator.%
The% following% reliability% indexes% are%considered:%
•% Expected0 Energy0 Not0 Supplied0 (EENS):%expected% yearly% energy% average% value% of%unsupplied% load% due% to% unavailability% of%generation% and/or% transmission%equipment,% caused% by% scheduled%maintenance% and/or% forced% outages%(MWh/year%or%p.u.3%of%annual%demand);%
•% Loss0of0Load0Expectation0(LOLE):%period% in%which% demand% is% not% supplied%(hours/year).%
•% Loss0 of0 Load0 Probability% (LOLP):%probability% of% not% being% able% to% meet% the%expected%weekly%peak%load%(%).%
The% following% standards% for% the% Kenyan%power%system%are%adopted%(Table%2).%
!!!!!!!!!!!!!!!!!!!!!!!!!!!!!!!!!!!!!!!!!!!!!!!!!!!!!!!!!!!!!
2!See!www.cesi.it/grare!3!p.u.:!per!unit!
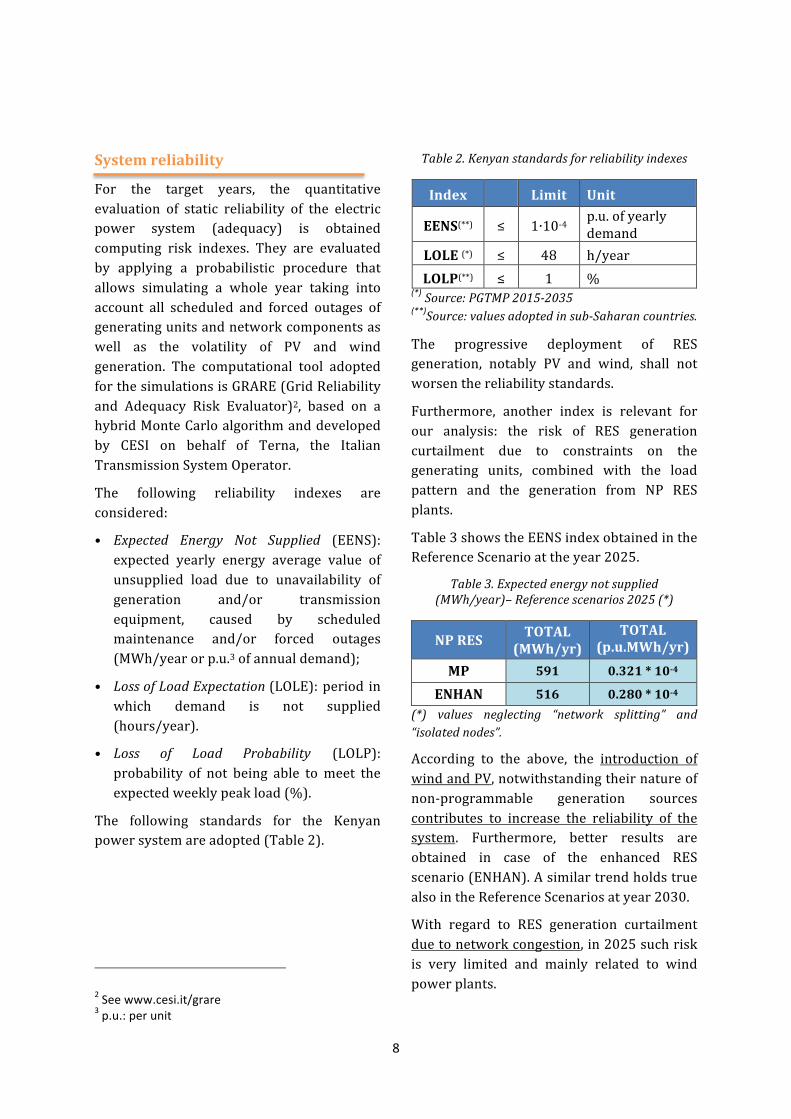
Table02.0Kenyan0standards0for0reliability0indexes0
Index! ! Limit! Unit!
EENS(**)! ≤% 1∙10?4%p.u.%of%yearly%demand%
LOLE!(*)! ≤% 48% h/year%LOLP(**)! ≤% 1% %%
(*)$Source:0PGTMP02015=20350(**)Source:0values0adopted0in0sub=Saharan0countries.0
The% progressive% deployment% of% RES%generation,% notably% PV% and% wind,% shall% not%worsen%the%reliability%standards.%
Furthermore,% another% index% is% relevant% for%our% analysis:% the% risk% of% RES% generation%curtailment% due% to% constraints% on% the%generating% units,% combined% with% the% load%pattern% and% the% generation% from% NP% RES%plants.%
Table%3%shows%the%EENS%index%obtained%in%the%Reference%Scenario%at%the%year%2025.%%
Table03.0Expected0energy0not0supplied0
(MWh/year)–0Reference0scenarios020250(*)0
NP!RES! TOTAL!(MWh/yr)!
TOTAL!(p.u.MWh/yr)!
MP! 591! 0.321!*!10=4!
ENHAN0 5160 0.280!*!10=40(*)0 values0 neglecting0 “network0 splitting”0 and0
“isolated0nodes”.0
According% to% the% above,% the% introduction% of%wind%and%PV,%notwithstanding%their%nature%of%non?programmable% generation% sources%contributes% to% increase% the% reliability% of% the%system.% Furthermore,% better% results% are%obtained% in% case% of% the% enhanced% RES%scenario%(ENHAN).%A%similar%trend%holds%true%also%in%the%Reference%Scenarios%at%year%2030.%
With% regard% to% RES% generation% curtailment%due%to%network%congestion,%in%2025%such%risk%is% very% limited% and% mainly% related% to% wind%power%plants.%
! !!!!!!!! ! !
!
! 9!
In% 2030,% NP% RES% generation% is% affected% by%curtailments%of% circa%5%%of% the% total%NP%RES%yearly%production.%%
!
The!role!of!the!transmission!grid!
The%role%of% the% transmission%grid% is%essential%to%ensure%a%reliable%power%supply.%Regardless%the%presence%of%non?programmable%RES,%due%to% its%radial%configuration%and%poor%meshing,%the% reliability% indices% risk% to% exceed% the%quality% thresholds% (Table% 2).% The% network%transmission% development% plan% outlined% in%the% PGTMP% and% validated% by% the% KWG% is%coherent% with% the% roadmap% of% NP% RES%development% in% both% scenarios,% MP% and%ENHAN,%with%few%exceptions.%
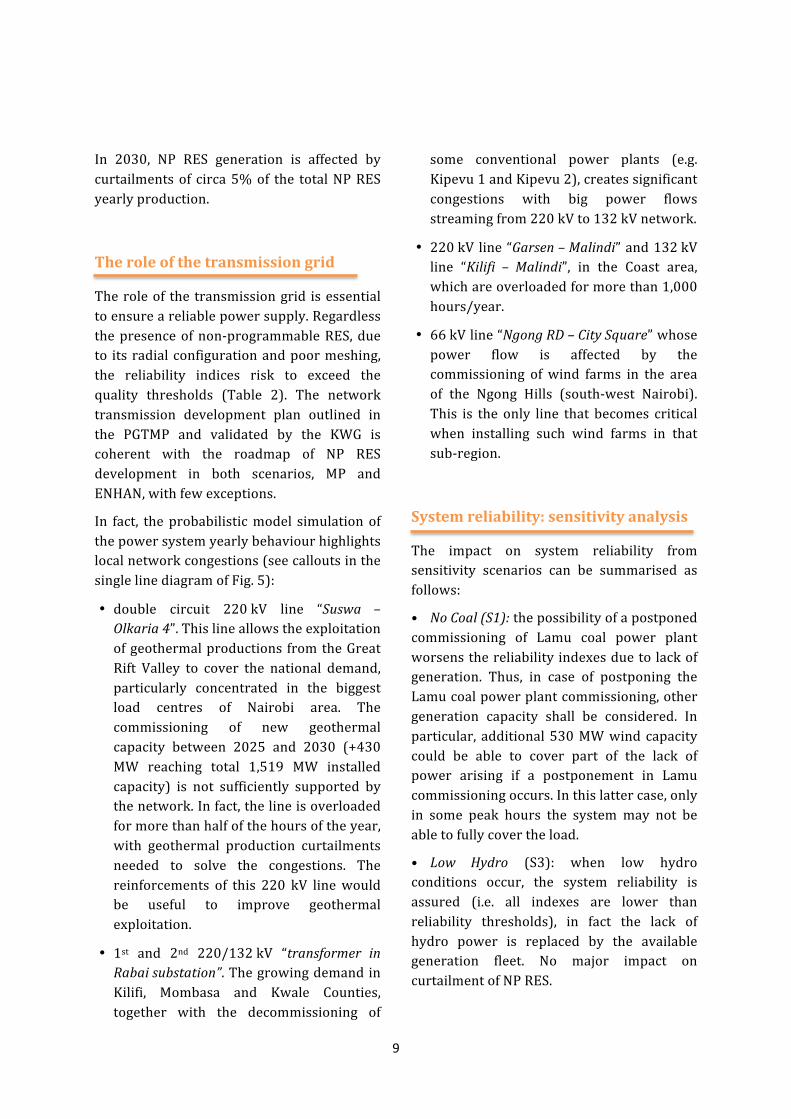
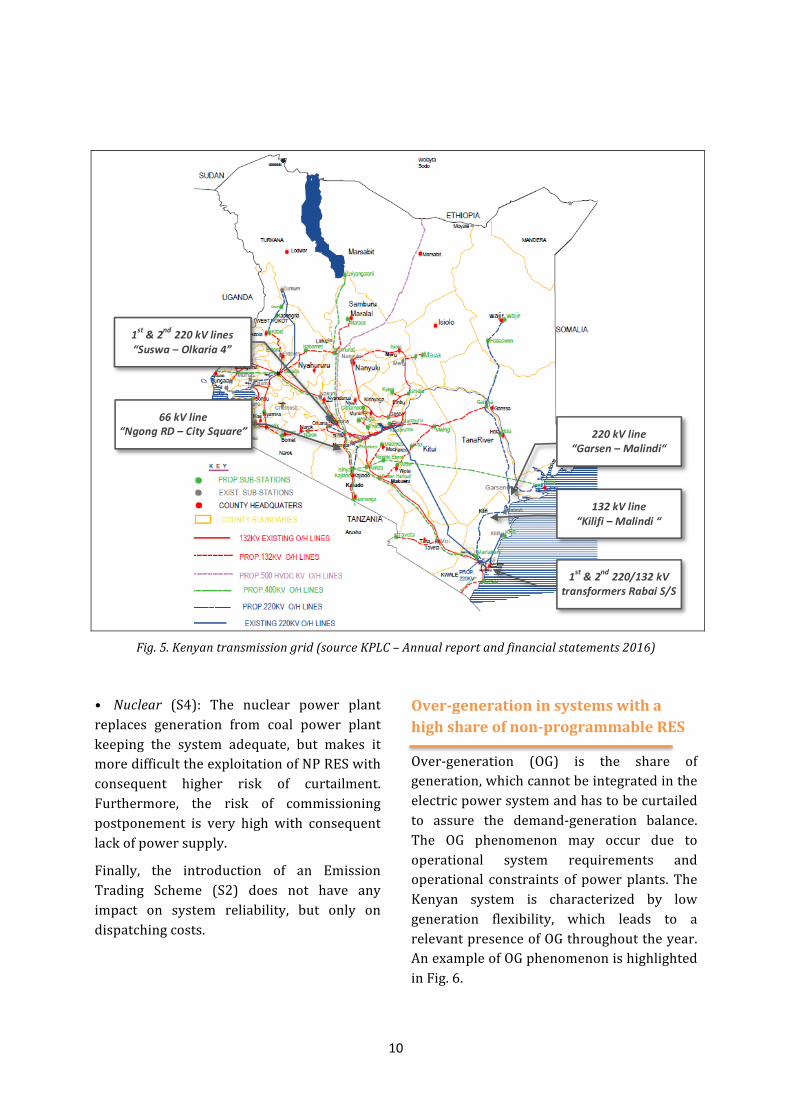
In% fact,% the%probabilistic%model% simulation%of%the%power%system%yearly%behaviour%highlights%local%network%congestions%(see%callouts%in%the%single%line%diagram%of%Fig.%5):%
•! double% circuit% 220%kV% line% “Suswa0 –0Olkaria04”.%This%line%allows%the%exploitation%of%geothermal%productions% from%the%Great%Rift% Valley% to% cover% the% national% demand,%particularly% concentrated% in% the% biggest%load% centres% of% Nairobi% area.% The%commissioning% of% new% geothermal%capacity% between% 2025% and% 2030% (+430%MW% reaching% total% 1,519% MW% installed%capacity)% is% not% sufficiently% supported% by%the%network.%In%fact,%the%line%is%overloaded%for%more%than%half%of%the%hours%of%the%year,%with% geothermal% production% curtailments%needed% to% solve% the% congestions.% The%reinforcements% of% this% 220% kV% line%would%be% useful% to% improve% geothermal%exploitation.%
•! 1st% and% 2nd% 220/132%kV% “transformer0 in0Rabai0substation”.%The%growing%demand%in%Kilifi,% Mombasa% and% Kwale% Counties,%together% with% the% decommissioning% of%
some% conventional% power% plants% (e.g.%Kipevu%1%and%Kipevu%2),%creates%significant%congestions% with% big% power% flows%streaming%from%220%kV%to%132%kV%network.%
•! 220%kV% line%“Garsen0–0Malindi”%and%132%kV%line% “Kilifi0 –0 Malindi”,% in% the% Coast% area,%which%are%overloaded%for%more%than%1,000%hours/year.%
•! 66%kV%line%“Ngong0RD0–0City0Square”%whose%power% flow% is% affected% by% the%commissioning% of% wind% farms% in% the% area%of% the% Ngong% Hills% (south?west% Nairobi).%This% is% the% only% line% that% becomes% critical%when% installing% such% wind% farms% in% that%sub?region.%
!
System!reliability:!sensitivity!analysis!
The% impact% on% system% reliability% from%sensitivity% scenarios% can% be% summarised% as%follows:%
•% No0Coal0(S1):%the%possibility%of%a%postponed%commissioning% of% Lamu% coal% power% plant%worsens%the%reliability%indexes%due%to%lack%of%generation.% Thus,% in% case% of% postponing% the%Lamu%coal%power%plant%commissioning,%other%generation% capacity% shall% be% considered.% In%particular,% additional%530%MW%wind% capacity%could% be% able% to% cover% part% of% the% lack% of%power% arising% if% a% postponement% in% Lamu%commissioning%occurs.%In%this%latter%case,%only%in% some% peak% hours% the% system% may% not% be%able%to%fully%cover%the%load.%
•% Low0 Hydro% (S3):% when% low% hydro%conditions% occur,% the% system% reliability% is%assured% (i.e.% all% indexes% are% lower% than%reliability% thresholds),% in% fact% the% lack% of%hydro% power% is% replaced% by% the% available%generation% fleet.% No% major% impact% on%curtailment%of%NP%RES.%
%
! !!!!!!!! ! !
!
! 10!
%Fig.05.0Kenyan0transmission0grid0(source0KPLC0–0Annual0report0and0financial0statements02016)0
0
•0 Nuclear% (S4):% The% nuclear% power% plant%replaces% generation% from% coal% power% plant%keeping% the% system% adequate,% but% makes% it%more%difficult%the%exploitation%of%NP%RES%with%consequent% higher% risk% of% curtailment.%Furthermore,% the% risk% of% commissioning%postponement% is% very% high% with% consequent%lack%of%power%supply.%
Finally,% the% introduction% of% an% Emission%Trading% Scheme% (S2)% does% not% have% any%impact% on% system% reliability,% but% only% on%dispatching%costs.%
!
!
Over=generation!in!systems!with!a!high!share!of!non=programmable!RES!
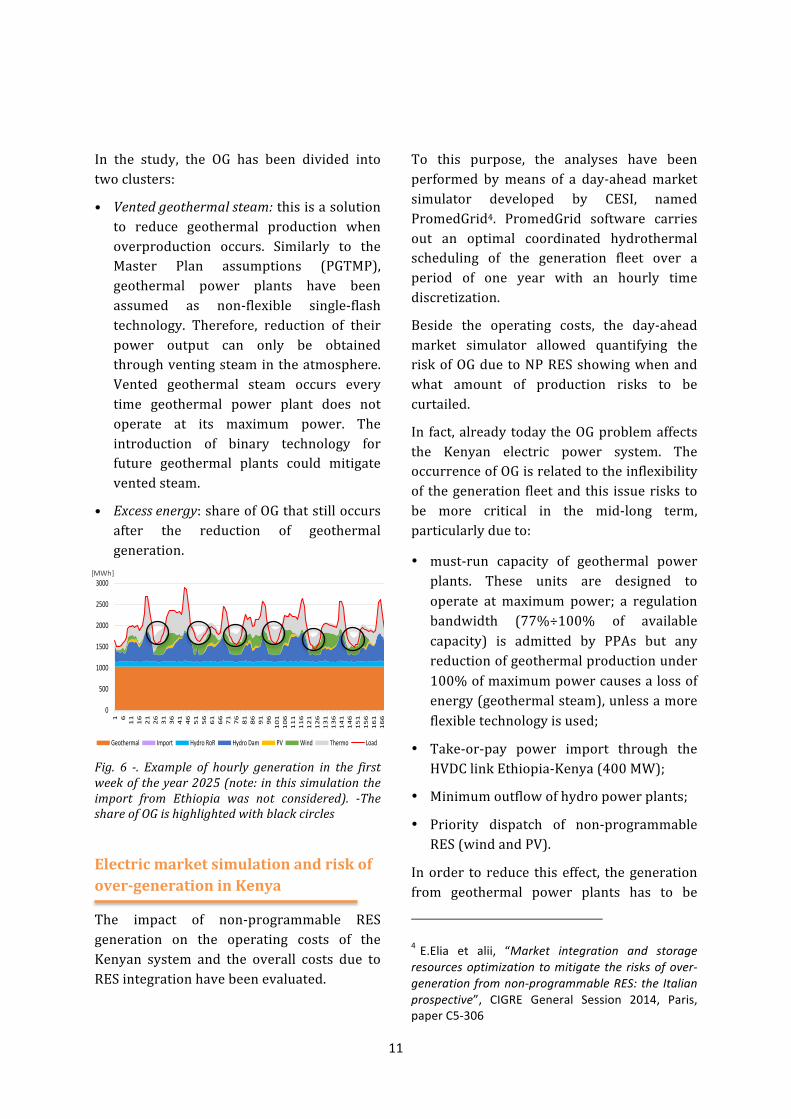
Over?generation% (OG)% is% the% share% of%generation,%which%cannot%be%integrated%in%the%electric%power%system%and%has%to%be%curtailed%to% assure% the% demand?generation% balance.%The% OG% phenomenon% may% occur% due% to%operational% system% requirements% and%operational% constraints% of% power%plants.% The%Kenyan% system% is% characterized% by% low%generation% flexibility,% which% leads% to% a%relevant%presence%of%OG%throughout%the%year.%An%example%of%OG%phenomenon%is%highlighted%in%Fig.%6.%%
1st$&$2nd$220$kV$lines$“Suswa$–$Olkaria$4”$
1st$&$2nd$220/132$kV$transformers$Rabai$S/S$
66$kV$line$“Ngong$RD$–$City$Square”$ 220$kV$line$
“Garsen$–$Malindi“$
132$kV$line$“Kilifi$–$Malindi$“$
! !!!!!!!! ! !
!
! 11!
In% the% study,% the% OG% has% been% divided% into%two%clusters:%
•% Vented0geothermal0steam:%this%is%a%solution%to% reduce% geothermal% production% when%overproduction% occurs.% Similarly% to% the%Master% Plan% assumptions% (PGTMP),%geothermal% power% plants% have% been%assumed% as% non?flexible% single?flash%technology.% Therefore,% reduction% of% their%power% output% can% only% be% obtained%through%venting%steam%in%the%atmosphere.%Vented% geothermal% steam% occurs% every%time% geothermal% power% plant% does% not%operate% at% its% maximum% power.% The%introduction% of% binary% technology% for%future% geothermal% plants% could% mitigate%vented%steam.%%
•% Excess0energy:%share%of%OG%that%still%occurs%after% the% reduction% of% geothermal%generation.%%
%Fig.0 60 =.0 Example0 of0 hourly0 generation0 in0 the0 first0
week0of0the0year020250(note:0 in0this0simulation0the0
import0 from0 Ethiopia0 was0 not0 considered).0 =The0
share0of0OG0is0highlighted0with0black0circles0
%
Electric!market!simulation!and!risk!of!over=generation!in!Kenya!
The% impact% of% non?programmable% RES%generation% on% the% operating% costs% of% the%Kenyan% system% and% the% overall% costs% due% to%RES%integration%have%been%evaluated.%
To% this% purpose,% the% analyses% have% been%performed% by%means% of% a% day?ahead%market%simulator% developed% by% CESI,% named%PromedGrid4.% PromedGrid% software% carries%out% an% optimal% coordinated% hydrothermal%scheduling% of% the% generation% fleet% over% a%period% of% one% year% with% an% hourly% time%discretization.%
Beside% the% operating% costs,% the% day?ahead%market% simulator% allowed% quantifying% the%risk%of%OG%due%to%NP%RES%showing%when%and%what% amount% of% production% risks% to% be%curtailed.%
In% fact,%already%today%the%OG%problem%affects%the% Kenyan% electric% power% system.% The%occurrence%of%OG%is%related%to%the%inflexibility%of% the%generation% fleet%and%this% issue%risks%to%be% more% critical% in% the% mid?long% term,%particularly%due%to:%
•! must?run% capacity% of% geothermal% power%plants.% These% units% are% designed% to%operate% at% maximum% power;% a% regulation%bandwidth% (77%÷100%% of% available%capacity)% is% admitted% by% PPAs% but% any%reduction%of%geothermal%production%under%100%%of%maximum%power%causes%a%loss%of%energy%(geothermal%steam),%unless%a%more%flexible%technology%is%used;%
•! Take?or?pay% power% import% through% the%HVDC%link%Ethiopia?Kenya%(400%MW);%
•! Minimum%outflow%of%hydro%power%plants;%
•! Priority% dispatch% of% non?programmable%RES%(wind%and%PV).%
In%order% to% reduce% this%effect,% the%generation%from% geothermal% power% plants% has% to% be%
!!!!!!!!!!!!!!!!!!!!!!!!!!!!!!!!!!!!!!!!!!!!!!!!!!!!!!!!!!!!!
4 !E.Elia! et! alii,! “Market$ integration$ and$ storage$resources$optimization$to$mitigate$the$risks$of$over9generation$from$non9programmable$RES:$the$ Italian$prospective”,! CIGRE! General! Session! 2014,! Paris,!paper!C56306!
0
500
1000
1500
2000
2500
3000
1 611
16
21
26
31
36
41
46
51
56
61
66
7176
81
86
91
96
101
106
111
116
121
126
131
136
141
146
151
156
161
166
MWh
Example(of(OG(in(the(Kenyan(system(in(the(first(week(of(the(year
Geothermal Import Hydro;RoR Hydro;Dam PV Wind Thermo Load
[MWh]!
! !!!!!!!! ! !
!
! 12!
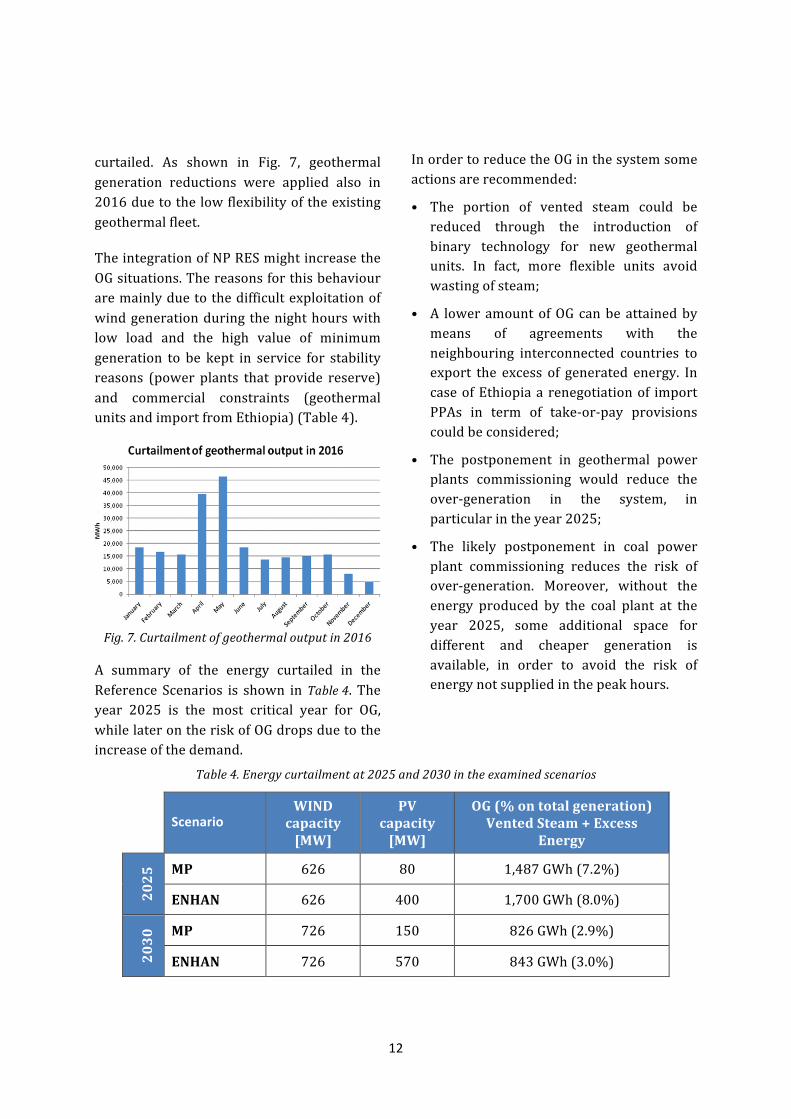
curtailed.% As% shown% in% Fig.% 7,% geothermal%generation% reductions% were% applied% also% in%2016%due%to%the%low%flexibility%of%the%existing%geothermal%fleet.%
The%integration%of%NP%RES%might%increase%the%OG%situations.%The%reasons%for%this%behaviour%are%mainly%due%to%the%difficult%exploitation%of%wind%generation%during%the%night%hours%with%low% load% and% the% high% value% of% minimum%generation% to% be% kept% in% service% for% stability%reasons% (power% plants% that% provide% reserve)%and% commercial% constraints% (geothermal%units%and%import%from%Ethiopia)%(Table%4).%%
Fig.07.0Curtailment0of0geothermal0output0in020160
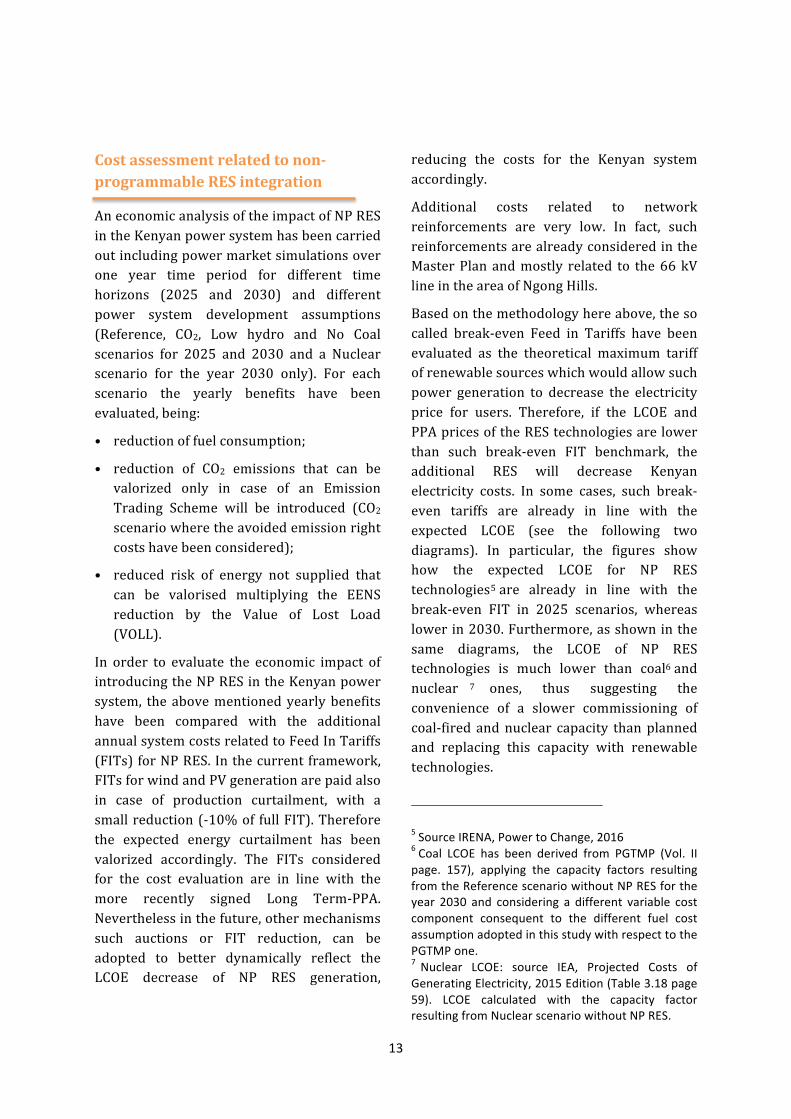
A% summary% of% the% energy% curtailed% in% the%Reference% Scenarios% is% shown% in%Table04.% The%year% 2025% is% the% most% critical% year% for% OG,%while%later%on%the%risk%of%OG%drops%due%to%the%increase%of%the%demand.%%
In%order%to%reduce%the%OG%in%the%system%some%actions%are%recommended:%
•% The% portion% of% vented% steam% could% be%reduced% through% the% introduction% of%binary% technology% for% new% geothermal%units.% In% fact,% more% flexible% units% avoid%wasting%of%steam;%
•% A% lower%amount%of%OG%can%be%attained%by%means% of% agreements% with% the%neighbouring% interconnected% countries% to%export% the% excess% of% generated% energy.% In%case%of%Ethiopia%a% renegotiation%of% import%PPAs% in% term% of% take?or?pay% provisions%could%be%considered;%
•% The% postponement% in% geothermal% power%plants% commissioning% would% reduce% the%over?generation% in% the% system,% in%particular%in%the%year%2025;%
•% The% likely% postponement% in% coal% power%plant% commissioning% reduces% the% risk% of%over?generation.% Moreover,% without% the%energy% produced% by% the% coal% plant% at% the%year% 2025,% some% additional% space% for%different% and% cheaper% generation% is%available,% in% order% to% avoid% the% risk% of%energy%not%supplied%in%the%peak%hours.%
%
Table04.0Energy0curtailment0at020250and020300in0the0examined0scenarios%
%Scenario%
WIND!capacity![MW]!
PV!capacity![MW]!
OG!(%!on!total!generation)!Vented!Steam!+!Excess!
Energy!
2025! MP! 626% 80% 1,487%GWh%(7.2%)%
ENHAN! 626% 400% 1,700%GWh%(8.0%)%
2030! MP! 726% 150% 826%GWh%(2.9%)%
ENHAN! 726% 570% 843%GWh%(3.0%)%
%
%
! !!!!!!!! ! !
!
! 13!
Cost!assessment!related!to!non=programmable!RES!integration!
An%economic%analysis%of%the%impact%of%NP%RES%in%the%Kenyan%power%system%has%been%carried%out%including%power%market%simulations%over%one% year% time% period% for% different% time%horizons% (2025% and% 2030)% and% different%power% system% development% assumptions%(Reference,% CO2,% Low% hydro% and% No% Coal%scenarios% for% 2025% and% 2030% and% a% Nuclear%scenario% for% the% year% 2030% only).% For% each%scenario% the% yearly% benefits% have% been%evaluated,%being:%
•% reduction%of%fuel%consumption;%
•% reduction% of% CO2% emissions% that% can% be%valorized% only% in% case% of% an% Emission%Trading% Scheme% will% be% introduced% (CO2%scenario%where%the%avoided%emission%right%costs%have%been%considered);%
•% reduced% risk% of% energy% not% supplied% that%can% be% valorised% multiplying% the% EENS%reduction% by% the% Value% of% Lost% Load%(VOLL).%
In% order% to% evaluate% the% economic% impact% of%introducing%the%NP%RES%in%the%Kenyan%power%system,% the%above%mentioned%yearly%benefits%have% been% compared% with% the% additional%annual%system%costs%related%to%Feed%In%Tariffs%(FITs)%for%NP%RES.%In%the%current%framework,%FITs%for%wind%and%PV%generation%are%paid%also%in% case% of% production% curtailment,% with% a%small%reduction%(?10%%of% full%FIT).%Therefore%the% expected% energy% curtailment% has% been%valorized% accordingly.% The% FITs% considered%for% the% cost% evaluation% are% in% line% with% the%more% recently% signed% Long% Term?PPA.%Nevertheless%in%the%future,%other%mechanisms%such% auctions% or% FIT% reduction,% can% be%adopted% to% better% dynamically% reflect% the%LCOE% decrease% of% NP% RES% generation,%
reducing% the% costs% for% the% Kenyan% system%accordingly.%
Additional% costs% related% to% network%reinforcements% are% very% low.% In% fact,% such%reinforcements%are%already%considered%in%the%Master%Plan%and%mostly% related% to% the%66%kV%line%in%the%area%of%Ngong%Hills.%
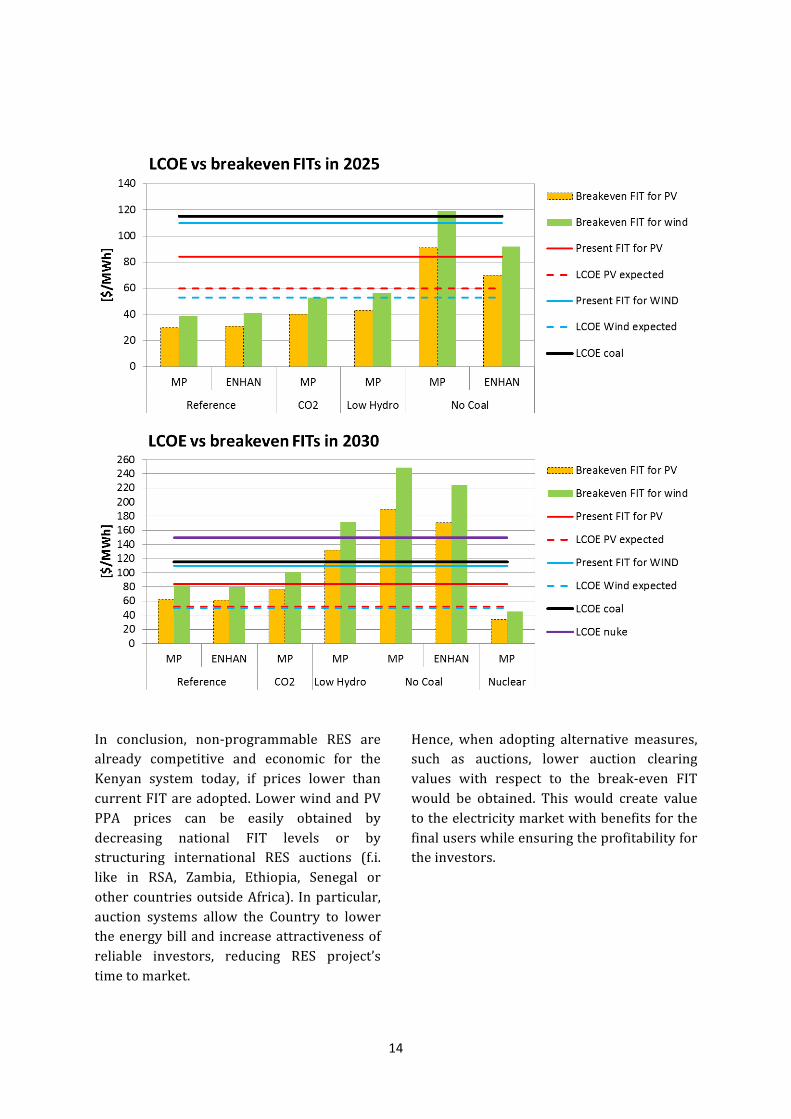
Based%on%the%methodology%here%above,%the%so%called% break?even% Feed% in% Tariffs% have% been%evaluated% as% the% theoretical% maximum% tariff%of%renewable%sources%which%would%allow%such%power% generation% to% decrease% the% electricity%price% for% users.% Therefore,% if% the% LCOE% and%PPA%prices%of%the%RES%technologies%are%lower%than% such% break?even% FIT% benchmark,% the%additional% RES% will% decrease% Kenyan%electricity% costs.% In% some% cases,% such% break?even% tariffs% are% already% in% line% with% the%expected% LCOE% (see% the% following% two%diagrams).% In% particular,% the% figures% show%how% the% expected% LCOE% for% NP% RES%technologies5%are% already% in% line% with% the%break?even% FIT% in% 2025% scenarios,% whereas%lower%in%2030.%Furthermore,%as%shown%in%the%same% diagrams,% the% LCOE% of% NP% RES%technologies% is% much% lower% than% coal6%and%nuclear 7 %ones,% thus% suggesting% the%convenience% of% a% slower% commissioning% of%coal?fired% and%nuclear% capacity% than%planned%and% replacing% this% capacity% with% renewable%technologies.%
!!!!!!!!!!!!!!!!!!!!!!!!!!!!!!!!!!!!!!!!!!!!!!!!!!!!!!!!!!!!!
5!Source!IRENA,!Power!to!Change,!2016!6!Coal! LCOE! has! been! derived! from! PGTMP! (Vol.! II!page.! 157),! applying! the! capacity! factors! resulting!from!the!Reference!scenario!without!NP!RES!for!the!year! 2030! and! considering! a! different! variable! cost!component! consequent! to! the! different! fuel! cost!assumption!adopted!in!this!study!with!respect!to!the!PGTMP!one.!7 !Nuclear! LCOE:! source! IEA,! Projected! Costs! of!Generating!Electricity,!2015!Edition!(Table!3.18!page!59).! LCOE! calculated! with! the! capacity! factor!resulting!from!Nuclear!scenario!without!NP!RES.!
! !!!!!!!! ! !
!
! 14!
%
%
%
In% conclusion,% non?programmable% RES% are%already% competitive% and% economic% for% the%Kenyan% system% today,% if% prices% lower% than%current%FIT%are%adopted.%Lower%wind%and%PV%PPA% prices% can% be% easily% obtained% by%decreasing% national% FIT% levels% or% by%structuring% international% RES% auctions% (f.i.%like% in% RSA,% Zambia,% Ethiopia,% Senegal% or%other%countries%outside%Africa).% In%particular,%auction% systems% allow% the% Country% to% lower%the%energy%bill%and%increase%attractiveness%of%reliable% investors,% reducing% RES% project’s%time%to%market.%
Hence,% when% adopting% alternative%measures,%such% as% auctions,% lower% auction% clearing%values% with% respect% to% the% break?even% FIT%would% be% obtained.% This% would% create% value%to%the%electricity%market%with%benefits%for%the%final%users%while%ensuring%the%profitability%for%the%investors.%
%
! !!!!!!!! ! !
!
! 15!
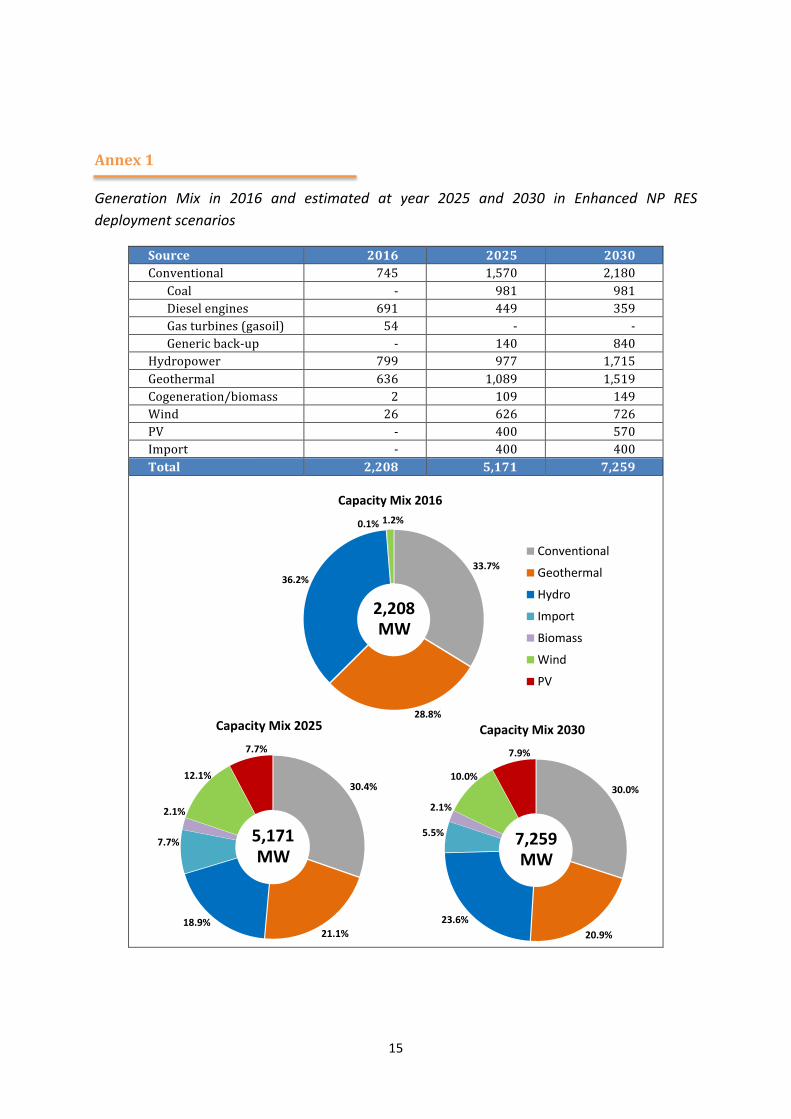
Annex!1!
Generation$ Mix$ in$ 2016$ and$ estimated$ at$ year$ 2025$ and$ 2030$ in$ Enhanced$ NP$ RES$deployment$scenarios$
Source! 2016! 2025! 2030!Conventional% 745% 1,570% 2,180%
Coal% ?% 981% 981%Diesel%engines% 691% 449% 359%Gas%turbines%(gasoil)% 54% ?% ?%Generic%back?up% ?% 140% 840%
Hydropower% 799% 977% 1,715%Geothermal% 636% 1,089% 1,519%Cogeneration/biomass% 2% 109% 149%Wind% 26% 626% 726%PV% ?% 400% 570%Import% ?% 400% 400%Total! 2,208! 5,171! 7,259!
)
)) ))))) )
)))))))))))))) )!
!
33.7%
28.8%
36.2%
0.1% 1.2%
Capacity1Mix12016
ConventionalGeothermalHydroImportBiomassWindPV
MW2,208
30.4%
21.1%18.9%
7.7%
2.1%
12.1%
7.7%
Capacity2Mix22025
ConventionalGeothermalHydroImportBiomassWindPV
MW5,171
30.4%
21.1%18.9%
7.7%
2.1%
12.1%
7.7%
Capacity2Mix22025
ConventionalGeothermalHydroImportBiomassWindPV
MW5,171
30.0%
20.9%23.6%
5.5%
2.1%
10.0%
7.9%
Capacity2Mix22030
ConventionalGeothermalHydroImportBiomassWindPV
MW7,259
! !!!!!!!! ! !
!
! 16!
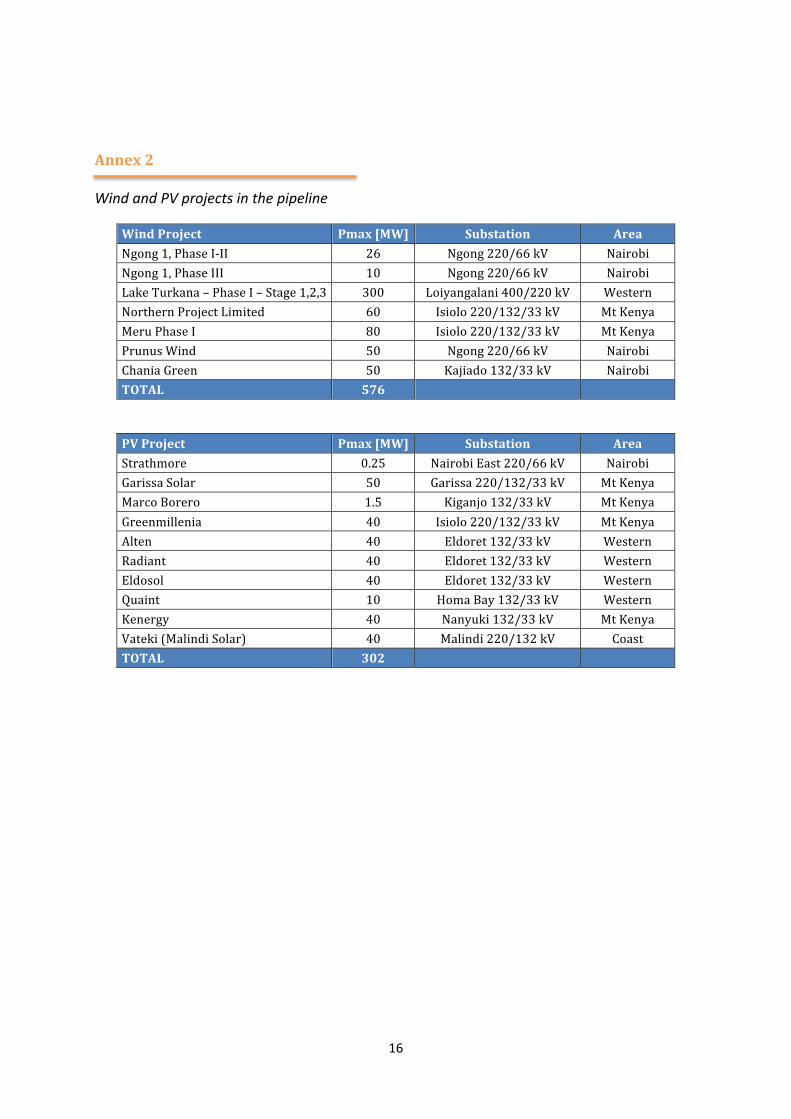
Annex!2!
Wind$and$PV$projects$in$the$pipeline$
Wind!Project! Pmax![MW]! Substation! Area!Ngong%1,%Phase%I?II% 26% Ngong%220/66%kV% Nairobi%Ngong%1,%Phase%III% 10% Ngong%220/66%kV% Nairobi%Lake%Turkana%–%Phase%I%–%Stage%1,2,3% 300% Loiyangalani%400/220%kV% Western%Northern%Project%Limited% 60% Isiolo%220/132/33%kV% Mt%Kenya%Meru%Phase%I% 80% Isiolo%220/132/33%kV% Mt%Kenya%Prunus%Wind% 50% Ngong%220/66%kV% Nairobi%Chania%Green% 50% Kajiado%132/33%kV% Nairobi%TOTAL! 576! ! !
!
PV!Project! Pmax![MW]! Substation! Area!Strathmore% 0.25% Nairobi%East%220/66%kV% Nairobi%Garissa%Solar% 50% Garissa%220/132/33%kV% Mt%Kenya%Marco%Borero% 1.5% Kiganjo%132/33%kV% Mt%Kenya%Greenmillenia% 40% Isiolo%220/132/33%kV% Mt%Kenya%Alten% 40% Eldoret%132/33%kV% Western%Radiant% 40% Eldoret%132/33%kV% Western%Eldosol% 40% Eldoret%132/33%kV% Western%Quaint% 10% Homa%Bay%132/33%kV% Western%Kenergy% 40% Nanyuki%132/33%kV% Mt%Kenya%Vateki%(Malindi%Solar)% 40% Malindi%220/132%kV% Coast%TOTAL! 302! ! !
!