powerpoint timesaver v4
DESCRIPTION
This slide deck help's expedite the presentation creation process.This Timesaver has a large number of preformatted slides (40+) that can be easily leveraged. It also has frameworks and methodologies (35+) that you can utilize when faced with a challenging problem.Why re-invent the wheel? Just come here. Leverage.Or, can’t think of the right way to depict a thought? Brain-cramp? Peruse the content. This will get the creative juices going.This deck has 100+ slides that can easily be leveraged for any presentation that you need to buildSlides here have evolved over the years based on my work at these organizations (primarily consulting)JP Morgan, MasterCard, Bank of America, NYSE, Bank of Montreal, Deloitte, Citi, CapitalOne, Pfizer, Barclays CapI IntroductionII Basic SlidesIII Executive Summary TemplatesIV Models and ObjectsV Project Management TemplatesVI Frameworks and MethodologiesVII 7 Deck RulesChevrons, Future State Architecture, Strategy Development, Business Case, Strategic Objectives, Roadmap, Current State Assessment, Gap Analysis, SIPOC, Competitive Position, Scenario Analysis, Industry Direction, Financial Modelling and Planning, Status Reports, DashboardTRANSCRIPT
IIntroduction
IIBasic Slides
IIIExecutive Summary Templates
IVModels and Objects
VProject Management Templates
VIFrameworks and Methodologies
VII7 Deck Rules
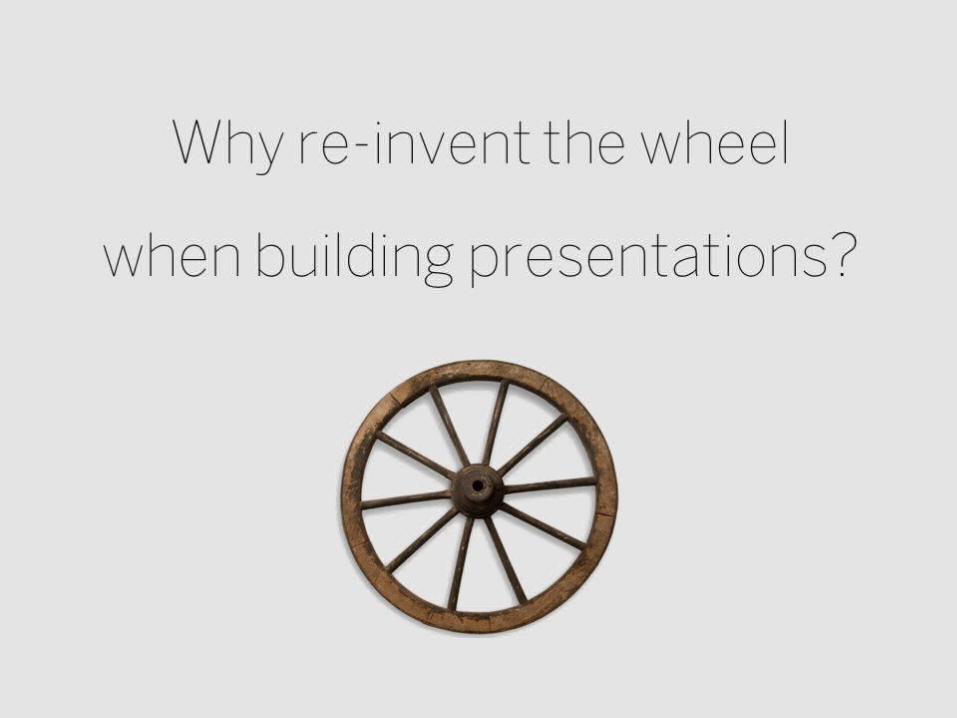
Why re-invent the wheel
when building
presentations?

Just copy-steal-paste
This deck has 100+ slides that can easily be leveraged for any presentation that you need
to build
Slides here have evolved over the years based on my work at these organizations (primarily
consulting)
Salahuddin Khawaja has 15
years of experience, primarily
in the Financial Services
Industry. Before joining JP
Morgan he spent 11 years at
Deloitte & Touche helping
Fortune 500 clients with
various types of Strategic
Initiatives.
He believes in the power of
Presentations, Storytelling
and Visual Design. That is
why he started
Decklaration.com
About the Author
IIntroduction
IIBasic Slides
IIIExecutive Summary Templates
IVModels and Objects
VProject Management Templates
VIFrameworks and Methodologies
VII7 Deck Rules
9
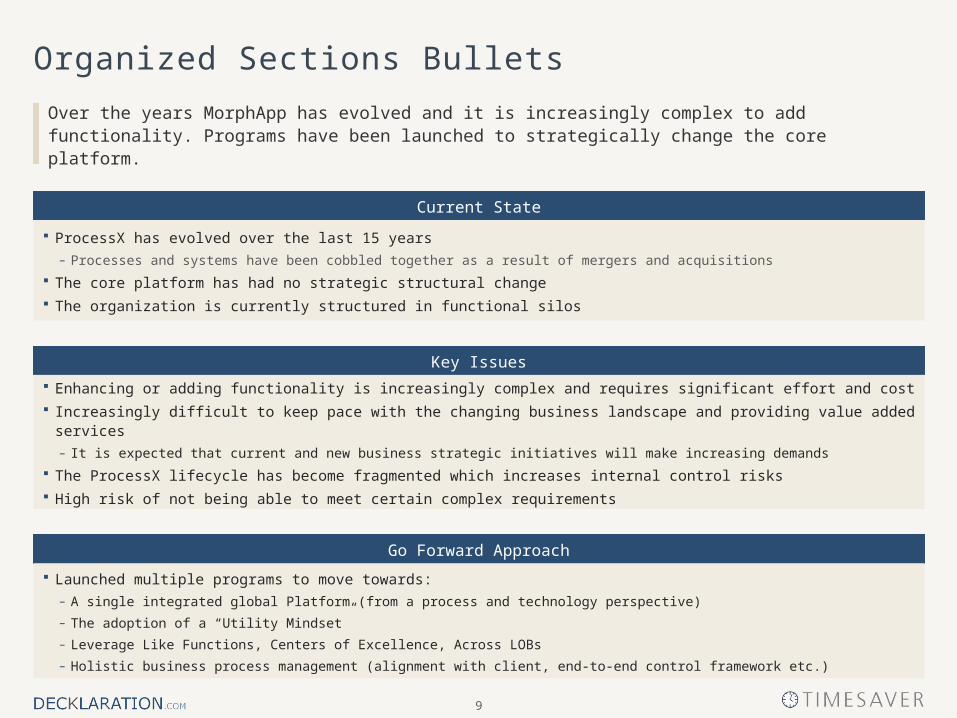
Organized Sections Bullets
Over the years MorphApp has evolved and it is increasingly complex to add functionality. Programs have been launched to strategically change the core platform.
Key Issues
Go Forward Approach
Current State
ProcessX has evolved over the last 15 years
– Processes and systems have been cobbled together as a result of mergers and acquisitions
The core platform has had no strategic structural change
The organization is currently structured in functional silos
Enhancing or adding functionality is increasingly complex and requires significant effort and cost
Increasingly difficult to keep pace with the changing business landscape and providing value added services
– It is expected that current and new business strategic initiatives will make increasing demands
The ProcessX lifecycle has become fragmented which increases internal control risks
High risk of not being able to meet certain complex requirements
Launched multiple programs to move towards:
– A single integrated global Platform (from a process and technology perspective)
– The adoption of a “Utility Mindset”
– Leverage Like Functions, Centers of Excellence, Across LOBs
– Holistic business process management (alignment with client, end-to-end control framework etc.)
10
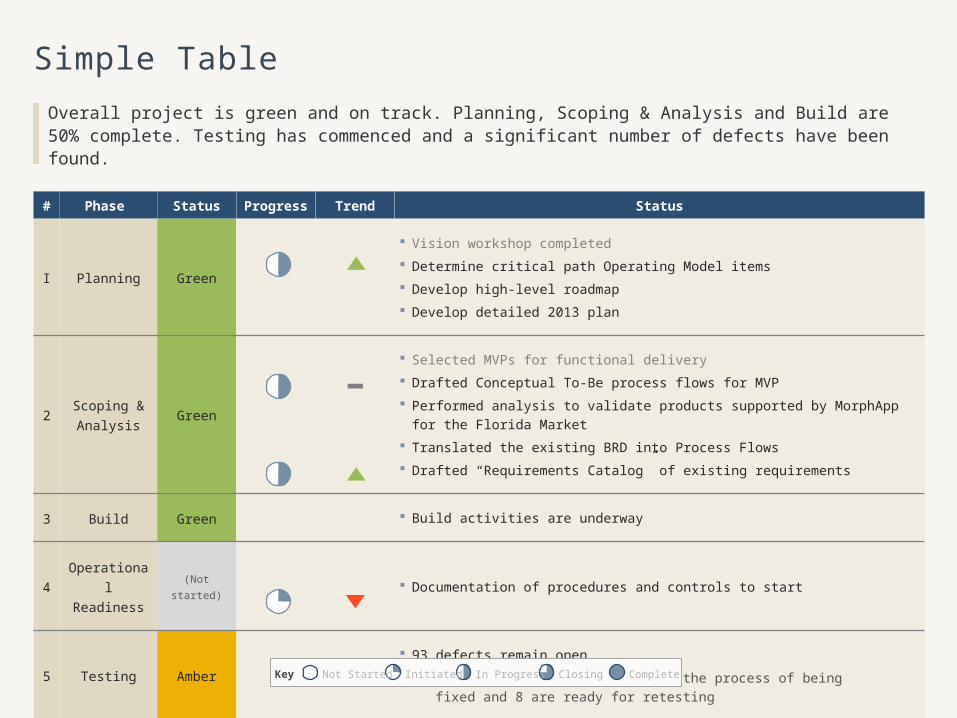
Simple Table
Overall project is green and on track. Planning, Scoping & Analysis and Build are 50% complete. Testing has commenced and a significant number of defects have been found.
# Phase Status Progress Trend Status
I Planning Green
Vision workshop completed Determine critical path Operating Model items Develop high-level roadmap Develop detailed 2013 plan
2Scoping & Analysis
Green
Selected MVPs for functional delivery Drafted Conceptual To-Be process flows for MVP Performed analysis to validate products supported by MorphApp for the Florida Market Translated the existing BRD into Process Flows Drafted “Requirements Catalog” of existing requirements
3 Build Green Build activities are underway
4Operational Readiness
(Not started) Documentation of procedures and controls to start
5 Testing Amber
93 defects remain open- 45 are under review, 41 are in the process of being
fixed and 8 are ready for retesting
Key CompleteNot Started Initiated ClosingIn Progress
11
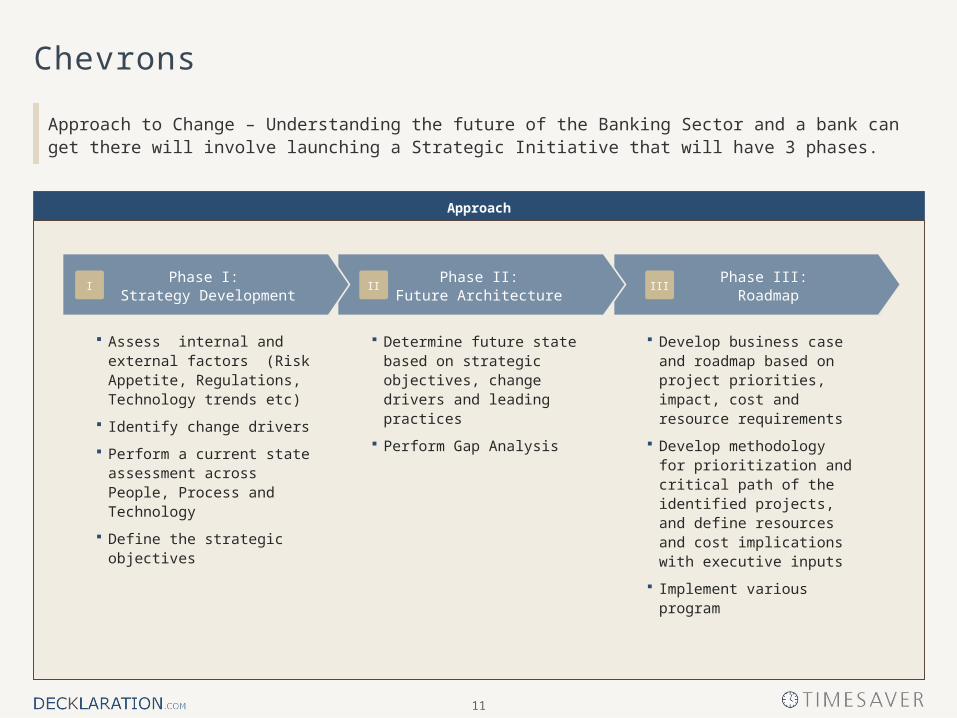
Chevrons
Approach to Change – Understanding the future of the Banking Sector and a bank can get there will involve launching a Strategic Initiative that will have 3 phases.
Determine future state based on strategic objectives, change drivers and leading practices
Perform Gap Analysis
Develop business case and roadmap based on project priorities, impact, cost and resource requirements
Develop methodology for prioritization and critical path of the identified projects, and define resources and cost implications with executive inputs
Implement various program
Assess internal and external factors (Risk Appetite, Regulations, Technology trends etc)
Identify change drivers
Perform a current state assessment across People, Process and Technology
Define the strategic objectives
Phase III: Roadmap
Phase II: Future Architecture
Phase I: Strategy Development
Approach
I II III
12
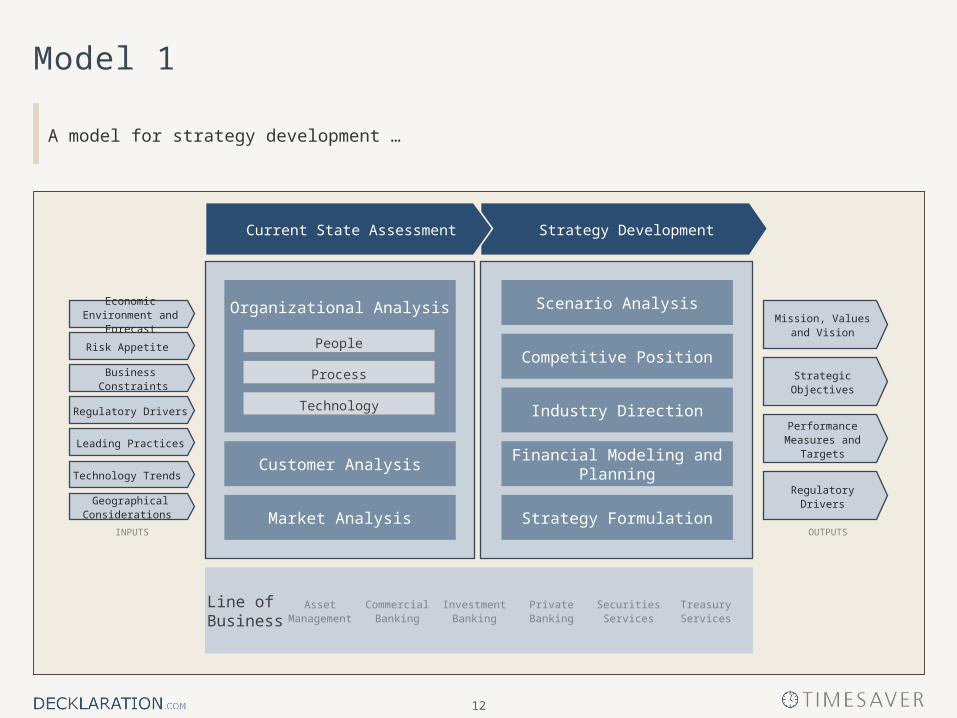
Model 1
A model for strategy development …
Strategy DevelopmentCurrent State Assessment
Risk Appetite
Business Constraints
Regulatory Drivers
Leading Practices
Technology Trends
Economic Environment and Forecast
Geographical Considerations
Mission, Values and Vision
Strategic Objectives
Performance Measures and Targets
Regulatory Drivers
Competitive Position
Scenario Analysis
Industry Direction
Financial Modeling and Planning
Strategy Formulation
Customer Analysis
Market Analysis
Organizational Analysis
Process
People
Technology
Line of Business
Securities Services
Treasury Services
Asset Management
Commercial Banking
Investment Banking
Private Banking
OUTPUTSINPUTS
13
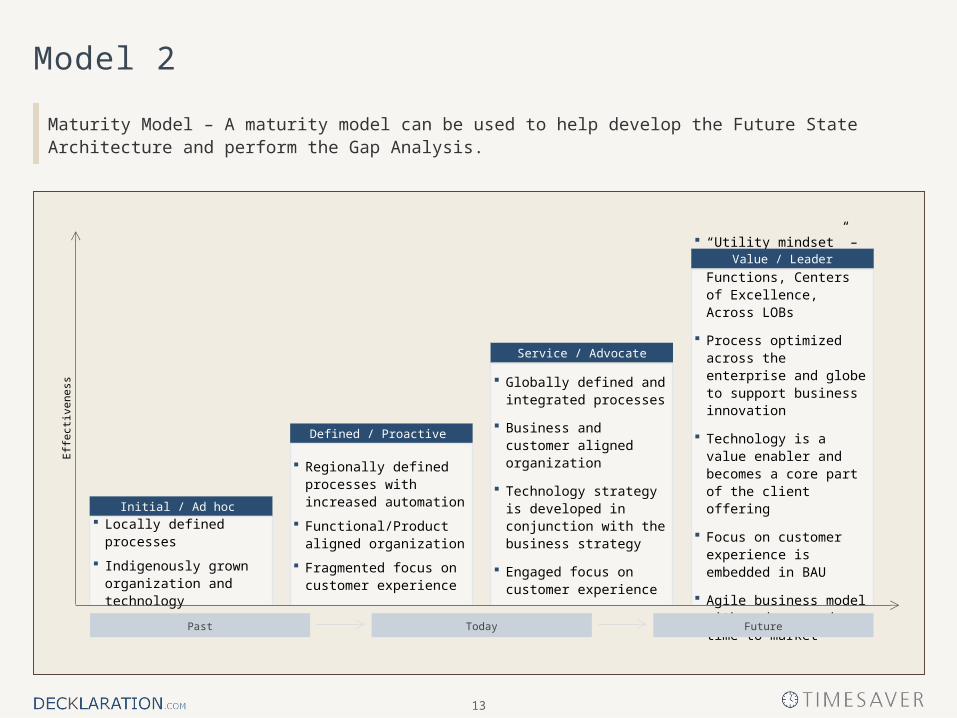
Regionally defined processes with increased automation
Functional/Product aligned organization
Fragmented focus on customer experience
Defined / Proactive
Globally defined and integrated processes
Business and customer aligned organization
Technology strategy is developed in conjunction with the business strategy
Engaged focus on customer experience
Service / Advocate
Locally defined processes
Indigenously grown organization and technology
Initial / Ad hoc
“Utility mindset” – Leverage Like Functions, Centers of Excellence, Across LOBs
Process optimized across the enterprise and globe to support business innovation
Technology is a value enabler and becomes a core part of the client offering
Focus on customer experience is embedded in BAU
Agile business model with a decreased time-to-market
Value / Leader
Effe
ctiv
enes
s
FutureTodayPast
Model 2
Maturity Model – A maturity model can be used to help develop the Future State Architecture and perform the Gap Analysis.
14
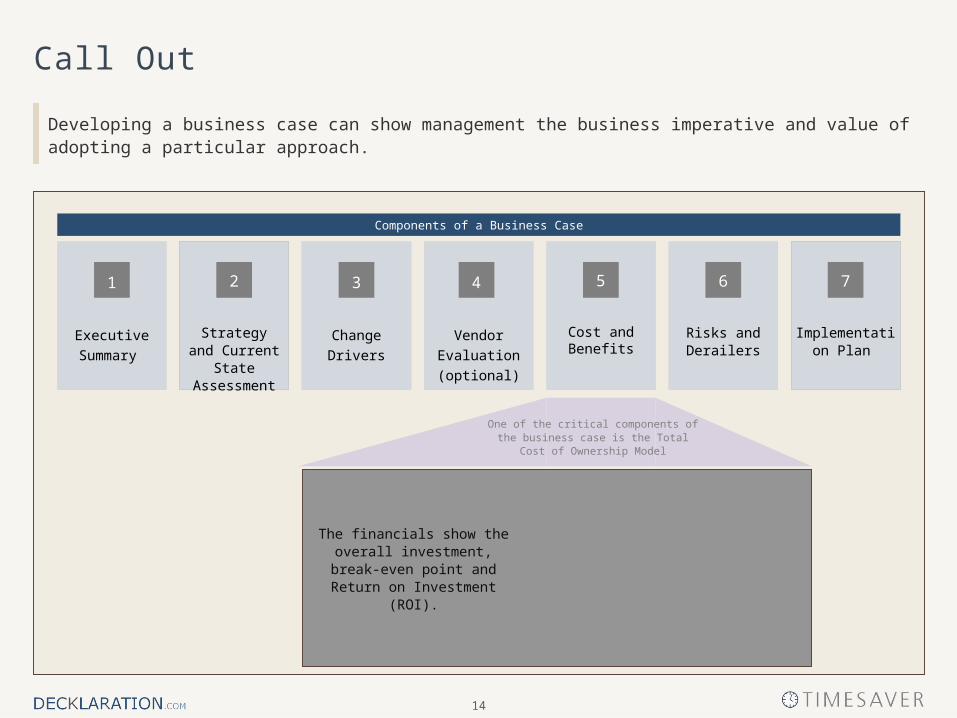
Call Out
Developing a business case can show management the business imperative and value of adopting a particular approach.
Components of a Business Case
Risks and Derailers
Vendor
Evaluation
(optional)
Strategy and Current State Assessment
Executive
Summary
Implementation Plan
Change Drivers Cost and Benefits
The financials show the overall investment, break-even point
and Return on Investment (ROI).
1 42 3 5 6 7
One of the critical components of the business case is the Total Cost of
Ownership Model
15
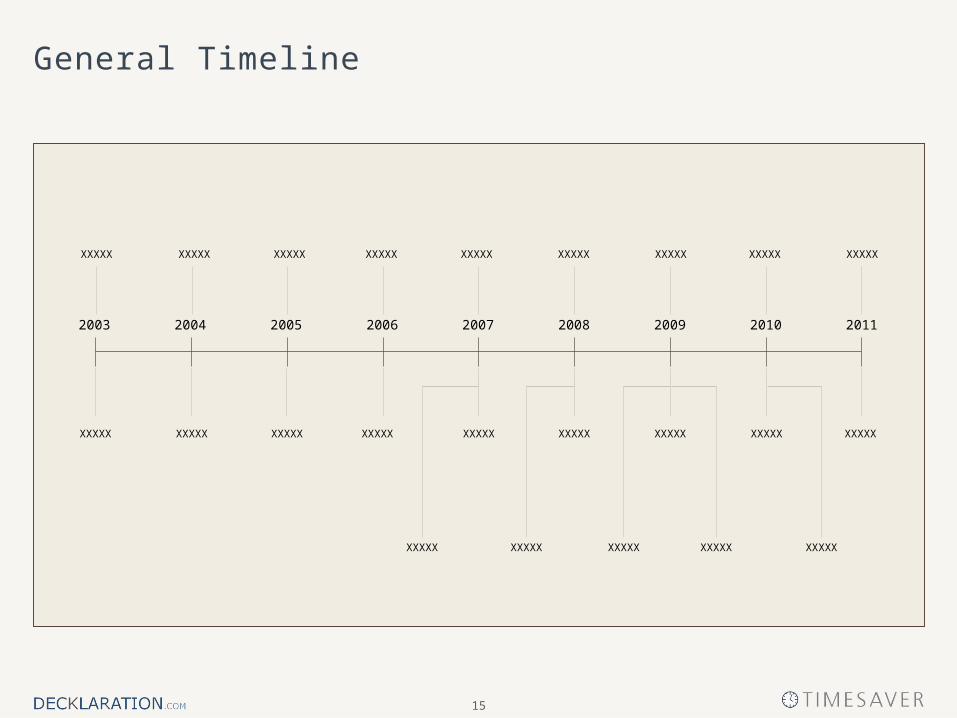
General Timeline
2006 20112004 20102007 2009200820052003
XXXXX
XXXXX
XXXXX
XXXXX
XXXXX XXXXXXXXXXXXXXXXXXXX
XXXXX XXXXXXXXXXXXXXX XXXXX
XXXXXXXXXX XXXXX XXXXXXXXXX
XXXXX
XXXXX
XXXXX
XXXXX
16
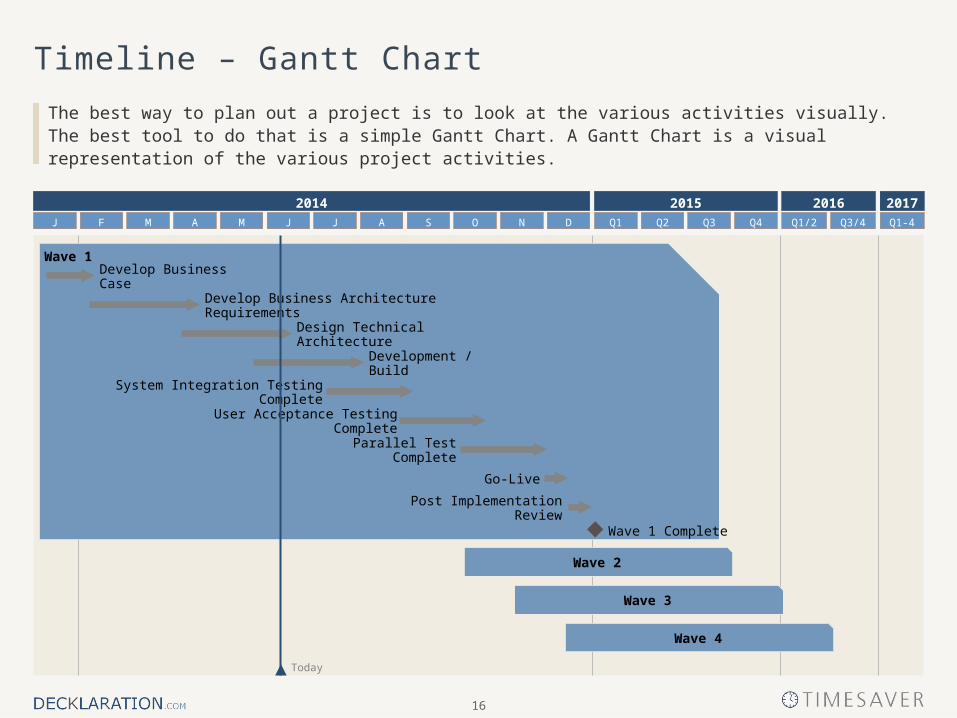
Timeline – Gantt Chart
The best way to plan out a project is to look at the various activities visually. The best tool to do that is a simple Gantt Chart. A Gantt Chart is a visual representation of the various project activities.
2014 2015 2016 2017Q2 Q3 Q4Q1J J AM O DNSF M AJ Q1-4Q1/2 Q3/4
Wave 1
Develop Business Case
Develop Business Architecture Requirements
Development / Build
Design Technical Architecture
User Acceptance Testing Complete
Go-Live
System Integration Testing Complete
Parallel Test Complete
Post Implementation Review
Wave 3
Wave 4
Wave 2
Wave 1 Complete
Today
IIntroduction
IIBasic Slides
IIIExecutive Summary Templates
IVModels and Objects
VProject Management Templates
VIFrameworks and Methodologies
VII7 Deck Rules
18
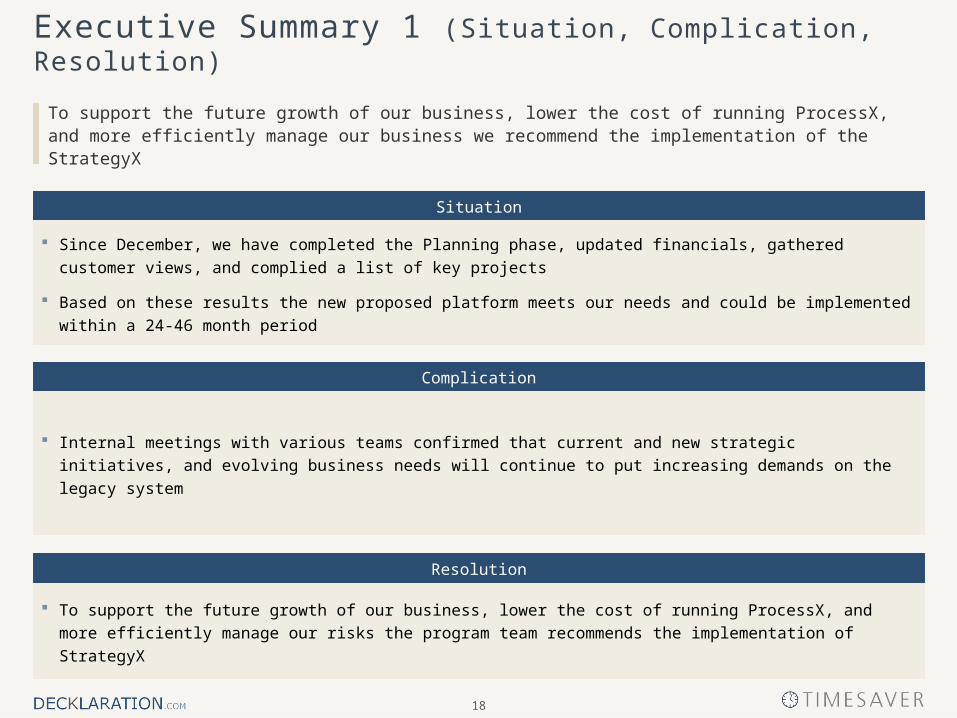
Executive Summary 1 (Situation, Complication, Resolution)
To support the future growth of our business, lower the cost of running ProcessX, and more efficiently manage our business we recommend the implementation of the StrategyX
Internal meetings with various teams confirmed that current and new strategic initiatives, and evolving business needs
will continue to put increasing demands on the legacy system
To support the future growth of our business, lower the cost of running ProcessX, and more efficiently manage our risks
the program team recommends the implementation of StrategyX
Since December, we have completed the Planning phase, updated financials, gathered customer views, and complied a
list of key projects
Based on these results the new proposed platform meets our needs and could be implemented within a 24-46 month
period
Complication
Resolution
Situation
19
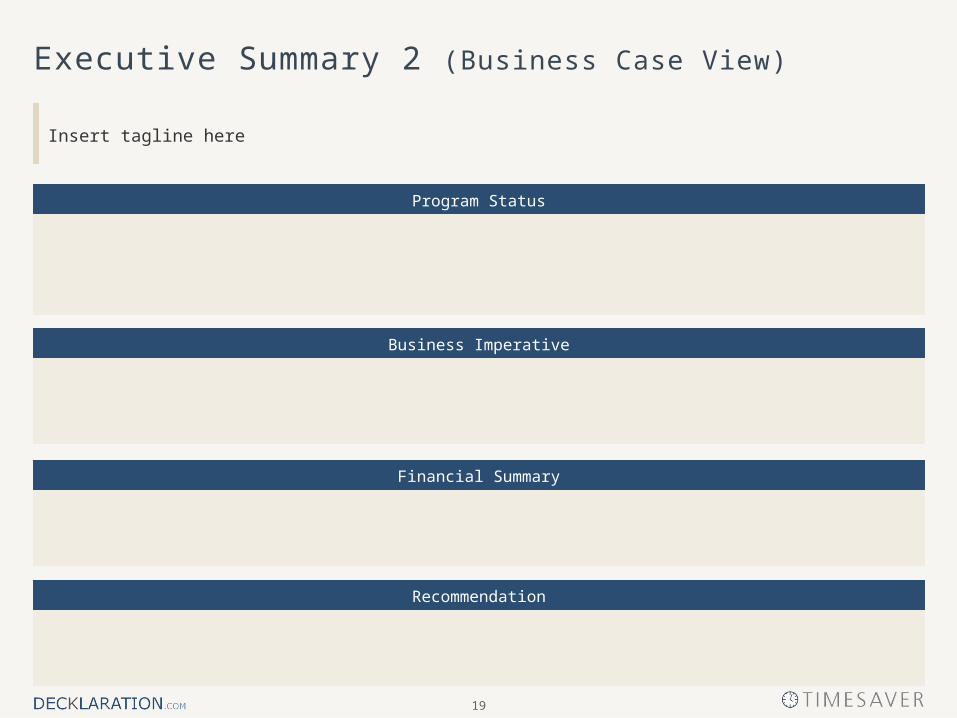
Executive Summary 2 (Business Case View)
Insert tagline here
Business Imperative
Financial Summary
Program Status
Recommendation
20
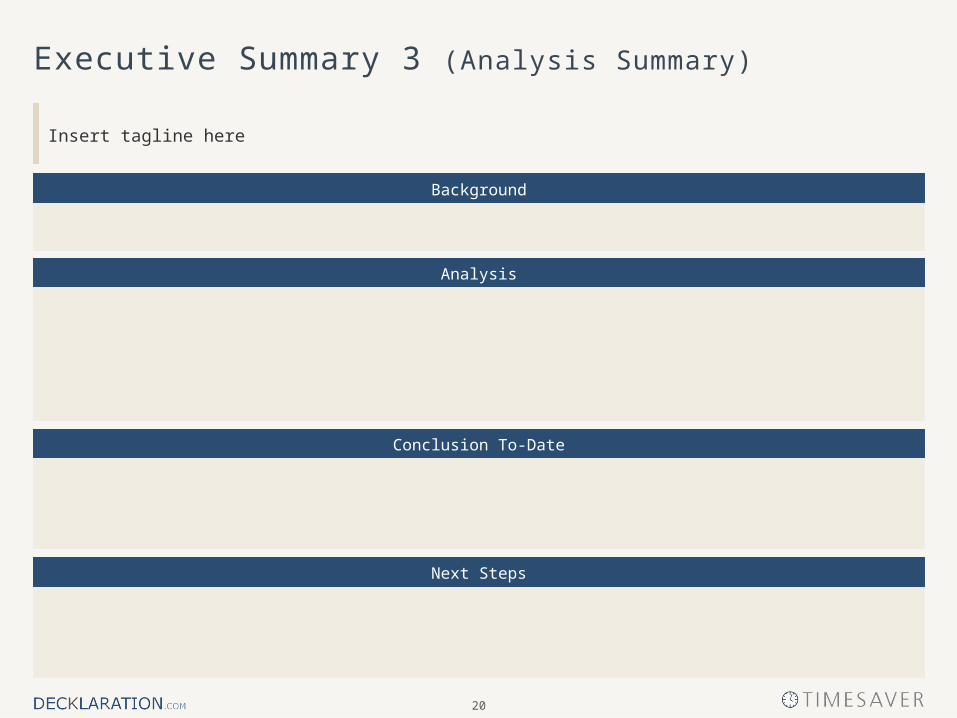
Executive Summary 3 (Analysis Summary)
Insert tagline here
Analysis
Conclusion To-Date
Background
Next Steps
IIntroduction
IIBasic Slides
IIIExecutive Summary Templates
IVModels and Objects
VProject Management Templates
VIFrameworks and Methodologies
VII7 Deck Rules
22
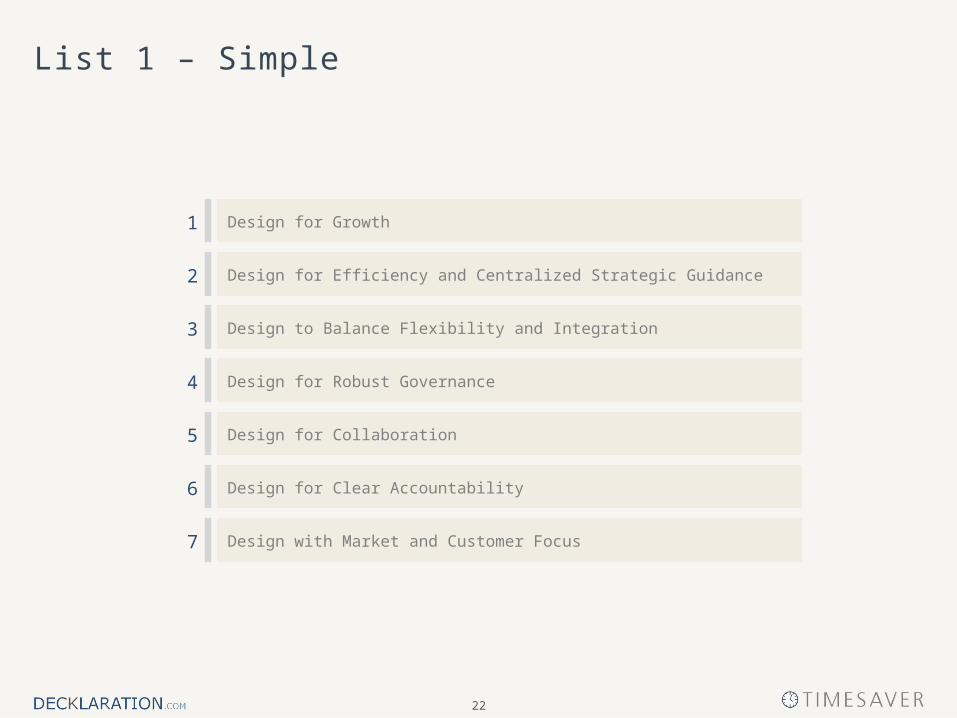
List 1 – Simple
1 Design for Growth
3 Design to Balance Flexibility and Integration
5 Design for Collaboration
Design for Efficiency and Centralized Strategic Guidance2
4 Design for Robust Governance
6 Design for Clear Accountability
7 Design with Market and Customer Focus
23
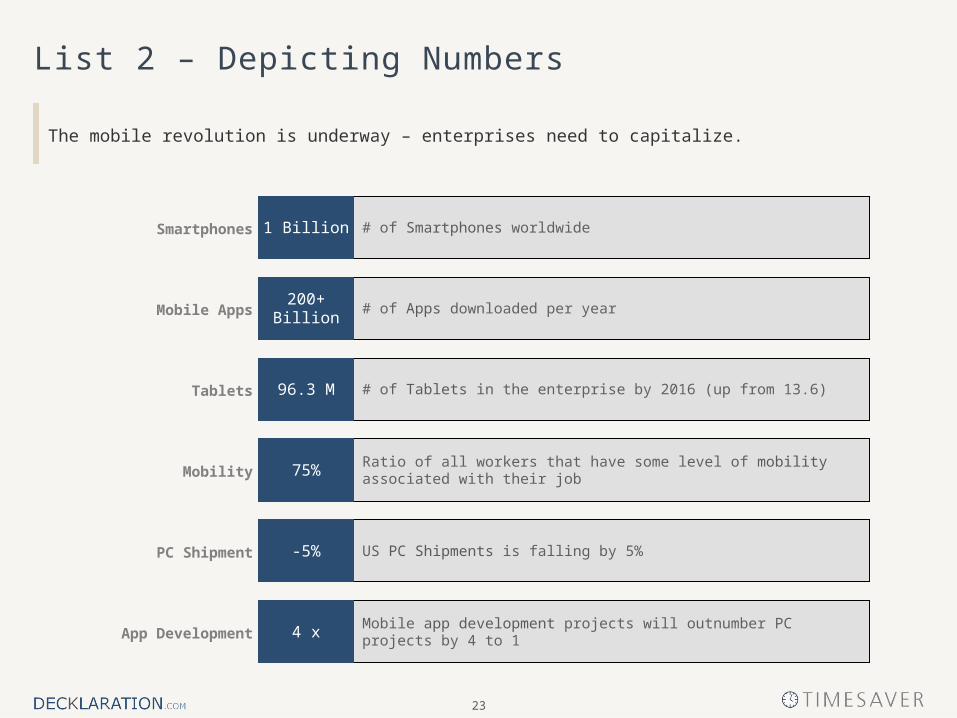
List 2 – Depicting Numbers
The mobile revolution is underway – enterprises need to capitalize.
Tablets # of Tablets in the enterprise by 2016 (up from 13.6)
Mobility Ratio of all workers that have some level of mobility associated with their job
PC Shipment US PC Shipments is falling by 5%
Mobile app development projects will outnumber PC projects by 4 to 1App Development
Smartphones # of Smartphones worldwide
Mobile Apps # of Apps downloaded per year
96.3 M
75%
-5%
4 x
1 Billion
200+ Billion
24
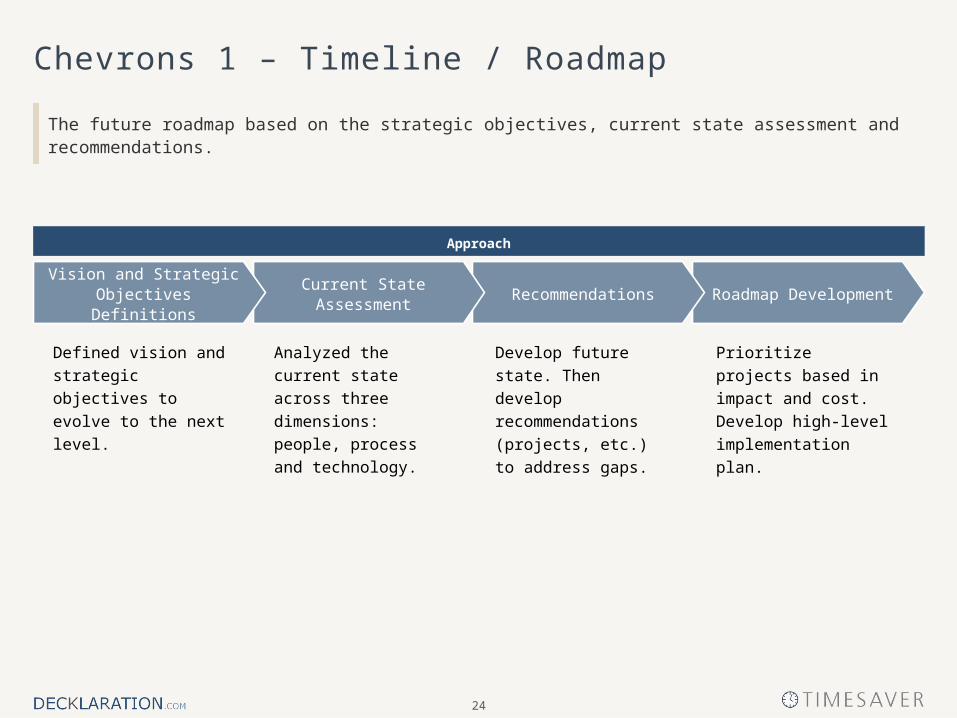
Chevrons 1 – Timeline / Roadmap
The future roadmap based on the strategic objectives, current state assessment and recommendations.
Develop future state.
Then develop
recommendations
(projects, etc.) to
address gaps.
Prioritize projects based
in impact and cost.
Develop high-level
implementation plan.
Defined vision and
strategic objectives to
evolve to the next level.
Analyzed the current
state across three
dimensions: people,
process and technology.
Roadmap DevelopmentRecommendationsCurrent State AssessmentVision and Strategic
Objectives Definitions
Approach
25
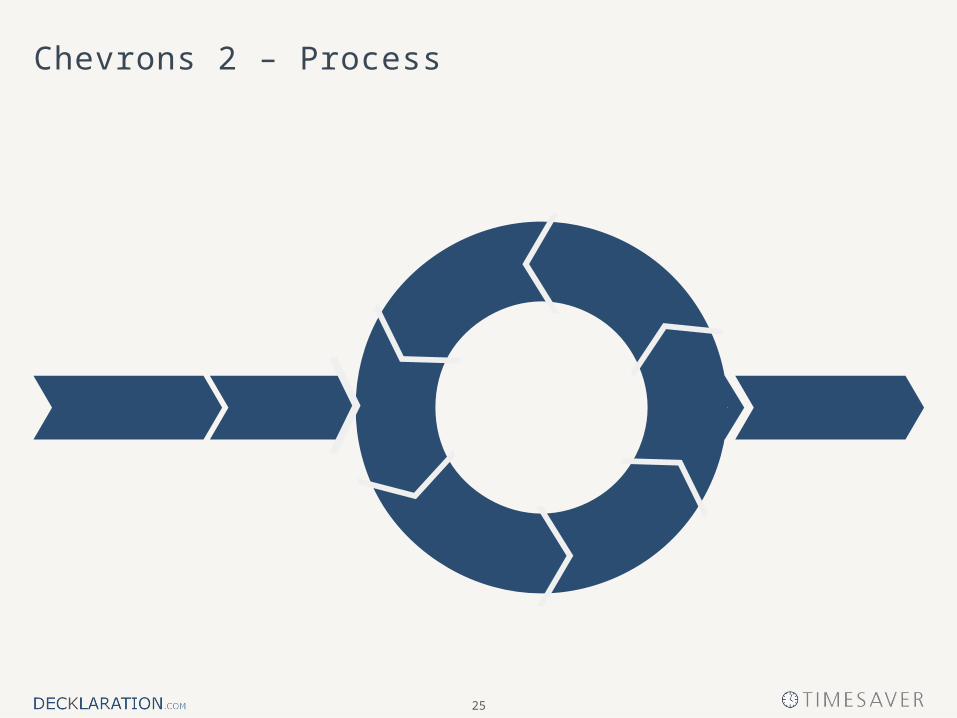
Chevrons 2 – Process
26
Chevrons 3 – Circular
Text
Text
Text
Text
Text
Text
TextText
Text
Text
Text
Text
Text
Text
Text
27
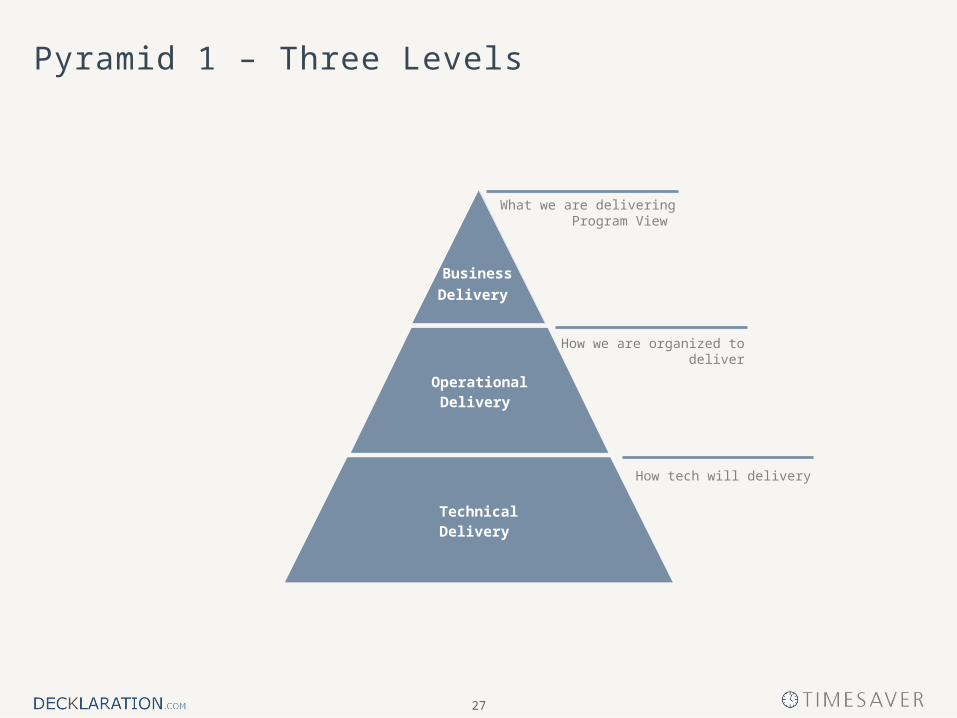
Pyramid 1 – Three Levels
How we are organized to deliver
What we are deliveringProgram View
How tech will delivery
Operational Delivery
Business
Delivery
Technical Delivery
28
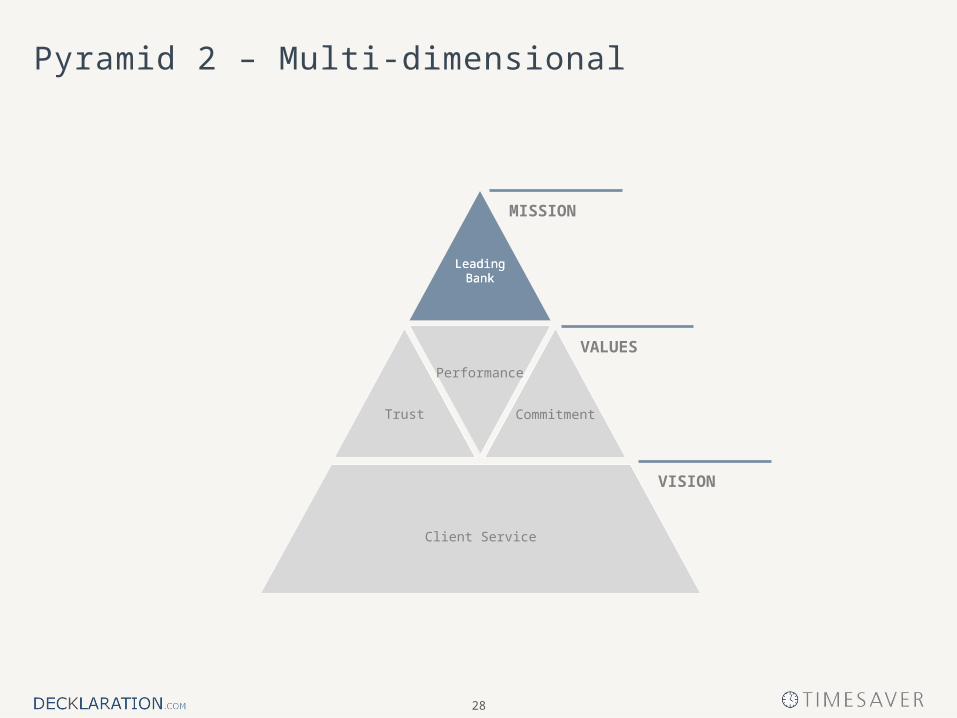
Trust Commitment
Leading Bank
Performance
Client Service
MISSION
VALUES
VISION
Leading Bank
Pyramid 2 – Multi-dimensional
29
Venn Diagrams
Text
Text Text
Text
Text Text
Text
Text Text
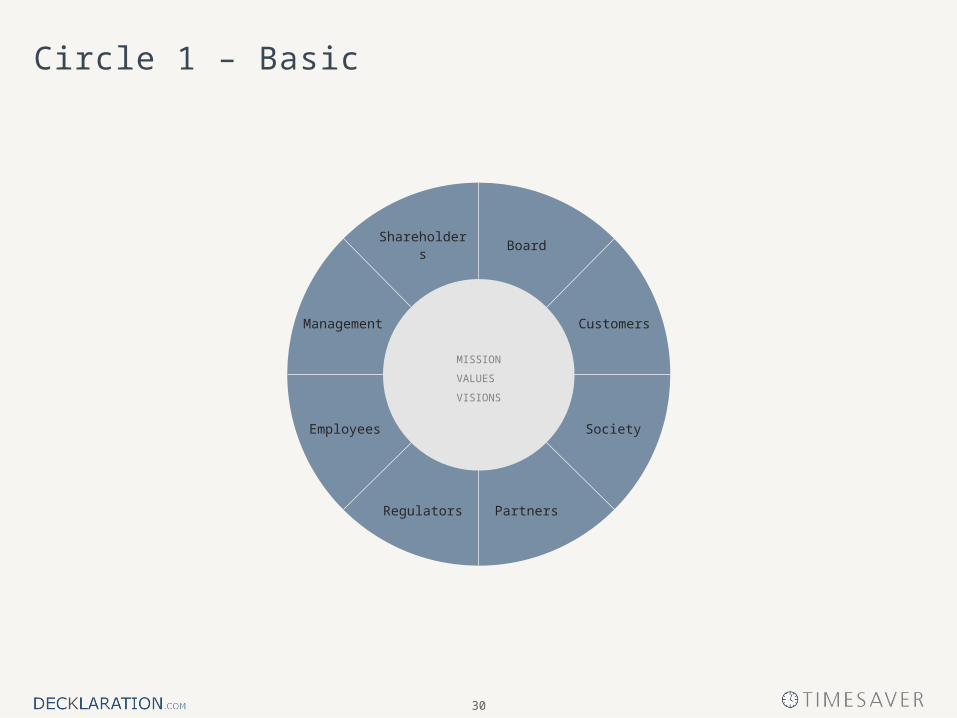
30
MISSION
VALUES
VISIONS
Shareholders Board
CustomersManagement
SocietyEmployees
PartnersRegulators
Circle 1 – Basic
31
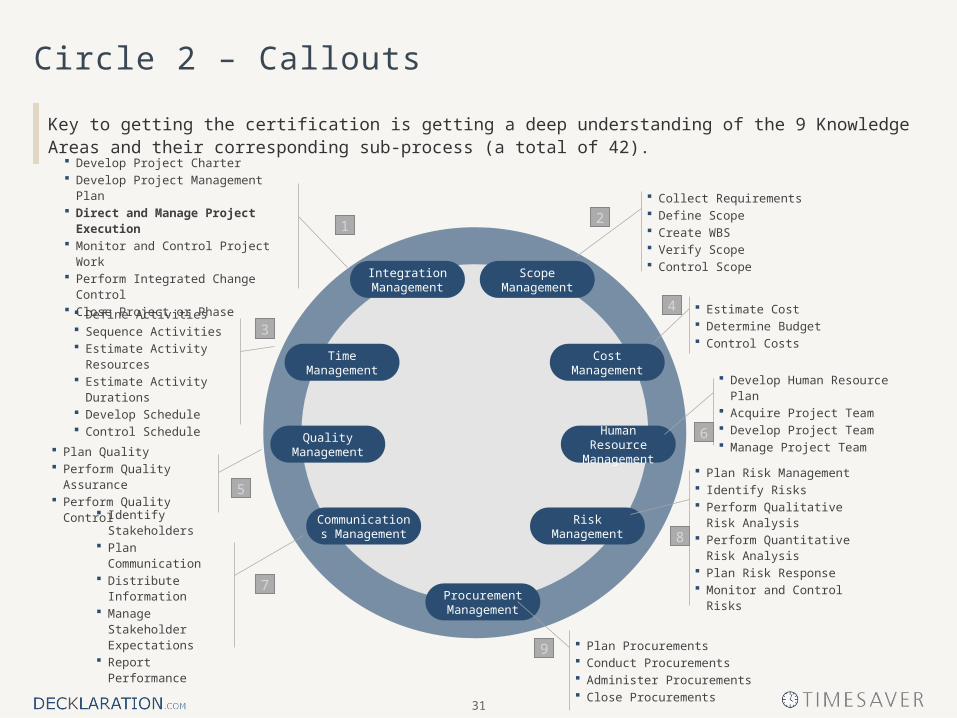
Circle 2 – Callouts
Key to getting the certification is getting a deep understanding of the 9 Knowledge Areas and their corresponding sub-process (a total of 42).
Time Management
Quality Management
Integration Management
Scope Management
Communications Management
Risk Management
Cost Management
Human Resource Management
Procurement Management
Collect Requirements Define Scope Create WBS Verify Scope Control Scope
Define Activities Sequence Activities Estimate Activity Resources Estimate Activity Durations Develop Schedule Control Schedule
Develop Project Charter Develop Project Management Plan Direct and Manage Project Execution Monitor and Control Project Work Perform Integrated Change Control Close Project or Phase
Estimate Cost Determine Budget Control Costs
Plan Quality Perform Quality Assurance Perform Quality Control
Develop Human Resource Plan Acquire Project Team Develop Project Team Manage Project Team
Identify Stakeholders Plan Communication Distribute Information Manage Stakeholder
Expectations Report Performance
Plan Risk Management Identify Risks Perform Qualitative Risk
Analysis Perform Quantitative Risk
Analysis Plan Risk Response Monitor and Control Risks
Plan Procurements Conduct Procurements Administer Procurements Close Procurements
3
5
2
4
1
6
8
7
9
32
Circle 3 – Orbit
X X
XX
X X X
33
Circle 4 – Cross-hair
Company Division
RegionProduct/Service
34
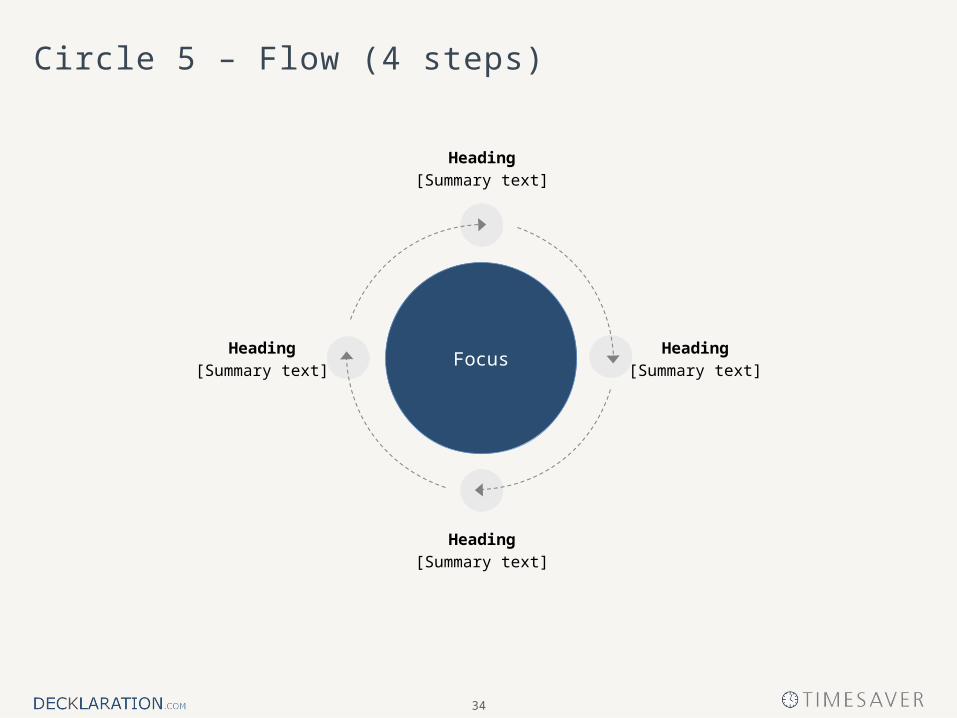
Circle 5 – Flow (4 steps)
FocusHeading
[Summary text]
Heading
[Summary text]
Heading
[Summary text]
Heading
[Summary text]
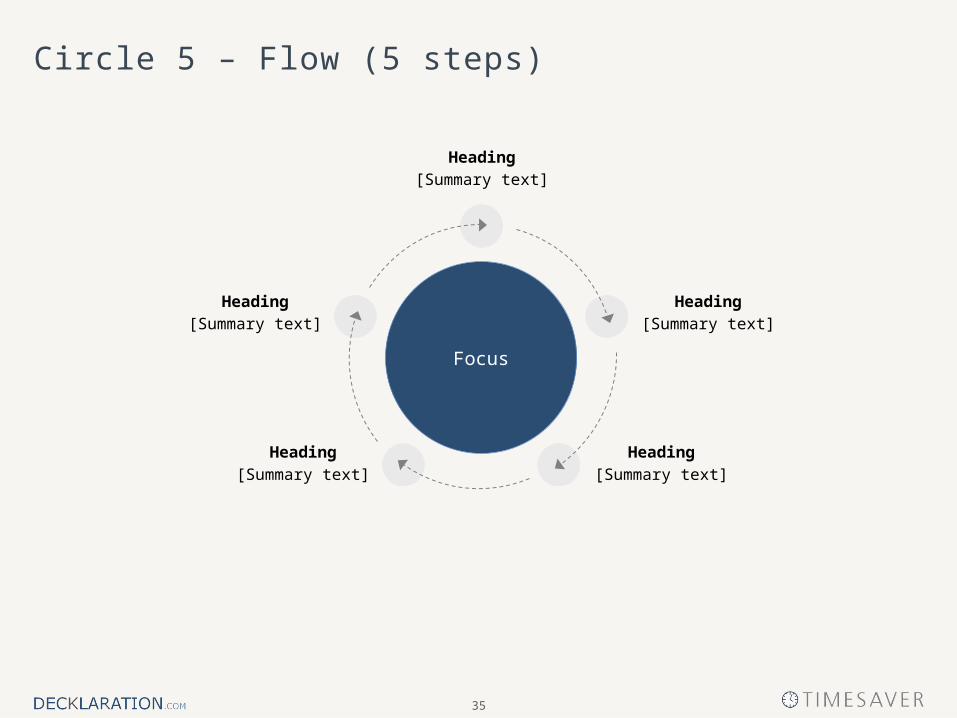
35
Circle 5 – Flow (5 steps)
Focus
Heading
[Summary text]
Heading
[Summary text]
Heading
[Summary text]
Heading
[Summary text]
Heading
[Summary text]
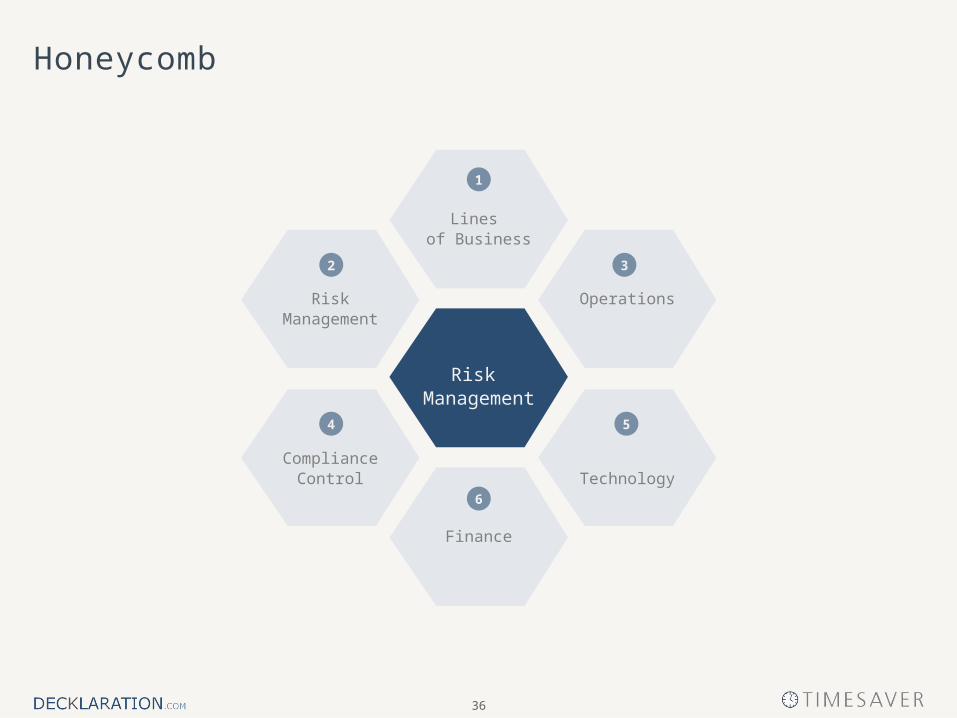
36
Honeycomb
RiskManagement
Lines of Business
Operations
ComplianceControl Technology
Finance
2
4
6
5
3
1
Risk Management
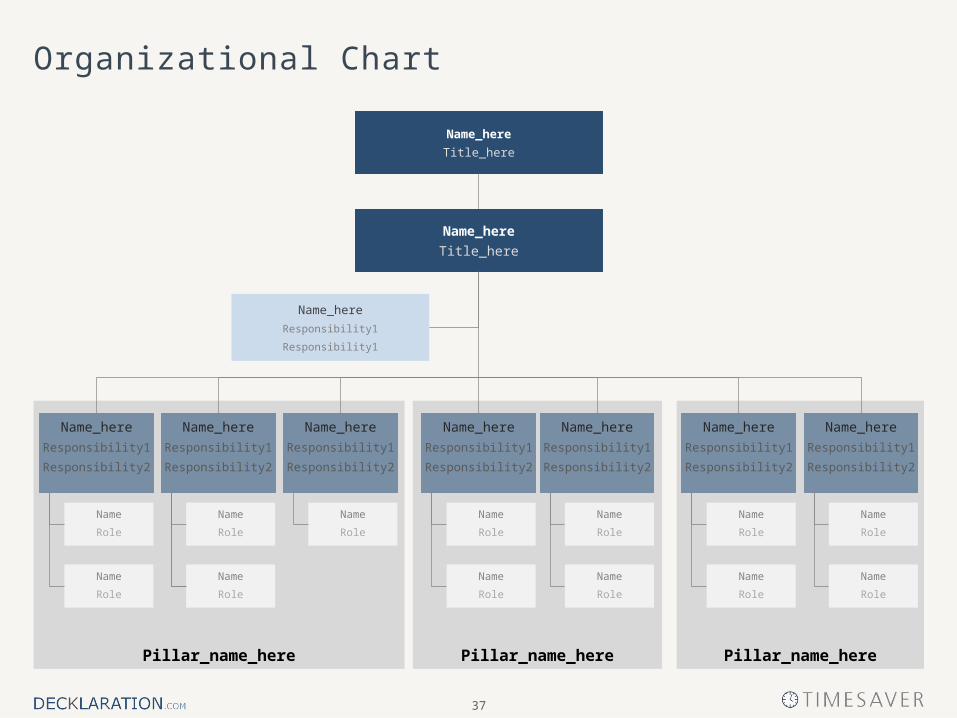
37
Organizational Chart
Pillar_name_here Pillar_name_here Pillar_name_here
Name_here
Title_here
Name_here
Responsibility1
Responsibility1
Name_here
Title_here
Name_here
Responsibility1
Responsibility2
Name_here
Responsibility1
Responsibility2
Name_here
Responsibility1
Responsibility2
Name_here
Responsibility1
Responsibility2
Name_here
Responsibility1
Responsibility2
Name_here
Responsibility1
Responsibility2
Name_here
Responsibility1
Responsibility2
Name
Role
Name
Role
Name
Role
Name
Role
Name
Role
Name
Role
Name
Role
Name
Role
Name
Role
Name
Role
Name
Role
Name
Role
Name
Role
38
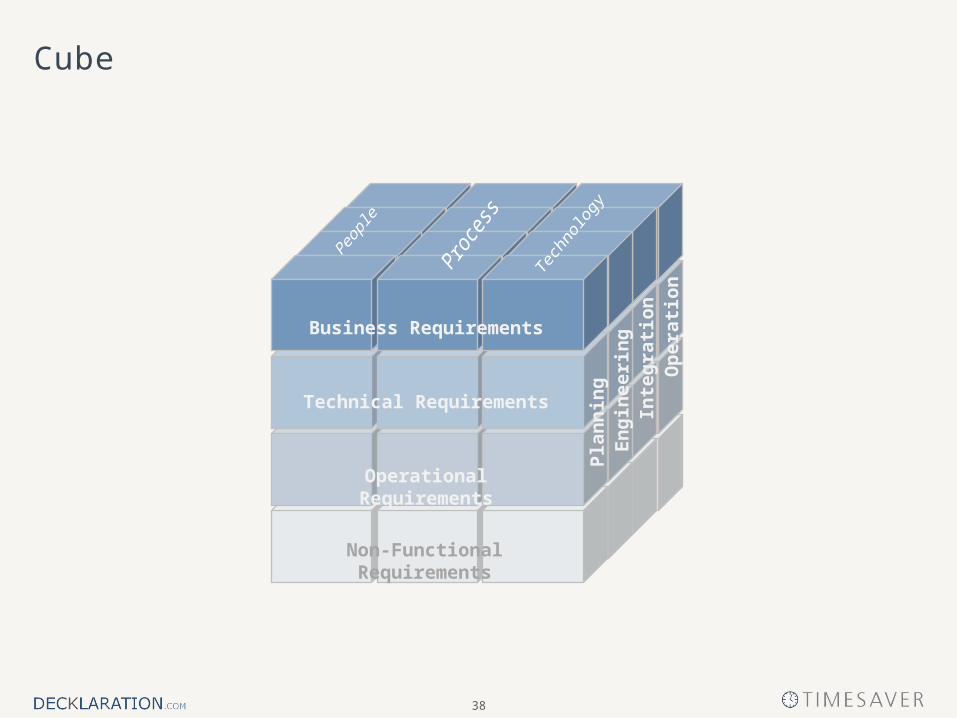
Cube
Business Requirements
Technical Requirements
Operational Requirements
Non-Functional Requirements
Op
erat
ion
Pla
nn
ing
En
gin
eeri
ng
Inte
gra
tio
n
IIntroduction
IIBasic Slides
IIIExecutive Summary Templates
IVModels and Objects
VProject Management Templates
VIFrameworks and Methodologies
VII7 Deck Rules
40
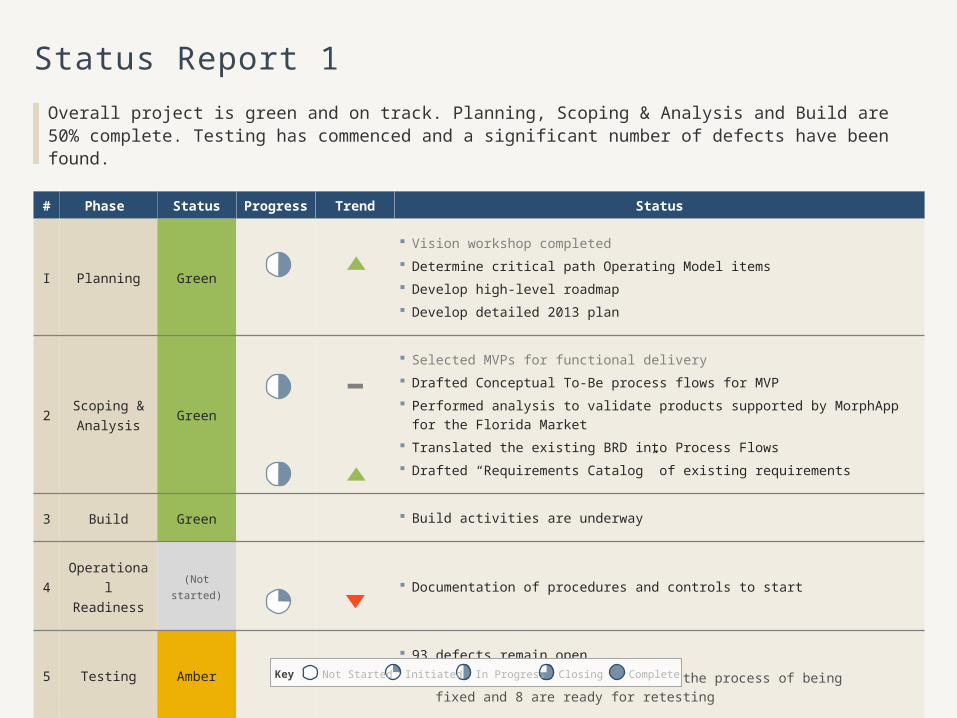
Status Report 1
Overall project is green and on track. Planning, Scoping & Analysis and Build are 50% complete. Testing has commenced and a significant number of defects have been found.
# Phase Status Progress Trend Status
I Planning Green
Vision workshop completed Determine critical path Operating Model items Develop high-level roadmap Develop detailed 2013 plan
2Scoping & Analysis
Green
Selected MVPs for functional delivery Drafted Conceptual To-Be process flows for MVP Performed analysis to validate products supported by MorphApp for the Florida Market Translated the existing BRD into Process Flows Drafted “Requirements Catalog” of existing requirements
3 Build Green Build activities are underway
4Operational Readiness
(Not started) Documentation of procedures and controls to start
5 Testing Amber
93 defects remain open- 45 are under review, 41 are in the process of being
fixed and 8 are ready for retesting
Key CompleteNot Started Initiated ClosingIn Progress
41
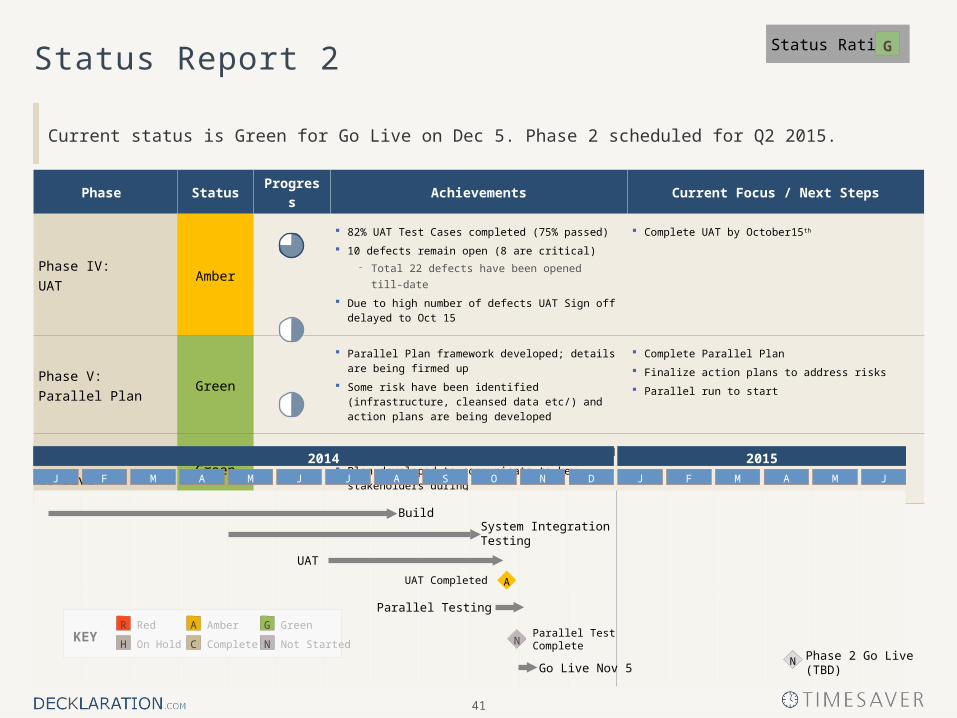
Status Report 2
Current status is Green for Go Live on Dec 5. Phase 2 scheduled for Q2 2015.
Phase Status Progress Achievements Current Focus / Next Steps
Phase IV: UAT
Amber
82% UAT Test Cases completed (75% passed) 10 defects remain open (8 are critical)
- Total 22 defects have been opened till-date Due to high number of defects UAT Sign off delayed to
Oct 15
Complete UAT by October15th
Phase V: Parallel Plan
Green
Parallel Plan framework developed; details are being firmed up
Some risk have been identified (infrastructure, cleansed data etc/) and action plans are being developed
Complete Parallel Plan Finalize action plans to address risks Parallel run to start
Phase VI:Go Live
Green Go-Live and Migration plan being developed Plan developed to communicate to key stakeholders
during
Complete Go-Live and Migration plan
Status Rating G
2015
A O DNSJ JMF M AJ JMF M AJ
2014
Go Live Nov 5
Parallel Test Complete
Build
System Integration Testing
UAT
UAT Completed
Parallel Testing
Phase 2 Go Live (TBD)
N
A
KEYGreenAmber GA
Not StartedOn Hold Complete NC
RedR
H
N
42
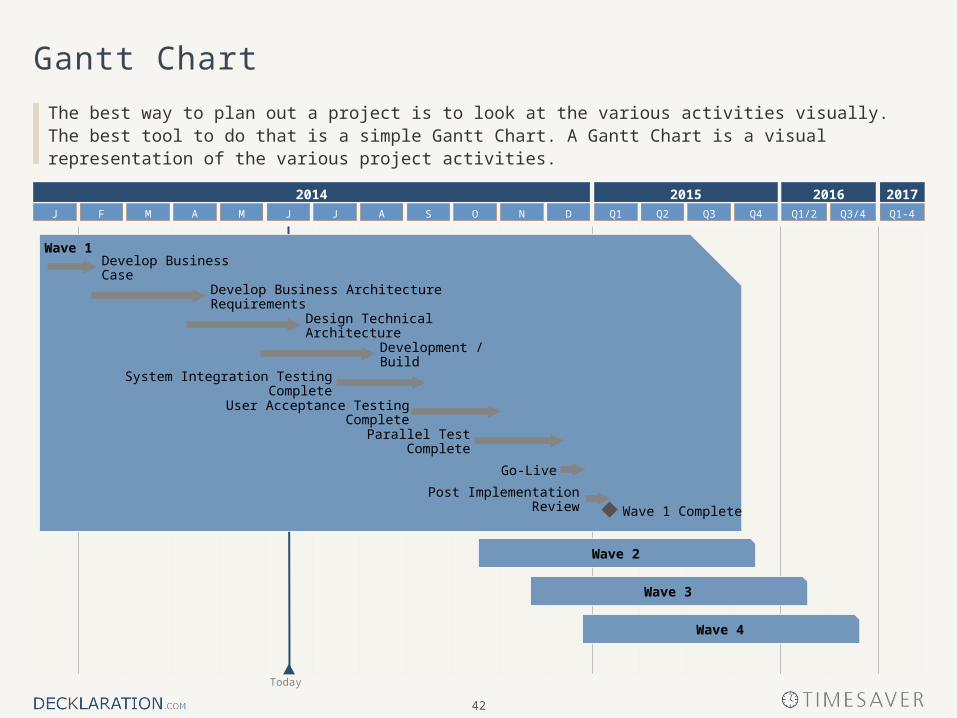
Gantt Chart
The best way to plan out a project is to look at the various activities visually. The best tool to do that is a simple Gantt Chart. A Gantt Chart is a visual representation of the various project activities.
Q2 Q3 Q4Q1J J AM O DNSF M AJ Q1-4Q1/2 Q3/4
Today
Wave 1
Develop Business Case
Develop Business Architecture Requirements
Development / Build
Design Technical Architecture
User Acceptance Testing Complete
Go-Live
System Integration Testing Complete
Parallel Test Complete
Post Implementation Review
Wave 3
Wave 4
Wave 2
Wave 1 Complete
2014 2015 2016 2017
43
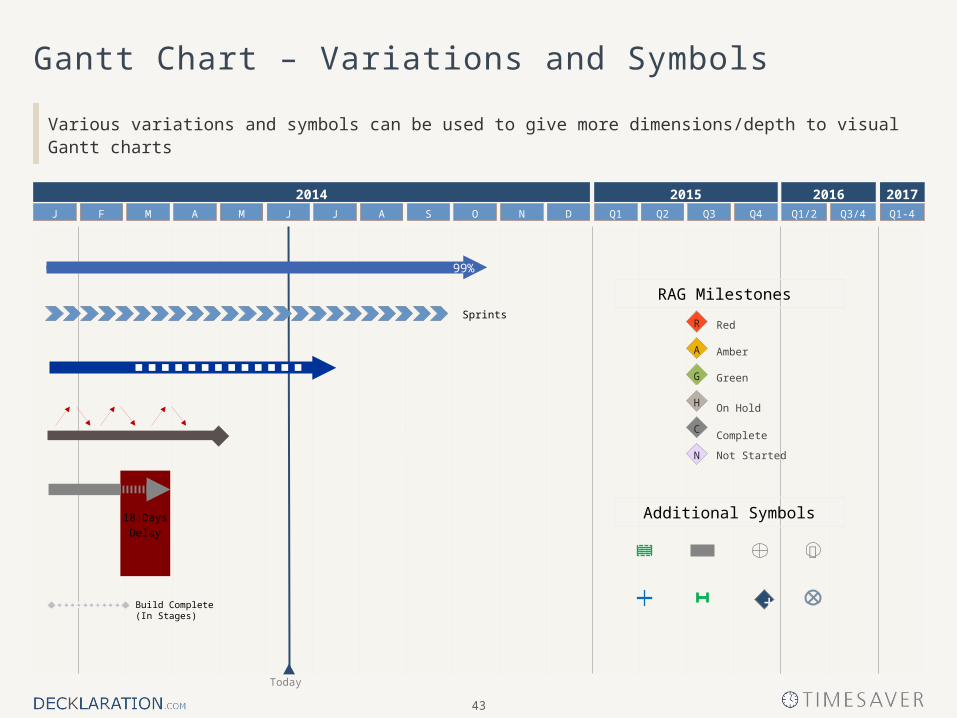
Gantt Chart – Variations and Symbols
Various variations and symbols can be used to give more dimensions/depth to visual Gantt charts
2014 2015 2016 2017Q2 Q3 Q4Q1J J AM O DNSF M AJ Q1-4Q1/2 Q3/4
Today
G
R
A
H
C
N
Sprints
99%
Green
Amber
Not Started
On Hold
Red
Complete
Build Complete (In Stages)
18 Days
Delay
Additional Symbols
+
RAG Milestones
44
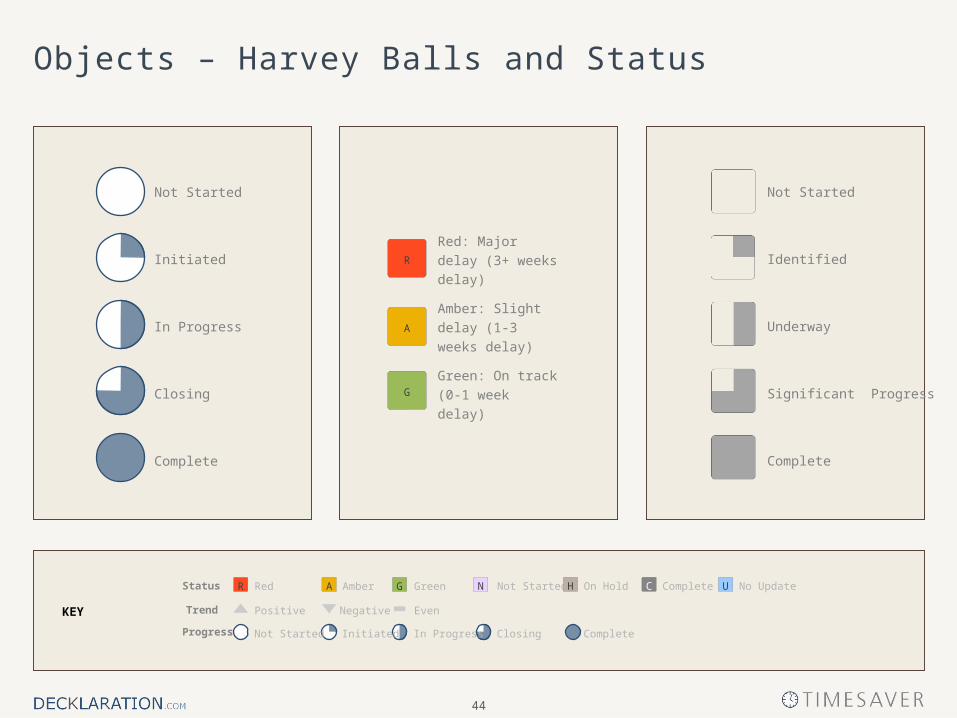
Objects – Harvey Balls and Status
KEY
Red: Major delay
(3+ weeks delay)
Amber: Slight delay
(1-3 weeks delay)
Green: On track (0-1
week delay)G
R
A
Complete
Significant Progress
Not Started
Identified
Underway
Complete
Closing
Not Started
Initiated
In Progress
Even
Progress
Negative
GreenStatus Amber GR A No UpdateNot Started On Hold UN H
Positive
Red
Trend
CompleteNot Started Initiated ClosingIn Progress
CompleteC
45
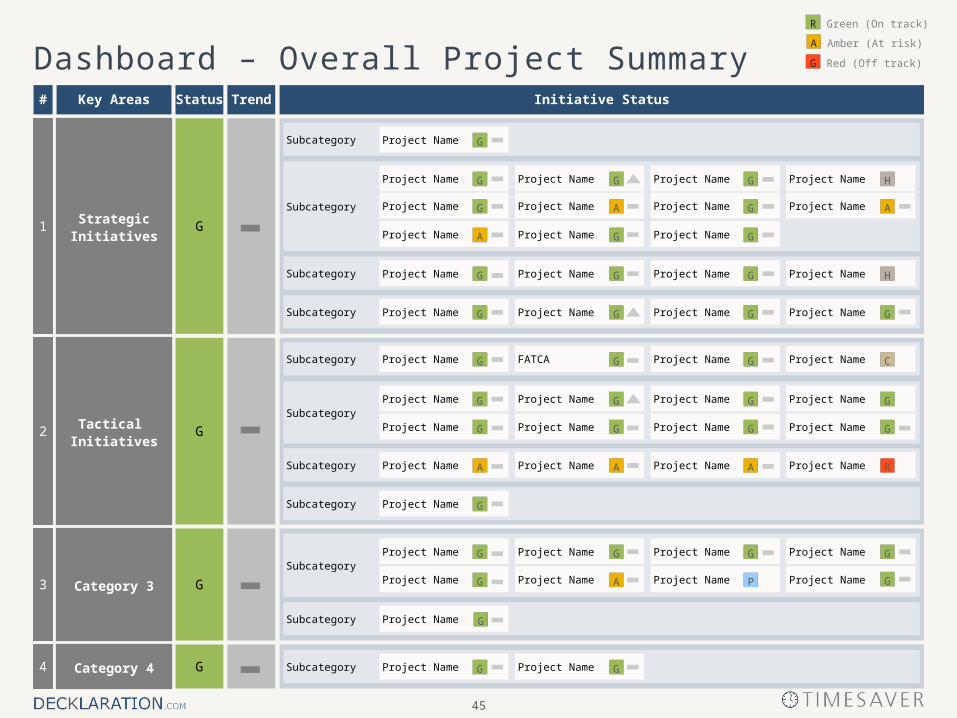
Dashboard – Overall Project SummaryStatus Trend# Key Areas
GStrategic Initiatives
1
GCategory 44
GCategory 33
GTactical Initiatives
2
Initiative Status
Subcategory
Subcategory
Subcategory
Subcategory
Subcategory
Subcategory
Subcategory
Subcategory
Subcategory
Subcategory
Subcategory
Project Name Project Name GG
Project Name G
Project Name Project Name Project Name Project NameG GG H
Project Name
Project Name
Project Name
Project Name
Project Name
Project Name
Project Name
Project NameA
G
G
G
AG
A
G
Project Name Project Name Project NameProject NameGG G
Project Name Project Name Project NameA AA
Project Name FATCA Project Name
Project Name G
Project Name
Project Name Project Name
Project Name R
G
Project Name Project Name
G
G
Project NameG G Project Name G
Project Name
Project Name Project Name
Project Name
Project Name
Project Name
Project Name
Project NameA
G
P
G
GG
G
Project Name G
G
CG
Project Name Project Name GGG G
G
Project Name Project Name Project NameG G H
Amber (At risk)
R
A
Red (Off track)
Green (On track)
G
46
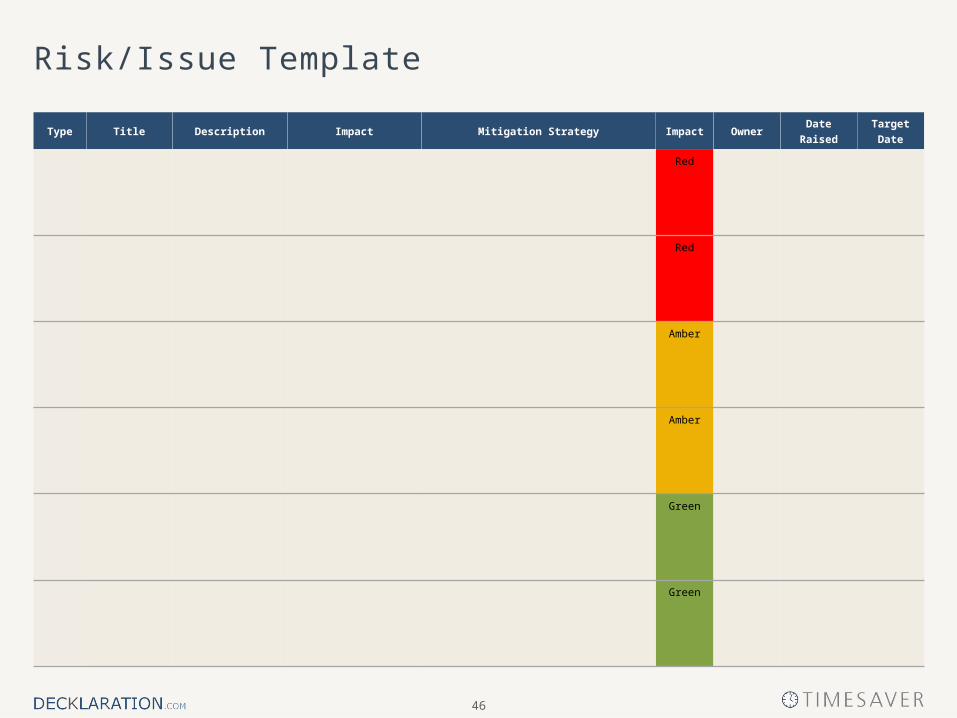
Risk/Issue Template
Type Title Description Impact Mitigation Strategy Impact Owner Date RaisedTarget Date
Red
Red
Amber
Amber
Green
Green
47
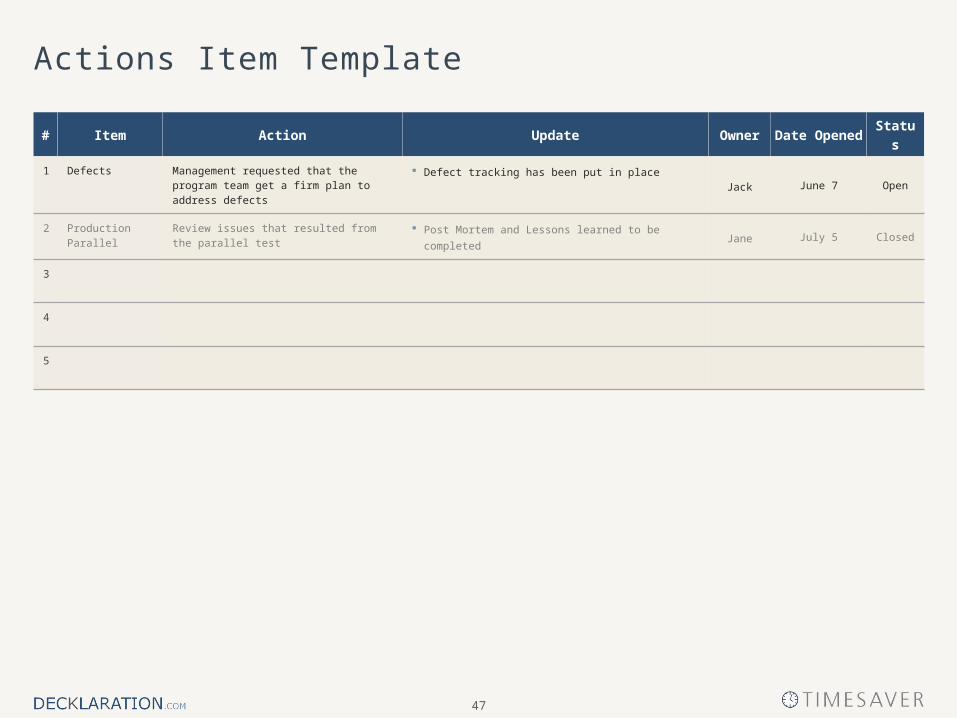
Actions Item Template
# Item Action Update Owner Date Opened Status
1 Defects Management requested that the program team get a firm plan to address defects
Defect tracking has been put in placeJack June 7 Open
2 Production Parallel
Review issues that resulted from the parallel test
Post Mortem and Lessons learned to be completedJane July 5 Closed
3
4
5
48
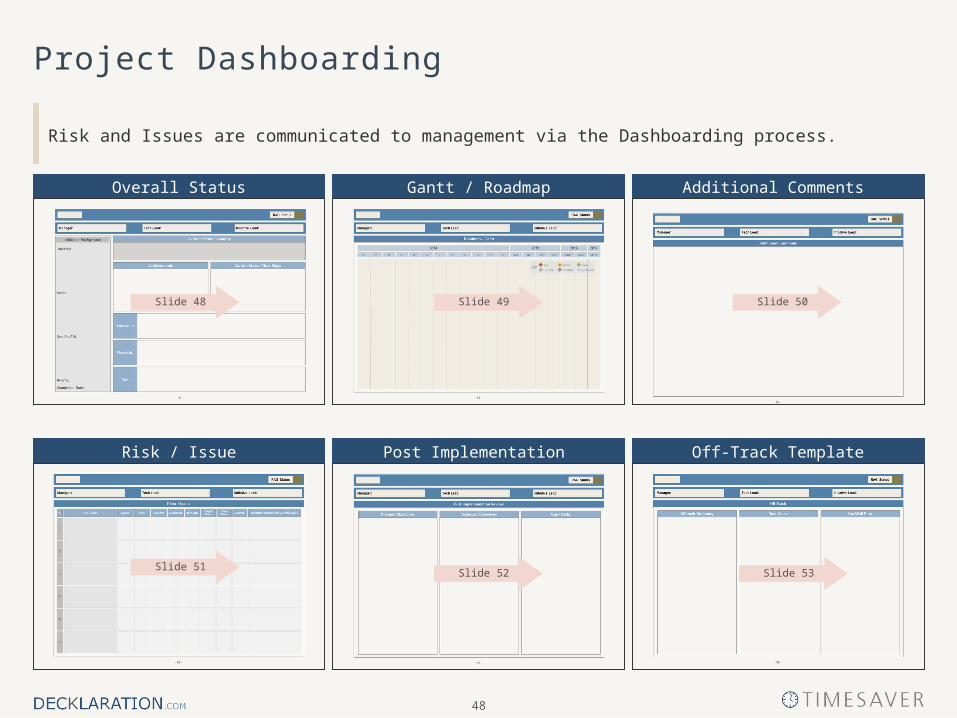
Risk and Issues are communicated to management via the Dashboarding process.
Off-Track TemplateRisk / Issue
Additional Comments Overall Status Gantt / Roadmap
Slide 53Slide 51
Slide 48 Slide 49
Post Implementation
Slide 50
Slide 52
Project Dashboarding
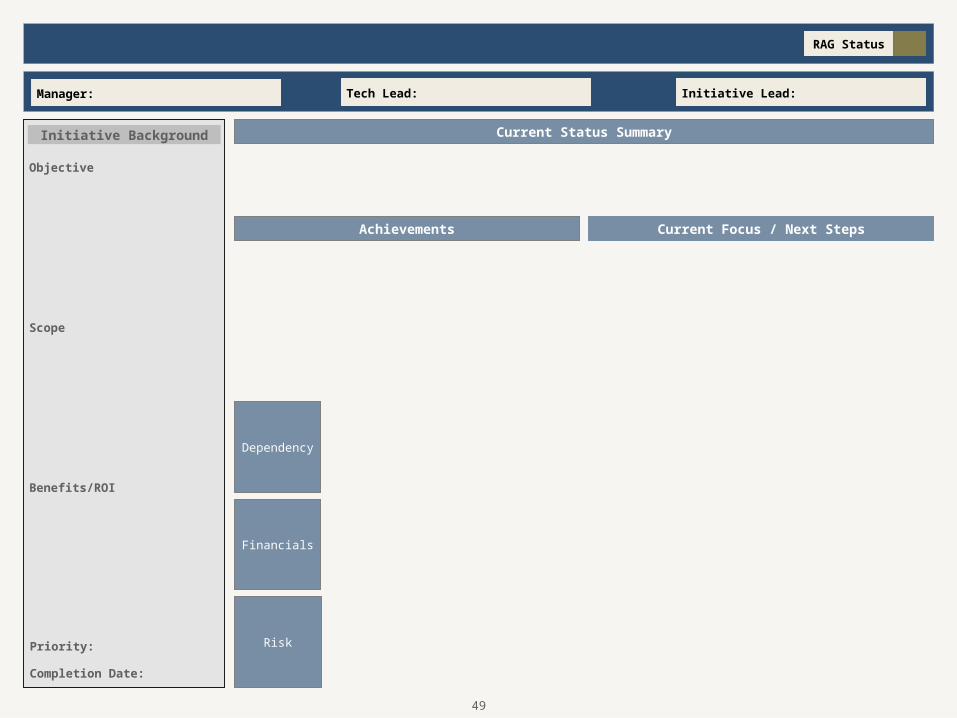
RAG Status
Achievements Current Focus / Next Steps
Tech Lead:Manager: Initiative Lead:
Scope
Current Status SummaryInitiative Background
Completion Date:
Objective
Benefits/ROI
Priority:
Financials
Risk
Dependency
49
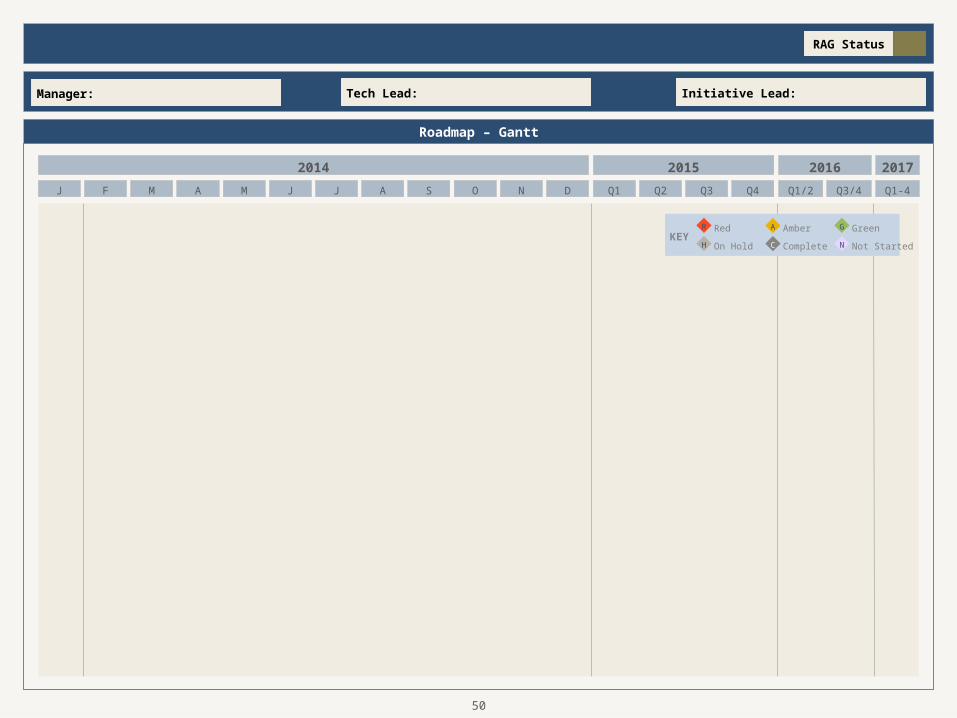
2014 2015 2016 2017
Q2 Q3 Q4Q1J J AM O DNSF M AJ Q1-4Q1/2 Q3/4
Roadmap – Gantt
RAG Status
Tech Lead:Manager: Initiative Lead:
KEYGreenAmber GR A
Not StartedOn Hold Complete NH C
Red
50
Additional Comments
RAG Status
Tech Lead:Manager: Initiative Lead:
51
Risks / Issues
1
3
Severity# Risk / Issue Mitigation Strategy and Current StatusOpen DateTarget Date
Owner Likelihood
2
4
6
5
RAG Status
Tech Lead:Manager: Initiative Lead:
TypeClose Date
Change
52

RAG Status
Tech Lead:Manager: Initiative Lead:
Planned Objectives Gap / DeltaAchieved Objectives
Post Implementation Review
53
RAG Status
Tech Lead:Manager: Initiative Lead:
Off-track Summary Get Well PlanRoot Cause
Off Track
54
IIntroduction
IIBasic Slides
IIIExecutive Summary Templates
IVModels and Objects
VProject Management Templates
VIFrameworks and Methodologies
VII7 Deck Rules
- 56 -
Slides
presented in
this section are
in no particular order …
57
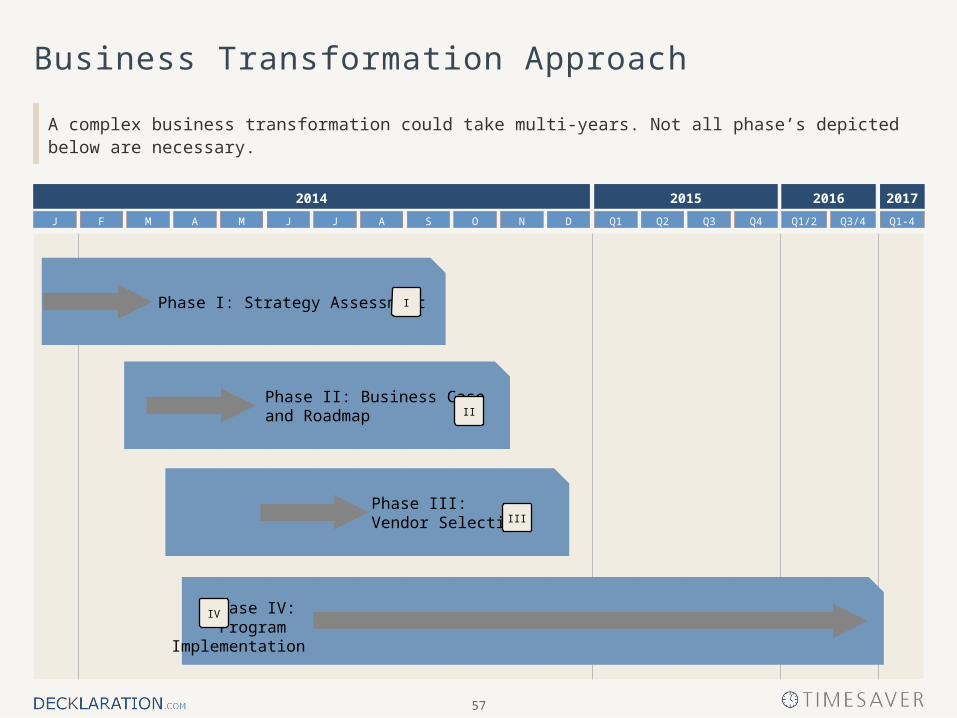
Business Transformation Approach
A complex business transformation could take multi-years. Not all phase’s depicted below are necessary.
2014 2015 2016 2017
Q2 Q3 Q4Q1J J AM O DNSF M AJ Q1-4Q1/2 Q3/4
Phase I: Strategy Assessment
Phase II: Business Case and Roadmap
Phase III: Vendor Selection
Phase IV: Program
Implementation
I
II
III
IV
58
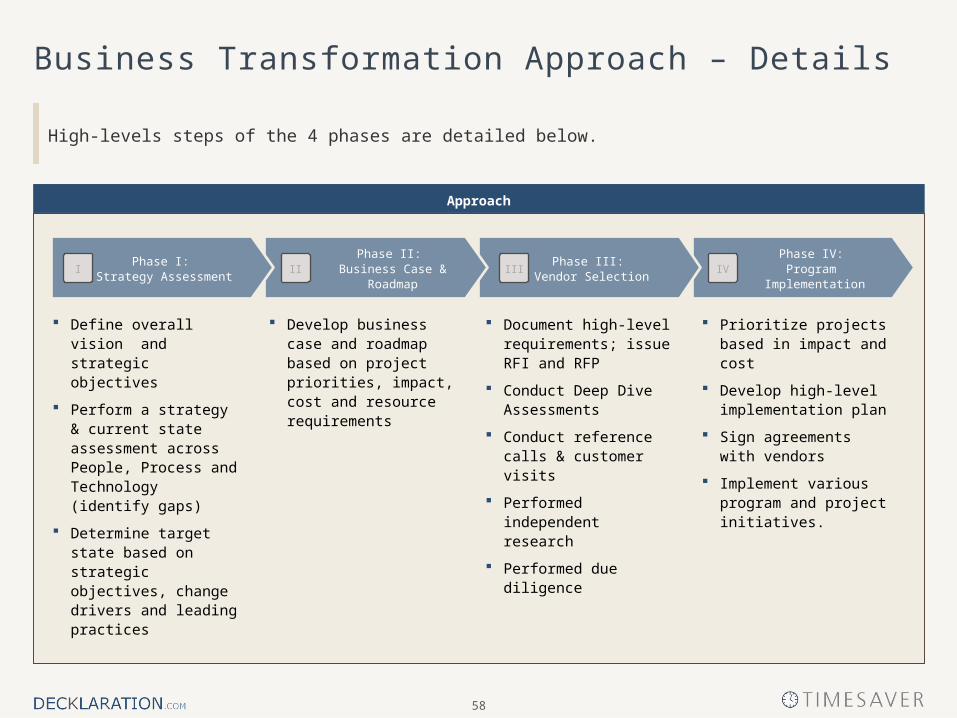
Business Transformation Approach – Details
High-levels steps of the 4 phases are detailed below.
Document high-level requirements; issue RFI and RFP
Conduct Deep Dive Assessments
Conduct reference calls & customer visits
Performed independent research
Performed due diligence
Prioritize projects based in impact and cost
Develop high-level implementation plan
Sign agreements with vendors
Implement various program and project initiatives.
Define overall vision and strategic objectives
Perform a strategy & current state assessment across People, Process and Technology (identify gaps)
Determine target state based on strategic objectives, change drivers and leading practices
Develop business case and roadmap based on project priorities, impact, cost and resource requirements
Phase IV: Program Implementation
Phase III: Vendor Selection
Phase II: Business Case & Roadmap
Phase I: Strategy Assessment
Approach
I II III IV
59
Approach
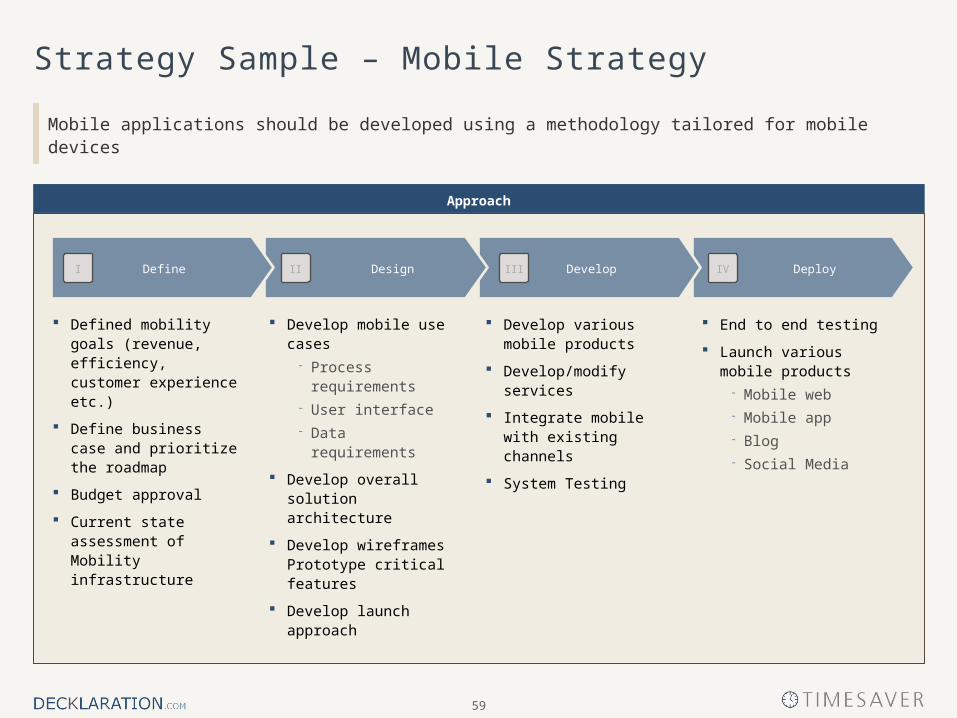
Strategy Sample – Mobile Strategy
Mobile applications should be developed using a methodology tailored for mobile devices
Develop various mobile products
Develop/modify services
Integrate mobile with existing channels
System Testing
End to end testing
Launch various mobile products
- Mobile web- Mobile app- Blog- Social Media
Defined mobility goals (revenue, efficiency, customer experience etc.)
Define business case and prioritize the roadmap
Budget approval
Current state assessment of Mobility infrastructure
Develop mobile use cases
- Process requirements- User interface- Data requirements
Develop overall solution architecture
Develop wireframes Prototype critical features
Develop launch approach
DeployDevelopDesignDefineI II III IV
60
Program Office Vision
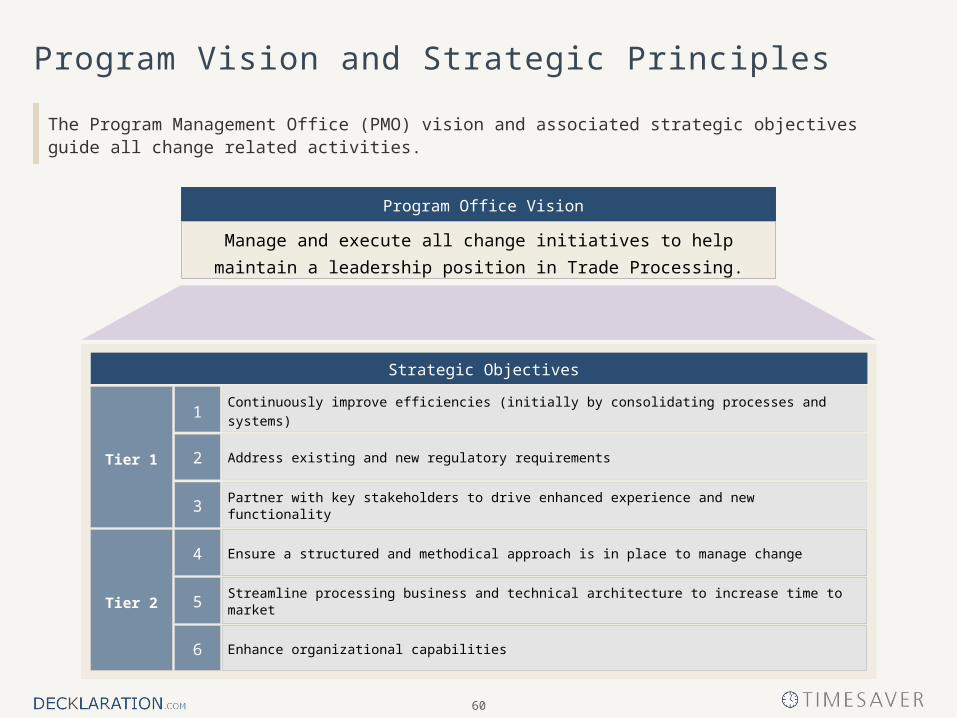
Program Vision and Strategic Principles
The Program Management Office (PMO) vision and associated strategic objectives guide all change related activities.
Manage and execute all change initiatives to help maintain a
leadership position in Trade Processing.
Strategic Objectives
Tier 1
Tier 2
2
1
3
Continuously improve efficiencies (initially by consolidating processes and systems)
Address existing and new regulatory requirements
Partner with key stakeholders to drive enhanced experience and new functionality
6
4
5
Enhance organizational capabilities
Ensure a structured and methodical approach is in place to manage change
Streamline processing business and technical architecture to increase time to market
61
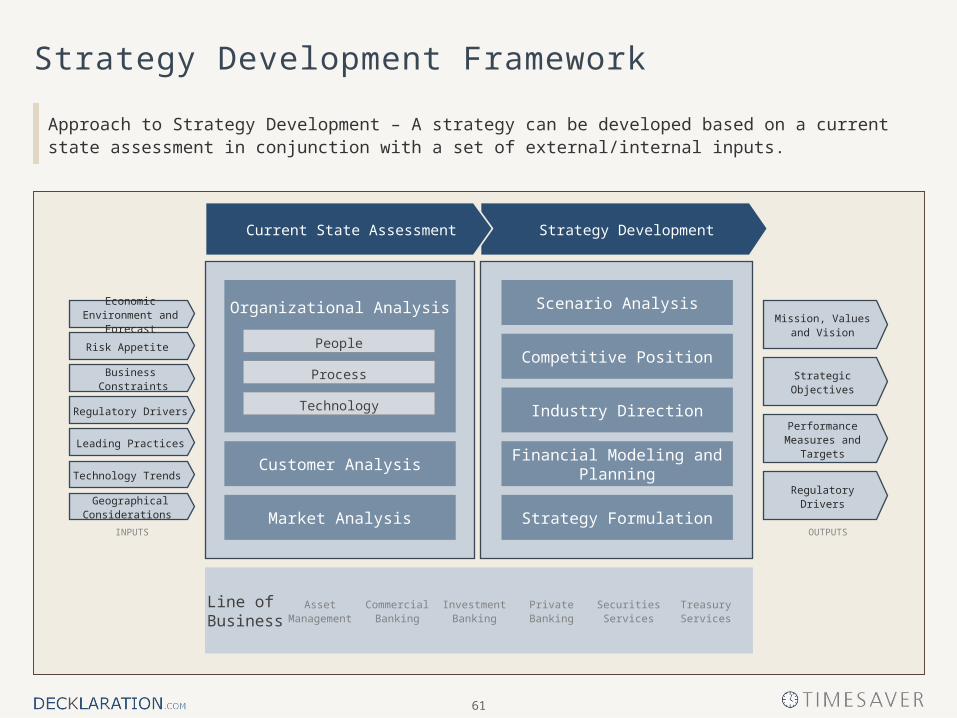
Strategy Development Framework
Approach to Strategy Development – A strategy can be developed based on a current state assessment in conjunction with a set of external/internal inputs.
Strategy DevelopmentCurrent State Assessment
Risk Appetite
Business Constraints
Regulatory Drivers
Leading Practices
Technology Trends
Economic Environment and Forecast
Geographical Considerations
Mission, Values and Vision
Strategic Objectives
Performance Measures and Targets
Regulatory Drivers
Competitive Position
Scenario Analysis
Industry Direction
Financial Modeling and Planning
Strategy Formulation
Customer Analysis
Market Analysis
Organizational Analysis
Process
People
Technology
Line of Business
Securities Services
Treasury Services
Asset Management
Commercial Banking
Investment Banking
Private Banking
OUTPUTSINPUTS
62
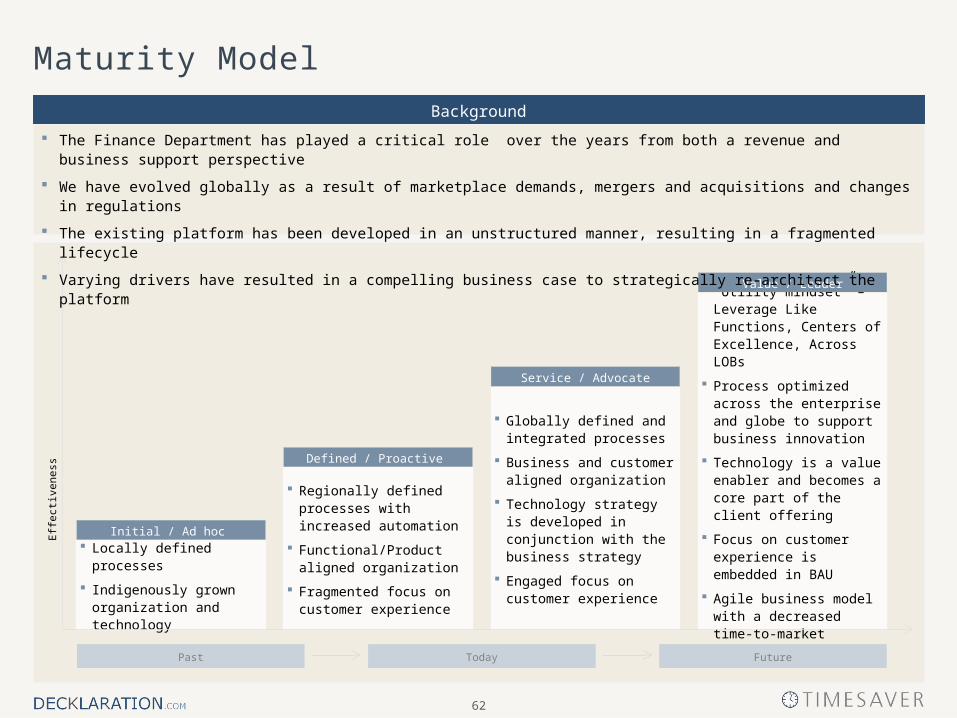
Background
Regionally defined processes with increased automation
Functional/Product aligned organization
Fragmented focus on customer experience
Defined / Proactive
Globally defined and integrated processes
Business and customer aligned organization
Technology strategy is developed in conjunction with the business strategy
Engaged focus on customer experience
Service / Advocate
Locally defined processes
Indigenously grown organization and technology
Initial / Ad hoc
“Utility mindset” – Leverage Like Functions, Centers of Excellence, Across LOBs
Process optimized across the enterprise and globe to support business innovation
Technology is a value enabler and becomes a core part of the client offering
Focus on customer experience is embedded in BAU
Agile business model with a decreased time-to-market
Value / Leader
Effe
ctiv
enes
s
FutureTodayPast
The Finance Department has played a critical role over the years from both a revenue and business support perspective
We have evolved globally as a result of marketplace demands, mergers and acquisitions and changes in regulations
The existing platform has been developed in an unstructured manner, resulting in a fragmented lifecycle
Varying drivers have resulted in a compelling business case to strategically re-architect the platform
Maturity Model
63
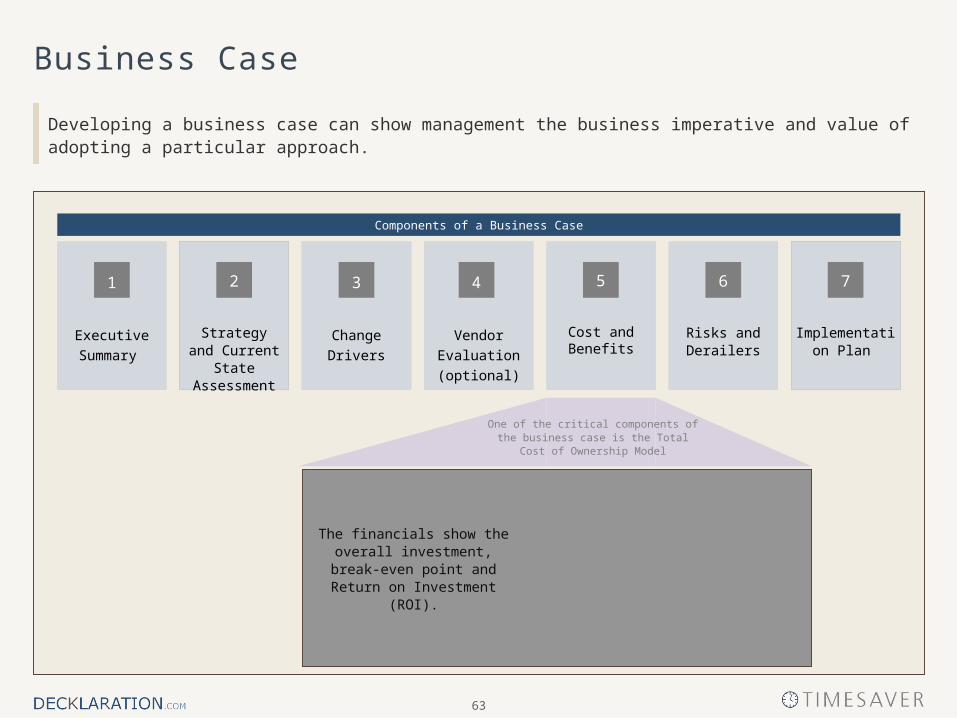
Business Case
Developing a business case can show management the business imperative and value of adopting a particular approach.
Components of a Business Case
Risks and Derailers
Vendor
Evaluation
(optional)
Strategy and Current State Assessment
Executive
Summary
Implementation Plan
Change Drivers Cost and Benefits
The financials show the overall investment, break-even point
and Return on Investment (ROI).
1 42 3 5 6 7
One of the critical components of the business case is the Total Cost of
Ownership Model
64
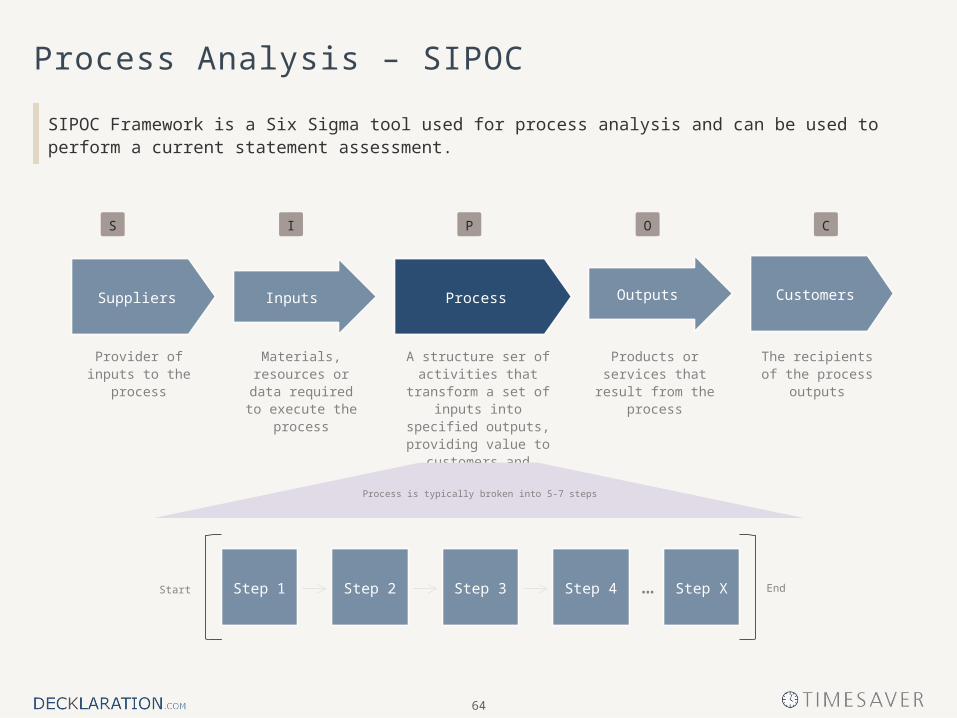
ProcessInputs
Process Analysis – SIPOC
SIPOC Framework is a Six Sigma tool used for process analysis and can be used to perform a current statement assessment.
Suppliers
S P CI O
Outputs Customers
Materials, resources or data required to
execute the process
A structure ser of activities that transform a set of inputs into specified outputs, providing value
to customers and stakeholders
Products or services that result from the
process
The recipients of the process outputs
Provider of inputs to the process
EndStep 2 Step 3 Step 4 …Step 1 Step XStart
Process is typically broken into 5-7 steps
65
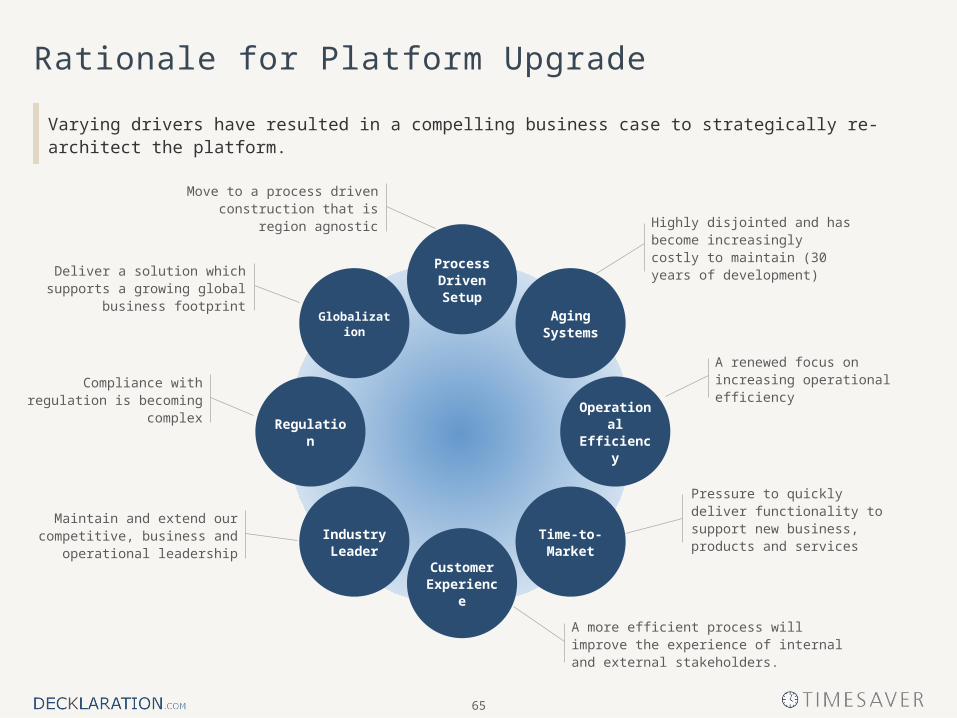
Rationale for Platform Upgrade
Varying drivers have resulted in a compelling business case to strategically re-architect the platform.
Aging Systems
Customer Experience
Time-to-Market
Operational Efficiency
Regulation
Industry Leader
A more efficient process will improve the experience of internal and external stakeholders.
Maintain and extend our competitive, business and
operational leadership
A renewed focus on increasing operational efficiency
Pressure to quickly deliver functionality to support new business, products and services
Compliance with regulation is becoming complex
Deliver a solution which supports a growing global business footprint
Globalization
Highly disjointed and has become increasingly costly to maintain (30 years of development)Process
Driven Setup
Move to a process driven construction that is region agnostic
66
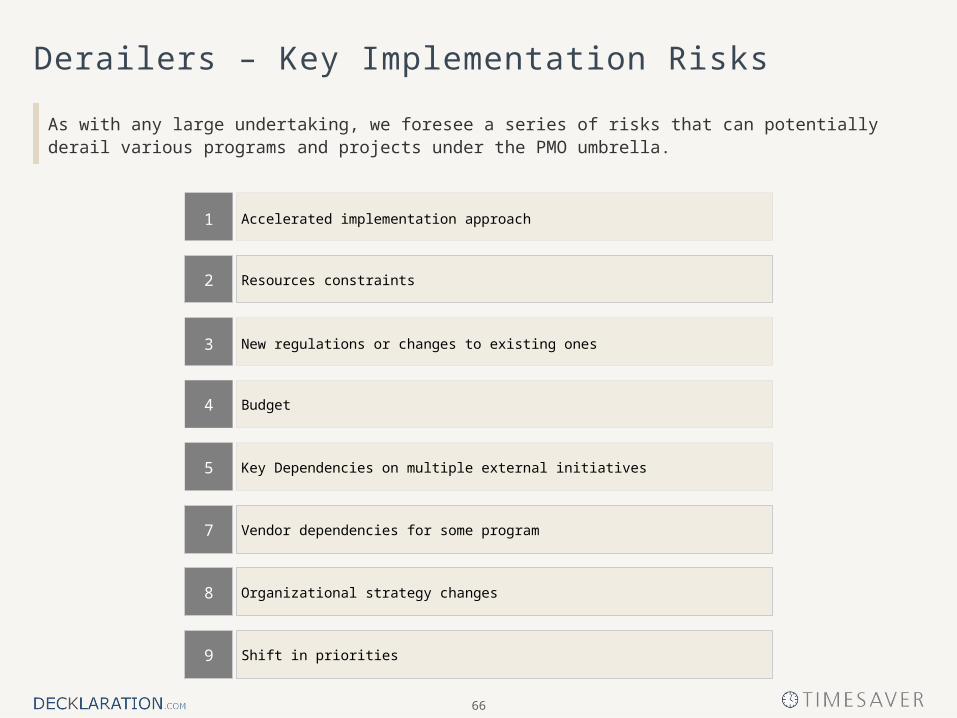
Derailers – Key Implementation Risks
As with any large undertaking, we foresee a series of risks that can potentially derail various programs and projects under the PMO umbrella.
4
1
5
Accelerated implementation approach
Budget
Key Dependencies on multiple external initiatives
8 Organizational strategy changes
3 New regulations or changes to existing ones
2 Resources constraints
9 Shift in priorities
7 Vendor dependencies for some program
67
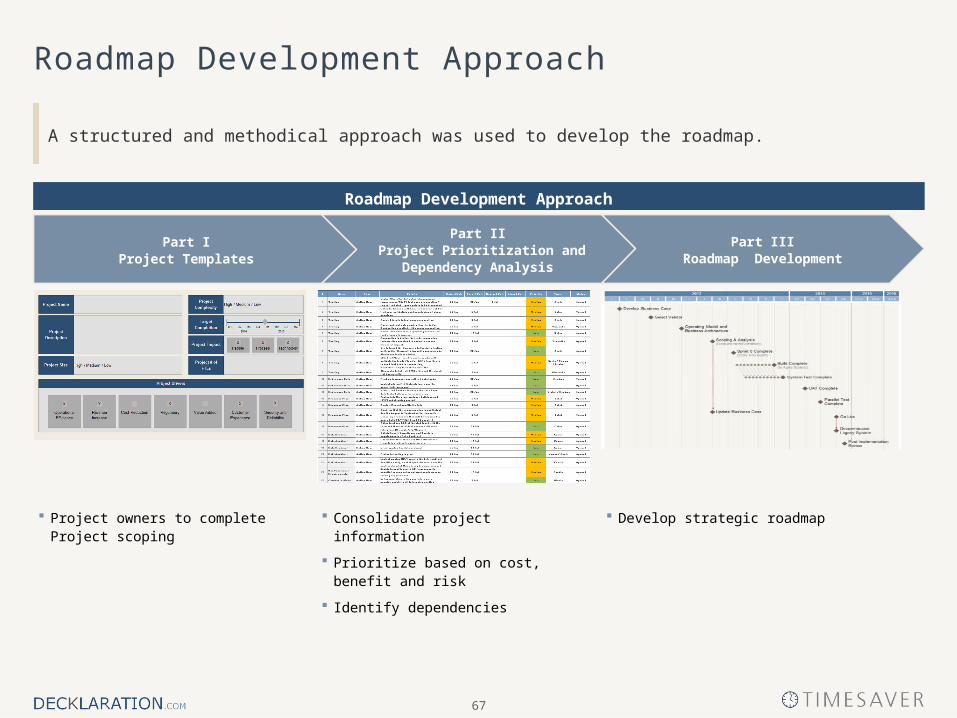
Roadmap Development Approach
A structured and methodical approach was used to develop the roadmap.
Roadmap Development Approach
Part II Project Prioritization and
Dependency Analysis
Part IProject Templates
Project owners to complete Project scoping
Consolidate project information
Prioritize based on cost, benefit and risk
Identify dependencies
Develop strategic roadmap
Part IIIRoadmap Development
68
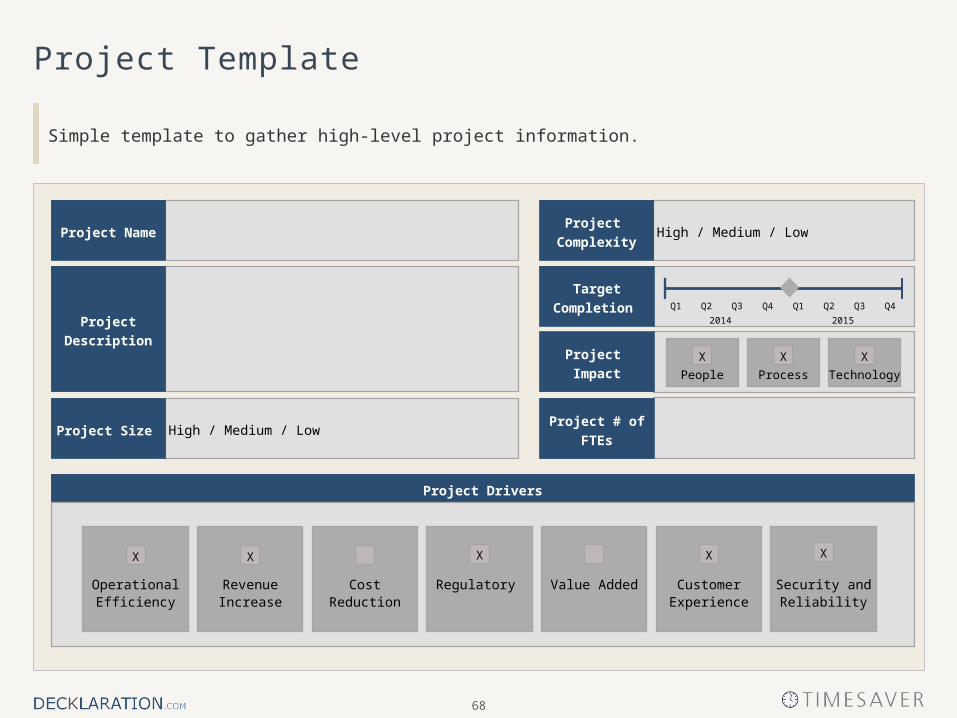
Project
Description
High / Medium / LowProject Size
Project Name
Project Template
Simple template to gather high-level project information.
High / Medium / Low
Project # of
FTEs
Project Impact
Target
Completion
Project
Complexity
Q3 Q4Q1Q3 Q4Q1
20152014
Q2Q2
TechnologyPeople
X
Process
X X
Project Drivers
Cost ReductionOperational Efficiency
Revenue Increase
Regulatory Value Added
X X X
Security and Reliability
X
Customer Experience
X
69
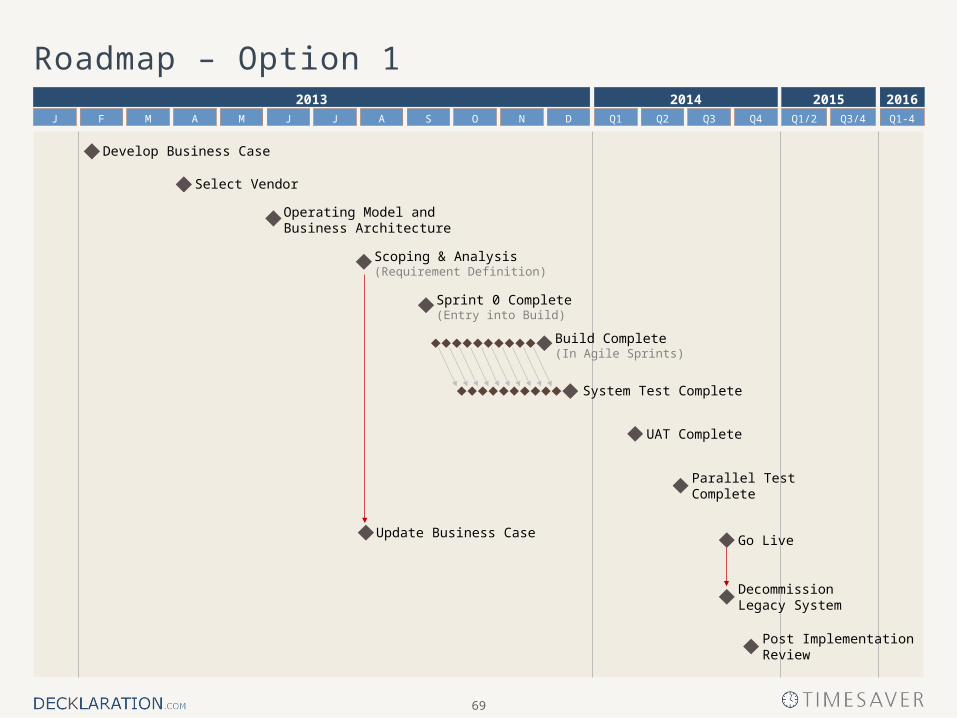
Roadmap – Option 1 2013 2014 2015 2016
Q2 Q3 Q4Q1J J AM O DNSF M AJ Q1-4Q1/2 Q3/4
Develop Business Case
Select Vendor
Operating Model and Business Architecture
Sprint 0 Complete (Entry into Build)
Update Business Case
System Test Complete
Parallel TestComplete
Decommission Legacy System
Post Implementation Review
Build Complete (In Agile Sprints)
UAT Complete
Go Live
Scoping & Analysis (Requirement Definition)
70
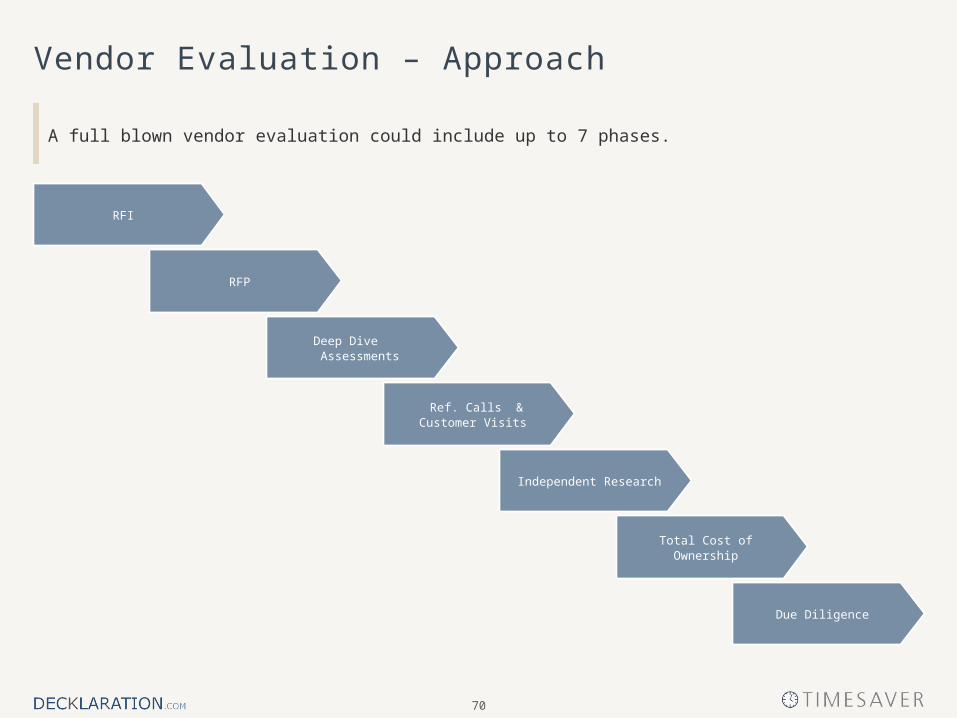
Vendor Evaluation – Approach
A full blown vendor evaluation could include up to 7 phases.
Due Diligence
Total Cost of Ownership
Independent Research
Ref. Calls & Customer Visits
Deep Dive Assessments
RFI
RFP
71
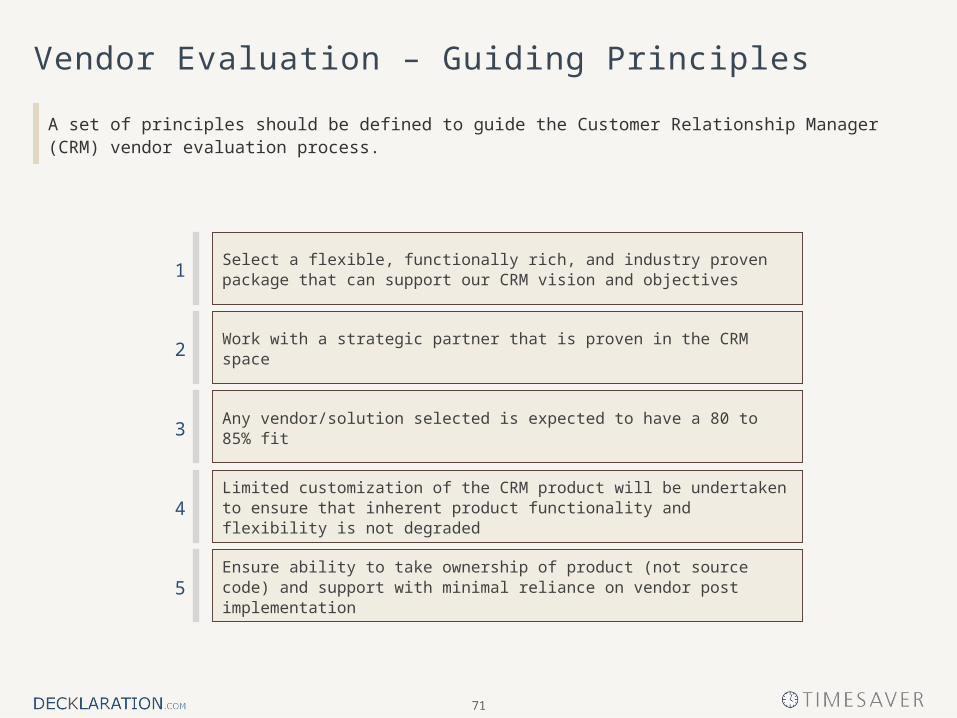
Vendor Evaluation – Guiding Principles
A set of principles should be defined to guide the Customer Relationship Manager (CRM) vendor evaluation process.
Select a flexible, functionally rich, and industry proven package that can support our CRM vision and objectives
Work with a strategic partner that is proven in the CRM space
Any vendor/solution selected is expected to have a 80 to 85% fit
Limited customization of the CRM product will be undertaken to ensure that inherent product functionality and flexibility is not degraded
Ensure ability to take ownership of product (not source code) and support with minimal reliance on vendor post implementation
1
3
5
2
4
72
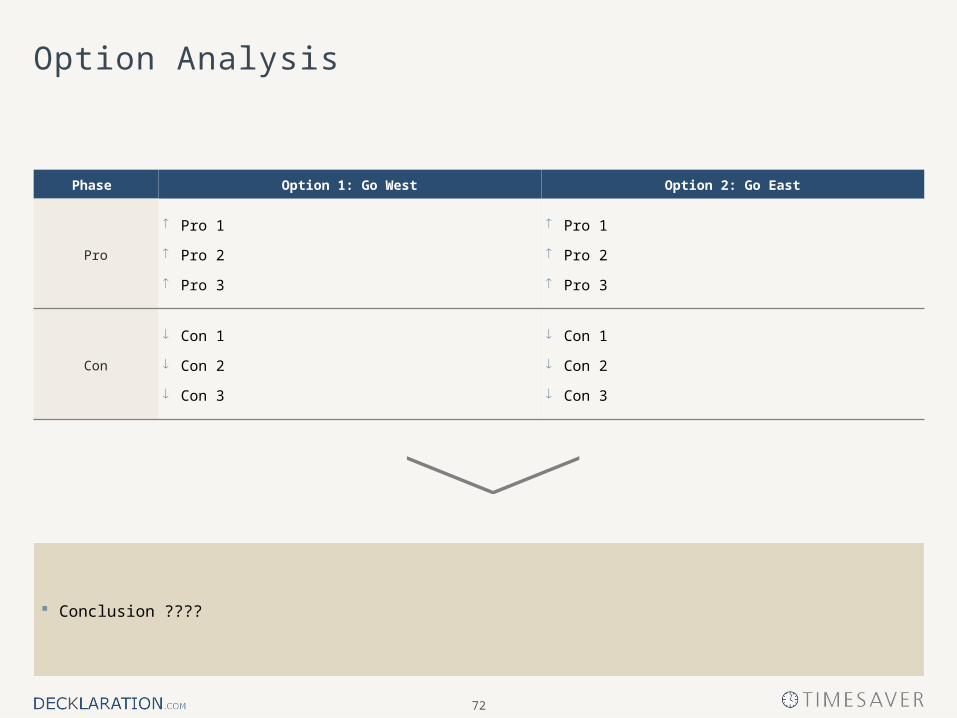
Option Analysis
Phase Option 1: Go West Option 2: Go East
Pro
Pro 1
Pro 2
Pro 3
Pro 1
Pro 2
Pro 3
Con
Con 1
Con 2
Con 3
Con 1
Con 2
Con 3
Conclusion ????
73
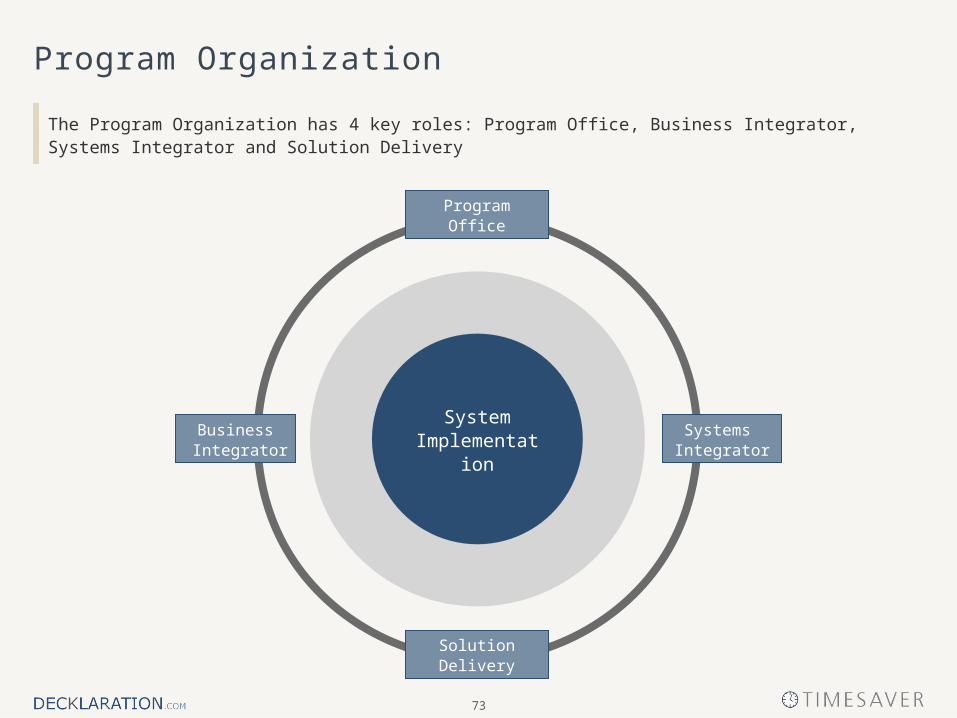
Program Organization
The Program Organization has 4 key roles: Program Office, Business Integrator, Systems Integrator and Solution Delivery
System Implementation
Systems Integrator
Business Integrator
Solution Delivery
ProgramOffice
74
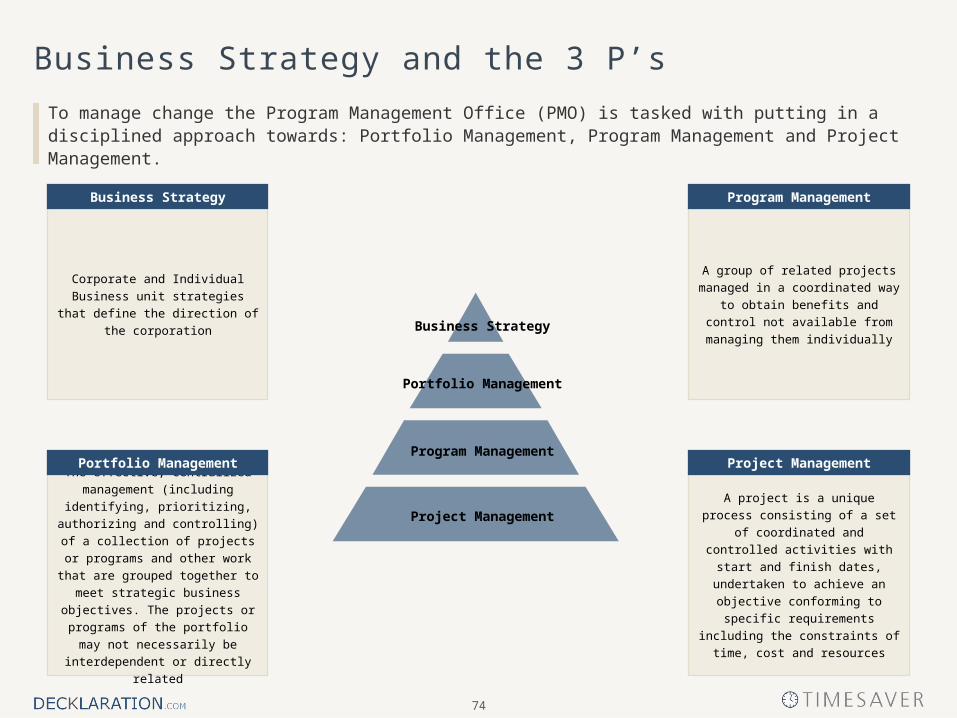
Business Strategy and the 3 P’s
To manage change the Program Management Office (PMO) is tasked with putting in a disciplined approach towards: Portfolio Management, Program Management and Project Management.
A group of related projects managed
in a coordinated way to obtain
benefits and control not available
from managing them individually
Program Management
A project is a unique process
consisting of a set of coordinated and
controlled activities with start and
finish dates, undertaken to achieve
an objective conforming to specific
requirements including the
constraints of time, cost and
resources
Project Management
Corporate and Individual Business
unit strategies that define the
direction of the corporation
Business Strategy
The effective, centralized
management (including identifying,
prioritizing, authorizing and
controlling) of a collection of projects
or programs and other work that are
grouped together to meet strategic
business objectives. The projects or
programs of the portfolio may not
necessarily be interdependent or
directly related
Portfolio Management
Business Strategy
Portfolio Management
Program Management
Project Management
75
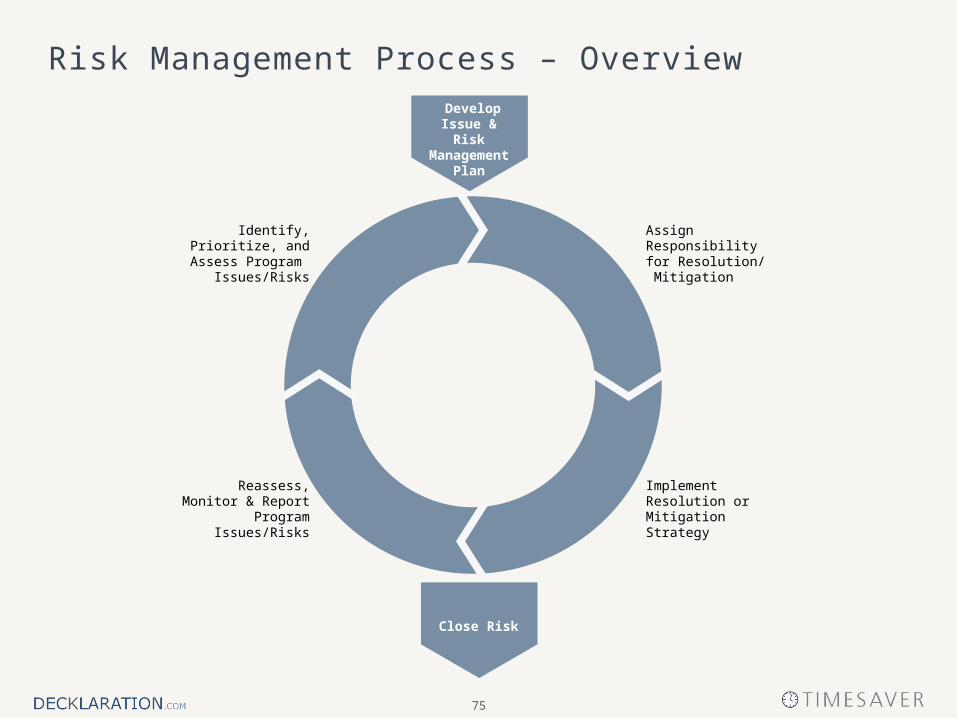
Risk Management Process – Overview
Identify, Prioritize, and Assess Program
Issues/Risks
Assign Responsibility for Resolution/ Mitigation
Implement Resolution or Mitigation Strategy
Reassess, Monitor & Report Program
Issues/Risks
Develop Issue & Risk Management
Plan
Close Risk
76
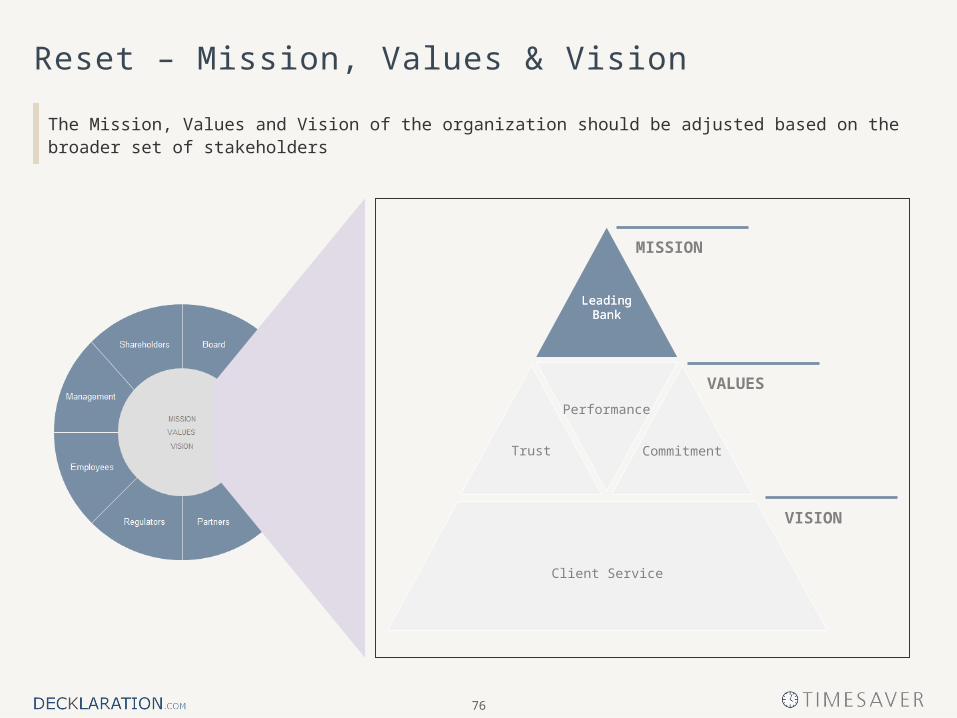
Reset – Mission, Values & Vision
The Mission, Values and Vision of the organization should be adjusted based on the broader set of stakeholders
Trust Commitment
Leading Bank
Performance
Client Service
MISSION
VALUES
VISION
Leading Bank
77
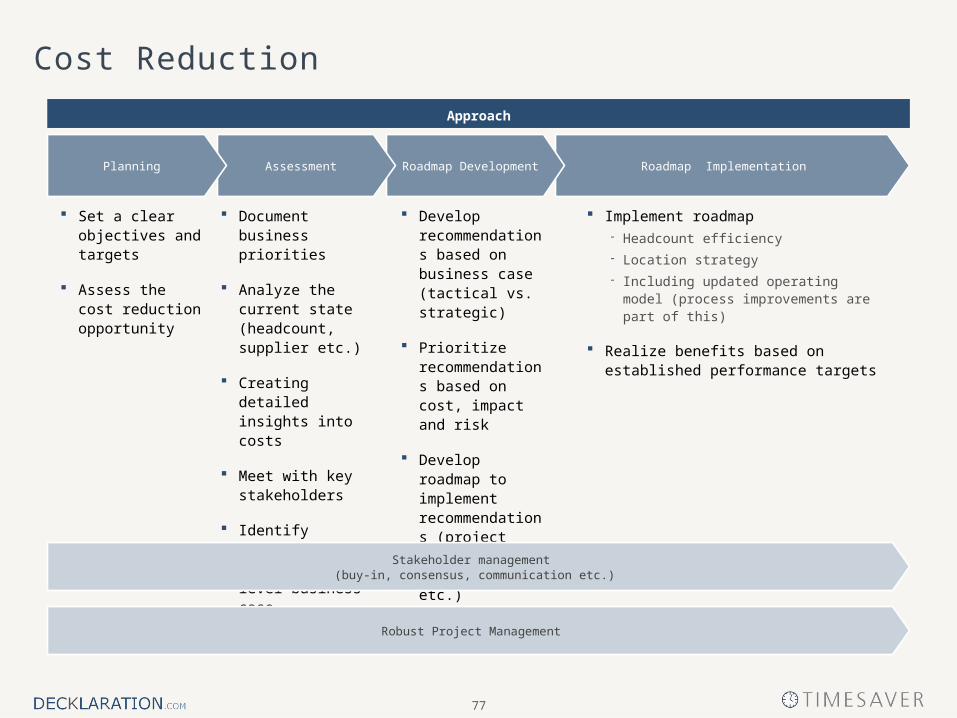
Cost Reduction
Implement roadmap- Headcount efficiency
- Location strategy
- Including updated operating model (process improvements are part of this)
Realize benefits based on established performance targets
Roadmap Implementation
Develop recommendations based on business case (tactical vs. strategic)
Prioritize recommendations based on cost, impact and risk
Develop roadmap to implement recommendations (project plan, resourcing, etc.)
Set a clear objectives and targets
Assess the cost reduction opportunity
Document business priorities
Analyze the current state (headcount, supplier etc.)
Creating detailed insights into costs
Meet with key stakeholders
Identify opportunities and build high level business case
Roadmap DevelopmentAssessmentPlanning
Approach
Robust Project Management
Stakeholder management (buy-in, consensus, communication etc.)
78
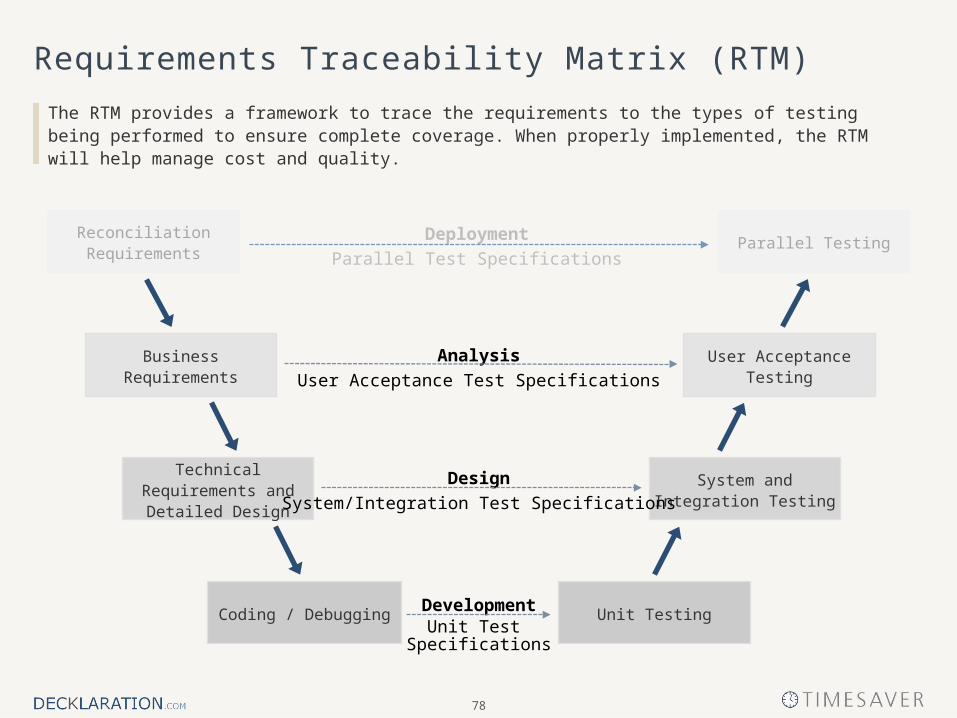
Requirements Traceability Matrix (RTM)
The RTM provides a framework to trace the requirements to the types of testing being performed to ensure complete coverage. When properly implemented, the RTM will help manage cost and quality.
DevelopmentUnit Test
Specifications
Coding / Debugging Unit Testing
Business Requirements User Acceptance Testing
Technical Requirements and Detailed Design
System and Integration Testing
Analysis
User Acceptance Test Specifications
Design
System/Integration Test Specifications
Reconciliation Requirements
Parallel TestingDeployment
Parallel Test Specifications
79
Business Portfolio 3x3
Co
mp
etit
ive
Po
siti
on
Low
Med
ium
Hig
h
Product/Market Attractiveness
Low Medium High
80
World Map
81
United States Map
IIntroduction
IIBasic Slides
IIIExecutive Summary Templates
IVModels and Objects
VProject Management Templates
VIFrameworks and Methodologies
VII7 Deck Rules
83
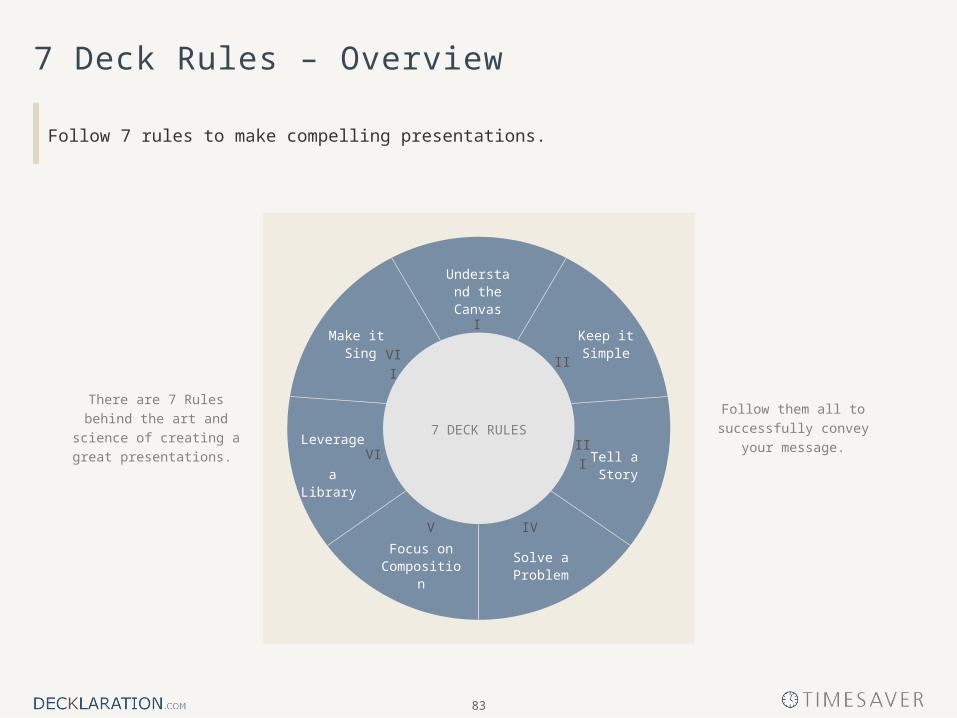
7 Deck Rules – Overview
Follow 7 rules to make compelling presentations.
4
Understand the Canvas
Keep itSimple
Make it Sing
Tell a Story
Leverage a Library
Solve a Problem
Focus on Composition
7 DECK RULES
I
V
II
IIIVI
VII
IV
Follow them all to
successfully convey your
message.
There are 7 Rules behind the
art and science of creating a
great presentations.
84
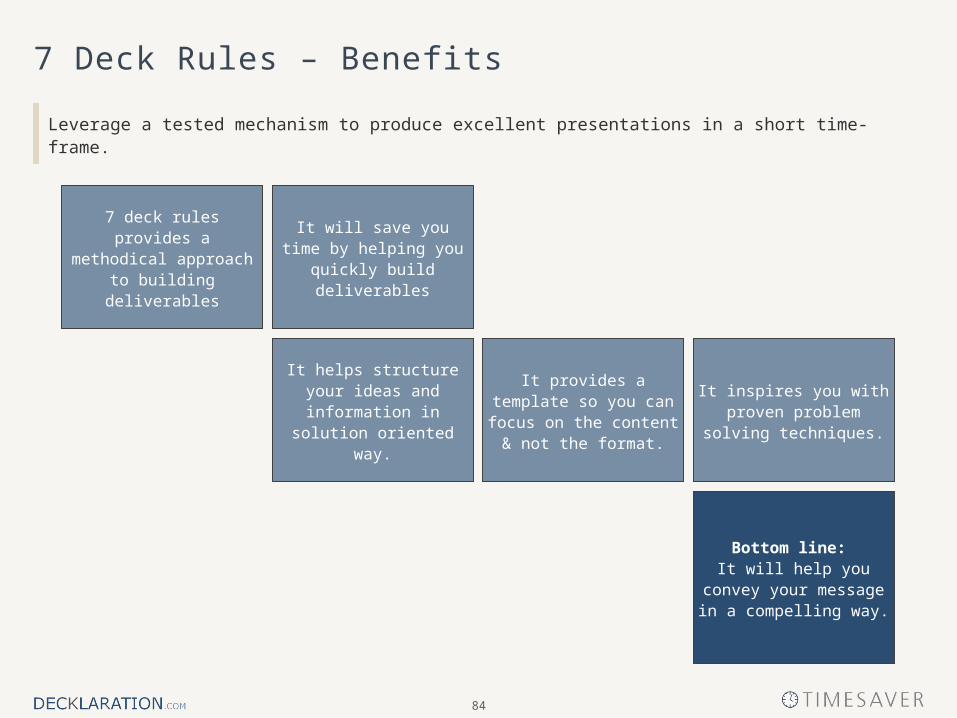
7 Deck Rules – Benefits
Leverage a tested mechanism to produce excellent presentations in a short time-frame.
It inspires you with proven problem solving
techniques.
It will save you time by helping you quickly build
deliverables
7 deck rules provides a methodical approach to
building deliverables
It helps structure your ideas and information in solution oriented way.
Bottom line: It will help you convey your message in a compelling
way.
It provides a template so you can focus on the
content & not the format.
85
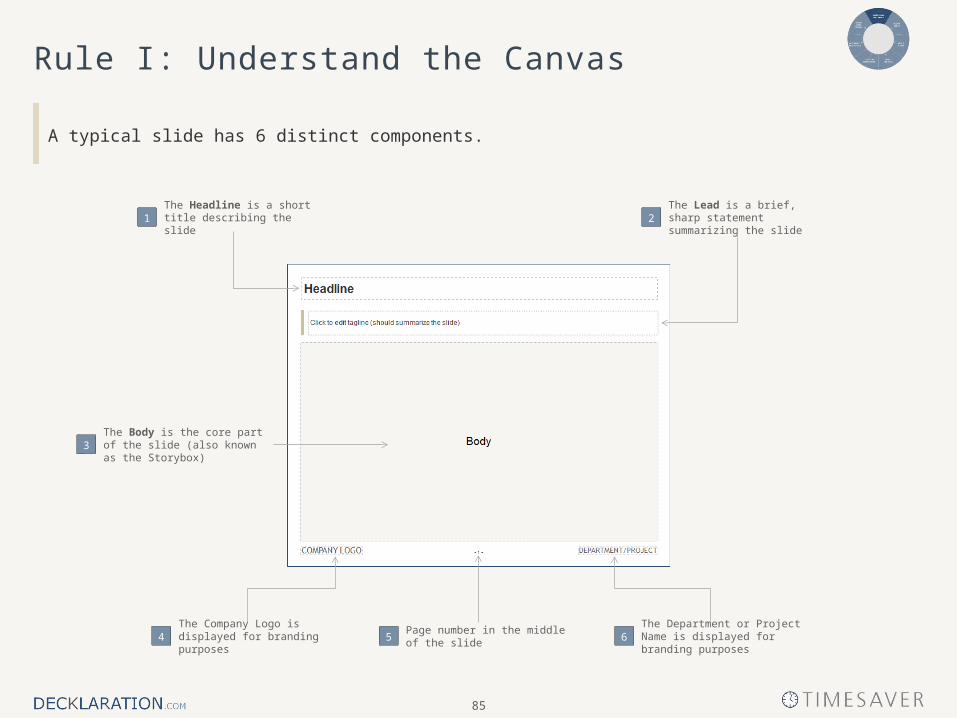
Rule I: Understand the Canvas
A typical slide has 6 distinct components.
The Headline is a short title describing the slide1
The Lead is a brief, sharp statement summarizing the slide2
The Body is the core part of the slide (also known as the Storybox)3
The Company Logo is displayed for branding purposes4
Page number in the middle of the slide5
The Department or Project Name is displayed for branding purposes6
86
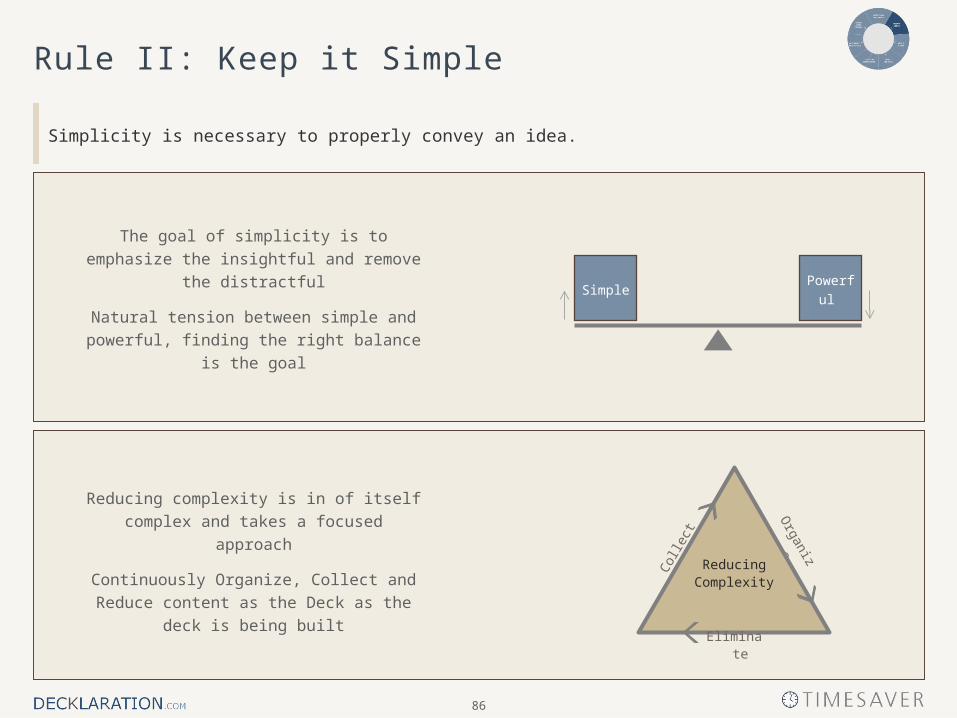
Rule II: Keep it Simple
Simplicity is necessary to properly convey an idea.
Reducing complexity is in of itself complex and
takes a focused approach
Continuously Organize, Collect and Reduce
content as the Deck as the deck is being built
The goal of simplicity is to emphasize the
insightful and remove the distractful
Natural tension between simple and powerful,
finding the right balance is the goal
Powerful Simple
Col
lect
Organize
Eliminate
Reducing Complexity
87
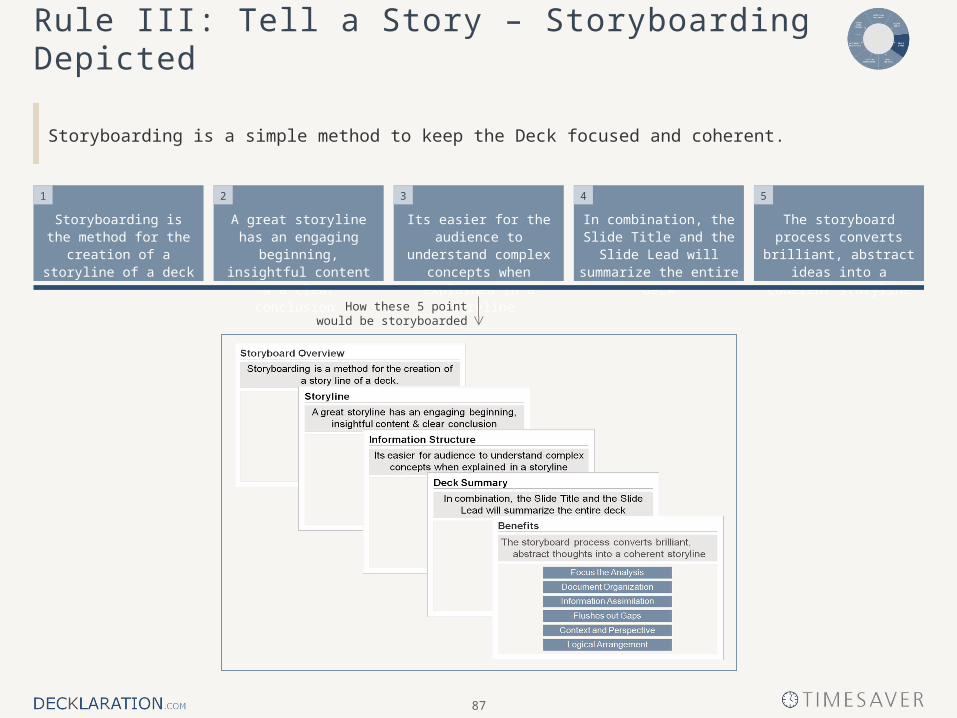
A great storyline has an engaging beginning,
insightful content & a clear conclusion
Its easier for the audience to understand complex
concepts when explained in a storyline
In combination, the Slide Title and the Slide Lead will summarize the entire deck
The storyboard process converts brilliant, abstract
ideas into a coherent storyline
Storyboarding is the method for the creation of
a storyline of a deck
How these 5 point would be storyboarded
Rule III: Tell a Story – Storyboarding Depicted
Storyboarding is a simple method to keep the Deck focused and coherent.
2 51 43
88
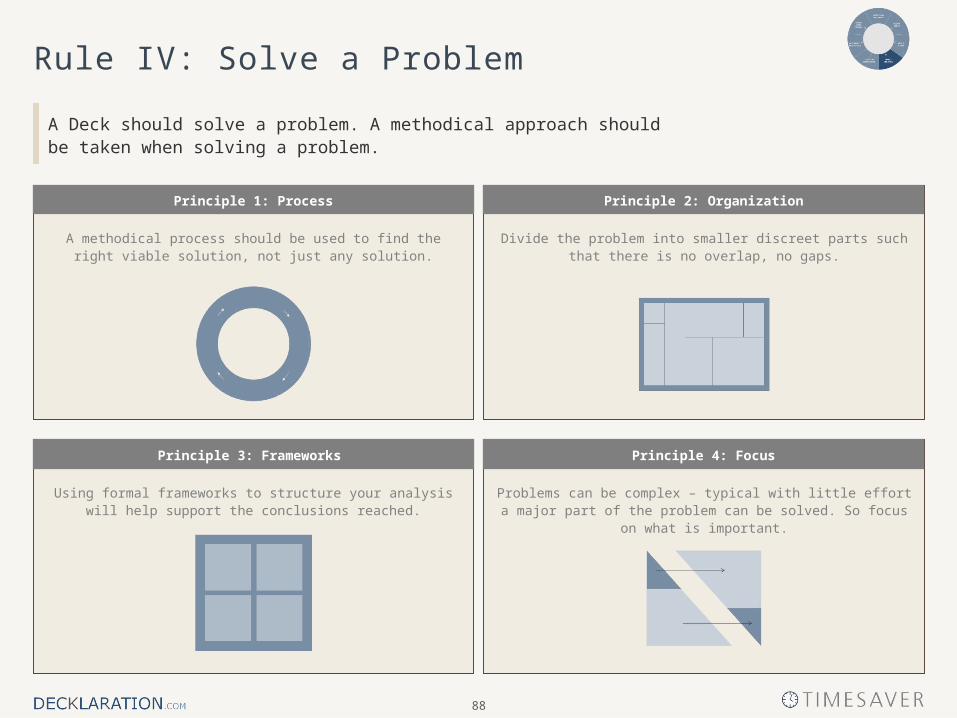
Principle 2: OrganizationPrinciple 1: Process
Divide the problem into smaller discreet parts such that there is no overlap, no gaps.
A methodical process should be used to find the right viable solution, not just any solution.
Principle 3: Frameworks Principle 4: Focus
Problems can be complex – typical with little effort a major part of the problem can be solved. So focus on what is important.
Using formal frameworks to structure your analysis will help support the conclusions reached.
Rule IV: Solve a Problem
A Deck should solve a problem. A methodical approach should be taken when solving a problem.
89
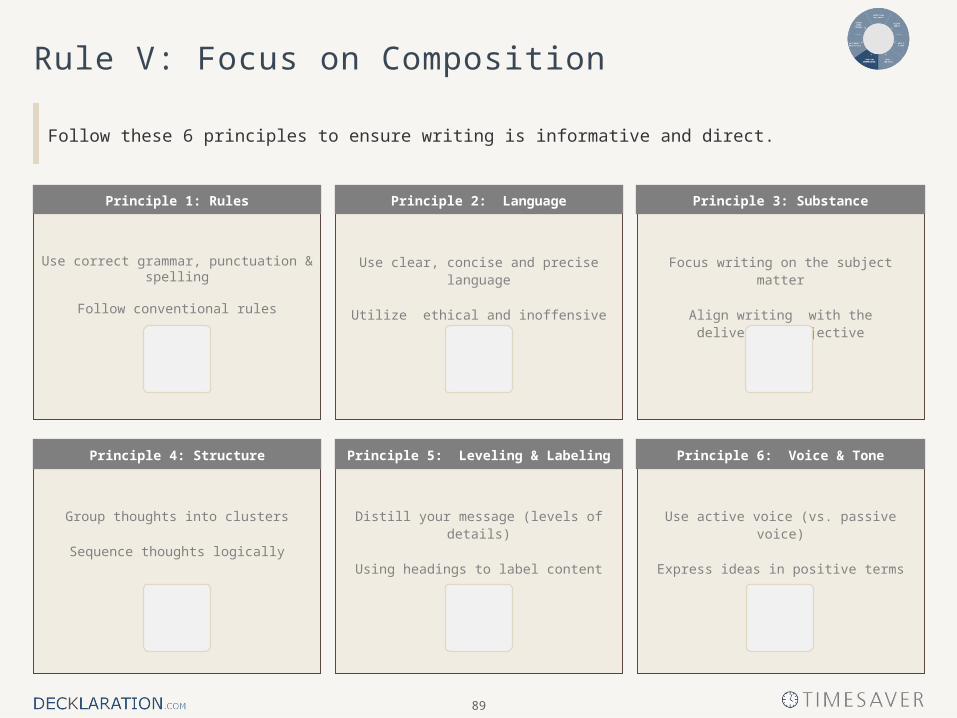
Rule V: Focus on Composition
Follow these 6 principles to ensure writing is informative and direct.
Focus writing on the subject matter
Align writing with the deliverable objective
Use clear, concise and precise language
Utilize ethical and inoffensive Language
Use correct grammar, punctuation & spelling
Follow conventional rules
Use active voice (vs. passive voice)
Express ideas in positive terms
Distill your message (levels of details)
Using headings to label content
Group thoughts into clusters
Sequence thoughts logically
Principle 5: Leveling & Labeling Principle 6: Voice & TonePrinciple 4: Structure
Principle 2: Language Principle 3: SubstancePrinciple 1: Rules
90
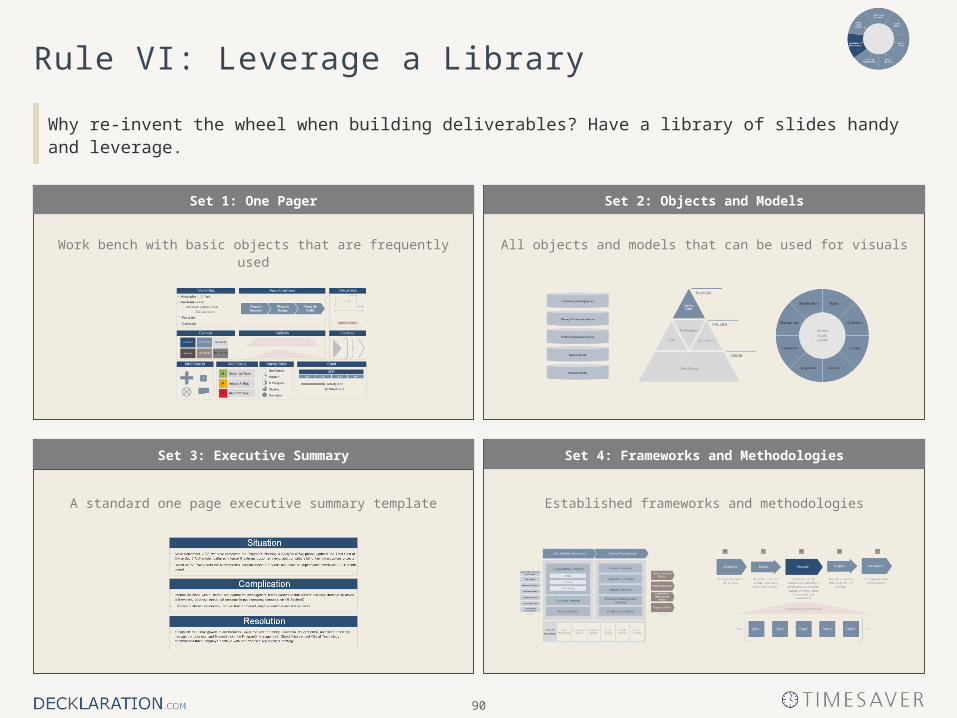
All objects and models that can be used for visualsWork bench with basic objects that are frequently used
Set 2: Objects and ModelsSet 1: One Pager
Established frameworks and methodologiesA standard one page executive summary template
Set 3: Executive Summary Set 4: Frameworks and Methodologies
Rule VI: Leverage a Library
Why re-invent the wheel when building deliverables? Have a library of slides handy and leverage.
91
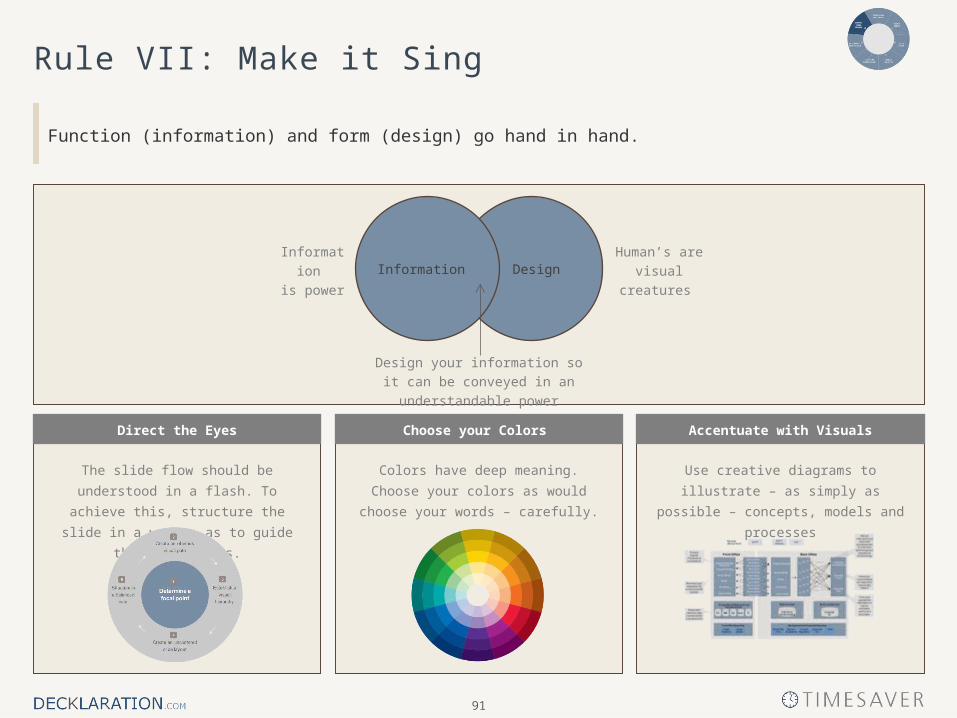
Rule VII: Make it Sing
Function (information) and form (design) go hand in hand.
Accentuate with VisualsChoose your Colors Direct the Eyes
Colors have deep meaning.
Choose your colors as would choose your
words – carefully.
Use creative diagrams to illustrate – as
simply as possible – concepts, models
and processes
The slide flow should be understood in a
flash. To achieve this, structure the slide in
a way so as to guide the viewer eyes.
DesignInformationHuman’s are
visual creatures
Information
is power
Design your information so it can be
conveyed in an understandable power
Keep reading at:
decklaration.com/bullets-do-kill
93
Author’s Message
This deck will save you time, ensure a consistent look-feel and help you produce a more polished and powerful product.
The purpose of this slide deck is to help you create insightful presentations.
This timesaver has a large number of preformatted slides (40+) that can be easily leveraged. It also has frameworks and methodologies (35+) that you can utilize when faced with a challenging problem.
Why re-invent the wheel? Just come here. Leverage.
Or, can’t think of the right way to depict a thought? Brain-cramp? Peruse the content. This will get the creative juices going.
Happy decking!