power & utilities: capital confidence barometer -...
TRANSCRIPT

Capital Confidence Barometer | 2
October 2014 | ey.com/powerandutilities/ccb | 11th edition
Capital Confidence Barometer
Power & Utilities
Amid sustained economic confidence, small cap deals are expected to dominate

| Capital Confidence Barometer2
Power & Utilities (P&U) Capital Confidence Barometer | October 2014
51%More than half expect the global economy to improve while 45% expect the economy to be stable
63%Substantial increase in deal pipelines; companies expect pipelines to grow further
74%Small-cap deals to dominate M&A activity with nearly three quarters of deals expected to have values below US$250m
40%Significant increase in P&U companies expecting to pursue acquisitions in the next 12 months
See page 11
See page 12
See page 13
See page 5

Capital Confidence Barometer | 3
A note from Matt Rennie, Global Transactions Power and Utilities Leader
Our latest Power & Utilities (P&U) Capital Confidence Barometer has again provided fascinating insight into the issues likely to impact utilities’ capital agendas over the next 12 months.
Based on fundamental indicators, such as confidence in the global economy, corporate earnings and employment expectations, the survey results show optimism in our sector: 96% of P&U respondents perceive the state of the global economy to be either stable or improving, 68% remain confident about corporate earnings, and the number of utilities expecting to hire staff over the next 12 months has increased by 66% compared to the last six months.
It’s not surprising that the percentage of utilities expecting their deal pipelines to increase over the next 12 months has risen from 28% in April to 63% in October 2014. However, there has been a clear shift in the type of deals that utilities expect to undertake, away from billion-dollar-plus deals toward middle-market deals. Global political instability was chosen by 43% of respondents as the biggest risk to utilities over the coming 12 months, up from 27% since our last survey April 2014.
This is an exciting time to be part of the P&U sector.
Confidence in economic stability backed by stronger balance sheets to support deals
A note from Pip McCrostie, Global Vice Chair, Transaction Advisory Services Our 11th Capital Confidence Barometer predicts healthy growth for M&A globally, which should take the market back to levels last seen before the financial crisis.
Acquisitive appetite has increased and deal fundamentals — credit, cash and prices — are strong, as is confidence in economic stability. The biggest indicator of this positive sentiment is deal pipeline, which has increased by a remarkable 30% since April. In addition, two-thirds of executives expect M&A pipelines to expand further over the next year — more than double the number expecting expansion six months ago.
As we predicted in our previous Barometer, 2014 has seen a big increase in multibillion-dollar deals. Now, increasing competition at the top end and a renewed focus on growing core businesses will fuel more middle-market deals.
The majority of acquisitive companies are now focusing on M&A to strengthen their core business, with an eye to boosting market share, managing costs and improving margin growth.
Megadeals are set to continue. However, the next chapter of the M&A story should be middle-market deals fueling an M&A rebound globally.
Capital Confidence Barometer | 3
| Capital Confidence Barometer4
Macroeconomic environment
Confidence in economic stability and corporate earnings will support future M&A.
Potential risks include political instability in key regions and slowing growth in emerging markets.

Capital Confidence Barometer | 5
Executives are confident about the stability of the global economy
There is a clear view among P&U executives of more stable economic growth in the near term, although expectations for an improving global economy have fallen since April 2014. The proportion of P&U executives who are pessimistic about the global economy has halved over the last year. Respondents from emerging markets are particularly optimistic about the global economy, with 100% of respondents from Brazil, China and India believing that the global economy is improving.
Q: What is your perspective on the state of the global economy?
Q: What do you believe to be the greatest economic risk to your business over the next 6–12 months?
Geopolitical instability is seen as the greatest risk factor in the next 12 months
Geopolitical concerns have increased, especially in the EU, driven mainly by tensions between Ukraine and Russia. The Middle East crisis has also escalated since our last survey. P&U companies whose operations are highly dependent on geopolitical and regulatory environments consider increased geopolitical instability as the greatest risk for their businesses.
Confidence in corporate earnings remains strong
Confidence in corporate earnings continues to be strong among P&U executives. However, confidence in short-term market stability has fallen over the last six months. This decline also translates into lower confidence in equity valuations.
Q: With regard to employment, which of the following does your organization expect to do in the next 12 months?
P&U executives express positive hiring intentions
A significantly higher number of P&U executives expect to create jobs in the next 12 months, compared to six months ago. The changing P&U business landscape and the aging workforce will require companies to hire talent with newer skills, such as energy management, smart technologies and advanced renewable technologies.
Q: Please indicate your level of confidence in the following at the global level:
68% 68%
38% 56%
59% 59%
31%
44% 51%
45% 60%
27%
Corporate earnings
Credit availability
Equity valuations/stock market outlook
Short-termmarket stability
Apr-14 Oct-13Oct-14
DecliningStableImproving
Oct-14Apr-14
51%
45%
4%
61%
31%
8%
Oct-13
67%
25%
8%
40%30%
50%53% 48%
37%
7%22% 13%
0%
10%
20%
30%
40%
50%
60%
Oct-13 Apr-14 Oct-14
Keep current workforce sizeCreate jobs/hire talent
Reduce workforce numbers
Inflation
Deflation
Slowing growth inkey emerging markets
The effects of taperingof quantitative easing
Pace of structuralreforms in Eurozone
Increased globalpolitical instability
31% 22%
27% 43%
20% 18%
12% 10%
7% 6%
3% 1%
Apr-14 Oct-14
| Capital Confidence Barometer6
Corporate strategy
Cost reduction and operational efficiency dominate utilities’ business strategies as companies look to optimize their portfolios in response to a changing business landscape.
The power and utilities sector is transforming right across the value chain. P&U companies are realigning their businesses, optimizing their asset portfolios and expanding into allied services to protect market position and target growth.

Capital Confidence Barometer | 7
Q: Which statement best describes your organization’s focus over the next 12 months?
Q: What is the primary focus of your company’s organic growth over the next 12 months?
Increased focus on reducing costs and increasing efficiency
Several mature economies, particularly in Europe, are experiencing a fall in electricity demand due to the combined effects of energy management initiatives and slower economic growth. Further, there has been increased pressure on tariffs from regulatory authorities. This, along with prevailing depressed wholesale prices, has forced utilities to focus on cost reduction and efficiency improvement to protect their bottom lines, with 49% of respondents citing it as their primary focus over the next 12 months.
As growth opportunities dry up in mature economies, utilities are looking at emerging markets such as Latin America and Africa for growth.
Optimizing business portfolio and investment in R&D are top areas of focus
P&U companies are focusing more and more on optimizing their business portfolios to operate in the changing business landscape. In the US, several utilities are looking to lower their exposure to fluctuations in wholesale prices by divesting merchant generation and increasing their share of regulated operations. In Europe, utilities are looking to offer value-added services such as energy services and management.
As research continues on clean generation and emission reduction, higher numbers of utilities are investing in research on smart and storage technologies. Increasing R&D is the primary focus for 20% of respondents in the next 12 months, a significant leap from just 3% in October 2013.
Apr-14 Oct-13Oct-14
Changingmix of existing
products & services
Increase R&D/product introductions
Exploiting technologyto develop new
markets/products
Investing in newgeographies/markets
Higher risk
25%19%
10%
20%12%
3%
10%17%
10%
10%17%20%
7%15%
20%28%
43%
14%
Lower risk
New sales channels
More rigorous focuson coreproducts/existing markets
Maintain stability Survival
Cost reduction and operational efficiencyGrowth
Oct-14Apr-14Oct-13
50%
39%
10%1%
41%16%
38%
5%
38%
49%
13%
% focused on growth
50%
40%
50%
40% 38%
0%
10%
20%
30%
40%
50%
60%
Oct-12 Apr-12 Oct-13 Apr-13 Oct-14

| Capital Confidence Barometer8
P&U companies are experiencing greater activism from investors, with shareholders influencing key strategic decisions of the utilities. As the utilities continue to face lower demand and lower profits, investors are increasingly focusing on the need for higher cost control and efficiency improvement measures. Divestment of non-strategic assets has also risen up the boardroom agenda as a result of increased shareholder activism.
P&U companies are stepping up their efforts to manage shareholder activism through enhanced communication with shareholders, ongoing portfolio reviews and steps to improve cost, efficiencies and performance.
55% 26% 26% 24% 19% 14% 12% 7%
Cost reduction
Share buyback
Strategic divestment
Cash dividend payment
Portfolio analysis
Acquisition
Spin-off/ IPO
Our shareholders
have not raised these issues
Shar
ehol
der a
ctiv
ism
14%
Not applicable
10%4% 13% 18% 18% 23%
Q: How are you preparing to manage any shareholder activism?
Nothing: We are confident in our current strategy and not actively
preparing for activism among
shareholders
Making management changes as a
result of activist intervention
Monitoring early warning
signs for activist pressure
Conducting ongoing portfolio review to grow revenue, increase margins
and optimize value
Conducting an “activist audit” — continuing with improvements around cost,
efficiencies and performance
Ensuring we have open and
proactive lines of communication with
our shareholders
Investor activism influences boardroom agenda
Q: Which of the following has been elevated on your boardroom agenda as a result of shareholder activism? Select up to two.
| Capital Confidence Barometer8

Capital Confidence Barometer | 9
The P&U sector is transforming. Generation is seeing a shift in fuel mix with an increased emphasis on clean energy, while the transmission and distribution (T&D) segment is increasingly using technology to manage networks more effectively and reduce losses. Further, regulatory pressures and increased awareness of energy efficiency have resulted in growing demand for energy management and demand-response optimization services. Of those surveyed, 47% believe that “resourceful planet” — the idea of optimizing our use of limited resources and promoting renewable energy and lower carbon energy resources — will most significantly impact their core business.
Consequently, the resourceful planet idea is greatly affecting the utilities’ acquisition strategy as well. More than US$20b worth of deals have already been completed in the renewable power segment in the first nine months of 2014, outpacing the renewable power deal value for the entire year in 2013. Separately, 37% of respondents say that digital transformation will impact their acquisition strategy in the near term. The advent of technology and increased pressure on the bottom line has increased utilities’ focus on smart technology and data analytics to enhance operations and improve customer relationships.
Resourceful planet
Future of work
Rethinking government
Digital transformation
Global rebalancing
Reconfiguring the financial
system
Cybersecurity
47%41%26%26%13%3% 34%
Q: Which of the following will impact your acquisition strategy most in the next 12 months? Select up to two.Se
ctor
meg
atre
nds
Cybersecurity Future of work
Digital transformation
Global rebalancing
Rethink government
Reconfiguring the financial
system
Resourceful planet
46% 31% 27% 19% 15% 2%37%
P&U is a sector in transformation
Q: Which of the following will impact your core business most in the next 12 months? Select up to two.
Transformation in the business landscape is driving utilities to innovate.
Capital Confidence Barometer | 9

| Capital Confidence Barometer10
M&A outlook
The appetite for acquisitions has increased significantly, and deal pipelines are strong. M&A activity has gathered momentum with the deal values in the first nine months of 2014, matching full-year 2013 levels. Expansion into newer markets for growth and widening the business scope into allied services are expected to drive M&A. Renewable power continues to drive deal volumes.
Deal momentum in 2014 is expected to increase confidence in M&A and drive deal activity further in 2015.

Capital Confidence Barometer | 11
Q: Do you expect your company to actively pursue acquisitions in the next 12 months?
Q: Please indicate your level of confidence in the following at the global level
Q: What is your expectation for the global M&A market in the next 12 months?
Appetite to acquire has almost doubled in two years
The appetite to pursue acquisitions hit a two-year high in this survey, with 40% of P&U executives surveyed expecting to pursue acquisitions in the next 12 months. The climate for M&A in 2014, a year in which activity has outpaced 2013, reflects this positive sentiment. The total deal value in the first nine months of 2014 has already reached US$125b, compared to 2013’s full-year deal value of US$125.4b.1
Of those surveyed, 50% of P&U executives are confident about the number of acquisition opportunities, up from 45% six months ago.
Some deal-making challenges persist, however. While improving from 28% six months ago, only 34% of respondents are confident of closing acquisitions.
P&U executives expect the M&A market momentum to either sustain or accelerate further
Sustained optimism in the global economy, confidence in corporate earnings and greater intent to pursue acquisitions have boosted the outlook for the M&A market. Although the proportion expecting the market to improve has fallen from 69% in April 2014, sentiment remains positive: only 1% of P&U executives believe the M&A market will decline.
Positive sentiment about the P&U M&A market is backed by the strong M&A climate in the sector in the last six months. There have been 233 deals with total disclosed value of US$97b in Q2 and Q3 2014, including 19 billion-dollar-plus deals.
1. Mergermarket, EY Analysis
Apr 12 Oct 12 Apr 13 Oct 13 Apr 14
0%
20%
40%
22% 23%28%
33%
40%
Likelihood ofclosing acquisitions
Quality of acquisitionopportunities
Number of acquisitionopportunities
Oct-13 Apr-14Oct-14
34%28%
41%
34%35%
39%
50%45%
53%
Stay the same DeclineImproving
Oct-14Apr-14
69%
28%
3%
50%
49%
1%
| Capital Confidence Barometer12
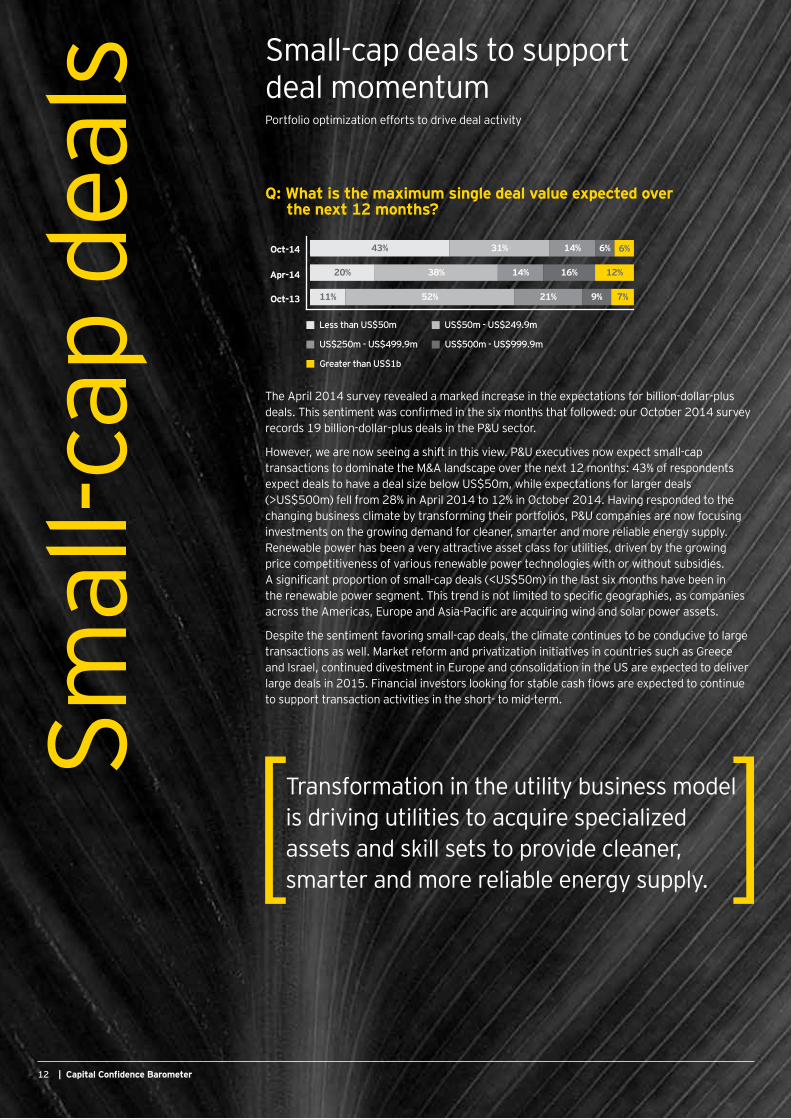
The April 2014 survey revealed a marked increase in the expectations for billion-dollar-plus deals. This sentiment was confirmed in the six months that followed: our October 2014 survey records 19 billion-dollar-plus deals in the P&U sector.
However, we are now seeing a shift in this view. P&U executives now expect small-cap transactions to dominate the M&A landscape over the next 12 months: 43% of respondents expect deals to have a deal size below US$50m, while expectations for larger deals (>US$500m) fell from 28% in April 2014 to 12% in October 2014. Having responded to the changing business climate by transforming their portfolios, P&U companies are now focusing investments on the growing demand for cleaner, smarter and more reliable energy supply. Renewable power has been a very attractive asset class for utilities, driven by the growing price competitiveness of various renewable power technologies with or without subsidies. A significant proportion of small-cap deals (<US$50m) in the last six months have been in the renewable power segment. This trend is not limited to specific geographies, as companies across the Americas, Europe and Asia-Pacific are acquiring wind and solar power assets.
Despite the sentiment favoring small-cap deals, the climate continues to be conducive to large transactions as well. Market reform and privatization initiatives in countries such as Greece and Israel, continued divestment in Europe and consolidation in the US are expected to deliver large deals in 2015. Financial investors looking for stable cash flows are expected to continue to support transaction activities in the short- to mid-term.
Smal
l-cap
dea
ls Small-cap deals to support deal momentum
Q: What is the maximum single deal value expected over the next 12 months?
Portfolio optimization efforts to drive deal activity
Transformation in the utility business model is driving utilities to acquire specialized assets and skill sets to provide cleaner, smarter and more reliable energy supply.
| Capital Confidence Barometer12
Apr-14
Oct-13
Oct-14
Less than US$50m US$50m - US$249.9m
US$250m - US$499.9m US$500m - US$999.9m
Greater than US$1b
11% 52% 21% 9% 7%
20% 38% 14% 16% 12%
43% 31% 14% 6% 6%

Capital Confidence Barometer | 13
Growing pipelines expected to expand even further in the next year
Bullish M&A climate as pipelines and deal intentions swell
Q: How many deals of all sizes do you have in your pipeline today?
Q: How do you expect your deal pipeline to change over the next 12 months?
Correlation analysis between current and expected pipeline
The October 2014 survey reveals that not only do 40% of respondents plan to pursue M&A opportunities in the next 12 months, but 35% of the respondents already have five or more deals in their pipelines. This is a significant increase compared to April 2014, when only 14% had five or more deals in their pipelines.
Further, 63% of P&U executives expect the deal pipeline to increase over the next 12 months, more than double the percentage expecting an increase six months ago.
An analysis of the correlation between current pipeline and expected future pipeline indicates that regardless of how many deals are currently in their pipelines, most P&U executives expect the number to increase.
This expectation for larger pipelines, combined with the existing proportion of companies with large pipelines, bodes well for M&A activity in the near term.
17%
21%
36%
32%
20%
9%
13%
3%
14%
35%
2
1
4
3
>=5
Apr-14 Oct-14
63%
28%
31%
63%
6%
9%
No change
Decrease
Increase
Apr-14 Oct-14
2
1
3
4
>=5
Decrease No change Increase
100%
33% 67%
27% 73%
33% 67%
8% 25% 67%
Expected growth in the next 12 months

| Capital Confidence Barometer14
Lower uncertainties and stable valuations to fuel deal activity
Q: How do you think that buyers’ expectations currently compare to sellers’ (valuation gap)?
Q: Do you expect the valuation gap between buyers and sellers in the next 12 months to:
Q: What do you expect the price/valuation of assets to do over the next 12 months?
Q: For acquisitions completed recently, what was the most significant issue that contributed to deals not meeting expectations?
Positive deal making climate expected with stable asset prices and narrow valuation gap
Estimation of right strategic value remains a key challenge among P&U companies
P&U executives are fairly positive about valuation gaps in the existing deal-making environment: 92% of respondents believe that the difference in asset price expectations between buyers and sellers (valuation gap) is less than 25%, while 41% believe that the gap is less than 10%.
P&U respondents expect the asset valuations and valuation gap to remain stable over the next 12 months. Of those surveyed, 70% believe that the valuation gap will stay at current levels, while 16% expect the gap to contract, creating a positive climate for deal making. The expectation for stability in valuation gaps and asset pricing reinforces the general confidence in the stability of the economic environment.
Our previous Capital Confidence Barometer survey (April 2014) showed that 32% of respondents believed that overestimation of strategic value was the most significant reason for deals not meeting expectations. The latest survey reveals that P&U companies continue to face valuation challenges: 51% of respondents say that deals did not meet expectations primarily due to overestimation of the strategic value of the asset.
7%1%
11%
41%
40%
Significantly higher (25% or more)
Somewhat higher(10%-25%)
The gap is small (<10%)
Somewhat lower (10%-25%)
Significantly lower(25% or more)
14%
70%
16% 13%
60%
27%Increase
Remain at current levels
Decrease
Contract
Stay the same
Widen
14%
70%
16% 13%
60%
27%Increase
Remain at current levels
Decrease
Contract
Stay the same
Widen
4%
7%
9%
11%
18%
51%
Poor operating cost assumptions
Unforeseen liabilities
Poor execution of integration
Strategic value overestimated/purchase price multiple too high
Product/sales priceand margin deterioration
Sales volume declines/loss of customers

Capital Confidence Barometer | 15
Access to new markets and allied services to drive deal making
Focus remains on core business
Of those surveyed, 67% say their companies’ M&A plans will focus on growing the core business, and 58% say that their planned M&A activity will consist of bolt-on acquisitions that will complement current business models or be in adjacent sectors.
While utilities look to add new services to their business scope, the focus continues to be the core activity. Non-core business acquisitions are primarily limited to services or businesses that complement the companies’ core activities. For example, utilities with electricity retail businesses are looking to add energy management and services to their portfolios to complement the retail business.
Access to new markets and products to drive M&A
Q: What are the main drivers impacting your M&A strategy over the next 12 months? Select up to three.
Close to half (44%) of P&U executives say that their M&A strategy is primarily driven by the need to move into new geographical markets, while 40% say that moving into new products or services is their top strategic driver.
As growth in traditional utility businesses dries up in mature markets, a greater number of utilities are looking to expand their geographical footprint in search of growth. Utilities are also taking steps to expand their business scope to include allied services such as energy management and other energy services.
Deal activity in the P&U sector in previous quarters reinforces the findings from the survey. GDF Suez’s US$335m acquisition of US-based technology firm Ecova, and E.ON’s acquisition of Matrix Energy solutions and Orcan Energy, reflect this trend. In the US, NRG has moved to seize the opportunities presented by distributed renewables, acquiring Roof Diagnostics Solar, a company engaged in residential and commercial solar panel installations. China’s state-owned electricity transmission company recently acquired a 35% stake in CDP Reti and is a potential bidder for Enel’s planned divestments in Romania and Slovakia.2
Q: Your planned M&A activity will mostly be:
Q: Which statements best describe your M&A plans?
2. “CDP: the Board of Directors approves the disposal of a 35% stake in CDP RETI to the Chinese Group State Grid Corporation of China”, CDP website, www.cdp.it/en/media/press-releases/cdp-il-consiglio-di-amministrazione-approva-la-cessione-del-35-di-cdp-reti-al-gruppo-cinese-state-grid-corporation-of-china.html, 30 July 2014.”UPDATE 1-Chinese firms eye Enel power assets in Romania, Slovakia,” Reuters, http://uk.reuters.com/article/2014/10/02/enel-ceo-idUKL6N0RX48A20141002, 2 October 2014.
5%
7%
16%
19%
23%
27%
30%
34%
35%
40%
44%
Navigate regulatory issues
Optimize tax efficiencies
Acquire talent
Acquire assets at a discount —opportunistic M&A
Reduce costs and increase margins
Improvement to supply chain
Move into new product/service areas
Move into new geographical markets
Access new technology/intellectual property
Gain market share in existinggeographical markets
Leverage regulatory/legislativeopportunities
19%
14%
67%
We will focus on growing thecore (expanding your coreoffering into new markets orproducts)
We will do defensive deals (ensuring assets don’t fall into competitor hands)
We will do disruptive deals (innovative investment which shifts scope of buying business — could be into another industry)
42%
58%
Bolt-on (complement current business model)
Transformative (high-valueacquisition which significantly changes the size of acquirer)
| Capital Confidence Barometer16
Debt to fund future deal making as balance sheets gain strength
Q: What is your company’s current debt-to capital ratio?
Q: What is likely to be the main source of your company’s deal financing in the next 12 months?
Q: How do you expect your company’s debt-to-capital ratio to change over the next 12 months?
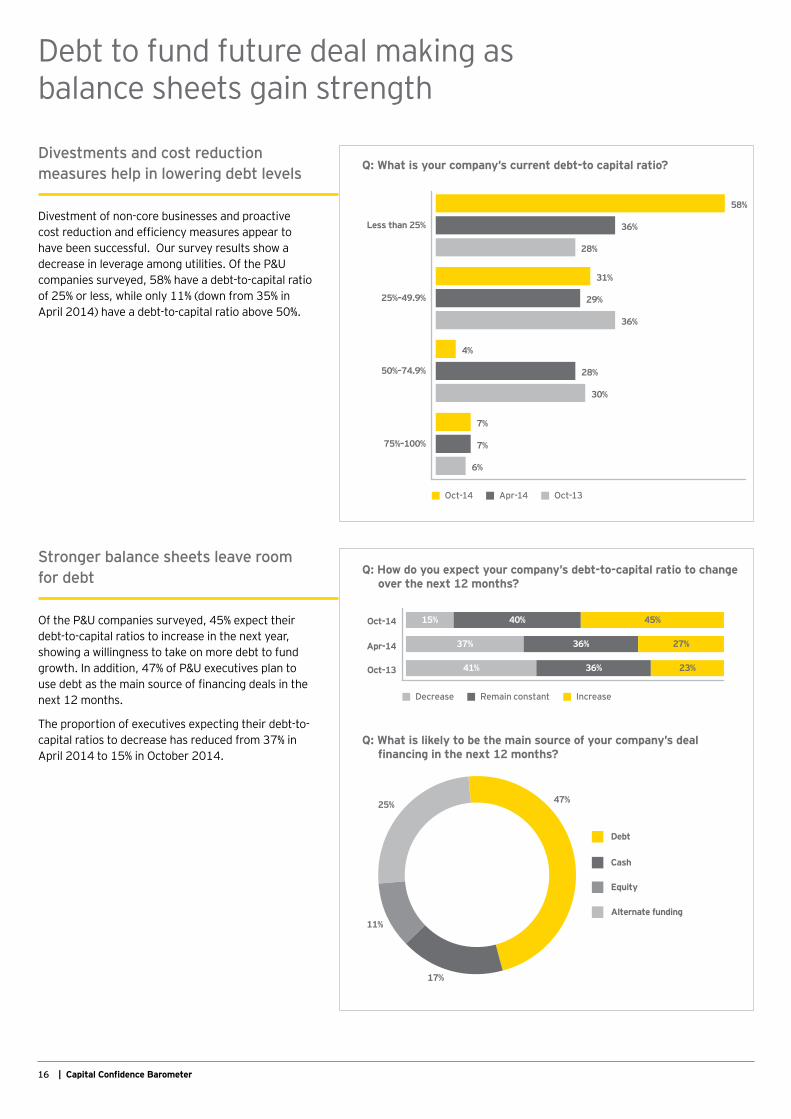
Divestments and cost reduction measures help in lowering debt levels
Stronger balance sheets leave room for debt
Divestment of non-core businesses and proactive cost reduction and efficiency measures appear to have been successful. Our survey results show a decrease in leverage among utilities. Of the P&U companies surveyed, 58% have a debt-to-capital ratio of 25% or less, while only 11% (down from 35% in April 2014) have a debt-to-capital ratio above 50%.
Of the P&U companies surveyed, 45% expect their debt-to-capital ratios to increase in the next year, showing a willingness to take on more debt to fund growth. In addition, 47% of P&U executives plan to use debt as the main source of financing deals in the next 12 months.
The proportion of executives expecting their debt-to-capital ratios to decrease has reduced from 37% in April 2014 to 15% in October 2014.
25%–49.9%
Less than 25%
50%–74.9%
75%–100%
Oct-14 Apr-14 Oct-13
58%
36%
28%
31%
29%
36%
4%
28%
30%
7%
7%
6%
Apr-14
Oct-13
Oct-14
Decrease Remain constant Increase
41%
37%
15%
36%
36%
40%
23%
27%
45%
17%
11%
25% 47%
Debt
Cash
Equity
Alternate funding
Capital Confidence Barometer | 17
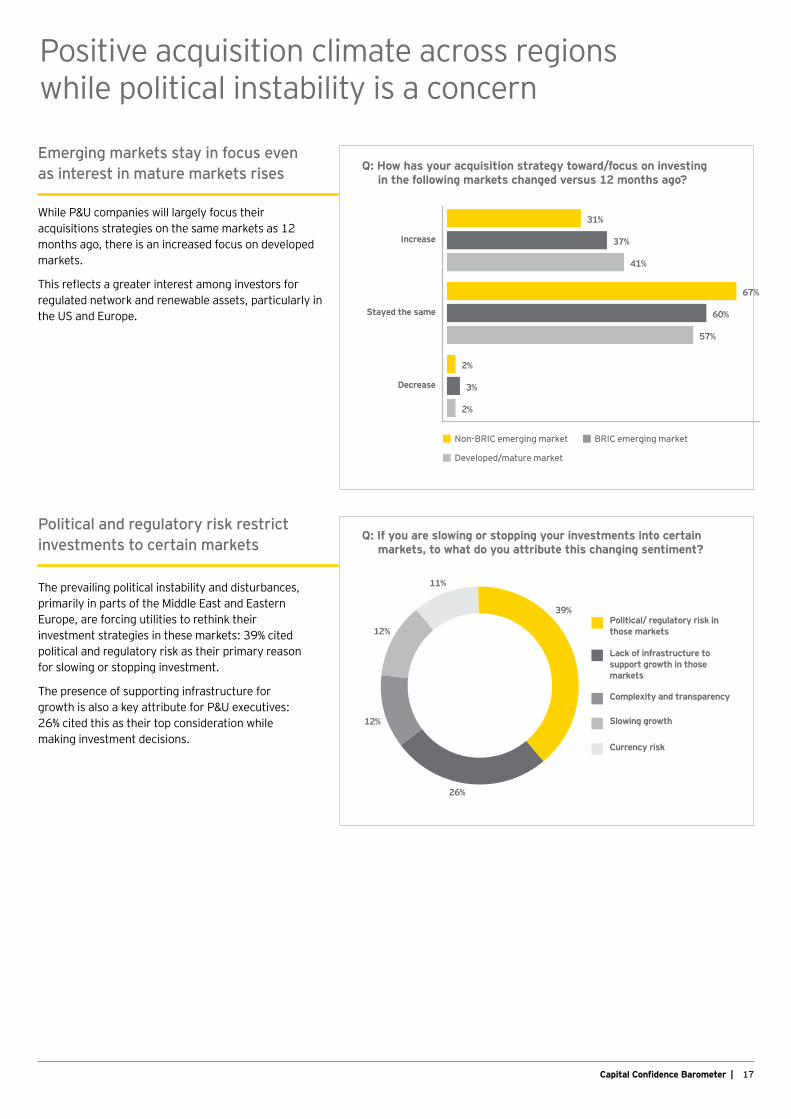
Positive acquisition climate across regions while political instability is a concern
Political and regulatory risk restrict investments to certain markets
The prevailing political instability and disturbances, primarily in parts of the Middle East and Eastern Europe, are forcing utilities to rethink their investment strategies in these markets: 39% cited political and regulatory risk as their primary reason for slowing or stopping investment.
The presence of supporting infrastructure for growth is also a key attribute for P&U executives: 26% cited this as their top consideration while making investment decisions.
Emerging markets stay in focus even as interest in mature markets rises Q: How has your acquisition strategy toward/focus on investing
in the following markets changed versus 12 months ago?
Q: If you are slowing or stopping your investments into certain markets, to what do you attribute this changing sentiment?
While P&U companies will largely focus their acquisitions strategies on the same markets as 12 months ago, there is an increased focus on developed markets.
This reflects a greater interest among investors for regulated network and renewable assets, particularly in the US and Europe.
31%
67%
2%
37%
60%
3%
41%
57%
2%
Increase
Stayed the same
Decrease
Non-BRIC emerging market BRIC emerging market
Developed/mature market
26%
12%
12%
11%
39%
Currency risk
Slowing growth
Complexity and transparency
Lack of infrastructure to support growth in those markets
Political/ regulatory risk in those markets

| Capital Confidence Barometer18
Utilities are focusing cross-border investments on a core group of developed and top-tier emerging countries.
Emerging markets, such as India, Brazil and China, continue to attract growth investments. Renewable and regulated assets in the US and UK are also attracting cross-border investment.
| Capital Confidence Barometer18

Capital Confidence Barometer | 19
Top investment destinations and their top three investors
• India’s M&A market is expected to improve due to investor sentiment increasing significantly following the new government taking charge in May 2014. The Government of India announced its intention to reform the country’s power sector, increase electrification and support renewable power development. Investors are, however, likely to be cautious after the country’s highest court cancelled 214 of the 218 coal-block licenses issued since 1993, affecting multiple power companies.3
• China’s continuing strong and stable economic growth remains attractive to investors. Potential reforms in the Chinese electricity market could open up opportunities. The country’s focus on renewable power and smart technology, and the Government’s pro-business stance, could provide an attractive climate for foreign investors.
• The US’s improving economic fundamentals and a stable regulatory climate has attracted several foreign utilities and financial investors. While several opportunities are created
by integrated utilities divesting merchant generation, the country’s renewable power assets continue to attract investors from around the globe.
• The UK’s strong domestic growth forecasts, a focus on reducing red-tape and the possibility of ongoing market reforms makes it an attractive investment destination for P&U investors. The country’s energy regulator is introducing reforms to encourage competition in the electricity sector, which is dominated by six major energy companies.
• Brazil has remained a very attractive emerging market investment destination, particularly for P&U investors. The country’s wind power assets continue to attract interest from foreign investors. However, issues such as soaring power generation costs and delays in power plant construction could make investors cautious. On the other hand, the weak financial situation of the country’s utilities could trigger some distressed sales.
Top
inve
stm
ent
dest
inat
ions
Top
inve
stor
s
BrazilChina United States United Kingdom
United States
United States
United States United States
United Kingdom United Kingdom
India
Germany Germany
GermanyAustralia Australia
Australia China
China
France
3. “India supreme court cancels hundreds of coal licenses,” The Wall Street Journal, http://online.wsj.com/articles/indias-supreme-court-cancels-most-coal-licenses-given-since-1993-1411552912, 24 September 2014.

| Capital Confidence Barometer20
Utilities are focused on optimizing their allocated capital
Preserving: How can we improve the performance of our assets?As companies come out of survival modeand focus on growth, executives are nolonger focused on preserving capital but arenow turning to other Capital Agenda areas.
Optimizing: What steps can we take to maximize
our portfolio’s performance?More than half (52%) of executives are
planning to optimize capital and preparing to increase their focus on strategic dealmaking.
A strong Capital Agenda should be at the core of all strategic boardroom decisions. It is the framework for all growth and capital management questions.
Investing: What is the best way for our company to grow — and is it
aligned to our core business?Companies are actively beginning to focus on
investment, building dealmaking rigor and discipline, and setting the stage for
later growth; 15% of companies are devoting their attention and
esources to investing.
Raising: Do we have the right capital structure to meet our strategic priorities?With an active focus on growth and healthybalance sheets, companies are expectingto take on more leverage to funddeals; 33% of executives expect tofocus on raising capital.
Capital Confidence Barometer | 21
• In August and September, we surveyed a panel of more than 1,600 executives in 62 countries; more than half were CEOs, CFOs and other C-level executives. In this survey, we had 91 respondents from P&U companies; more than 60% were CEOs, CFOs and other C-level executives.
• Respondents belong to P&U companies with annual revenues ranging from less than US$500m to greater than US$5b, as follows: <US$500m (12%); US$500m—US$999.9m (21%); US$1b—US$4.9b (44%); and >US$5b (23%).
• Global P&U company ownership was publicly listed (63%), privately owned (24%), government/ state-owned (9%), family-owned (2%) and PE/portfolio-owned (2%).
• The Global Capital Confidence Barometer gauges corporate confidence in the economic outlook and identifies boardroom trends and practices in the way companies manage their capital agendas — EY’s framework for strategically managing capital.
• It is a regular survey of senior executives from large companies around the world, conducted by the Economist Intelligence Unit (EIU). Our panel comprises select global EY clients and contacts and regular EIU contributors.
Abo
ut th
is s
urve
y
Capital Confidence Barometer | 21

| Capital Confidence Barometer22
GlobalPip McCrostieGlobal Vice ChairTransaction Advisory [email protected]+44 20 7980 0500 Steve KrouskosDeputy Global Vice ChairTransaction Advisory [email protected]+44 20 7980 0346
Matt Rennie Global TAS Power & Utilities Leader Brisbane, Australia +61 7 3011 3239 [email protected] Follow @MattRennie_EY
Cara Graham Director, Global TAS Power & Utilities Brisbane, Australia +61 7 3011 3145 [email protected] Follow @carajgraham
Shikhar Gupta Global Power & Utilities Analyst Gurgaon, India +91 124 470 1233 [email protected] Follow @ShikharGupta_EY
Cont
act u
sFor a conversation about your capital strategy, please contact us.
AmericasDeborah Byers US Southwest TAS Power & UtilitiesLeaderTexas, US+1 713 750 [email protected]
Joseph Fontana Americas TAS Power & Utilities LeaderNew York, US+1 212 773 [email protected]
Miles Huq US Northeast TAS Power & Utilities LeaderMaryland, US+1 410 783 [email protected]
Gerard McInnis TAS Power & Utilities LeaderAlberta, Canada+1 403 206 [email protected]
Veeral Patel US Central TAS Power & Utilities LeaderIllinois, US+1 312 879 [email protected]
Robert LeonardTAS Power & Utilities LeaderCharlotte, US+1 704 335 [email protected]
Lucio Teixeira South America TAS Power & UtilitiesLeaderSao Paulo, Brazil+55 112 573 [email protected]
| Capital Confidence Barometer22

Capital Confidence Barometer | 23
JapanKenneth G. Smith TAS Power & Utilities LeaderTokyo, Japan+81 34 582 [email protected]
EMEIASandile HlopeAfrica TAS Power & Utilities LeaderJohannesburg, South Africa+27 11 772 [email protected]
Remigiusz Chlewicki TAS Power & Utilities LeaderWarszawa, Poland+48 22 557 74 [email protected]
René Coenradie TAS Power & Utilities LeaderRotterdam, Netherlands+31 88 407 [email protected]
Andrea Guerzoni Mediterranean TAS Power & UtilitiesLeaderMilan, Italy+39 0280 669 707 [email protected]
David Lloyd Middle East TAS Power & Utilities LeaderRiyadh, Saudi Arabia+966 11 215 [email protected]
Björn Gustafsson TAS Power & Utilities LeaderStockholm, Sweden+46 8 [email protected]
Martin SelterGermany TAS Power & Utilities LeaderBerlin, Germany+49 30 25471 [email protected]
Stéphane Kraft TAS Power & Utilities LeaderParis, France+33 1 55 61 09 [email protected]
Tony Ward EMEIA TAS Power & Utilities LeaderLondon, UK+44 121 535 [email protected]
Ian Whitlock UKI TAS Power & Utilities LeaderLondon, UK+44 20 7951 [email protected]
Asia-PacificJulie Hood TAS Power & Utilities LeaderMelbourne, Australia+61 3 8650 [email protected]
Lynn Tho ASEAN TAS Power & Utilities LeaderSingapore+65 6309 [email protected]
Alex Zhu TAS Power & Utilities LeaderBeijing, China+86 10 5815 [email protected]
Andrew TaylorNew Zealand Power & Utilities LeaderAuckland, New Zealand+64 9308 [email protected]
Capital Confidence Barometer | 23

| Capital Confidence Barometer1
EY | Assurance | Tax | Transactions | Advisory
About EYEY is a global leader in assurance, tax, transaction and advisory services. The insights and quality services we deliver help build trust and confidence in the capital markets and in economies the world over. We develop outstanding leaders who team to deliver on our promises to all of our stakeholders. In so doing, we play a critical role in building a better working world for our people, for our clients and for our communities.
EY refers to the global organization, and may refer to one or more, of the member firms of Ernst & Young Global Limited, each of which is a separate legal entity. Ernst & Young Global Limited, a UK company limited by guarantee, does not provide services to clients. For more information about our organization, please visit ey.com.
About EY’s Global Power & Utilities Center In a world of uncertainty, changing regulatory frameworks and environmental challenges, utility companies need to maintain a secure and reliable supply, while anticipating change and reacting to it quickly. EY’s Global Power & Utilities Center brings together a worldwide team of professionals to help you succeed — a team with deep technical experience providing assurance, tax, transaction and advisory services. The center works to anticipate market trends, identify the implications and develop points of view on relevant sector issues. Ultimately, it enables us to help you meet your goals and compete more effectively.
© 2014 EYGM Limited.All Rights Reserved.
EYG no. DX0286CSG/GSC2014/1485990ED None
This material has been prepared for general informationalpurposes only and is not intended to be relied upon asaccounting, tax, or other professional advice. Please referto your advisors for specific advice.
ey.com