power quality standards quality standards... · 1998-11-02 · power quality standards must provide...
TRANSCRIPT

POWER QUALITY STANDARDS
Mark McGranaghanElectrotek Concepts, Inc.
Electrical Contractor MagazinePower Quality for the Electrical Contractor Course
Introduction
Power quality has always been important. However, for many years the equation definingpower quality was very simple:
POWER QUALITY = RELIABILITY
Customer loads were linear in nature. When a sinusoidal voltage was supplied to them,they drew a sinusoidal current. They typically fell into the categories of lighting, heating,and motors. In general, they were not very sensitive to momentary variations in the supplyvoltage, such as transients and voltage sags. The loads were not connected together innetworks so grounding issues other than safety were not very critical.
Two major changes in the characteristics of customer loads and systems have completelychanged the nature of the power quality equation:
1. The first is the sensitivity of the loads themselves. The devices and equipmentbeing applied in industrial and commercial facilities are more sensitive to powerquality variations than equipment applied in the past. New equipment includesmicroprocessor-based controls and power electronics devices that are sensitive tomany types of disturbances besides actual interruptions. Controls can be affected bymomentary voltage sags or relatively minor transient voltages, resulting in nuisancetripping or misoperation of an important process.
2. The second is the fact that these sensitive loads are interconnected in extensivenetworks and automated processes. This makes the whole system as sensitive asthe most sensitive device and increases the problem by requiring a good zeropotential ground reference for the entire system.
These changes in the load characteristics have created a growing market for powerconditioning equipment that can protect the loads from the wide variety of power qualityvariations that can cause problems. In order to apply power conditioning equipmenteffectively, customers must become experts in the types of power quality variations, theircauses, their possible impacts, and the solutions available to mitigate them. Since some ofthe causes are on the utility system, the utility must also understand the full range of theseproblems.

POWER QUALITY FOR THE ELECTRICAL CONTRACTOR PQ Standards
Electrotek Concepts, Inc.page 2
The power quality problems don’t always come from the utility system either. Most of thetransient voltages in a facility are caused by switching operations within the facility. Wiringand grounding problems increase susceptibility to problems. Power electronics equipment,such as adjustable speed drives, result in a continuous string of transients (notching) as wellas steady state harmonic distortion that can cause heating in other loads within the facility.
What are We Doing to Understand the Problems?
Understanding the problems associated with power quality variations is the first steptowards developing standards and the optimum approach to solutions. Understandingmeans being able to relate the causes of power quality variations to impacts on equipmentand processes within customer facilities. This requires an understanding of the utility powersystem, the customer electrical system, and the equipment characteristics.
There are a number of significant research efforts under way to help improve theunderstanding of power quality problems. There are three important categories for theseinvestigations:
1. Monitoring. Utilities and customers are both doing more and more monitoring ofpower quality. This monitoring is being performed on the power system and withincustomer facilities. The Electric Power Research Institute (EPRI) is sponsoring amulti-year project to monitor power quality on distribution systems around thecountry with 24 host utilities (Figure 1). Some of these utilities are extending themonitoring to include customer facilities so that they can relate events and variationson the distribution system with problems in the customer plant.
1
2
4
3
5
6
78
910
11 12
13
14
15
22
19
17
24
21
16
18
20
Figure 1. Participants in the EPRI-Sponsored Distribution Power Quality MonitoringProject

POWER QUALITY FOR THE ELECTRICAL CONTRACTOR PQ Standards
Electrotek Concepts, Inc.page 3
2. Case Studies. Case studies are a way of characterizing power quality concerns forindividual customers and systems. There are numerous case studies beingperformed by utilities, their customers, and EPRI. When the results of all these casestudies are shared and combined, the results illustrate important generalcharacteristics of power quality concerns for different kinds of customers andequipment. The solutions implemented in particular case studies can be patterns formore general solutions to power quality problems.
3. Analytical Tools. The results of monitoring efforts and case studies are being usedto improve analytical models for simulating system disturbances. There are UsersGroups for harmonic analysis and transient analysis that can provide guidance inevaluating problems and the range of possible solutions. The advantage of thesimulation approach is that it allows evaluations of systems and conditions that maynot yet actually exist (e.g. future expansion plans).
The Role of Standards
Power quality problems ultimately impact the end user. However, there are many otherparties involved in creating, propagating, and solving power quality problems (Figure 2).Power quality standards must provide guidelines, recommendations, and limits to helpassure compatibility between end use equipment and the system where it is applied. Thestandards affect all of the parties shown in Figure 2.
Power ConditioningEquipment
Manufacturers
Consultants
Monitoring EquipmentManufacturers
Architects/EngineersFacility Designers
ResearchOrganizations
(EPRI)
StandardsOrganizations(IEEE, ANSI)
UtilityCustomer
Manufacturer
Figure 2. Players That Influence End-Use Power Quality

POWER QUALITY FOR THE ELECTRICAL CONTRACTOR PQ Standards
Electrotek Concepts, Inc.page 4
There is active interest in this country as well as the rest of the world to establish powerquality standards to deal with these problems. The international standards developmentorganization is the IEC. The IEC has defined a category of standards calledElectromagnetic Compatibility (EMC) Standards that deal with power quality issues. Theyfall into the following six categories:
1. General. These provide definitions, terminology, etc. (IEC 1000-1-x)
2. Environment. Characteristics of the environment where equipment will be applied(1000-2-x).
3. Limits. Emission limits define the allowable levels of disturbances that can becaused by equipment connected to the power system. These standards wereformerly the IEC 555 series but now are numbered 1000-3-x. For instance, IEC555-2 has now become IEC 1000-3-2.
4. Testing and Measurement Techniques. These provide detailed guidelines formeasurement equipment and test procedures to assure compliance with the otherparts of the standards (1000-4-x).
5. Installation and Mitigation Guidelines. These are designed to provide guidancein application of equipment, such as filters, power conditioning equipment, surgesuppressors, etc., to solve power quality problems (1000-5-x).
6. Generic and Product Standards. These will define immunity levels required forequipment in general categories or for specific types of equipment (1000-6-x).
This is a very impressive breakdown and organization for power quality standardsdevelopment. Unfortunately, very few of these standards have actually been written andthose that have been drafted are controversial. For instance, it took almost ten years to getIEC 1000-2-2 (IEC 555-2) approved and there are still questions about when it will beimplemented.

POWER QUALITY FOR THE ELECTRICAL CONTRACTOR PQ Standards
Electrotek Concepts, Inc.page 5
PowerLines
MobileRadio
Conducted Noise
AC Power Circuit Electric Motors
Ignition
Lightning
Figure 3. Some factors affecting Electromagnetic Compatibility
These IEC standards are generally adopted by the European Community (CENELEC) andbecome requirements for equipment sold in Europe. Their application in the rest of theworld varies and very few of them are adopted outright in the United States.
Power Quality Standards in the US
In the United States, standards are developed by the IEEE, ANSI, and equipmentmanufacturer organizations, such as NEMA. We also have safety-related standards, like theNational Electrical Code. We have very few standards that define requirements for specificequipment. Our standards tend to be more application oriented, like IEEE 519-1992, whichprovides recommendations to limit harmonic distortion levels on the overall power system.
IEEE has formed a Standards Coordinating Committee (SCC-22) that has the job ofcoordinating standards activities regarding power quality from all the different organizationsdoing development. Table 1 provides a listing of existing standards and standards underdevelopment related to power quality.

POWER QUALITY FOR THE ELECTRICAL CONTRACTOR PQ Standards
Electrotek Concepts, Inc.page 6
Table 1. Listing of Important Power Quality StandardsOrganization Std. Title/Scope
ANSI/IEEE 141 Industrial Electric Power Systems
142 Industrial & Commercial Power System Grounding
241 Commercial Electric Power Systems
242 Industrial & Commercial Power System Protection
399 Industrial & Commercial Power System Analysis
446 Industrial & Commercial Power System Emergency Power
493 Industrial & Commercial Power System Reliability
518 Control of Noise in Electronic Controls
519 Harmonics in Power Systems
602 Industrial & Commercial Power Systems in Health Facilities
739 Energy Conservation in Industrial Power Systems
929 Interconnection Practices for Photovoltaic Systems
1001 Interfacing Dispersed Storage and Generation
1035 Test Procedures for Interconnecting Static Power Converters
1050 Grounding of Power Station Instrumentation & Control
ANSI C62 Guides & Standards on Surge Protection
C84.1 Voltage Ratings for Power Systems & Equipment
C37 Guides and Standards for Relaying & Overcurrent Protection
C57.110 Transformer Derating for Supplying Nonlinear Loads
IEEE P487 Wire Line Communication Protection in Power Stations
1100 Powering and Grounding Sensitive Equipment
P1159 Monitoring and Definition of Electric Power Quality
P1250 Guide on Equipment Sensitive to Momentary VoltageDisturbances
P1346 Guide on Compatibility for ASDs and Process Controllers
NEMA UPS Uninterruptible Power Supply Specification
NFPA 70 National Electric Code
75 Protection of Electronic Computer Data Processing Equipment
78 Lightning Protection Code for Buildings
NIST 94 Electric Power for ADP Installations
SP678 Overview of Power Quality and Sensitive Electrical Equipment
UL 1449 Standards for Safety of Transient Voltage Surge Suppressors
There has been a general fear on the part of the utility industry to create any standards thatdefine the level of power quality required of the supply system. This fear is slowly beingbroken down as utilities realize the need to define the base level of power quality in order tobe able to offer any kind of differentiated service for those customers that require a higherperformance level.
It is worthwhile to look at the current state of standards development related to eachimportant type of power quality problem.

POWER QUALITY FOR THE ELECTRICAL CONTRACTOR PQ Standards
Electrotek Concepts, Inc.page 7
Standards for Steady State Voltage Regulation and Unbalance
There is no such thing as steady state on the power system. Loads are continually changingand the power system is continually adjusting to these changes. All of these changes andadjustments result in voltage variations that are referred to as long duration voltagevariations. These can be undervoltages or overvoltages, depending on the specific circuitconditions. Characteristics of the steady state voltage are best expressed with long durationprofiles and statistics. Important characteristics include the voltage magnitude andunbalance. According to the latest draft of IEEE P1159, IEEE Recommended Practice forMonitoring Power Quality, long duration variations are considered to be present when thelimits are exceeded for greater than 1 minute. Harmonic distortion is also a characteristic ofthe steady state voltage but this characteristic is treated separately because it does notinvolve variations in the fundamental frequency component of the voltage.
Figure 4. Example 24 hour voltage profile illustrating long duration voltage variations.
Most end use equipment is not very sensitive to these voltage variations, as long as they arewithin reasonable limits. ANSI C84.1-1989 specifies the steady state voltage tolerancesexpected on a power system. It recommends that equipment be designed to operate withacceptable performance under extreme steady state conditions of +6% and -13% of nominal120/240 volt system voltage. Protective devices may operate to remove the equipment fromservice outside of this range. Figure 5 illustrates the major requirements of the standard.Two ranges of permissible voltages are provided. Range A is for normal conditions. RangeB is for short duration or unusual system conditions. The service voltage is the voltage atthe end user service entrance. The utilization voltage is the voltage at the actual end useequipment, allowing for voltage drop across facility wiring.

POWER QUALITY FOR THE ELECTRICAL CONTRACTOR PQ Standards
Electrotek Concepts, Inc.page 8
RANGE A
Vo
ltag
e (1
20 V
Bas
e)
104
108
112
116
120
124
128
Utilization Voltage
(b)
(a)
Service Voltage 120-600 V
Service Voltage > 600 V
Utilization Voltage
Service Voltage 120-600 V
(a)
Service Voltage > 600 V
RANGE B
Figure 5. ANSI C84.1-1989 steady state voltage limits(Notes: (a) these shaded portions do not apply to circuits supplying lighting loads,
(b) this shaded portion of the range does not apply to 120-600 volt systems..
The most recent version of this standard (1989) includes recommended limits for voltageunbalance on the power system. Unbalance is a steady state quantity defined as themaximum deviation from the average of the three phase voltages or currents, divided bythe average of the three phase voltages or currents, expressed in percent. Unbalance canalso be quantified using symmetrical components. The ratio of the negative sequencecomponent to the positive sequence component is used to specify the percent unbalance.
The primary source of voltage unbalance less than two percent is unbalanced single phaseloads on a three-phase circuit. Voltage unbalance can also be the result of capacitor bankanomalies, such as a blown fuse on one phase of a three-phase bank. Severe voltageunbalance (greater than 5%) can result from single-phasing conditions.
Voltage unbalance is most important for three phase motor loads. ANSI C84.1-1989recommends that the maximum voltage unbalance measured at the meter under no loadconditions should be 3%. Unbalance greater than this can result in significant motor heatingand failure if there are not unbalance protection circuits to protect the motor.
POWER QUALITY FOR THE ELECTRICAL CONTRACTOR PQ Standards
Electrotek Concepts, Inc.page 9
Standards for Harmonics
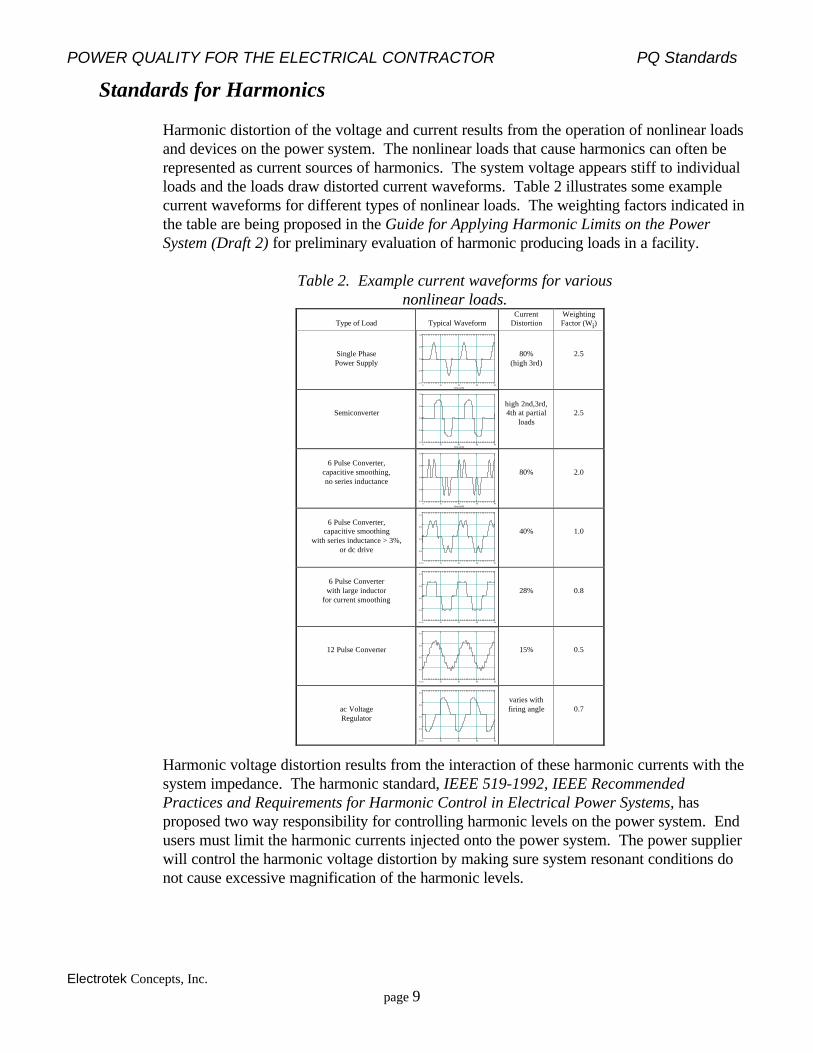
Harmonic distortion of the voltage and current results from the operation of nonlinear loadsand devices on the power system. The nonlinear loads that cause harmonics can often berepresented as current sources of harmonics. The system voltage appears stiff to individualloads and the loads draw distorted current waveforms. Table 2 illustrates some examplecurrent waveforms for different types of nonlinear loads. The weighting factors indicated inthe table are being proposed in the Guide for Applying Harmonic Limits on the PowerSystem (Draft 2) for preliminary evaluation of harmonic producing loads in a facility.
Table 2. Example current waveforms for variousnonlinear loads.
Type of Load Typical WaveformCurrent
DistortionWeightingFactor (Wi)
Single PhasePower Supply
0 10 20 30 40-1.0
-0.5
0.0
0.5
1.0
Time (mS)
Ct
80%(high 3rd)
2.5
Semiconverter
0 10 20 30 40-1.0
-0.5
0.0
0.5
1.0
Time (mS)
Ct
high 2nd,3rd,4th at partial
loads2.5
6 Pulse Converter,capacitive smoothing,no series inductance
0 10 20 30 40-1.0
-0.5
0.0
0.5
1.0
Time (mS)
Ct
80% 2.0
6 Pulse Converter,capacitive smoothing
with series inductance > 3%,or dc drive
0 10 20 30 40-1.0
-0.5
0.0
0.5
1.0
Ct
40% 1.0
6 Pulse Converterwith large inductor
for current smoothing
0 10 20 30 40-1.0
-0.5
0.0
0.5
1.0
Ct
28% 0.8
12 Pulse Converter
0 10 20 30 40-1.0
-0.5
0.0
0.5
1.0
Ct
15% 0.5
ac VoltageRegulator
0 10 20 30 40-1.0
-0.5
0.0
0.5
1.0
Ct
varies withfiring angle 0.7
Harmonic voltage distortion results from the interaction of these harmonic currents with thesystem impedance. The harmonic standard, IEEE 519-1992, IEEE RecommendedPractices and Requirements for Harmonic Control in Electrical Power Systems, hasproposed two way responsibility for controlling harmonic levels on the power system. Endusers must limit the harmonic currents injected onto the power system. The power supplierwill control the harmonic voltage distortion by making sure system resonant conditions donot cause excessive magnification of the harmonic levels.

POWER QUALITY FOR THE ELECTRICAL CONTRACTOR PQ Standards
Electrotek Concepts, Inc.page 10
Harmonic distortion levels can be characterized by the complete harmonic spectrum withmagnitudes and phase angles of each individual harmonic component. It is also common touse a single quantity, the Total Harmonic Distortion, as a measure of the magnitude ofharmonic distortion. For currents, the distortion values must be referred to a constant base(e.g. the rated load current or demand current) rather than the fundamental component.This provides a constant reference while the fundamental can vary over a wide range.
Harmonic evaluations are often going to involve a combination of measurements andanalysis (possibly simulations). It is important to understand that harmonics are acontinuous phenomena, rather than a disturbance (like a transient). Because harmonics arecontinuous, they are best characterized by measurements over time so that the timevariations (Figure 6) and the statistical characteristics (Figure 7) can be determined. Thesecharacteristics describing the harmonic variations over time should be determined alongwith snapshots of the actual waveforms and harmonic spectrums at particular operatingpoints.
Time Trend for Voltage THD
05/26 06/02 06/09 06/16 06/23 06/30 07/070.6
0.8
1.0
1.2
1.4
1.6
1.8
Time
Figure 6. Harmonic variations with time.
Voltage THD Histogram
0.0 0.5 1.0 1.5 2.0 0
25
50
75
100
125
150
175
0
20
40
60
80
100
THD (%)
Coun
t
Cum
ulat
ive P
roba
bilit
y (%
)
Figure 7. Statistical representation of harmonic variations with time.
POWER QUALITY FOR THE ELECTRICAL CONTRACTOR PQ Standards
Electrotek Concepts, Inc.page 11
Harmonic Evaluations on the Utility System
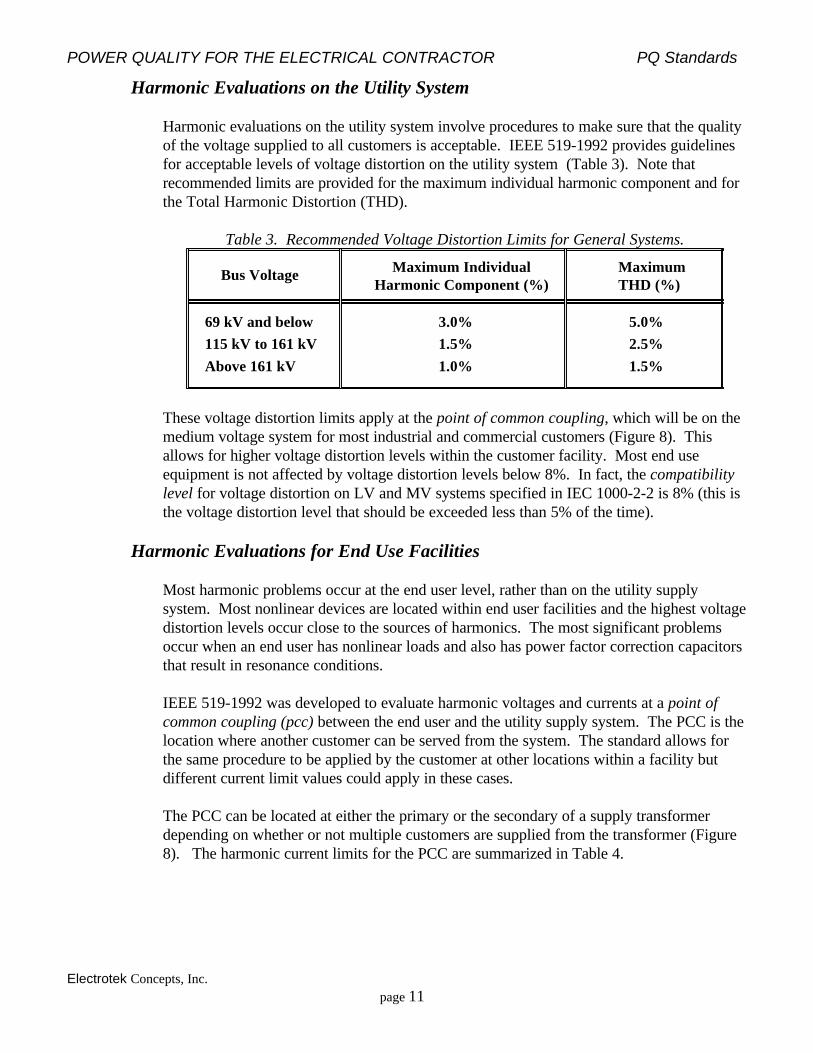
Harmonic evaluations on the utility system involve procedures to make sure that the qualityof the voltage supplied to all customers is acceptable. IEEE 519-1992 provides guidelinesfor acceptable levels of voltage distortion on the utility system (Table 3). Note thatrecommended limits are provided for the maximum individual harmonic component and forthe Total Harmonic Distortion (THD).
Table 3. Recommended Voltage Distortion Limits for General Systems.
Maximum IndividualHarmonic Component (%)
MaximumTHD (%)
Bus Voltage
69 kV and below 3.0% 5.0%
115 kV to 161 kV 1.5% 2.5%
Above 161 kV 1.0% 1.5%
These voltage distortion limits apply at the point of common coupling, which will be on themedium voltage system for most industrial and commercial customers (Figure 8). Thisallows for higher voltage distortion levels within the customer facility. Most end useequipment is not affected by voltage distortion levels below 8%. In fact, the compatibilitylevel for voltage distortion on LV and MV systems specified in IEC 1000-2-2 is 8% (this isthe voltage distortion level that should be exceeded less than 5% of the time).
Harmonic Evaluations for End Use Facilities
Most harmonic problems occur at the end user level, rather than on the utility supplysystem. Most nonlinear devices are located within end user facilities and the highest voltagedistortion levels occur close to the sources of harmonics. The most significant problemsoccur when an end user has nonlinear loads and also has power factor correction capacitorsthat result in resonance conditions.
IEEE 519-1992 was developed to evaluate harmonic voltages and currents at a point ofcommon coupling (pcc) between the end user and the utility supply system. The PCC is thelocation where another customer can be served from the system. The standard allows forthe same procedure to be applied by the customer at other locations within a facility butdifferent current limit values could apply in these cases.
The PCC can be located at either the primary or the secondary of a supply transformerdepending on whether or not multiple customers are supplied from the transformer (Figure8). The harmonic current limits for the PCC are summarized in Table 4.

POWER QUALITY FOR THE ELECTRICAL CONTRACTOR PQ Standards
Electrotek Concepts, Inc.page 12
Utility System
Customer Under Study
Other UtilityCustomers
PCC
IL
Utility System
Customer Under Study
Other UtilityCustomers
PCC
IL
Figure 8. Selection of the PCC where other customers can be supplied.
Using this approach, harmonic limits for individual loads are not specified. The limits for anindividual load, such an adjustable speed drive, depend on the impact of that load on theharmonic levels for the whole facility. This is different from the approach taken in IEC1000-3-2 (formerly IEC 555-2) where limits for individual loads less than 16 Amps arespecified. The IEEE 519 approach provides more flexibility in identifying the mosteconomical location to limit the harmonics.
Table 4. Harmonic Current Limits for Individual End Users from IEEE 519-1992.
HARMONIC CURRENT DISTORTION LIMITS IN % OF ILv kV≤ 69
I Isc L/ h < 11 11 17≤ <h 17 23≤ <h 23 35≤ <h 35 ≤ h TDD<20 4.0 2.0 1.5 0.6 0.3 5.0
20-50 7.0 3.5 2.5 1.0 0.5 8.050-100 10.0 4.5 4.0 1.5 0.7 12.0
100-1000 12.0 5.5 5.0 2.0 1.0 15.0>1000 15.0 7.0 6.0 2.5 1.4 20.0
69 161kV v kV< ≤<20* 2.0 1.0 0.75 0.3 0.15 2.520-50 3.5 1.75 1.25 0.5 0.25 4.050-100 5.0 2.25 2.0 1.25 0.35 6.0
100-1000 6.0 2.75 2.5 1.0 0.5 7.5>1000 7.5 3.5 3.0 1.25 0.7 10.0
v kV> 161< 50 2.0 1.0 0.75 0.3 0.15 2.5≥ 50 3.5 1.75 1.25 0.5 0.25 4.0

POWER QUALITY FOR THE ELECTRICAL CONTRACTOR PQ Standards
Electrotek Concepts, Inc.page 13
Notes to current distortion limits:
ISC is the short circuit current at the point of common coupling.
IL is the maximum demand load current (fundamental frequency component) at thepoint of common coupling. It can be calculated as the average of the maximummonthly demand currents for the previous 12 months or it may have to be estimated.
* All power generation equipment applications are limited to these values of currentdistortion regardless of the actual short circuit ratio ISC/IL.
The tables of individual harmonic component limits apply to the odd harmoniccomponents.
Even harmonic components are limited to 25% of the limits in the tables.
Current distortion which results in a dc offset is not allowed.
Total Demand Distortion (TDD) is defined as:
TDD
I
I
nn
L
= ×=
∞
∑ 2
2 100%
where:In = magnitude of individual harmonic components (rms amps)n = harmonic orderIL = maximum demand load current (rms amps) defined above
If the harmonic producing loads consist of power converters with pulse number (q)higher than six, the limits indicated in the table are increased by a factor equal to
q
6provided that the magnitudes of the noncharacteristic harmonics are less than 25%of the limits specified in the table.
Evaluating Impacts of Harmonic Currents on Transformer Heating
Transformer heating is one of the primary concerns associated with harmonic currentdistortion levels in a facility. ANSI/IEEE Standard C57 series states that a transformer canonly be expected to carry its rated current if the current distortion is less than 5%. If thecurrent distortion exceeds this value, then some amount of derating is required.ANSI/IEEE Standard C57.110 provides calculation procedures that can be used to evaluatethe required derating as a function of the expected current harmonic spectrum and thetransformer design. The primary cause of the concern is that the transformers can beoverheated by distorted load currents that cause higher eddy current losses inside thetransformer than were anticipated by the designer.

POWER QUALITY FOR THE ELECTRICAL CONTRACTOR PQ Standards
Electrotek Concepts, Inc.page 14
The required transformer derating is calculated based on the additional heating that can beexpected for a specific harmonic current spectrum and the eddy current loss factor for thetransformer. The derating is expressed as the per unit value of a particular distorted currentthat will cause the same heating as the rated sinusoidal current.
It has become popular to express this derating in terms of the k-factor of the load currentwaveform that the transformer must supply. It is possible to buy transformers with a k-factor rating that can be used without derating for current waveforms that have k-factors upto the k-factor rating of the transformer.
I IP
K Ppurms derated h
EC R
EC R
( )*
( )= =+
+∑ −
−
2 1
1
where:
( )K
I h
I
h
h
=∑
∑
2 2
2
* (k-factor)
PEC-R = eddy current loss factor
h = harmonic number
Ih = harmonic current
The most common application where transformer derating for harmonics is needed involvesa 480/208 volt stepdown transformer where a significant percentage of the load is singlephase electronic equipment (e.g. PCs). A typical current waveform, k-factor, andtransformer derating as a function of the transformer eddy current loss factor is given inFigure 11.
K=7.6
Pec-r (%)
Imax(%)
45%50%55%60%65%70%75%80%85%90%95%
100%
1 2 3 4 5 6 7 8 9 10 11 12 13 14 15 16 17 18 19 20
Figure 11. Transformer derating for supplying single phase electronic loads as a functionof the transformer eddy current loss factor.

POWER QUALITY FOR THE ELECTRICAL CONTRACTOR PQ Standards
Electrotek Concepts, Inc.page 15
Evaluating Neutral Conductor Loading due to Harmonics
Single phase nonlinear loads can have significant harmonic components at triplenfrequencies (3, 9, 15, etc.). When these loads are combined in a three phase circuit, thetriplen harmonics show up as zero sequence components. That means they add in theneutral. If there are 10 amps of third harmonic on each phase in the three phase circuit, theneutral current will include 30 amps of third harmonic.For this reason, neutral currents in 120/208 circuits in many commercial buildings areactually higher than the phase currents. The neutral currents are dominated by thirdharmonic components from single phase electronic loads, like PCs. They can be as high as173% of the rms phase currents (Figure 12 is an example of measured waveformsillustrating this condition). Neutral currents can also be a concern on distribution systemsthat supply single phase customers or three phase customers with wye-grounded/wye-grounded transformers.
Unfortunately, there are no standards limiting the harmonics from these single phase loads(IEC 1000-3-2 provides limits for the European Community) and there are no requirementsthat the neutral conductors in these facilities be made larger to handle the higher currentmagnitudes. This is a problem that the building designer and facility electrical engineermust be aware of to make sure that neutral circuits are not overloaded.
Phase A (50 Amps)
Phase B (50 Amps)
Phase C (57 Amps)
Neutral (82 Amps)
Figure 12. Phase currents and neutral current for a circuit dominated by single phaseelectronic loads.
Standards for Voltage Fluctuations (Flicker)
Voltage fluctuations are systematic variations of the voltage envelope or a series of randomvoltage changes, the magnitude of which does not normally exceed the voltage rangesspecified by ANSI C84.1. These fluctuations are often referred to as flicker. They are

POWER QUALITY FOR THE ELECTRICAL CONTRACTOR PQ Standards
Electrotek Concepts, Inc.page 16
characterized by the magnitude of the voltage changes and the frequency with which theyoccur. A plot of the rms voltage magnitude vs. time can be used to illustrate the variations.
The most important impact of these fluctuations is that they cause variations in the lightoutput of various lighting sources. Sensitivity curves have been developed for incandescentlighting that show how the voltage fluctuations can cause unacceptable variations in thelight output (Figure 13), but there is no one curve that is universally applied as a standard.In a survey of electric utility practices, it was found that the GE flicker curve published in1951 is the most popular curve used to apply limits.
Figure 13. Flicker sensitivity curve.
In the IEC standards, a much more rigorous approach is used for flicker evaluations. IEC868 provides a detailed specification for the flickermeter which must be used to characterizeflicker levels. This instrument provides an output which is per unitized to 1.0 for the levelof flicker that should be noticeable with a 40 Watt bulb on a 220 volt supply.Unfortunately, light bulbs on 120 volt systems behave differently (larger filaments) so theoutput of the flickermeter must be adjusted for use in this country. IEC 1000-3-3 (formerlyIEC 555-3) also provides limits for individual appliances in terms of the voltage fluctuationsthat can be caused.
Voltage fluctuations are caused by changing load characteristics. Arc furnaces, motorstarting, sawmills, and arc welding are typical sources of voltage fluctuations. Controllingthe fluctuations can be very difficult. Some of these loads, such as arc furnaces, arecontinually varying at a rate that requires compensation with very fast response. This canbe accomplished with continuously varying compensation, such as a static var system.Other power electronics-based technologies with real time control (active series voltageregulator) are under development.

POWER QUALITY FOR THE ELECTRICAL CONTRACTOR PQ Standards
Electrotek Concepts, Inc.page 17
Standards for Voltage Sags and Interruptions
Voltage sags fall in the category of short duration voltage variations. According to IEEEP1159 and IEC definitions, these include variations in the fundamental frequency voltagethat last less than one minute. These variations are best characterized by plots of the rmsvoltage vs time (Figure 14) but it is often sufficient to describe them by a voltage magnitudeand a duration that the voltage is outside of specified thresholds. It is usually not necessaryto have detailed waveform plots since the rms voltage magnitude is of primary interest.The voltage variations can be a momentary low voltage (voltage sag), high voltage(voltage swell), or loss of voltage (interruption).
Voltage sags are typically caused by a fault somewhere on the power system. The voltagesag occurs over a significant area while the fault is actually on the system. As soon as afault is cleared by a protective device, voltage returns to normal on most parts of thesystem, except the specific line or section that is actually faulted. The typical duration for atransmission system fault is about six cycles. Distribution system faults can havesignificantly longer durations, depending on the protection philosophy. The voltagemagnitude during the fault will depend on the distance from the fault, the type of fault, andthe system characteristics.
June 26, 1994 at 23:30:10 PQNode LocalITW_INPhase A VoltageRMS Variation
Trigger
0 0.1 0.2 0.3 0.4 0.5 0.6 0.7 0.8
708090
100110120
Time (Seconds)
% Vo
lts
0 25 50 75 100 125 150 175
-150-100-50
050
100150
Time (mSeconds)
% Vo
lts
Duration0.117 Sec
Min 74.70Ave 94.11Max 98.58Ref Cycle
48462
BMI/Electrotek
Figure 14. Voltage sag that could cause equipment misoperation. It is caused by a remotetransmission line fault condition on the power system
Characterizing equipment sensitivity to voltage sags
Voltage sags are the most important power quality variation affecting many types ofindustrial customers. As industrial processes have become more automated, the equipmenthas become increasingly sensitive to these momentary undervoltages. If a single piece ofequipment in the process is affected by the voltage sag, the entire process can beinterrupted.

POWER QUALITY FOR THE ELECTRICAL CONTRACTOR PQ Standards
Electrotek Concepts, Inc.page 18
Since we characterize the voltage sags with a magnitude and duration, it is useful todescribe equipment sensitivity in the same manner. This is done with a magnitude/durationplot (Figure 15). The Computer and Business Electronics Manufacturers Association(CBEMA) was the first to use this concept to describe equipment sensitivity. They came upwith the “CBEMA curve” that has become the benchmark for describing equipmentsusceptibility. The curve is reproduced in IEEE Standard 446 (The Orange Book).Unfortunately, equipment doesn’t behave according to the CBEMA curve. Someequipment is less sensitive and some equipment, like the ASD in Figure 15, is much moresensitive. A working group in IEEE (IEEE P1346) is currently working on guidelines forcompatibility of industrial process equipment.
Figure 15. Example of equipment sensitivity to voltage sags.
Characterizing system performance
End users can evaluate the economics of power conditioning equipment if they haveinformation describing the expected system voltage sag performance. A chart like the one inFigure 16 can be used in conjunction with equipment sensitivity characteristics to estimatethe number of times the process will be interrupted and the associated costs. There arecurrently no standards describing how to provide this information to customers.

POWER QUALITY FOR THE ELECTRICAL CONTRACTOR PQ Standards
Electrotek Concepts, Inc.page 19
Voltage Sags(Percent Normal Voltage)
Events Per Year
0
5
10
15
20
25
30
35
40
<50% <60% <70% <80% <85% <90%
46kV
115kV
345kV
1.85.0
10.315.2
23.3
33.9
FaultLocation
Figure 16. Example of expected voltage sag performance at a customer location.
What can customers expect in terms of the number of voltage sags per year? This numberchanges from year to year and is dependent on many factors which are specific to thecustomer location (lightning flash density, feeder lengths, animals, trees, etc.). However, itis possible to develop some average numbers that provide a benchmark for comparison.The Distribution Power Quality Monitoring project sponsored by the Electric PowerResearch Institute is characterizing average performance on distribution systems across thecountry. The results in Figure 17 represent one year of monitoring at 24 different utilities,as reported in a paper presented at the PQA 94 conference in Amsterdam.
Interruption and Sag Rate as a Function of Voltage Magnitude
Voltage (% of Site's Long-Term Average)
Eve
nts
per
Sit
e
per
yea
r
0
5
10
15
20
25
0 5 10 15 20 25 30 35 40 45 50 55 60 65 70 75 80 85
0.00%
10.00%
20.00%
30.00%
40.00%
50.00%
60.00%
70.00%
80.00%
90.00%
100.00%
Cu
mu
lati
ve P
rob
abili
ty (
%)
"Customer Events" for All Sites, Average of Feeder Sections
Feeder Substations
Feeder Middle
Feeder End
Feeder Mean
Interruptions Voltage <=10% 6.14 8.11 11.20 8.47
Sags Voltage >10% and <=90% 64.30 69.36 64.81 66.16
Sags and Interruptions 70.43 77.46 76.01 74.63
Figure 17. Voltage sag and momentary interruption performance for a distributionsystem sites in the United States (preliminary results from EPRI DPQ project).

POWER QUALITY FOR THE ELECTRICAL CONTRACTOR PQ Standards
Electrotek Concepts, Inc.page 20
The results presented in Figure 17 are very important because they begin to define thebaseline power quality that can be expected at a typical distribution feeder supply point.Customers can use this information to help define the voltage variations that theirequipment must be able to withstand. It is useful to illustrate the use of the informationwith an example:
Assume that we want to know how many voltage sags occur per year where the voltagegoes below 70% of nominal voltage at a typical distribution system supply point. Thedata on the plot is for the average of all feeder sites in the project (the feeder mean inthe table). Using the cumulative probability line and the right side axis, we can seethat 40% of the events resulted in sags below 70%. The total number of events per year(including interruptions) is given in the table as 74.63. Therefore, the number of sagsbelow 40% (including interruptions) will be 40% of 74.63, or about 30 events per year.
Standards for Transient Voltages and Surge Suppression
The term transients is normally used to refer to fast changes in the system voltage orcurrent. Transients are disturbances, rather than steady state variations such as harmonicdistortion or voltage unbalance. Disturbances can be measured by triggering on theabnormality involved. For transients, this could be the peak magnitude, the rate of rise, orjust the change in the waveform from one cycle to the next. Transients can be divided intotwo subcategories, impulsive transients and oscillatory transients, depending on thecharacteristics.
Transients are normally characterized by the actual waveform, although summarydescriptors can also be developed (peak magnitude, primary frequency, rate-of-rise, etc.).Figure 18 gives a capacitor switching transient waveform. This is one of the mostimportant transients that is initiated on the utility supply system and can affect the operationof end user equipment. Other important causes of transient voltages include lightningsurges and switching operations within a facility.
0 20 40 60 80 100-1.5
-1.0
-0.5
0.0
0.5
1.0
1.5
2.0
Time (mS)
34.5 kV Bus VoltageCapacitor Switching Transient
Figure 18. Capacitor Switching Transient

POWER QUALITY FOR THE ELECTRICAL CONTRACTOR PQ Standards
Electrotek Concepts, Inc.page 21
Transient problems are solved by controlling the transient at the source, changing thecharacteristics of the system affecting the transient or by protecting equipment so that it isnot impacted. For instance, capacitor switching transients can be controlled at the sourceby closing the breaker contacts close to a voltage zero crossing. Magnification of thetransient can be avoided by not using low voltage capacitors within the end user facilities.The actual equipment can be protected with filters or surge arresters.
ANSI/IEEE C62.41-1991
The most well-known standard in the field of transient overvoltage protection isANSI/IEEE C62.41-1991, IEEE Guide for Surge Voltages in Low Voltage AC PowerCircuits. This standard defines the transient environment that equipment may see andprovides specific test waveforms that can be used for equipment withstand testing. Thetransient environment is a function of the equipment or surge suppressor location within afacility:
• Category A: Anything on the load side of a wall socket outlet.
• Category B: Distribution system of the building.
• Category C: Outside the building or on the supply side of the main distributionboard for the building.
Test waveforms are probably the most important contribution of C62.41. The standardrecommends five different surge waveforms: two as basic waveforms and three assupplementary waveforms. The listing of these five types of waveforms is not meant toimply that all equipment should be tested with respect to all five waveforms. Thesupplementary waveforms are "less common in most environments and may be includedwhen sufficient evidence is available to warrant their use." These are the waveforms:
1.2/50 - 8/20 microsecond Combination Wave (Basic Wave). Traditionally, the1.2/50 us voltage waveform was used for testing the basic insulation level (BIL) ofinsulation which is approximately an open circuit until the insulation fails. The 8/20us current waveform was used to inject large currents into surge protective devices.Since both the open circuit voltage and the short circuit current are different aspectsof the same phenomenon, such as an overstress caused by indirect lightning, it isreasonable to combine them into a single waveform.
0.5 usec - 100 kHz Ring Wave. This is a decaying oscillatory wave with an initialrise time of 0.5 usec. Different characteristics are specified for Category A andCategory B environments. The short circuit current waveform for the 100 kHz ringwave is not specified. It is suggested that the 100 kHz ring wave is an appropriatetest waveform for electronic equipment that operates in a building, but not for surgeprotective devices.

POWER QUALITY FOR THE ELECTRICAL CONTRACTOR PQ Standards
Electrotek Concepts, Inc.page 22
10/1000 microsecond Unidirectional Wave (Supplementary Wave). Thiswaveform has an extended tail in order to test insulation which may be sensitive tothe duration of the transient. Some transformer insulation falls in this category.
5 kHz Ring Wave (Supplementary Wave). This waveform is designed torepresent a class of transients that can occur associated with switching of capacitorsor coupling of capacitor switching transients into the LV environment.
Electrical Fast Transient (Supplementary Wave). This waveform and thecoupling to the mains are specified in IEC 801-4. The EFT is only intended fortesting electronic equipment for susceptibility to upset by showering arcs from usinga mechanical switch in series with an inductive load. Since the energy levels are solow, this waveform is generally not required for surge protective devices.
UL 1449
Underwriters Laboratories is a nonprofit company in the USA that tests electrical andelectronic apparatus for safety and flammability. UL defines requirements for transientvoltage surge suppressors in their standard 1449. Two classes are defined for tests:
1. permanently connected (C62.41 Category B)
2. cord-connected or direct plug-in (C62.41 Category B or A)
An important part of the UL 1449 certification is the assignment of a "transient suppressionvoltage rating". UL 1449 uses the combination wave described in C62.41 for testingpermanently connected SPDs with a peak short circuit current of 3 kA. For the cord-connected and direct plug-in SPDs, the peak short circuit current is only 0.5 kA. All SPDsare tested only with surge waveforms that have a peak open-circuit voltage of 6 kV.
The average of 6 test measurements of clamping voltage is rounded to the next higherstandard rating from the following list:
0.33 kV, 0.4 kV, 0.5 kV, 0.6 kV, 0.8 kV, 1.0 kV, 1.2 kV, 1.5 kV, 2.0 kV, 2.5 kV, 3kV, 4 kV, 5 kV, 6 kV
This suppression rating was intended as a guide to selecting SPDs for insulationcoordination (as in IEC 664) and not protection of electronic equipment, which is why thereare no voltages below 330 Volts in the list of standard values.
What Still Needs to be Done?
In the area of standards, we need to develop guidelines for system performance. Theseperformance standards should include at least:

POWER QUALITY FOR THE ELECTRICAL CONTRACTOR PQ Standards
Electrotek Concepts, Inc.page 23
• Interruptions (including momentary)• Voltage sags• Steady state voltage regulation• Voltage unbalance (negative sequence)• Harmonic distortion in the voltage• Transient voltages
The EPRI DPQ Project will provide an excellent statistical database that may be the basisfor developing some of these standards. In turn, equipment manufacturers must be able toprovide information describing the sensitivity of their equipment to these variations. Withinformation on typical system performance based on historical and calculated data alongwith information on equipment sensitivity, customers will be able to perform economicevaluations of power conditioning alternatives.
Ongoing monitoring efforts and case studies will provide the information to characterizesystem performance and to understand the susceptibility of different types of customersystems. Monitoring of power quality should become a more standard part of the overallsystem monitoring (both at the utility level and the customer level). These monitoringefforts should be coordinated between the utility and the customer with emphasis on remotemonitoring and data collection systems with more automated data analysis capabilities.
Analytical tools will also benefit from the increased level of monitoring and characterization.Models should be improved and the tools themselves should become easier to use.
The overall focus needs to be on economics using a systems approach (Figure 19). Weneed to develop tools that can help find the optimum system design including powerconditioning for sensitive equipment. The alternatives should include improved immunity atthe equipment level, power conditioning at the equipment level, power conditioning at morecentralized locations within the customer system, and measures to improve performance onthe utility system.
3 - OverallProtection
Inside Plant
CONTROLS
MOTORS
OTHER LOADS
Sensitive Process Machine
32
1
2 - ControlsProtection
1 - EquipmentSpecifications
INCREASING COST
UtilitySource
4
4 - Utility Solutions
Feeder orGroup ofMachines
Figure 19. Economic Evaluation of Alternatives for Power Quality Improvement
POWER QUALITY FOR THE ELECTRICAL CONTRACTOR PQ Standards
Electrotek Concepts, Inc.page 24
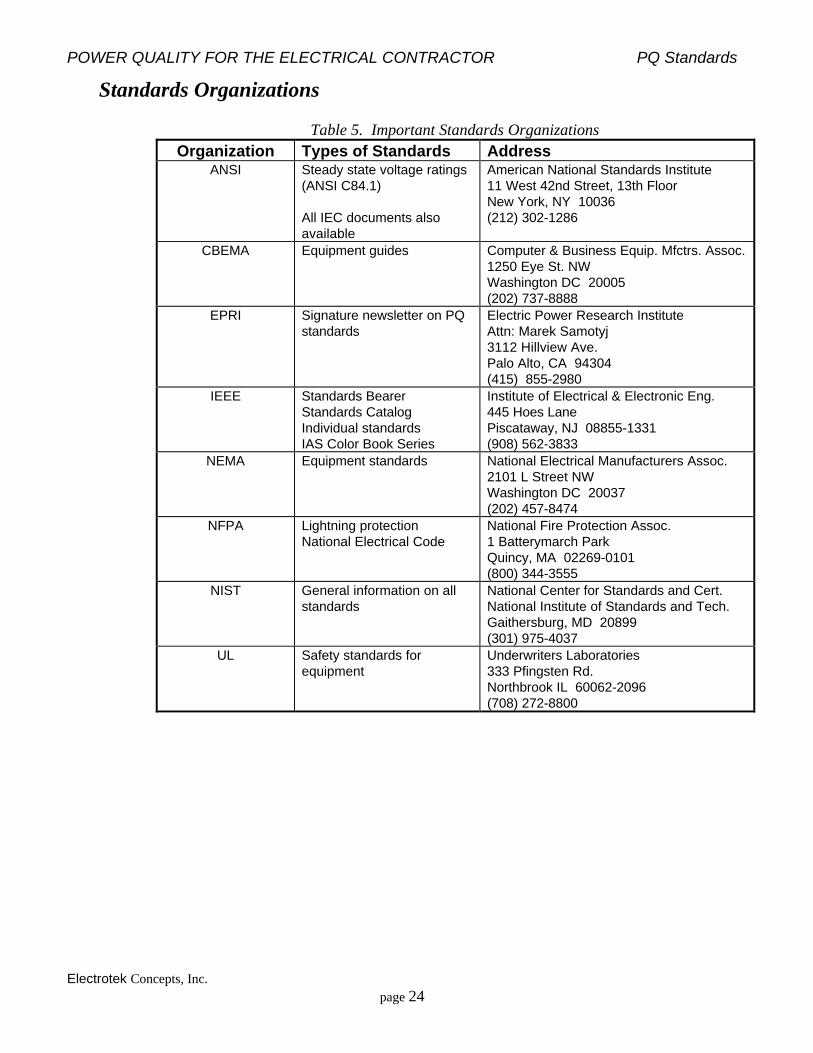
Standards Organizations
Table 5. Important Standards OrganizationsOrganization Types of Standards Address
ANSI Steady state voltage ratings(ANSI C84.1)
All IEC documents alsoavailable
American National Standards Institute11 West 42nd Street, 13th FloorNew York, NY 10036(212) 302-1286
CBEMA Equipment guides Computer & Business Equip. Mfctrs. Assoc.1250 Eye St. NWWashington DC 20005(202) 737-8888
EPRI Signature newsletter on PQstandards
Electric Power Research InstituteAttn: Marek Samotyj3112 Hillview Ave.Palo Alto, CA 94304(415) 855-2980
IEEE Standards BearerStandards CatalogIndividual standardsIAS Color Book Series
Institute of Electrical & Electronic Eng.445 Hoes LanePiscataway, NJ 08855-1331(908) 562-3833
NEMA Equipment standards National Electrical Manufacturers Assoc.2101 L Street NWWashington DC 20037(202) 457-8474
NFPA Lightning protectionNational Electrical Code
National Fire Protection Assoc.1 Batterymarch ParkQuincy, MA 02269-0101(800) 344-3555
NIST General information on allstandards
National Center for Standards and Cert.National Institute of Standards and Tech.Gaithersburg, MD 20899(301) 975-4037
UL Safety standards forequipment
Underwriters Laboratories333 Pfingsten Rd.Northbrook IL 60062-2096(708) 272-8800

POWER QUALITY FOR THE ELECTRICAL CONTRACTOR PQ Standards
Electrotek Concepts, Inc.page 25
Summary of Trends
Ongoing standards development should help make all parties more aware of power qualityconcerns and provide better tools and techniques for developing the optimum solutions toproblems. Some important trends that should result include:
1. End-Use Equipment. Equipment must become less sensitive to power qualityvariations. As we understand the economics involved, the immunity characteristicsof the equipment will become part of the purchase decision making process. Whenthis happens, manufacturers will consider it important enough to improve theimmunity. In the long run, the most economical place to solve most power qualityproblems will be in the end-use equipment itself.
2. Customers. Customers will have a better understanding of power quality concernsand will include these concerns in their facility designs. The electrical system layoutwill consider the power conditioning requirements of sensitive and criticalequipment. Power conditioning options will be part of the design stage. Powerfactor correction and harmonic control will be considered together.
3. Utilities. Utilities will be able to provide more detailed information to customersregarding the expected system performance as it may affect customer loads. Theutility may also offer alternatives for higher levels of performance that may involveadditional investment on the supply system or working with the customer toimplement power conditioning options within the customer system.
These trends seem inevitable. However, getting there may be a long road and will requirecontinued and improved coordination between utilities, their customers, and equipmentmanufacturers. The coordination is usually achieved through the development of standardsthat all parties consider acceptable.