power finance corporation limitedpfcindia.com/hnsite/documentrepository/ckfinder/files/4... ·...
TRANSCRIPT
Power Finance Corporation LimitedA Navratna PSU
Performance Highlights Quarter & Half-Year ended
(Standalone, Un-audited) 30th Sep 2009
We Create Possibility of a Better Tomorrow….
Oct-09S M T W T F S
1 2 3
4 5 6 7 8 9 10
11 12 13 14 15 16 17
18 19 20 21 22 23 24
25 26 27 28 29 30 31
2
We Create Possibility of a Better Tomorrow….
Focus & Strategy
Operational Performance
Shareholding Pattern
PFC Overview
PFC Overview
3
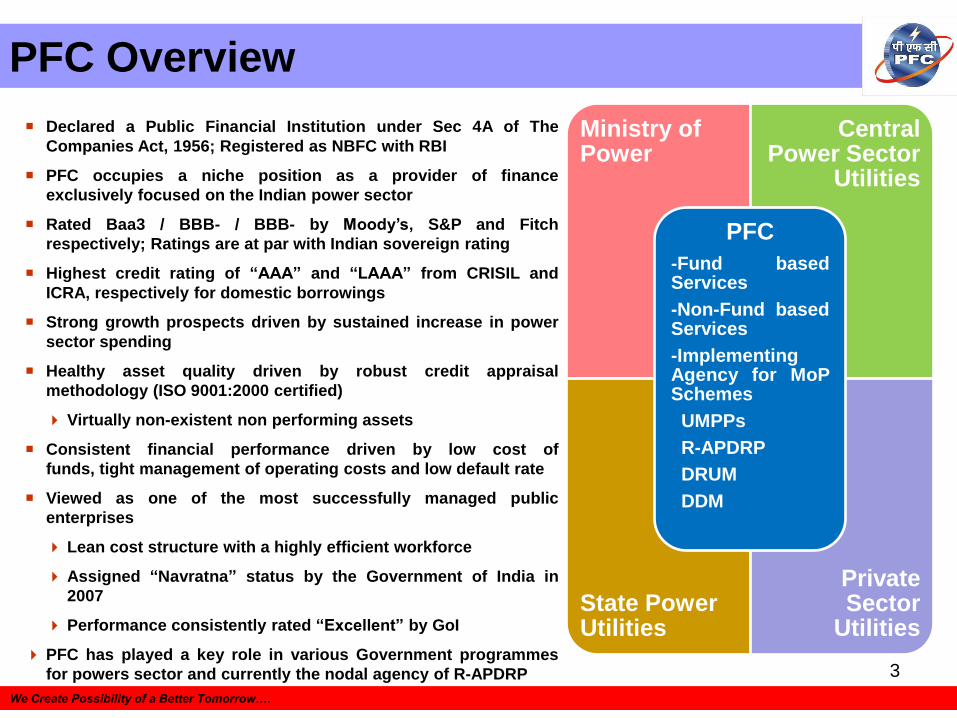
Declared a Public Financial Institution under Sec 4A of The
Companies Act, 1956; Registered as NBFC with RBI
PFC occupies a niche position as a provider of finance
exclusively focused on the Indian power sector
Rated Baa3 / BBB- / BBB- by Moody‟s, S&P and Fitch
respectively; Ratings are at par with Indian sovereign rating
Highest credit rating of “AAA” and “LAAA” from CRISIL and
ICRA, respectively for domestic borrowings
Strong growth prospects driven by sustained increase in power
sector spending
Healthy asset quality driven by robust credit appraisal
methodology (ISO 9001:2000 certified)
Virtually non-existent non performing assets
Consistent financial performance driven by low cost of
funds, tight management of operating costs and low default rate
Viewed as one of the most successfully managed public
enterprises
Lean cost structure with a highly efficient workforce
Assigned “Navratna” status by the Government of India in
2007
Performance consistently rated “Excellent” by GoI
PFC has played a key role in various Government programmes
for powers sector and currently the nodal agency of R-APDRP
We Create Possibility of a Better Tomorrow….
Ministry of Power
Central Power Sector
Utilities
State Power Utilities
Private Sector
Utilities
PFC
-Fund basedServices
-Non-Fund basedServices
-ImplementingAgency for MoPSchemes
UMPPs
R-APDRP
DRUM
DDM
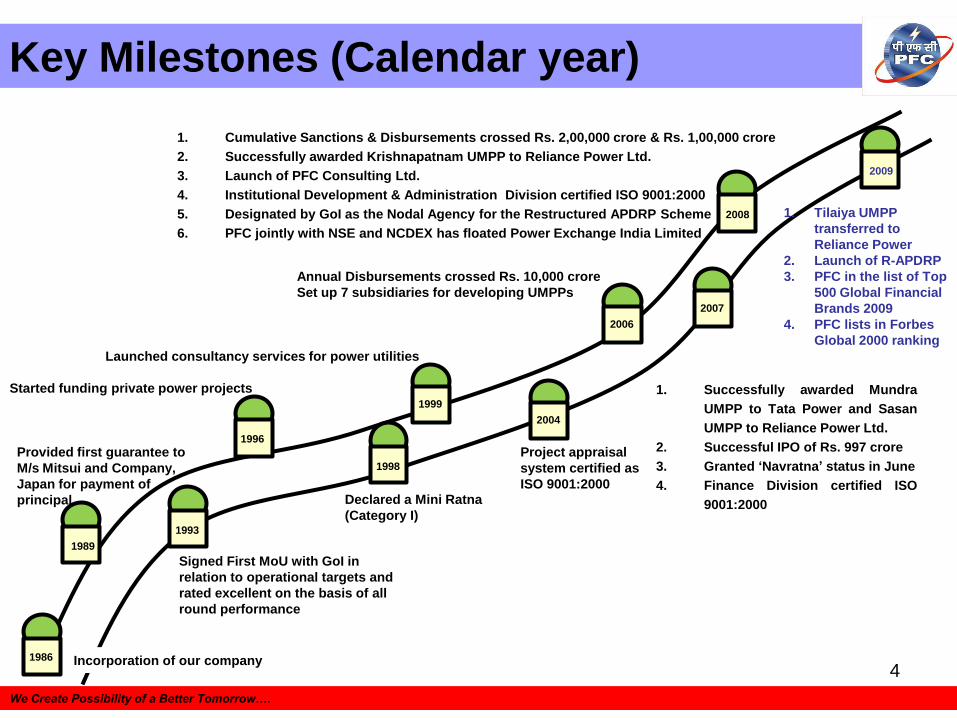
Key Milestones (Calendar year)
Provided first guarantee to
M/s Mitsui and Company,
Japan for payment of
principal
1986
1989
1993
1996
1998
1999
2008
2004
2006
Incorporation of our company
Signed First MoU with GoI in
relation to operational targets and
rated excellent on the basis of all
round performance
Started funding private power projects
Declared a Mini Ratna
(Category I)
Launched consultancy services for power utilities
Project appraisal
system certified as
ISO 9001:2000
Annual Disbursements crossed Rs. 10,000 crore
Set up 7 subsidiaries for developing UMPPs2007
1. Successfully awarded Mundra
UMPP to Tata Power and Sasan
UMPP to Reliance Power Ltd.
2. Successful IPO of Rs. 997 crore
3. Granted „Navratna‟ status in June
4. Finance Division certified ISO
9001:2000
1. Cumulative Sanctions & Disbursements crossed Rs. 2,00,000 crore & Rs. 1,00,000 crore
2. Successfully awarded Krishnapatnam UMPP to Reliance Power Ltd.
3. Launch of PFC Consulting Ltd.
4. Institutional Development & Administration Division certified ISO 9001:2000
5. Designated by GoI as the Nodal Agency for the Restructured APDRP Scheme
6. PFC jointly with NSE and NCDEX has floated Power Exchange India Limited
2009
1. Tilaiya UMPP
transferred to
Reliance Power
2. Launch of R-APDRP
3. PFC in the list of Top
500 Global Financial
Brands 2009
4. PFC lists in Forbes
Global 2000 ranking
4
We Create Possibility of a Better Tomorrow….
5
We Create Possibility of a Better Tomorrow….
Focus & Strategy
Operational Performance
Shareholding Pattern
PFC Overview
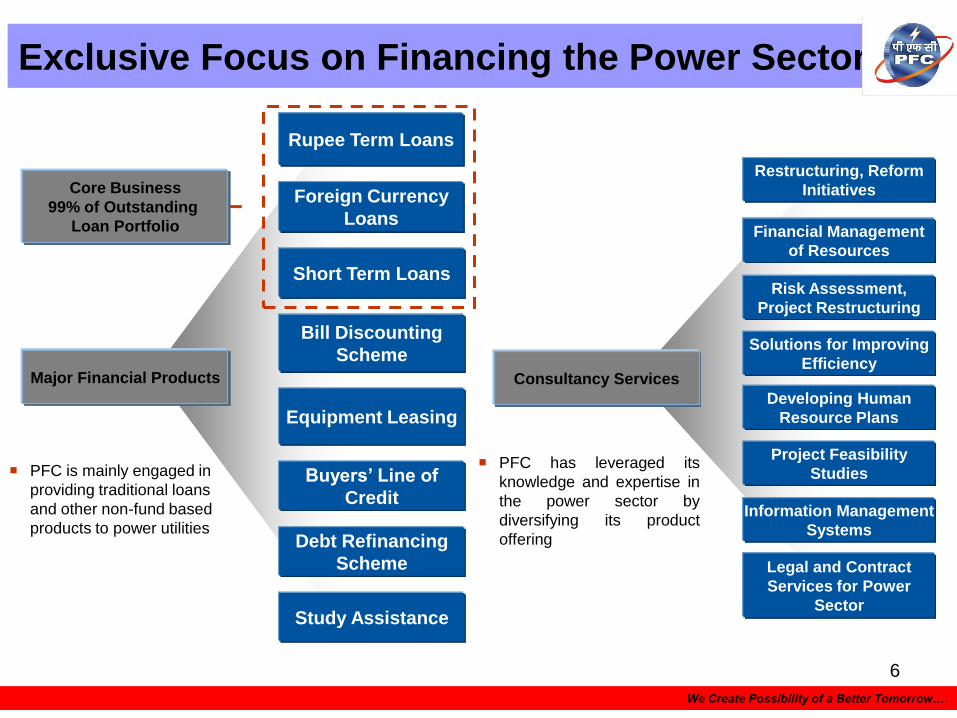
Exclusive Focus on Financing the Power Sector
Foreign Currency
Loans
Short Term Loans
Major Financial Products
Bill Discounting
Scheme
Equipment Leasing
Buyers‟ Line of
Credit
Debt Refinancing
Scheme
Rupee Term Loans
Study Assistance
Consultancy Services
Restructuring, Reform
Initiatives
Financial Management
of Resources
Risk Assessment,
Project Restructuring
Solutions for Improving
Efficiency
Developing Human
Resource Plans
Project Feasibility
Studies
Information Management
Systems
Legal and Contract
Services for Power
Sector
Core Business
99% of Outstanding
Loan Portfolio
PFC has leveraged its
knowledge and expertise in
the power sector by
diversifying its product
offering
PFC is mainly engaged in
providing traditional loans
and other non-fund based
products to power utilities
We Create Possibility of a Better Tomorrow….
6
7
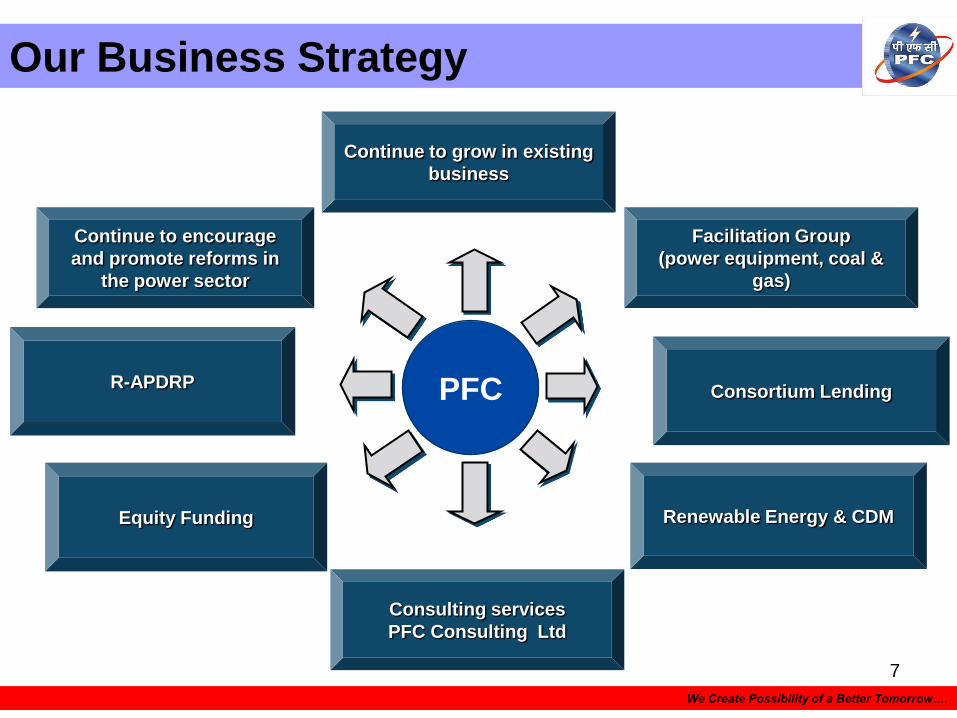
Our Business Strategy
We Create Possibility of a Better Tomorrow….
R-APDRP
Equity Funding
Continue to encourage
and promote reforms in
the power sector
Consulting services
PFC Consulting Ltd
Renewable Energy & CDM
Consortium LendingPFC
Facilitation Group
(power equipment, coal &
gas)
Continue to grow in existing
business
8
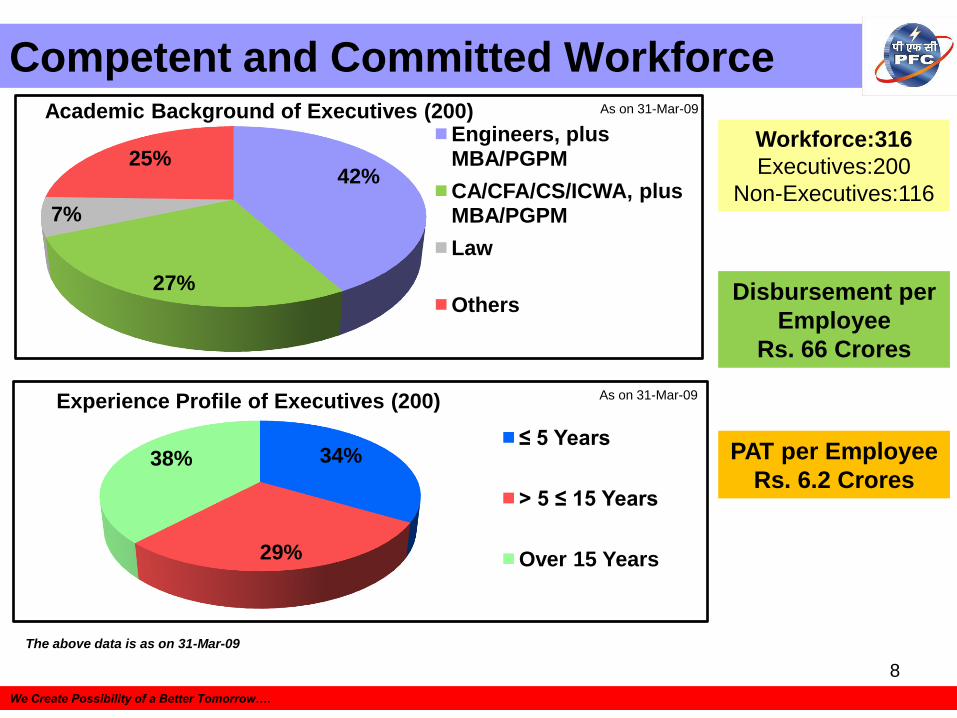
Competent and Committed Workforce
We Create Possibility of a Better Tomorrow….
34%
29%
38%≤ 5 Years
> 5 ≤ 15 Years
Over 15 Years
Experience Profile of Executives (200) As on 31-Mar-09
Workforce:316
Executives:200
Non-Executives:116
Disbursement per
Employee
Rs. 66 Crores
PAT per Employee
Rs. 6.2 Crores
42%
27%
7%
25%Engineers, plus MBA/PGPM
CA/CFA/CS/ICWA, plus MBA/PGPM
Law
Others
Academic Background of Executives (200) As on 31-Mar-09
The above data is as on 31-Mar-09

9
We Create Possibility of a Better Tomorrow….
Focus & Strategy
Operational Performance
Shareholding Pattern
PFC Overview
10
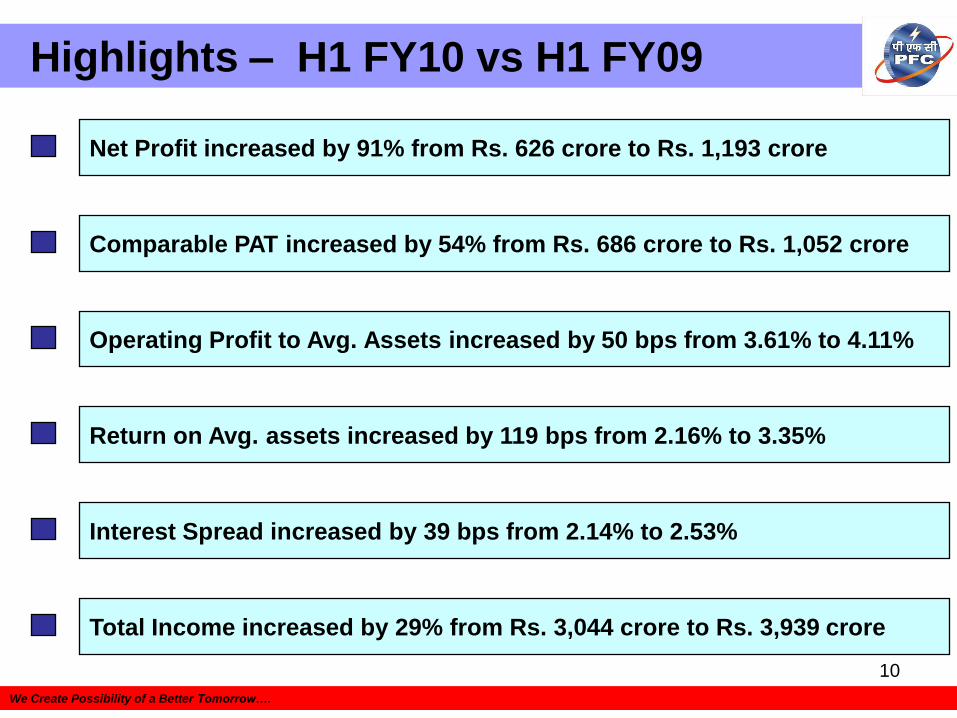
Highlights – H1 FY10 vs H1 FY09
We Create Possibility of a Better Tomorrow….
Operating Profit to Avg. Assets increased by 50 bps from 3.61% to 4.11%
Interest Spread increased by 39 bps from 2.14% to 2.53%
Net Profit increased by 91% from Rs. 626 crore to Rs. 1,193 crore
Return on Avg. assets increased by 119 bps from 2.16% to 3.35%
Comparable PAT increased by 54% from Rs. 686 crore to Rs. 1,052 crore
Total Income increased by 29% from Rs. 3,044 crore to Rs. 3,939 crore
11
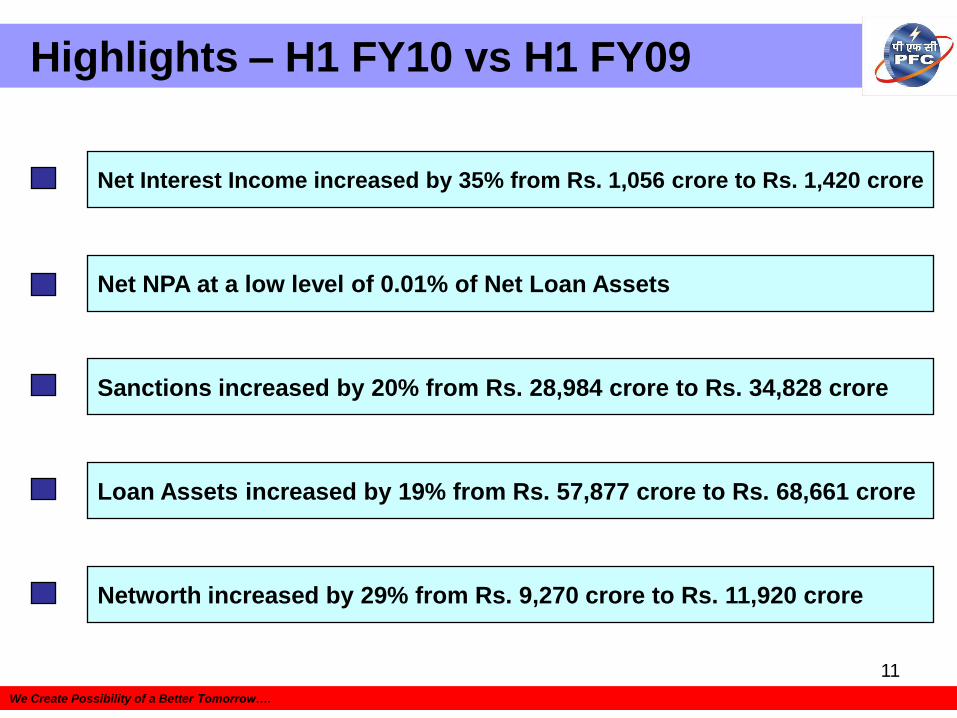
Highlights – H1 FY10 vs H1 FY09
We Create Possibility of a Better Tomorrow….
Sanctions increased by 20% from Rs. 28,984 crore to Rs. 34,828 crore
Loan Assets increased by 19% from Rs. 57,877 crore to Rs. 68,661 crore
Networth increased by 29% from Rs. 9,270 crore to Rs. 11,920 crore
Net NPA at a low level of 0.01% of Net Loan Assets
Net Interest Income increased by 35% from Rs. 1,056 crore to Rs. 1,420 crore
12
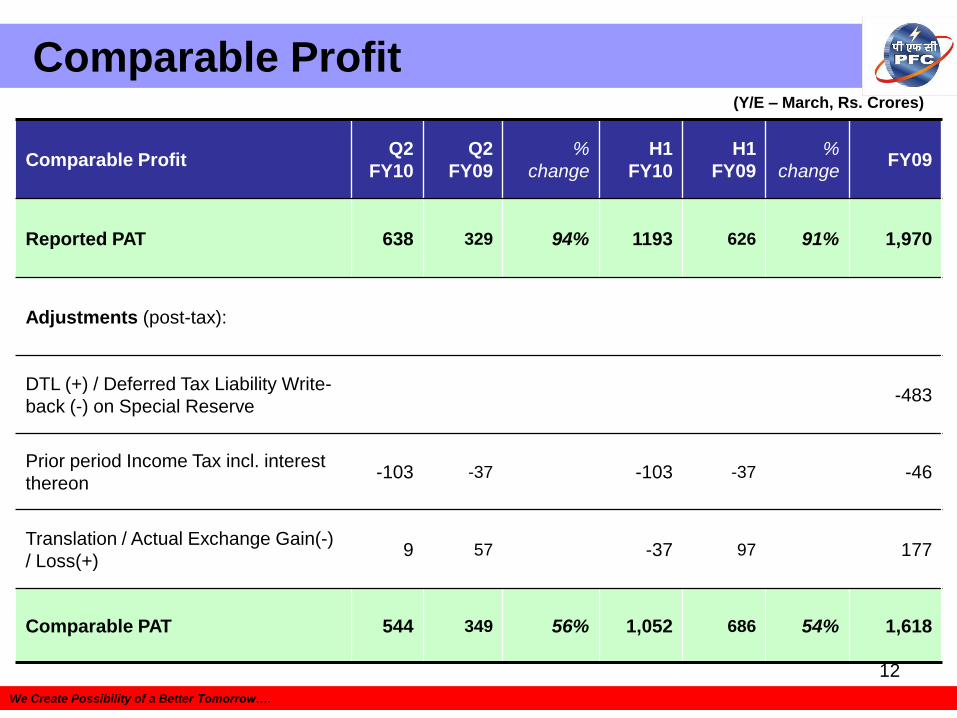
Comparable Profit
We Create Possibility of a Better Tomorrow….
Comparable ProfitQ2
FY10
Q2
FY09
%
change
H1
FY10
H1
FY09
%
changeFY09
Reported PAT 638 329 94% 1193 626 91% 1,970
Adjustments (post-tax):
DTL (+) / Deferred Tax Liability Write-
back (-) on Special Reserve-483
Prior period Income Tax incl. interest
thereon-103 -37 -103 -37 -46
Translation / Actual Exchange Gain(-)
/ Loss(+)9 57 -37 97 177
Comparable PAT 544 349 56% 1,052 686 54% 1,618
(Y/E – March, Rs. Crores)
13
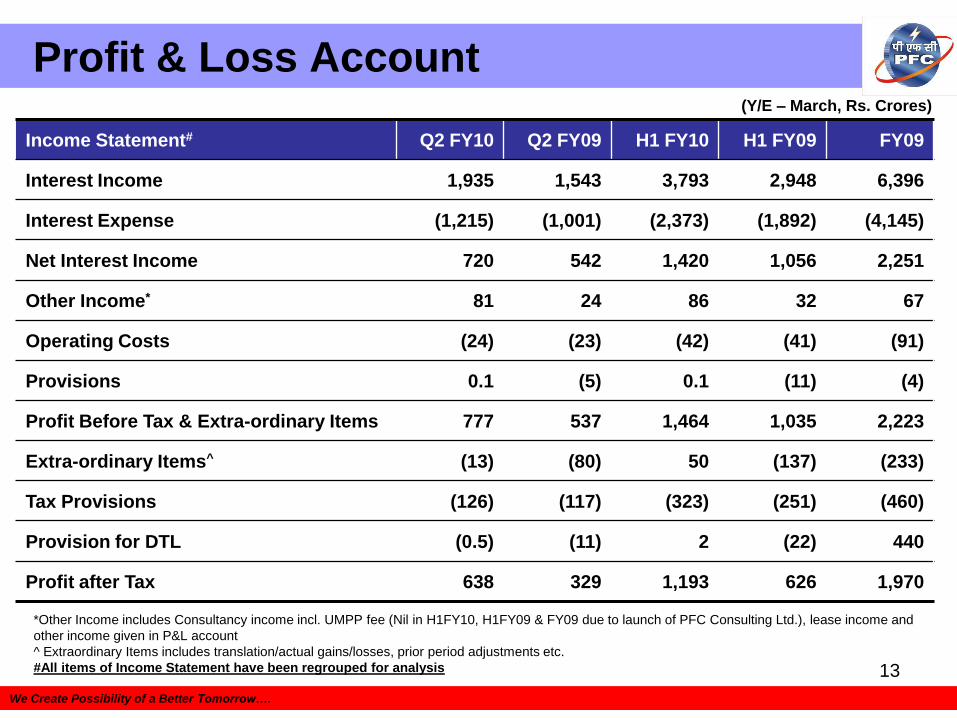
Profit & Loss Account
We Create Possibility of a Better Tomorrow….
Income Statement# Q2 FY10 Q2 FY09 H1 FY10 H1 FY09 FY09
Interest Income 1,935 1,543 3,793 2,948 6,396
Interest Expense (1,215) (1,001) (2,373) (1,892) (4,145)
Net Interest Income 720 542 1,420 1,056 2,251
Other Income* 81 24 86 32 67
Operating Costs (24) (23) (42) (41) (91)
Provisions 0.1 (5) 0.1 (11) (4)
Profit Before Tax & Extra-ordinary Items 777 537 1,464 1,035 2,223
Extra-ordinary Items^ (13) (80) 50 (137) (233)
Tax Provisions (126) (117) (323) (251) (460)
Provision for DTL (0.5) (11) 2 (22) 440
Profit after Tax 638 329 1,193 626 1,970
*Other Income includes Consultancy income incl. UMPP fee (Nil in H1FY10, H1FY09 & FY09 due to launch of PFC Consulting Ltd.), lease income and
other income given in P&L account
^ Extraordinary Items includes translation/actual gains/losses, prior period adjustments etc.
#All items of Income Statement have been regrouped for analysis
(Y/E – March, Rs. Crores)
14
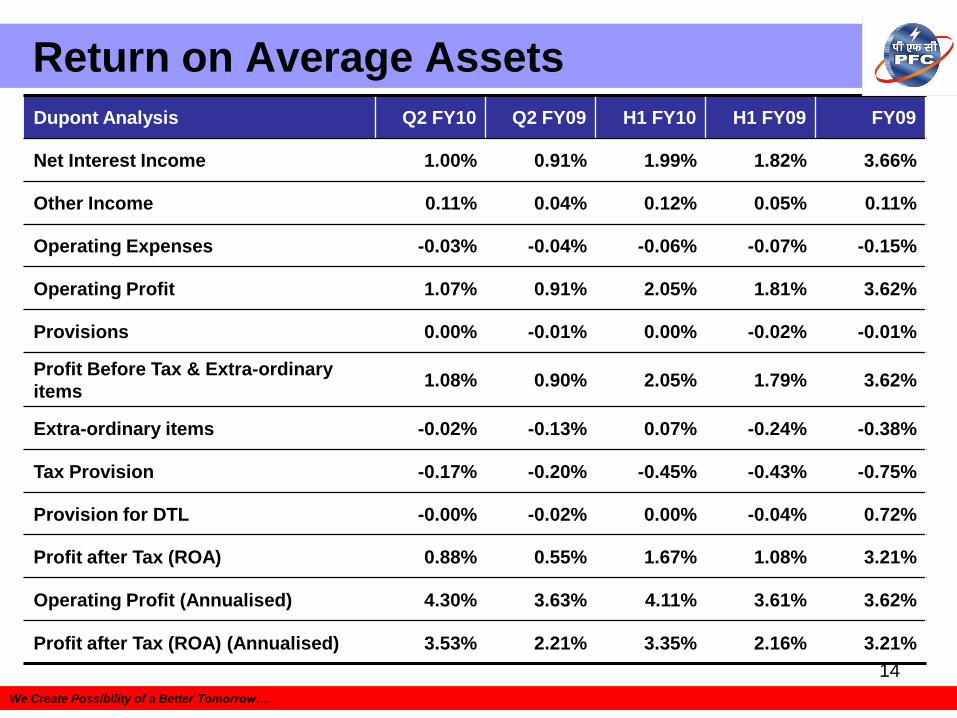
Return on Average Assets
We Create Possibility of a Better Tomorrow….
Dupont Analysis Q2 FY10 Q2 FY09 H1 FY10 H1 FY09 FY09
Net Interest Income 1.00% 0.91% 1.99% 1.82% 3.66%
Other Income 0.11% 0.04% 0.12% 0.05% 0.11%
Operating Expenses -0.03% -0.04% -0.06% -0.07% -0.15%
Operating Profit 1.07% 0.91% 2.05% 1.81% 3.62%
Provisions 0.00% -0.01% 0.00% -0.02% -0.01%
Profit Before Tax & Extra-ordinary
items1.08% 0.90% 2.05% 1.79% 3.62%
Extra-ordinary items -0.02% -0.13% 0.07% -0.24% -0.38%
Tax Provision -0.17% -0.20% -0.45% -0.43% -0.75%
Provision for DTL -0.00% -0.02% 0.00% -0.04% 0.72%
Profit after Tax (ROA) 0.88% 0.55% 1.67% 1.08% 3.21%
Operating Profit (Annualised) 4.30% 3.63% 4.11% 3.61% 3.62%
Profit after Tax (ROA) (Annualised) 3.53% 2.21% 3.35% 2.16% 3.21%
15
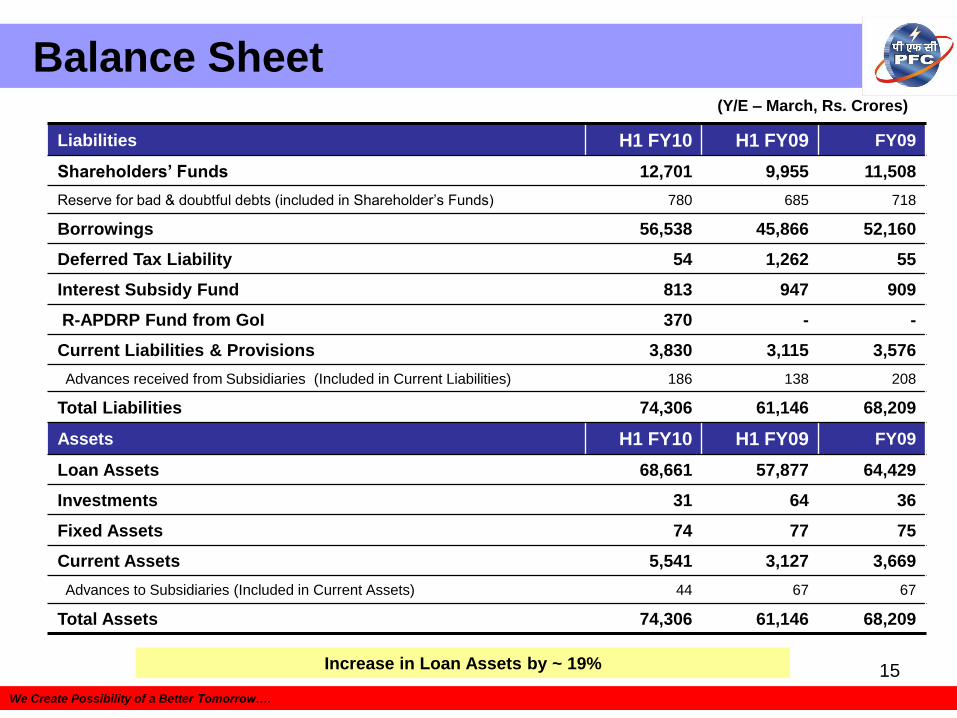
Balance Sheet
We Create Possibility of a Better Tomorrow….
Liabilities H1 FY10 H1 FY09 FY09
Shareholders‟ Funds 12,701 9,955 11,508
Reserve for bad & doubtful debts (included in Shareholder’s Funds) 780 685 718
Borrowings 56,538 45,866 52,160
Deferred Tax Liability 54 1,262 55
Interest Subsidy Fund 813 947 909
R-APDRP Fund from GoI 370 - -
Current Liabilities & Provisions 3,830 3,115 3,576
Advances received from Subsidiaries (Included in Current Liabilities) 186 138 208
Total Liabilities 74,306 61,146 68,209
Assets H1 FY10 H1 FY09 FY09
Loan Assets 68,661 57,877 64,429
Investments 31 64 36
Fixed Assets 74 77 75
Current Assets 5,541 3,127 3,669
Advances to Subsidiaries (Included in Current Assets) 44 67 67
Total Assets 74,306 61,146 68,209
(Y/E – March, Rs. Crores)
Increase in Loan Assets by ~ 19%
16
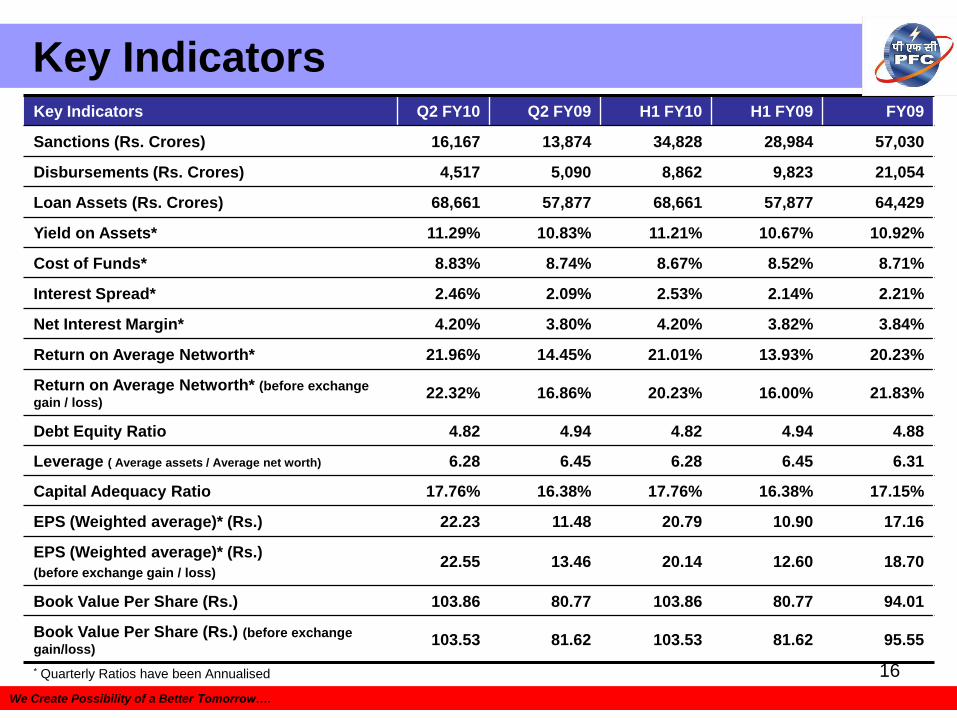
Key Indicators
We Create Possibility of a Better Tomorrow….
Key Indicators Q2 FY10 Q2 FY09 H1 FY10 H1 FY09 FY09
Sanctions (Rs. Crores) 16,167 13,874 34,828 28,984 57,030
Disbursements (Rs. Crores) 4,517 5,090 8,862 9,823 21,054
Loan Assets (Rs. Crores) 68,661 57,877 68,661 57,877 64,429
Yield on Assets* 11.29% 10.83% 11.21% 10.67% 10.92%
Cost of Funds* 8.83% 8.74% 8.67% 8.52% 8.71%
Interest Spread* 2.46% 2.09% 2.53% 2.14% 2.21%
Net Interest Margin* 4.20% 3.80% 4.20% 3.82% 3.84%
Return on Average Networth* 21.96% 14.45% 21.01% 13.93% 20.23%
Return on Average Networth* (before exchange
gain / loss)22.32% 16.86% 20.23% 16.00% 21.83%
Debt Equity Ratio 4.82 4.94 4.82 4.94 4.88
Leverage ( Average assets / Average net worth) 6.28 6.45 6.28 6.45 6.31
Capital Adequacy Ratio 17.76% 16.38% 17.76% 16.38% 17.15%
EPS (Weighted average)* (Rs.) 22.23 11.48 20.79 10.90 17.16
EPS (Weighted average)* (Rs.)
(before exchange gain / loss)22.55 13.46 20.14 12.60 18.70
Book Value Per Share (Rs.) 103.86 80.77 103.86 80.77 94.01
Book Value Per Share (Rs.) (before exchange
gain/loss)103.53 81.62 103.53 81.62 95.55
* Quarterly Ratios have been Annualised
17
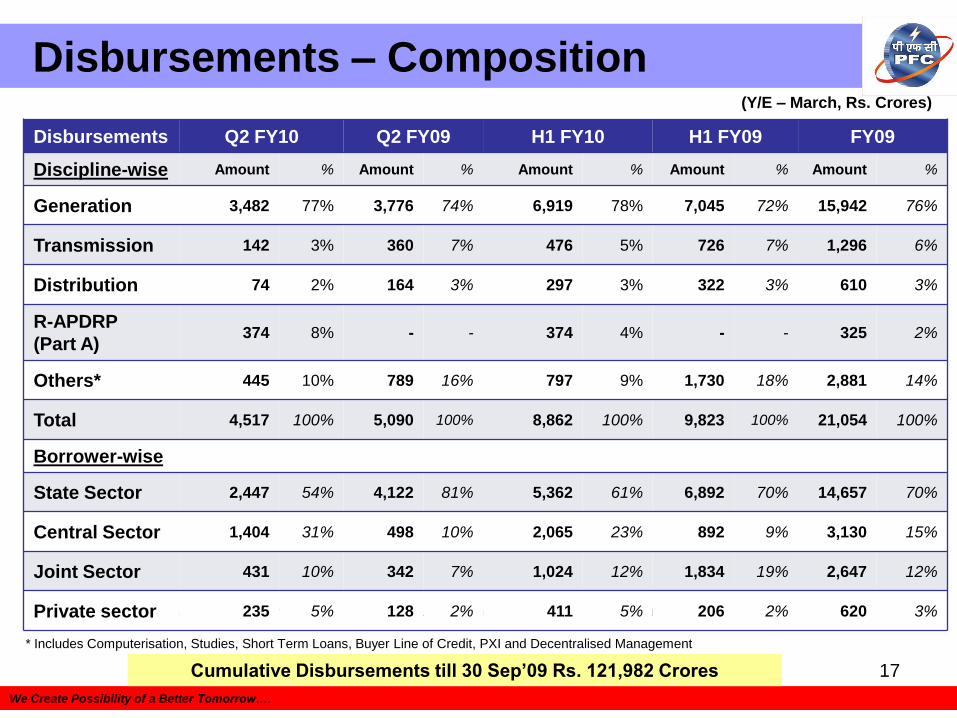
Disbursements – Composition
We Create Possibility of a Better Tomorrow….
(Y/E – March, Rs. Crores)
* Includes Computerisation, Studies, Short Term Loans, Buyer Line of Credit and Decentralised Management
Cumulative Disbursements till 30 Sep‟09 Rs. 121,982 Crores
Disbursements Q2 FY10 Q2 FY09 H1 FY10 H1 FY09 FY09
Discipline-wise Amount % Amount % Amount % Amount % Amount %
Generation 3,482 77% 3,776 74% 6,919 78% 7,045 72% 15,942 76%
Transmission 142 3% 360 7% 476 5% 726 7% 1,296 6%
Distribution 74 2% 164 3% 297 3% 322 3% 610 3%
R-APDRP
(Part A)374 8% - - 374 4% - - 325 2%
Others* 445 10% 789 16% 797 9% 1,730 18% 2,881 14%
Total 4,517 100% 5,090 100% 8,862 100% 9,823 100% 21,054 100%
Borrower-wise
State Sector 2,447 54% 4,122 81% 5,362 61% 6,892 70% 14,657 70%
Central Sector 1,404 31% 498 10% 2,065 23% 892 9% 3,130 15%
Joint Sector 431 10% 342 7% 1,024 12% 1,834 19% 2,647 12%
Private sector 235 5% 128 2% 411 5% 206 2% 620 3%
* Includes Computerisation, Studies, Short Term Loans, Buyer Line of Credit, PXI and Decentralised Management
18
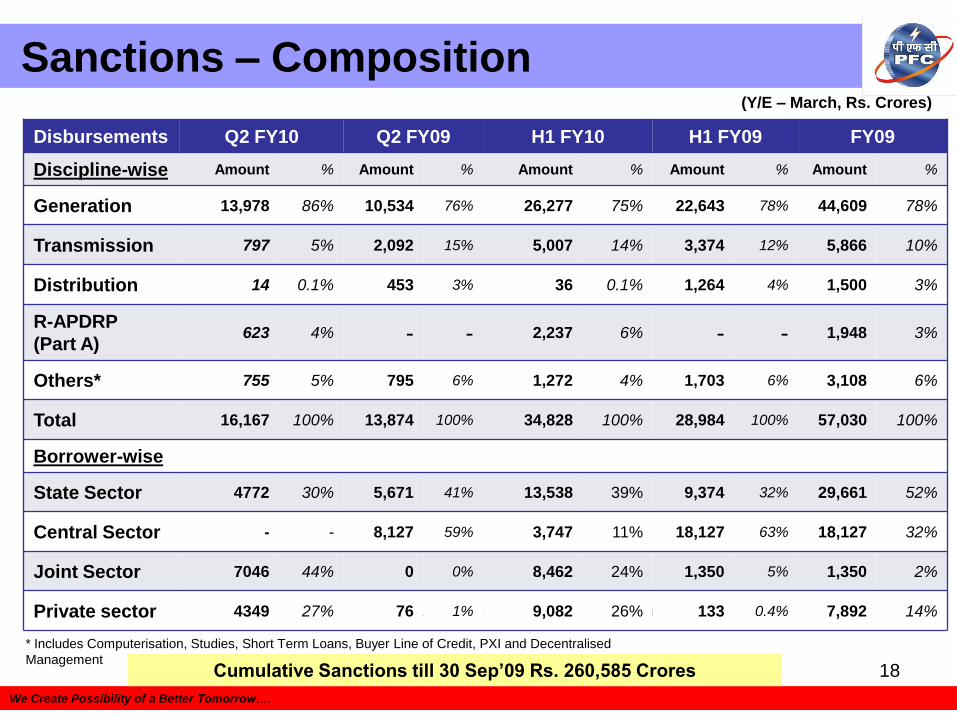
Sanctions – Composition
We Create Possibility of a Better Tomorrow….
(Y/E – March, Rs. Crores)
* Includes Computerisation, Studies, Short Term Loans, Buyer Line of Credit and Decentralised Management
Disbursements Q2 FY10 Q2 FY09 H1 FY10 H1 FY09 FY09
Discipline-wise Amount % Amount % Amount % Amount % Amount %
Generation 13,978 86% 10,534 76% 26,277 75% 22,643 78% 44,609 78%
Transmission 797 5% 2,092 15% 5,007 14% 3,374 12% 5,866 10%
Distribution 14 0.1% 453 3% 36 0.1% 1,264 4% 1,500 3%
R-APDRP
(Part A)623 4% - - 2,237 6% - - 1,948 3%
Others* 755 5% 795 6% 1,272 4% 1,703 6% 3,108 6%
Total 16,167 100% 13,874 100% 34,828 100% 28,984 100% 57,030 100%
Borrower-wise
State Sector 4772 30% 5,671 41% 13,538 39% 9,374 32% 29,661 52%
Central Sector - - 8,127 59% 3,747 11% 18,127 63% 18,127 32%
Joint Sector 7046 44% 0 0% 8,462 24% 1,350 5% 1,350 2%
Private sector 4349 27% 76 1% 9,082 26% 133 0.4% 7,892 14%
* Includes Computerisation, Studies, Short Term Loans, Buyer Line of Credit, PXI and Decentralised
ManagementCumulative Sanctions till 30 Sep‟09 Rs. 260,585 Crores
19
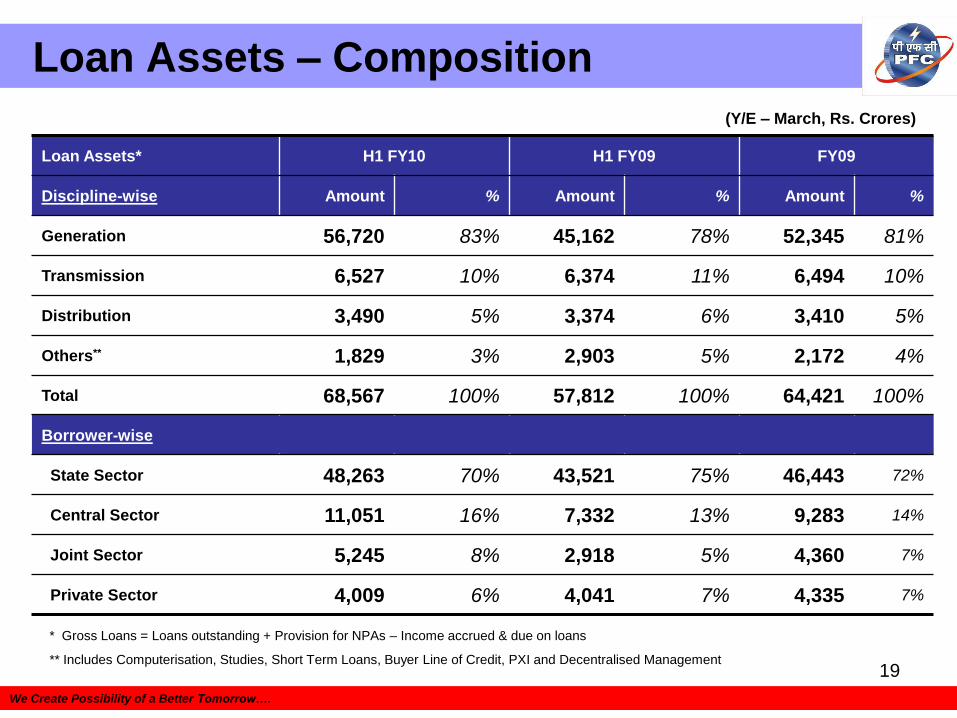
Loan Assets – Composition
We Create Possibility of a Better Tomorrow….
Loan Assets* H1 FY10 H1 FY09 FY09
Discipline-wise Amount % Amount % Amount %
Generation 56,720 83% 45,162 78% 52,345 81%
Transmission 6,527 10% 6,374 11% 6,494 10%
Distribution 3,490 5% 3,374 6% 3,410 5%
Others** 1,829 3% 2,903 5% 2,172 4%
Total 68,567 100% 57,812 100% 64,421 100%
Borrower-wise
State Sector 48,263 70% 43,521 75% 46,443 72%
Central Sector 11,051 16% 7,332 13% 9,283 14%
Joint Sector 5,245 8% 2,918 5% 4,360 7%
Private Sector 4,009 6% 4,041 7% 4,335 7%
(Y/E – March, Rs. Crores)
* Gross Loans = Loans outstanding + Provision for NPAs – Income accrued & due on loans
** Includes Computerisation, Studies, Short Term Loans, Buyer Line of Credit, PXI and Decentralised Management
20
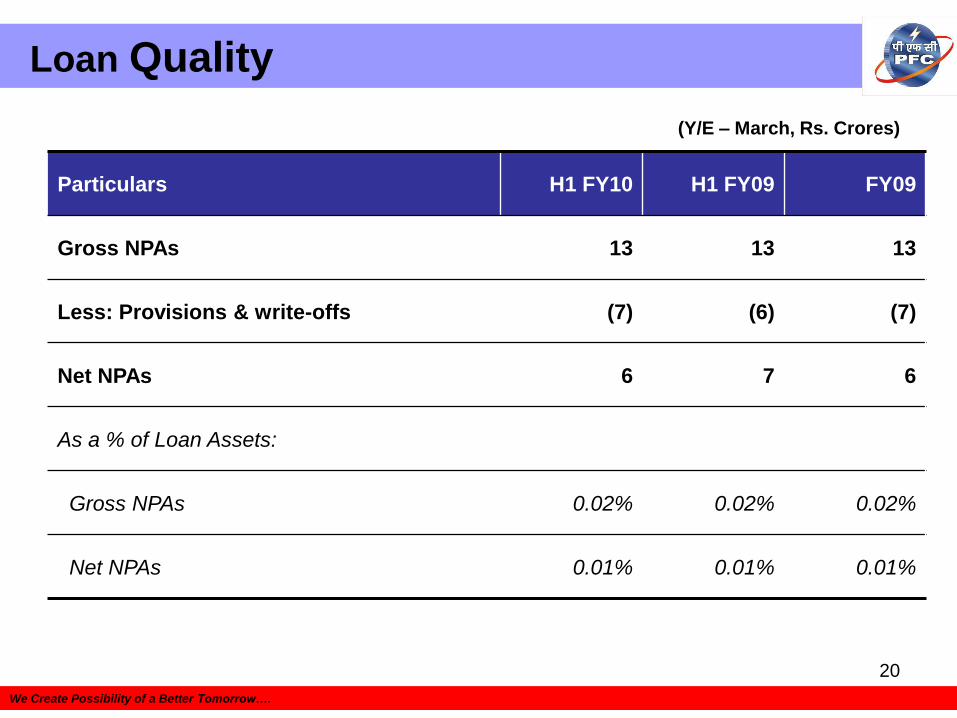
Loan Quality
We Create Possibility of a Better Tomorrow….
Particulars H1 FY10 H1 FY09 FY09
Gross NPAs 13 13 13
Less: Provisions & write-offs (7) (6) (7)
Net NPAs 6 7 6
As a % of Loan Assets:
Gross NPAs 0.02% 0.02% 0.02%
Net NPAs 0.01% 0.01% 0.01%
(Y/E – March, Rs. Crores)
21
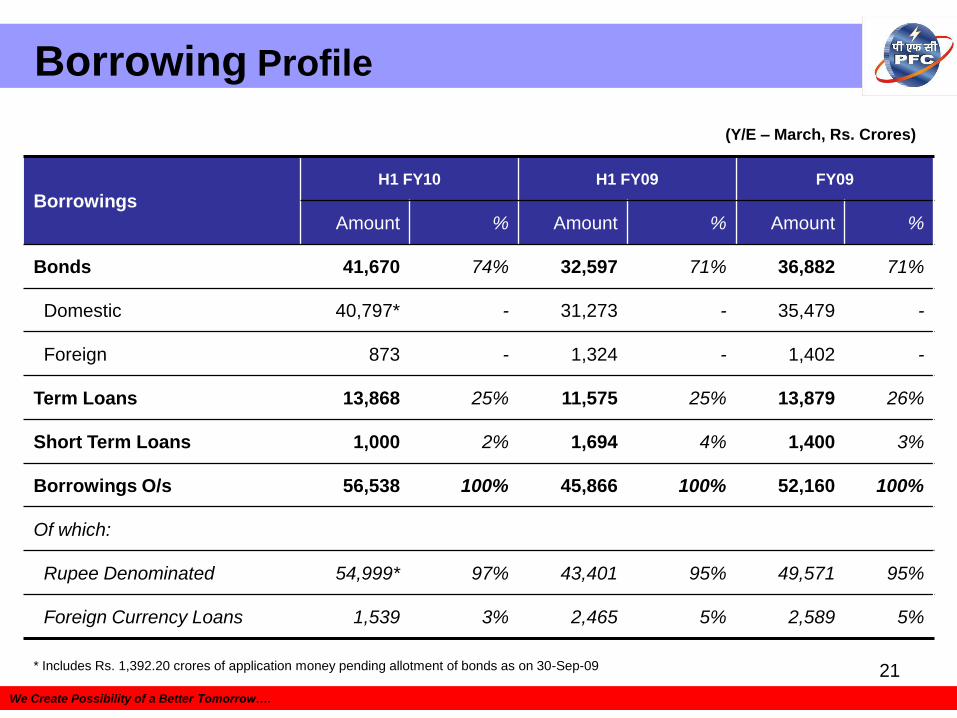
Borrowing Profile
We Create Possibility of a Better Tomorrow….
Borrowings
H1 FY10 H1 FY09 FY09
Amount % Amount % Amount %
Bonds 41,670 74% 32,597 71% 36,882 71%
Domestic 40,797* - 31,273 - 35,479 -
Foreign 873 - 1,324 - 1,402 -
Term Loans 13,868 25% 11,575 25% 13,879 26%
Short Term Loans 1,000 2% 1,694 4% 1,400 3%
Borrowings O/s 56,538 100% 45,866 100% 52,160 100%
Of which:
Rupee Denominated 54,999* 97% 43,401 95% 49,571 95%
Foreign Currency Loans 1,539 3% 2,465 5% 2,589 5%
(Y/E – March, Rs. Crores)
* Includes Rs. 1,392.20 crores of application money pending allotment of bonds as on 30-Sep-09
22
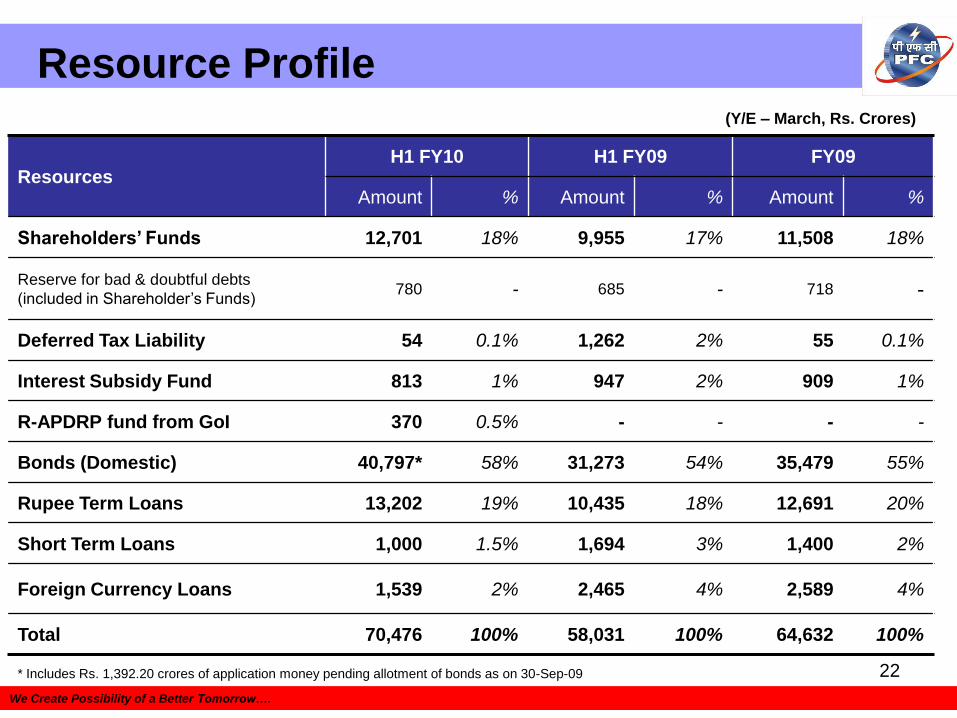
Resource Profile
We Create Possibility of a Better Tomorrow….
ResourcesH1 FY10 H1 FY09 FY09
Amount % Amount % Amount %
Shareholders‟ Funds 12,701 18% 9,955 17% 11,508 18%
Reserve for bad & doubtful debts
(included in Shareholder’s Funds)780 - 685 - 718 -
Deferred Tax Liability 54 0.1% 1,262 2% 55 0.1%
Interest Subsidy Fund 813 1% 947 2% 909 1%
R-APDRP fund from GoI 370 0.5% - - - -
Bonds (Domestic) 40,797* 58% 31,273 54% 35,479 55%
Rupee Term Loans 13,202 19% 10,435 18% 12,691 20%
Short Term Loans 1,000 1.5% 1,694 3% 1,400 2%
Foreign Currency Loans 1,539 2% 2,465 4% 2,589 4%
Total 70,476 100% 58,031 100% 64,632 100%
(Y/E – March, Rs. Crores)
* Includes Rs. 1,392.20 crores of application money pending allotment of bonds as on 30-Sep-09
23
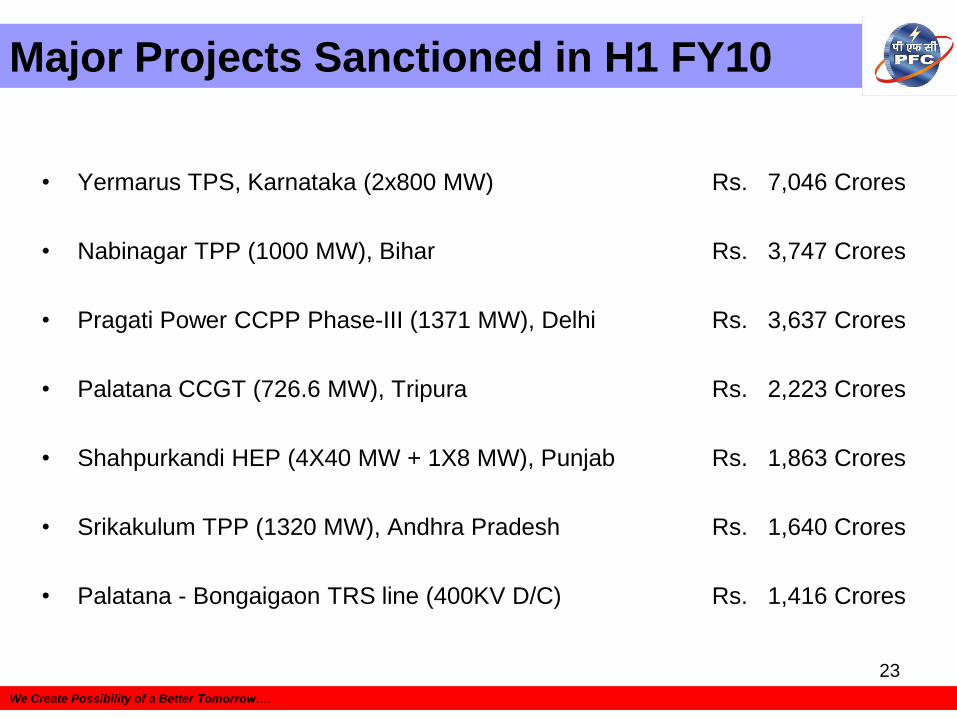
Major Projects Sanctioned in H1 FY10
• Yermarus TPS, Karnataka (2x800 MW) Rs. 7,046 Crores
• Nabinagar TPP (1000 MW), Bihar Rs. 3,747 Crores
• Pragati Power CCPP Phase-III (1371 MW), Delhi Rs. 3,637 Crores
• Palatana CCGT (726.6 MW), Tripura Rs. 2,223 Crores
• Shahpurkandi HEP (4X40 MW + 1X8 MW), Punjab Rs. 1,863 Crores
• Srikakulum TPP (1320 MW), Andhra Pradesh Rs. 1,640 Crores
• Palatana - Bongaigaon TRS line (400KV D/C) Rs. 1,416 Crores
We Create Possibility of a Better Tomorrow….
24
We Create Possibility of a Better Tomorrow….
Focus & Strategy
Operational Performance
Shareholding Pattern
PFC Overview
25
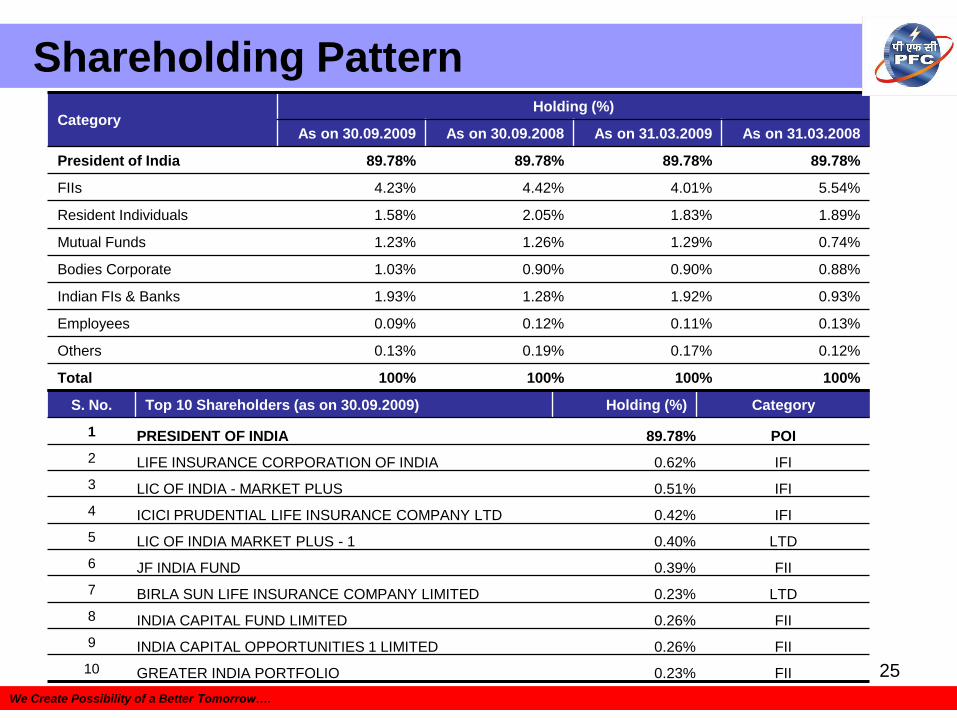
Shareholding Pattern
CategoryHolding (%)
As on 30.09.2009 As on 30.09.2008 As on 31.03.2009 As on 31.03.2008
President of India 89.78% 89.78% 89.78% 89.78%
FIIs 4.23% 4.42% 4.01% 5.54%
Resident Individuals 1.58% 2.05% 1.83% 1.89%
Mutual Funds 1.23% 1.26% 1.29% 0.74%
Bodies Corporate 1.03% 0.90% 0.90% 0.88%
Indian FIs & Banks 1.93% 1.28% 1.92% 0.93%
Employees 0.09% 0.12% 0.11% 0.13%
Others 0.13% 0.19% 0.17% 0.12%
Total 100% 100% 100% 100%
We Create Possibility of a Better Tomorrow….
S. No. Top 10 Shareholders (as on 30.09.2009) Holding (%) Category
1 PRESIDENT OF INDIA 89.78% POI
2 LIFE INSURANCE CORPORATION OF INDIA 0.62% IFI
3 LIC OF INDIA - MARKET PLUS 0.51% IFI
4 ICICI PRUDENTIAL LIFE INSURANCE COMPANY LTD 0.42% IFI
5 LIC OF INDIA MARKET PLUS - 1 0.40% LTD
6 JF INDIA FUND 0.39% FII
7 BIRLA SUN LIFE INSURANCE COMPANY LIMITED 0.23% LTD
8 INDIA CAPITAL FUND LIMITED 0.26% FII
9 INDIA CAPITAL OPPORTUNITIES 1 LIMITED 0.26% FII
10 GREATER INDIA PORTFOLIO 0.23% FII
26
Thank You!
We Create Possibility of a Better Tomorrow….