potential carbon sequestration in a cultivated soil under different climate change scenarios: a...
TRANSCRIPT
Agriculture, Ecosystems and Environment 128 (2008) 97–103
Contents lists available at ScienceDirect
Agriculture, Ecosystems and Environment
journal homepage: www.elsevier .com/locate/agee
Potential carbon sequestration in a cultivated soil under different climate changescenarios: A modelling approach for evaluating promising management practicesin north-east Italy
E. Lugato *, A. Berti
Dipartimento di Agronomia Ambientale e Produzioni Vegetali Agripolis, Universita di Padova, viale dell’Universita 16, 35020 Legnaro, Padova, Italy
A R T I C L E I N F O
Article history:
Received 21 February 2008
Received in revised form 7 May 2008
Accepted 10 May 2008
Available online 20 June 2008
Keywords:
C sequestration
Climate change
SRES scenarios
Kyoto protocol
Century model
Italy
A B S T R A C T
Crop productivity and soil organic carbon (SOC) turnover are strongly influenced by climatic and
environmental conditions, so climate change projections are fundamental for a reliable assessment of C
stock variations. Article 3.4 of the Kyoto protocol recognized cropland management as a human-induced
strategy to sequester CO2 in agricultural soil, but only an evaluation of interactions with climate change
can help in identifying the promising recommended management practices (RMPs) in the first
commitment period and in the long term. In a long-term trial began in 1966, previously simulated with
Century SOC model, we selected a specific treatment as ‘business as usual scenario’ (BU). We projected
the simulations from 2008 to 2080, hypothesizing different reliable SOC sequestration practices to be
compared with BU: farm manure application (FM), reduced tillage (RT) and grassland conversion (GR).
For this, we used climate data from four global climate models (CMs: Had3, GCM2, CSIRO2, PCM) forced
by four IPCC emission scenarios (SRES). The results clearly indicated that RMPs could affect the C balance
in agroecosystems more strongly than climate change. Conversion to grassland was the most promising
practice for sequestering C, allowing an average accumulation of 245 and 1377 g C m�2 at the end of the
first commitment period and in 2080, respectively. Manure application (at the rate considered) was
anyway a potential C sequestration option that was more effective than reduced tillage in the first
commitment period, but slightly less efficient at the end of the simulation. BU was a source of C at 2080
only for the pessimistic climate model Had3, as a consequence of increasing temperature and reduced
precipitation, with a depletion of �94 g C m�2 in 2080. With the other CMs, the BU always resulted in a
carbon sink. Despite inherent sources of variability we discussed, simulation results demonstrated that
RMPs could contribute towards achieving the Kyoto targets in northern Italy.
� 2008 Elsevier B.V. All rights reserved.
1. Introduction
After ratification of the Kyoto protocol (UNFCCC–http://unfccc.int), great efforts are being required from the participatingnations to reduce greenhouse gas (GHG) emissions in the firstcommitment period (2008–2012). Article 3.4 recognized croplandmanagement as a human-induced strategy (Smith, 2005) tosequester CO2 in agricultural soil. There are several strategies(recommended management practices, RMPs) for sequestering Cin the soil, such as reduced or zero tillage, soil application ofbiosolids (manure, crop residue, compost), improved rotations,fertilization and irrigation or conversion to grassland and wood-land (Lal, 2004; Smith, 2004).
* Corresponding author. Tel.: +39 0498272837; fax: +39 0498272839.
E-mail address: [email protected] (E. Lugato).
0167-8809/$ – see front matter � 2008 Elsevier B.V. All rights reserved.
doi:10.1016/j.agee.2008.05.005
Although the biological potential for European (EU15) crop-lands is about 90–120 Mt C per year (Smith, 2005) and realistically16–19 Mt C per year in the first commitment period (Freibaueret al., 2004), many important aspects should be considered.Ecosystem productivity and soil organic carbon (SOC) turnover arestrongly influenced by climatic and environmental conditions.General circulation models (CMs) force by the IPCC emissionsscenarios (SRES) are thus necessary to project the main variablesdriving the SOC balance (e.g. temperature, precipitation, CO2
atmospheric concentration), for a reliable assessment of future Cstock variations. Many studies estimate a change in net primaryproduction (NPP) and soil C balance at European or world level(Cramer et al., 2001; Schoter et al., 2005; Smith et al., 2005;Morales et al., 2007) under different CMs-SRES scenarios, usingglobal dynamic vegetation models. These studies, very valuable atregional scale, could be unsuitable at field level as they do notconsider the effect of management practices (tillage, fertilization

Table 1Main physical and chemical characteristics of the top soil layer (0–30 cm) at the
start of the experiment (1966)
Parameters Values
Sand (2 mm–50 mm) (g kg�1) 338
Silt (50–2 mm) (g kg�1) 370
Clay (<2 mm) (g kg�1) 292
pH 7.8
Total carbonate (g kg�1) 331
Organic carbon (g kg�1) 10.5
Total nitrogen (g kg�1) 1.27
C/N 8.3
Available phosphorus (mg kg�1) 121
E. Lugato, A. Berti / Agriculture, Ecosystems and Environment 128 (2008) 97–10398
and N cycle, crop rotation, manure application) implemented inother more ‘agricultural oriented’ SOC models.
Moreover the Article 3.4 of the Kyoto protocol requires a levelof verifiability that ranges from more empirical (tier 1) to ahigher order method (tier 3) (IPCC, 2004). Soil C sequestrationcould be assessed, for example, using well-evaluated anddocumented SOC models (IPCC, 2004; Smith, 2004), obtainingresults that could be extended to similar pedo-climatic geor-eferenced areas. Although the commitment period lasts 5 years,the soil C sink could take even 100 years to reach a newequilibrium (Paustian et al., 1997a). Within this perspective theinteraction with climate change scenarios could help to identifywhich RMPs are more promising not only in the first commit-ment period but also in the long term.
In a long-term trial that began in 1966, previously simulatedwith the Century SOC model (Lugato et al., 2006), we selected aspecific treatment as ‘business as usual scenario’ (BU). Weprojected the simulations from 2008 to 2080, also hypothesizingdifferent reliable SOC sequestration practices. The aim was toevaluate the potential SOC sequestration in the first commitmentperiod (2008–2012) and in the long term (2080), considering theinteraction with possible future climate change scenarios.
2. Materials and methods
2.1. Experimental site and design
The long-term trial is located at the University of Padovaexperimental farm (Veneto Region, NE Italy 458210N; 118580E; 6 ma.s.l.). The local climate is sub-humid, with about 830 mm annualrainfall. In the median year, rainfall is highest in June (100 mm)and October (90 mm) and lowest in winter (50–60 mm). Meanannual temperature is about 12 8C, whereas reference evapotran-spiration (FAO, 1998) exceeds rainfall from April to September. Thesite has a shallow water table ranging from about 0.5–1.5 m in latewinter–early spring to 1–2 m in the summer.
The soil is a fluvi-calcaric cambisol (FAO-UNESCO, 1990), clayloam, with sub-basic pH. At the beginning of the trial (1966) theSOC content in the top layer was 10.5 g kg�1 with a C/N ratio of 8.3(Table 1). The experimental design is randomized blocks with four
Table 2Agricultural management practices in BU compared to RMPs hypothesised
RMPs Rotation N fertilization
BU Maize–wheat–maize–soybean M (240 kg ha�1)a
RT Maize–wheat–maize–soybean M (240 kg ha�1)a
FM Maize–wheat–maize–soybean M (140 kg ha�1)a + FM (100 kg ha
GR Grass M (240 kg ha�1)
M, mineral fertilization; FM, farmyard manure; MBP, Mouldboard ploughing.a No fertilization applied to soybean.
replications, on plots of 5.4 m � 6.4 m; treatments are two-cropresidue managements (residue incorporation, RI; residue removal,RR) factorially combined with five N mineral fertilisation rates (0,60, 120, 180, and 240 kg ha�1 of N) (Lugato et al., 2006).
Continuous maize (Zea mais L.) was succeeded in 1983 by anopen rotation of maize, sugarbeet (Beta vulgaris L.) and soybean(Glycine max (L.) Merr.), with the occasional insertion of winterwheat (Triticum aestivum L.) and tomato (Lycopersicon esculentum
Mill.). Soil was ploughed to medium depth (30–35 cm) in autumn,followed by a standard seedbed preparation at different timesaccording to crop.
2.2. Model description and parameterization
The Century model was designed to simulate the C, N, P, and Sdynamics of natural or cultivated systems, using a monthly timestep (Parton et al., 1994; Liwang and Shaffer, 2001). The soilorganic matter submodel includes three SOC pools, active, slowand passive, along with two fresh residue pools, structural andmetabolic, that decay following a first order kinetic each one with adifferent turnover rate. Soil temperature and moisture, soil textureand cultivation practices have different effects on these rates. Themodel can also simulate the water balance, using a weekly timestep, and a suite of simple plant growth models are included tosimulate C, N, P and S dynamics of crops, grasses and trees. Centurycan simulate the effects of increasing atmospheric CO2 concentra-tion (Parton et al., 1994) considering: (1) the increase of NPP with adifferent response for C3 and C4 species; (2) the transpirationreduction which is supposed to happen in relation to a decrease instomatal conductance; (3) the C/N and shoot/root ratio change ofgrasses and crops.
This model was recently used to simulate all the treatments ofthe above long-term experiment, as well as two other long-termexperiments on the experimental farm. Specific details of modelparameterization and evaluation are extensively reported inLugato et al. (2006, 2007).
2.3. Business as usual (BU) scenario vs. recommended management
practices (RMPs)
From the different treatment in the long-term experiment weselected the one with residue incorporation (RI) and fertilizationrate of 240 kg N ha�1 per year, as the ‘business as usual scenario’projecting the simulation until 2080. Only the crop rotation waschanged in a 4-year rotation maize–wheat–maize–soybean from2008 eliminating the sugarbeet, cultivation of which is decreasingin northern Italy due to the unfavourable market price evolutionwithin EU. No fertilizer was applied to soybean. The crop rotation isrepresentative of the current regional agriculture.
The RMPs hypothesized for SOC sequestration were: (1)reduced tillage RT; (2) farmyard manure fertilization FM; (3)grassland conversion GR (Table 2). The RMPs were chosenconsidering their suitability to the local agricultural context. Forexample, the reduced tillage was applied only to wheat and
Tillage
MBP + secondary tillage
MBP + secondary tillage for maize. Reduced tillage for the other crops�1) MBP + secondary tillage
No tillage

Table 3Change in the mean annual temperature (8C) and annual precipitation (mm year�1) for 2056–2080 based on Tyndall dataset compared with 1966–1990 (LGN dataset)
SRES CMs
Had3 CGM2 CSIRO2 PCM
D Precipitation D Temperature D Precipitation D Temperature D Precipitation D Temperature D Precipitation D Temperature
A1FI �78.2 6.8 �16.1 4.3 43.0 3.9 34.3 3.7
A2 �54.2 5.4 �4.0 3.6 43.9 4.1 34.9 3.2
B1 �74.5 4.6 54.9 3.0 40.1 3.6 17.7 2.6
B2 �9.4 4.6 58.1 3.3 41.2 3.7 14.5 2.8
E. Lugato, A. Berti / Agriculture, Ecosystems and Environment 128 (2008) 97–103 99
soybean and farmyard manure (FM) (20% dry matter, 0.5% N)distributed only on maize at a rate of 20 Mg ha�1.
All the RMPs started in 2008. To evaluate the C sequestrationcapacity of the RMPs, the difference between the SOC content inthe top soil layer of each RMPs and BU at the end of the firstcommitment period (2012) was calculated. Because SOC stockvariations should refer to 1990, the Kyoto baseline year, thesedifferences were summed to the SOC variation of BU in the 1990–2012 period. The same calculations were made for the end of thesimulation (2080) to evaluate the long-term behaviour of thecropping systems.
2.4. Meteorological data and projected climate change
The meteorological data needed for model inputs were themaximum and minimum monthly air temperature and monthlycumulated precipitation. The simulations for the period 1966–2007 were performed with data from a meteorological stationlocated on the experimental farm (LGN dataset).
The dataset for the projected simulation (2008–2080) wereprovided by the Tyndall Centre (Mitchell et al., 2004). The TYN SC1.0 dataset covers the whole of Europe with a grid of 10
i � 10i
; weidentified our site in the grid 138, 68. The dataset contains theclimate projections of four general circulation models (CMs), Had3,GCM2, CSIRO2 and PCM, forced by four IPCC emissions scenarios(SRES: A1FI, A2, B2, B1) (Nakicenovic et al., 2000).
CMs give different interpretations of the future climate at locallevel (Table 3). The Had3 model predicts a general decrease inprecipitation for all the SRES scenarios whereas CSIRO2 and PCMpredict a general increase ranging from 14.5 to 43.9 mm.Contrasting projections are evidenced by the CGM2 model inrelation to SRES scenarios, with a negative value for A1FI and A2and positive for B2 and B1. Mean temperature always variesaccording to the SRES scenarios: A1FI > A2 > B2 > B1. Withinthese, Had3 estimates the highest values of from 6.8 to 4.6 8C,whereas PCM indicates smaller changes with a minimum of 2.6 8Cfor the B1 scenario. Within each CM, as shown in Fig. 1 for two
Fig. 1. Mean temperature trend in the measured (1966–2007) and projected period
(2008–2080) for the Had3 and PCM general circulation model, with the A1FI and B1
scenarios.
contrasting models (Had3 and PCM), the effect of SRES scenarios ontemperature change start to become evident in the period 2030–2040, and is very pronounced at the last part of the simulation.
As Century is able to simulate the effects of increasingatmospheric CO2, we assumed linear growth rates in CO2
concentration to reach 779, 709, 567 and 518 ppmv in 2080 forscenarios A1FI, A2, B2 and B1, respectively (Schoter et al., 2005).
3. Results
3.1. SOC stock and crop yield change in the BU
The simulated SOC trend for the observed period (1966–2007)was very close to the measured data (RMSE = 1.46) (Fig. 2),evidencing a decrease in the first decade of the experimentfollowed by an equilibrium phase. The accuracy of the C balancewas also confirmed by the measured average abovegroundbiomass (594 g C m�2), being comparable with the simulatedvalue (586 g C m�2). The model seemed to mimic the reality well(Lugato et al., 2006), as it did in other long-term experiments in thesame environment (Lugato et al., 2007).
From 2008 onward, projected trends of BU and effects of thesimulated RMPs showed different responses in relation to theclimate change scenarios (Figs. 2 and 3; Tables 4 and 5). In the mostdivergent one (Had3_A1FI), the SOC trend in the BU (Fig. 2)increased slightly only until 2040, then began to decrease so thatthe final SOC 1990–2080 change was negative, with �94 g C m�2
(Table 4). With the Had3 model, Century simulated a long-term
Fig. 2. SOC trend of business as usual scenario (BU), reduced tillage (RT), farmyard
manure application (FM) and grassland conversion (GR), and simulated yields for
BU crops in the Had3_A1FI.
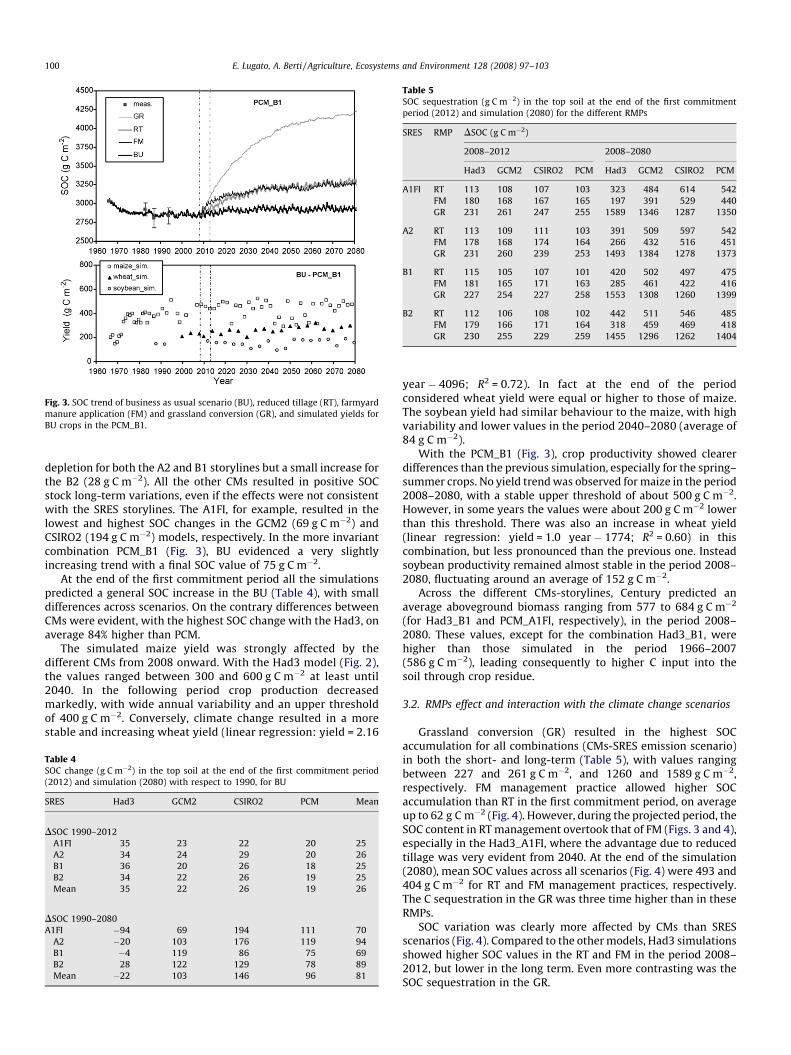
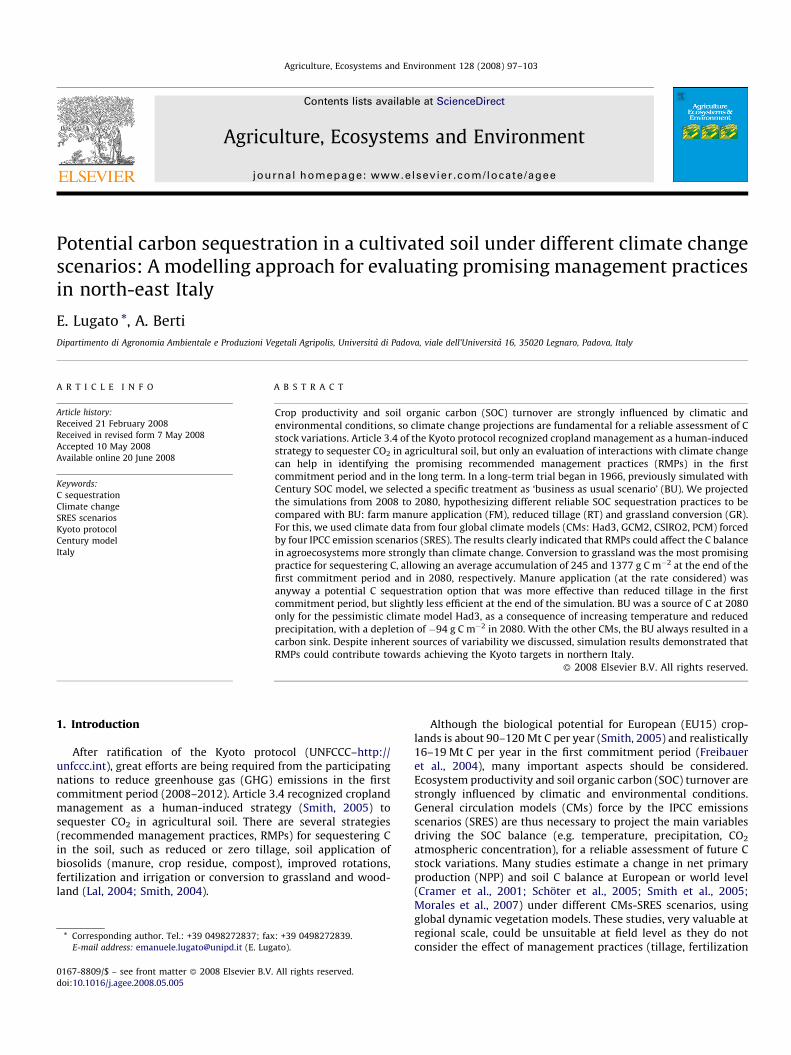
Fig. 3. SOC trend of business as usual scenario (BU), reduced tillage (RT), farmyard
manure application (FM) and grassland conversion (GR), and simulated yields for
BU crops in the PCM_B1.
Table 5SOC sequestration (g C m�2) in the top soil at the end of the first commitment
period (2012) and simulation (2080) for the different RMPs
SRES RMP DSOC (g C m�2)
2008–2012 2008–2080
Had3 GCM2 CSIRO2 PCM Had3 GCM2 CSIRO2 PCM
A1FI RT 113 108 107 103 323 484 614 542
FM 180 168 167 165 197 391 529 440
GR 231 261 247 255 1589 1346 1287 1350
A2 RT 113 109 111 103 391 509 597 542
FM 178 168 174 164 266 432 516 451
GR 231 260 239 253 1493 1384 1278 1373
B1 RT 115 105 107 101 420 502 497 475
FM 181 165 171 163 285 461 422 416
GR 227 254 227 258 1553 1308 1260 1399
B2 RT 112 106 108 102 442 511 546 485
FM 179 166 171 164 318 459 469 418
GR 230 255 229 259 1455 1296 1262 1404
E. Lugato, A. Berti / Agriculture, Ecosystems and Environment 128 (2008) 97–103100
depletion for both the A2 and B1 storylines but a small increase forthe B2 (28 g C m�2). All the other CMs resulted in positive SOCstock long-term variations, even if the effects were not consistentwith the SRES storylines. The A1FI, for example, resulted in thelowest and highest SOC changes in the GCM2 (69 g C m�2) andCSIRO2 (194 g C m�2) models, respectively. In the more invariantcombination PCM_B1 (Fig. 3), BU evidenced a very slightlyincreasing trend with a final SOC value of 75 g C m�2.
At the end of the first commitment period all the simulationspredicted a general SOC increase in the BU (Table 4), with smalldifferences across scenarios. On the contrary differences betweenCMs were evident, with the highest SOC change with the Had3, onaverage 84% higher than PCM.
The simulated maize yield was strongly affected by thedifferent CMs from 2008 onward. With the Had3 model (Fig. 2),the values ranged between 300 and 600 g C m�2 at least until2040. In the following period crop production decreasedmarkedly, with wide annual variability and an upper thresholdof 400 g C m�2. Conversely, climate change resulted in a morestable and increasing wheat yield (linear regression: yield = 2.16
Table 4SOC change (g C m�2) in the top soil at the end of the first commitment period
(2012) and simulation (2080) with respect to 1990, for BU
SRES Had3 GCM2 CSIRO2 PCM Mean
DSOC 1990–2012
A1FI 35 23 22 20 25
A2 34 24 29 20 26
B1 36 20 26 18 25
B2 34 22 26 19 25
Mean 35 22 26 19 26
DSOC 1990–2080
A1FI �94 69 194 111 70
A2 �20 103 176 119 94
B1 �4 119 86 75 69
B2 28 122 129 78 89
Mean �22 103 146 96 81
year � 4096; R2 = 0.72). In fact at the end of the periodconsidered wheat yield were equal or higher to those of maize.The soybean yield had similar behaviour to the maize, with highvariability and lower values in the period 2040–2080 (average of84 g C m�2).
With the PCM_B1 (Fig. 3), crop productivity showed clearerdifferences than the previous simulation, especially for the spring–summer crops. No yield trend was observed for maize in the period2008–2080, with a stable upper threshold of about 500 g C m�2.However, in some years the values were about 200 g C m�2 lowerthan this threshold. There was also an increase in wheat yield(linear regression: yield = 1.0 year � 1774; R2 = 0.60) in thiscombination, but less pronounced than the previous one. Insteadsoybean productivity remained almost stable in the period 2008–2080, fluctuating around an average of 152 g C m�2.
Across the different CMs-storylines, Century predicted anaverage aboveground biomass ranging from 577 to 684 g C m�2
(for Had3_B1 and PCM_A1FI, respectively), in the period 2008–2080. These values, except for the combination Had3_B1, werehigher than those simulated in the period 1966–2007(586 g C m�2), leading consequently to higher C input into thesoil through crop residue.
3.2. RMPs effect and interaction with the climate change scenarios
Grassland conversion (GR) resulted in the highest SOCaccumulation for all combinations (CMs-SRES emission scenario)in both the short- and long-term (Table 5), with values rangingbetween 227 and 261 g C m�2, and 1260 and 1589 g C m�2,respectively. FM management practice allowed higher SOCaccumulation than RT in the first commitment period, on averageup to 62 g C m�2 (Fig. 4). However, during the projected period, theSOC content in RT management overtook that of FM (Figs. 3 and 4),especially in the Had3_A1FI, where the advantage due to reducedtillage was very evident from 2040. At the end of the simulation(2080), mean SOC values across all scenarios (Fig. 4) were 493 and404 g C m�2 for RT and FM management practices, respectively.The C sequestration in the GR was three time higher than in theseRMPs.
SOC variation was clearly more affected by CMs than SRESscenarios (Fig. 4). Compared to the other models, Had3 simulationsshowed higher SOC values in the RT and FM in the period 2008–2012, but lower in the long term. Even more contrasting was theSOC sequestration in the GR.

Fig. 4. Mean and variability (standard deviation and error) of SOC sequestration in relation to different RMPs, CMs and RMPs, SRES scenarios and RMPs at the end of first
commitment period (2012) and simulation (2080).
E. Lugato, A. Berti / Agriculture, Ecosystems and Environment 128 (2008) 97–103 101
4. Discussion
4.1. Crop response to climate change
We chose to represent the cropping systems behaviour underHad3_A1FI and PCM_B1 combination (Figs. 2 and 3), since theypredicted the biggest and smallest climate changes, respectively.The simulations showed similar behaviour for wheat, whichlinearly increased its yield. This is partially attributable to theeffect of increasing CO2 concentration, which is more pronouncedin C3 species. Olesen and Bindi (2002) reported the relative effectsof CO2 concentration on increasing wheat grain, with data fromfield and greenhouse experiments. However, the crop was notaffected by the change in precipitation, probably because it grows
during autumn–spring when precipitation normally exceeds ET, atleast until April. Indeed the decreasing precipitation in theHad3_A1FI could have been partially offset by the transpirationreduction accounted by the model, as a consequence of the higherwater use efficiency at increasing CO2 concentration.
Maize was more affected by the different CMs-SRES scenarios.In the PCM_B1 combination, the increase of temperature,precipitation and CO2 concentration led to almost constant yieldsin the long term. This effect is also due to the lower growthresponse to CO2 in C4 species than in C3 (Allen, 1990). On the otherhand, in Had3_A1FI, despite the higher CO2 concentration, cropyield strongly decreased, especially from 2040 when the climatechange began to be more evident (Figs. 1 and 2). Highertemperature and lower precipitation accentuated summer

E. Lugato, A. Berti / Agriculture, Ecosystems and Environment 128 (2008) 97–103102
drought, which halved the maize yield. Olesen et al. (2007) usedtwo regional CMs, driven by the HadAM3H circulation model, toestimate the projected changes in water availability in theMediterranean region, for the A2 scenario. Compared with1961–1990, they reported a reduction in water availability of upto 350 mm in summer for the period 2071–2100, but a smallincrease during winter in north-east Italy. Climate change maythus affect summer crops such as maize and soybean more thanwinter crops, as evidenced by our results (Figs. 2 and 3). However,Morales et al. (2007), considering both herbaceous and woodyvegetation with the LPJ ecosystem model, estimated an NPPchange of between �100 and 100 g C m�2 year�1 across differentregional CM and SRES scenarios in north-east Italy.
4.2. SOC change in the BU and C sequestration of the RMPs
The actual cropping system, represented by the BU scenario,was on average a C sink (Table 4), both in the first commitmentperiod and in 2080. This behaviour is likely due to the higher Cinput in the projected period 2008–2080, as consequence of thehigher productivity induced by the climate change. Only in theHad3 some SOC depletion was estimated, due to the lower C inputin the B1 scenario and to a C input increase in A1FI and A2 ones, notsufficient to offset the increasing SOC decomposition with the mostwarming temperatures (Table 3).
Other authors simulated C balance for different climate changescenarios but at European or world level. Morales et al. (2007)estimated the change in net ecosystem exchange (NEE) for theEurope, using the LPJ ecosystem model. Their results showed anaverage NEE of between �10 and 50 g C m�2 year�1 acrossdifferent regional CMs and SRES scenarios in north-east Italy, inthe period 2071–2100. Smith et al. (2005), using C input from theLPJ and the SOC model RothC (Coleman and Jenkinson, 1996),predicted the SOC change for EU15 cropland between 1990 and2080. They estimated a general SOC depletion ranging from 0 to2 t C ha�1 (0–200 g C m�2 ha�1) for the Had3_A2, in north-eastItaly, but a SOC increase of more than 5 t C ha�1
(500 g C m�2 ha�1) including changes in NPP and the effect oftechnology in increasing yield. In these areas, results form theCESAR model application at European level (Vleeshouwers andVerhagen, 2002) showed a net emission from arable soils in theperiod 2008–2012 of around 100 g C m�2 year�1 for the businessas usual scenario. Although this value appears high (e.g. similar toan extreme land-use change), they estimated the possibility ofsequestering C more efficiently with FM application than reducedtillage. Indeed our results indicate that increasing the C inputthrough manure had the greatest effect only in the short term(Fig. 4). At the end of the simulation RT sequestered an average of493 g C m�2 compared to 404 g C m�2 in FM, indicating morepromising results in the long term for a management that slowsdown the SOC decomposition. Ogle et al. (2005) conducting ameta-analysis to quantify the impact of changing agricultural landuse and management on SOC storage, reported an increase by afactor of 1.09 � 0.03 over 20 years, converting from conventional toreduced tillage in temperate moist areas. Considering this value, SOCcontent in RT treatment should range between 3024 and3195 g C m�2 in 2028, which is consistent with our simulations(Figs. 2 and 3).
C sequestration rates of the simulated RMPs are in agreementwith the values obtained in other long-term experiments on thesame experimental farm (Morari et al., 2006). The authors reporteda sequestration rate of 0.4 t C ha�1 year�1 (40 g C m�2 year�1)comparing grasslands (as RMP) vs. crop rotation, which isconsistent with the average value calculated for GR of37 g C m�2 year�1. Moreover other study in North-Eastern Italy
evidenced that a century of conventional agricultural usedecreased SOC by 48% in the top 10 cm, compared to a referencesoil kept undisturbed under permanent grassland (Del Galdo et al.,2003).
Our simulation clearly indicated that human activity andmanagement choices in agroecosystems could affect the C balancemore strongly than climate change (Fig. 4). SOC change was morepronounced among the RMPs than among different climate changescenarios. The variability induced by different SRES scenarios wasin general very low, even in comparison to CMs.
4.3. Sources of uncertainty
There are many sources of uncertainty that need to bementioned for a better understanding of the results. Firstly, thereis an over-scaling problem, as we used projected climate data witha grid of 10
i � 10i
at field level. However, the projected datasets arebuilt adding the climate change effect to the observed mean andprevious pattern of inter-annual variability. A local study by theRegional Environmental Protection Agency (ARPAV) (Chiaudani,2008) showed a tendency to inter-annual variability change. Inparticular, precipitation is decreasing, with a marked reduction inwinter and summer and a slight increase in mid-autumn.
Another source of uncertainty is that we used a fixedmanagement within the different RMPs and no genetic improve-ment of the crop considered. It is likely that farmers could react inresponse to climate change adopting the more convenientpractices. Change of the crop rotation, period of planting orharvesting and irrigation are some options that we could also haveconsidered in our simulations, varying these practices according tothe different scenarios. Furthermore, although yield changeestimations due to technology (machinery, herbicides, breeding)were available (Ewert et al., 2005), we preferred to maintain a fixedmanagement, rotation and crop yield potential to better evidencethe effect of climate change and make clearer comparisons.
The third aspect is the uncertainty related to the model.Century is a model based on a first-order decomposition kinetics,that implying a direct relation between C input and soil C stock,which could increase without limit as C input levels increase.Stewart et al. (2007) evidenced a saturation of soil C with respectto C input, that reflects the saturation of different mechanisms ofprotection (Six et al., 2002). This is very important when thesimulations are projected in the long term. The final SOC contentsof BU, FM and RT are likely to be far from saturation since thevalues are only slightly higher than the initial (1966) value. Moreuncertain is the final SOC content in GR, which could beoverestimated in the presence of soil saturation. A permanentmeadow with a loam soil on the same experimental farm has anaverage SOC content in the top layer of about 3300 g C m�2
(Morari et al., 2006), indicating the consistent model estimate inthis soil with higher clay content (29% vs. 15% of clay).Furthermore, in Century, decay rate for the different SOC poolsare equally sensible to the temperature, so the Q10 of labile andresistant pools do not change with the increasing temperature.This is notable even if the hypothesis that the more resistant Cfractions may be less temperature sensitive is still controversial.Fang et al. (2005), in an incubation experiment, observed similarresponses of labile and resistant organic matter pools to changesin temperature. Reichstein et al. (2005), incubating soil from aNorway spruce at changing temperature, evidenced stable Q10
independent from soil horizon and incubation time. On thecontrary Conant et al. (2008) demonstrated that temperaturesensitivity of SOC decomposition increases with decreasing SOClability. Further studies are then necessary to clarify thisimportant aspect for SOC dynamic.

E. Lugato, A. Berti / Agriculture, Ecosystems and Environment 128 (2008) 97–103 103
5. Conclusions
The results clearly indicated that human activity and manage-ment choices in agroecosystems could affect the C balance morestrongly than climate change. Conversion to grassland was themost promising practice for sequestering C, in both short- andlong-term. Manure application (at the rate considered) wasanyway a potential C sequestration option that was more effectivethan reduced tillage in the first commitment period, but slightlyless efficient at the end of the simulation. BU was a source of C onlyfor the pessimistic climate model Had3, as consequence ofincreasing temperature and reduced precipitation. In theseconditions, yield decreased particularly in spring–summer crops,such as maize and soybean, whereas it increased for winter wheatdue also to the CO2 fertilization effect. With the other CMs, BUresulted in a carbon sink. Even if these simulations have inherentsources of variability, they showed that cropland managementcould be seen as a reliable human-induced strategy to sequesterCO2 in agricultural soils, at least in northern Italy. We think thatRMPs could have even a major effect, taking into account theadaptation strategies, not considered in this work, which could betailored to future climate change.
Acknowledgements
We would like to thank Steve Williams and Kendrick Killiam ofNREL (Colorado State University) for the help and the precioussuggestions on Century implementation and updates.
References
Allen Jr., L.H., 1990. Plant responses to rising carbon dioxide and potential inter-actions with air pollutants. J. Environ. Qual. 19, 15–34.
Chiaudani, A., 2008. Agroclimatologia statica e dinamica del Veneto: analisi delperiodo 1956–2004. Unpublished Ph.D. Thesis, Universita di Padova, Padova,Italy, 190 pp.
Coleman, K., Jenkinson, D.S., 1996. RothC-26.3—a model for the turnover of carbonin soil. In: Powlson, D.S., Smith, P., Smith, J.U. (Eds.), Evaluation of Soil OrganicMatter Models, NATO ASI Series, vol. 138, Springer-Verlag, Heidelberg.
Conant, R.T., Drijber, R.A., Haddix, M.L., Parton, W.J., Paul, E.A., Plante, A.F., Six, J.,Steinweg, M., 2008. Sensitivity of organic matter decomposition to warmingvaries with its quality. Global Change Biol. 14, 1–10, doi:10.1111/j.1365-2486.20008.01541.x.
Cramer, W., Bondeau, A., Woodward, F.I., Prentice, I.C., Betts, R.A., Brovkin, V., Cox,P.M., Fisher, V., Foley, J.A., Friend, A.D., Kucharik, C., Lomas, M.R., Ramankutty,N., Sitch, S., Smith, B., White, A., Young-Molling, C., 2001. Global response ofterrestrial ecosystem structure and function to CO2 and climate change: resultsfrom six dynamic global vegetation models. Global Change Biol. 7, 357–373.
Del Galdo, I., Six, J., Peressotti, A., Cotrufo, M.F., 2003. Assessing the impact of land-use change on soil C sequestration in agricultural soils by means of organicmatter fractionation and stable C isotopes. Global Change Biol. 9, 1204–1213.
Ewert, F., Rounsevell, M.D.A., Reginster, I., Metzger, M.J., Leemans, R., 2005. Futurescenarios of European agricultural land use. I. Estimating changes in cropproductivity. Agric. Ecosyst. Environ. 107, 101–116.
Fang, C.M., Smith, P., Moncrieff, J.B., Smith, J.U., 2005. Similar response of labile andresistant soil organic matter pools to changes in temperature. Nature 436, 881–1881.
FAO, 1998. Crop evapotranspiration—guidelines for computing crop water require-ments, FAO Irrigation and Drainage Paper 56, Rome.
FAO-UNESCO, 1990. Soil Map of the World, Revised Legend. FAO, Rome.Freibauer, A., Rounsevell, M.D.A., Smith, P., Verhagen, J., 2004. Carbon sequestration
in the agricultural soils of Europe. Geoderma 122, 1–23.IPCC, 2004. Good practice guidance for land use, land-use change and forestry. In:
Penman, J., Gytarsky, M., Hiraishi, T., Krug, T., Kruger, D., Pipatti, R., Buendia,
L., Miwa, K., Ngara, T., Tanabe, K., Wagner, F. (Eds.), Intergovernmental Panelon Climate Change. IGES, Hayama, Japan.
Lal, R., 2004. Soil carbon sequestration to mitigate climate change. Geoderma 123,1–22.
Liwang, Ma, Shaffer, M.J., 2001. A review of carbon and nitrogen processes in nineU.S. soil nitrogen dynamics models. In: Shaffer, M.J., Liwang, Ma, Hansen, S.(Eds.), Modeling Carbon and Nitrogen Dynamic for Soil Management. LewisPublishers, Boca Raton, pp. 55–102.
Lugato, E., Berti, A., Giardini, L., 2006. Soil organic carbon (SOC) dynamics with andwithout residue incorporation in relation to different nitrogen fertilisationrates. Geoderma 135, 315–321.
Lugato, E., Paustian, K., Giardini, L., 2007. Modelling soil organic carbon dynamics intwo long-term experiments of north-eastern Italy. Agric. Ecosyst. Environ. 120,423–432.
Mitchell, T.D., Carter, T.R., Jones, P.D., Hulme, M., New, M., 2004. A comprehensiveset of high-resolution grids of monthly climate for Europe and the globe: theobserved record (1901–2000) and 16 scenarios (2001–2100). Working Paper55, Tyndall Centre for Climate Change Research, University of East Anglia,Norwich, UK.
Morales, P., Hickler, T., Rowell, D.P., Smith, B.T., Sykes, M., 2007. Changes inEuropean ecosystem productivity and carbon balance driven by regional cli-mate model output. Global Change Biol. 13, 108–122.
Morari, F., Lugato, E., Berti, A., Giardini, L., 2006. Long-term effects of recommendedmanagement Practices (RMPs) on soil carbon evolution and sequestration inNorth-eastern Italy. Soil Use Manage. 22, 71–81.
Nakicenovic, N., Alcamo, J., Davis, G., de Vries, B., Fenhann, J., Gaffin, S., Gregory, K.,Grubler, A., Jung, T.Y., Kram, T., La Rovere, E.L., Michaelis, L., Mori, S., Morita, T.,Pepper, W., Pitcher, H., Price, L., Riahi, K., Roehrl, A., Rogner, H.-H., Sankovski, A.,Schlesinger, M., Shukla, P., Smith, S., Swart, R., van Rooijen, S., Victor, N., Dadi, Z.,2000. Special Report on Emissions Scenarios: A Special Report of WorkingGroup III of the Intergovernmental Panel on Climate Change. Cambridge Uni-versity Press, Cambridge, UK.
Ogle, S.M., Breidt, F.J., Paustian, K., 2005. Agricultural management impacts on soilorganic carbon storage under moist and dry climatic conditions of temperateand tropical regions. Biogeochemistry 72, 87–121.
Olesen, J.E., Bindi, M., 2002. Consequences of climate change for European agri-cultural productivity, land use and policy. Eur. J. Agron. 16, 239–262.
Olesen, J.E., Carter, T.R., Diaz-Ambrona, C.H., Fronzek, S., Heidmann, T., Hickler, T.,Holt, T., Quemada, M., Ruiz-Ramos, M., Rubaek, G.H., Sau, F., Smith, B., Sykes,M.T., 2007. Uncertainties in projected impacts of climate change on Europeanagriculture and terrestrial ecosystems based on scenarios from regional climatemodels. Climatic Change 81, 123–143.
Parton, W.J., Schimel, D.S., Ojima, D.S., Cole, C.V., 1994. A general model for soilorganic matter dynamics: sensitivity to litter chemistry, texture and manage-ment. In: Bryant, R.B., Arnold, R.W. (Eds.), Quantitative Modeling of Soil FormingProcesses. SSSA, Madison, WI, SSSA Special Publication 39, pp. 147–167.
Paustian, K., Andren, O., Janzen, H., Lal, R., Smith, P., Tian, G., Tiessen, H., vanNoordwijk, M., Woomer, P., 1997a. Agricultural soil as a C sink to offset CO2
emissions. Soil Use Manage. 13, 230–244.Reichstein, M., Katterer, T., Andren, O., Ciais, P., Schulze, E.D., Cramer, W., Papale, D.,
Valentini, R., 2005. Temperature sensitivity of decomposition in relation to soilorganic matter pools: critique and outlook. Biogeosciences 2, 317–321.
Schoter, D., Cramer, W., Leemans, R., Prentice, I.C., Araujo, M.B., Arnell, N.W.,Bondeau, A., Bugmann, H., Carter, T.R., Gracia, C.A., de la Vega-Leinert, A.C.,Erhard, M., Ewert, F., Glendining, M., House, J.I., Kankaanpaa, S., Klein, R.J.T.,Lavorel, S., Lindner, M., Metzger, M.J., Meyer, J., Mitchell, T.D., Reginster, I.,Rounsevell, M., Sabate, S., Sitch, S., Smith, B., Smith, J., Smith, P., Sykes, M.T.,Thonicke, K., Thuiller, W., Tuck, G., Zaehle, S., Zierl, B., 2005. Ecosystem servicesupply and vulnerability to global change in Europe. Science 310, 1333–1337.
Six, J., Conant, R.T., Paul, E.A., Paustian, K., 2002. Stabilization mechanisms of soilorganic matter: implications for C-saturation of soils. Plant Soil 241, 155–176.
Smith, P., 2004. Carbon sequestration in croplands: the potential in Europe and theglobal context. Eur. J. Agron. 20, 229–236.
Smith, P., 2005. An overview of the permanence of soil organic carbon stocks:influence of direct human-induced, indirect and natural effects. Eur. J. Soil Sci.56, 673–680.
Smith, J.U., Smith, P., Wattenbach, M., Zaehle, S., Hiederer, R., Jones, R.J.A., Mon-tanarella, L., Rounsevell, M.D.A., Reginster, I., Ewert, F., 2005. Projected changesin mineral soil carbon of European croplands and grasslands, 1990–2080.Global Change Biol. 11, 2141–2152.
Stewart, C.E., Paustian, K., Conant, R.T., Plante, A.F., Six, J., 2007. Soil carbonsaturation: concept, evidence and evaluation. Biogeochemistry 86, 19–31.
Vleeshouwers, L.M., Verhagen, A., 2002. Carbon emission and sequestration byagricultural land use: a model study for Europe. Global Change Biol. 8, 519–530.