poster presentation american heart association scientific ... · poster presentation american heart...
TRANSCRIPT
Translation from Highly Multiplexed Biomarker Discovery to a Targeted Panel to Stratify Cardiovascular Risk in Patients with Coronary Heart DiseaseRobert Kirk DeLisle1, Peter Ganz2, Evaldas Katilius1, Shintaro Kato3, Rachel Ostroff1, David Sterling1, Stephen Williams1 1SomaLogic, Inc., Boulder CO; 2Univ of California-San Francisco, San Francisco, CA; 3NEC Corp of America, Irving, TX
Study AimsFailure to translate biomarkers from research to practical clinical measurements is well-recognized. The objective of this study was to transition from discovery of a prognostic model for cardiovascular (CV) events using large scale proteomic analysis to a clinical laboratory platform that offers simplicity, reduced assay costs, and consistency.
The CVD Secondary Risk Panel delivers:■■ Prognostic performance for stratifying CV secondary event risk equivalent to the validated 9-protein model developed with a modified aptamer microarray assay measuring 1130 proteins1 ■■ Reduced cost with a low density array ■■ Response to change in risk over time that outperforms clinical risk models■■ Validated performance meeting CLIA certification standards
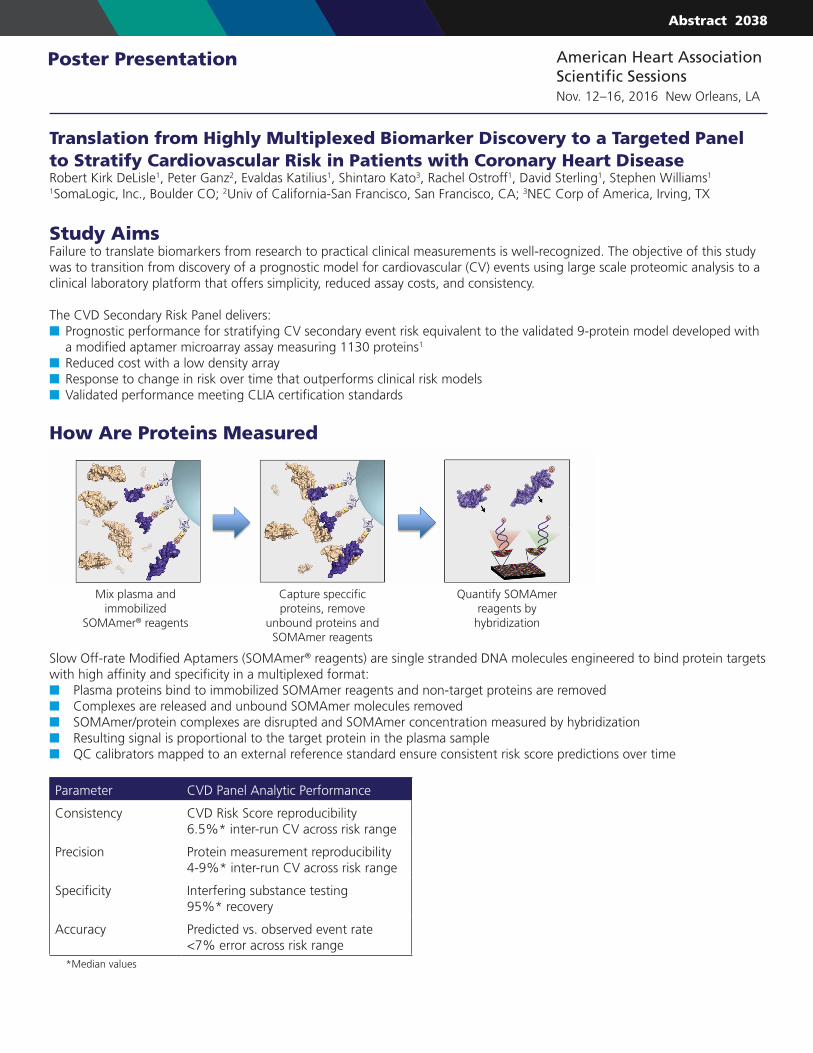
How Are Proteins Measured
Slow Off-rate Modified Aptamers (SOMAmer® reagents) are single stranded DNA molecules engineered to bind protein targets with high affinity and specificity in a multiplexed format:■■ Plasma proteins bind to immobilized SOMAmer reagents and non-target proteins are removed■■ Complexes are released and unbound SOMAmer molecules removed■■ SOMAmer/protein complexes are disrupted and SOMAmer concentration measured by hybridization■■ Resulting signal is proportional to the target protein in the plasma sample■■ QC calibrators mapped to an external reference standard ensure consistent risk score predictions over time
Parameter CVD Panel Analytic Performance
Consistency CVD Risk Score reproducibility6.5%* inter-run CV across risk range
Precision Protein measurement reproducibility4-9%* inter-run CV across risk range
Specificity Interfering substance testing95%* recovery
Accuracy Predicted vs. observed event rate<7% error across risk range
*Median values
Poster Presentation American Heart Association Scientific SessionsNov. 12–16, 2016 New Orleans, LA
Mix plasma and immobilized
SOMAmer® reagents
Capture speccific proteins, remove
unbound proteins and SOMAmer reagents
Quantify SOMAmer reagents by
hybridization
Abstract 2038
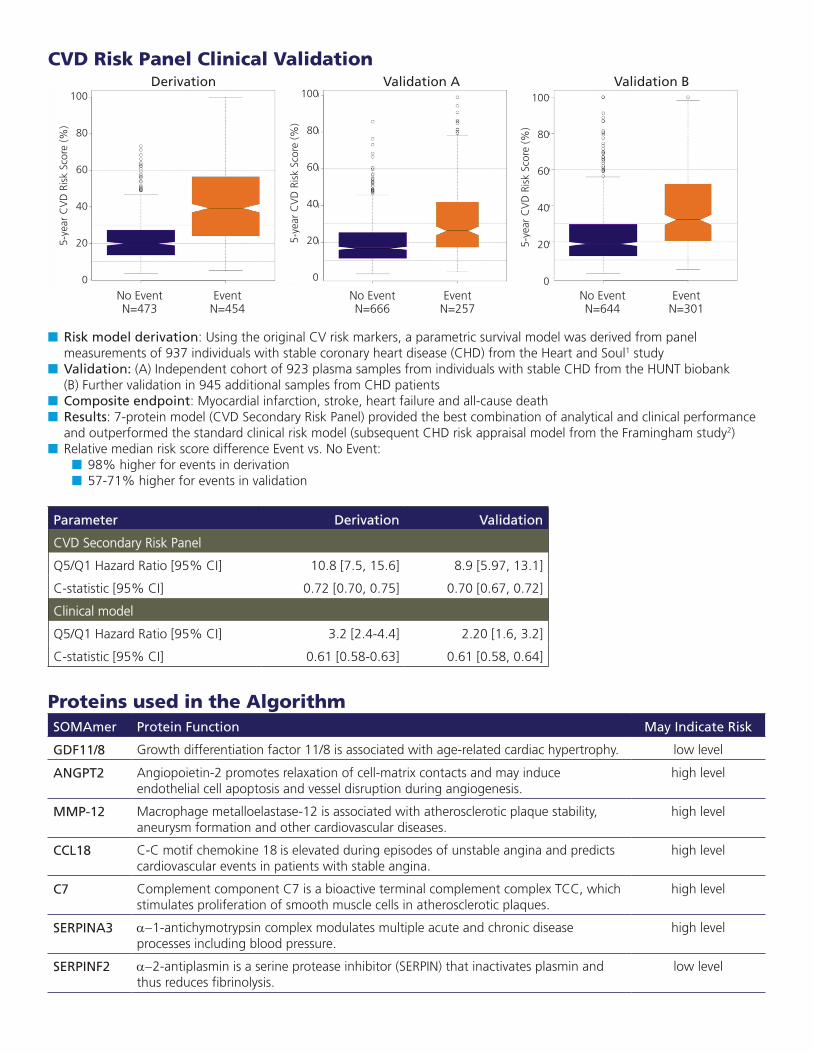
CVD Risk Panel Clinical Validation Derivation Validation A Validation B
No Event Event No Event Event No Event Event N=473 N=454 N=666 N=257 N=644 N=301
■■ Risk model derivation: Using the original CV risk markers, a parametric survival model was derived from panel measurements of 937 individuals with stable coronary heart disease (CHD) from the Heart and Soul1 study■■ Validation: (A) Independent cohort of 923 plasma samples from individuals with stable CHD from the HUNT biobank (B) Further validation in 945 additional samples from CHD patients■■ Composite endpoint: Myocardial infarction, stroke, heart failure and all-cause death ■■ Results: 7-protein model (CVD Secondary Risk Panel) provided the best combination of analytical and clinical performance and outperformed the standard clinical risk model (subsequent CHD risk appraisal model from the Framingham study2)■■ Relative median risk score difference Event vs. No Event:
■■ 98% higher for events in derivation■■ 57-71% higher for events in validation
Parameter Derivation Validation
CVD Secondary Risk Panel
Q5/Q1 Hazard Ratio [95% CI] 10.8 [7.5, 15.6] 8.9 [5.97, 13.1]
C-statistic [95% CI] 0.72 [0.70, 0.75] 0.70 [0.67, 0.72]
Clinical model
Q5/Q1 Hazard Ratio [95% CI] 3.2 [2.4-4.4] 2.20 [1.6, 3.2]
C-statistic [95% CI] 0.61 [0.58-0.63] 0.61 [0.58, 0.64]
Proteins used in the AlgorithmSOMAmer Protein Function May Indicate Risk
GDF11/8 Growth differentiation factor 11/8 is associated with age-related cardiac hypertrophy. low level
ANGPT2 Angiopoietin-2 promotes relaxation of cell-matrix contacts and may induce endothelial cell apoptosis and vessel disruption during angiogenesis.
high level
MMP-12 Macrophage metalloelastase-12 is associated with atherosclerotic plaque stability, aneurysm formation and other cardiovascular diseases.
high level
CCL18 C-C motif chemokine 18 is elevated during episodes of unstable angina and predicts cardiovascular events in patients with stable angina.
high level
C7 Complement component C7 is a bioactive terminal complement complex TCC, which stimulates proliferation of smooth muscle cells in atherosclerotic plaques.
high level
SERPINA3 a-1-antichymotrypsin complex modulates multiple acute and chronic disease processes including blood pressure.
high level
SERPINF2 a-2-antiplasmin is a serine protease inhibitor (SERPIN) that inactivates plasmin and thus reduces fibrinolysis.
low level
5-ye
ar C
VD
Ris
k Sc
ore
(%)
100
80
60
40
20
05-
year
CV
D R
isk
Scor
e (%
)
100
80
60
40
20
0
5-ye
ar C
VD
Ris
k Sc
ore
(%)
100
80
60
40
20
0
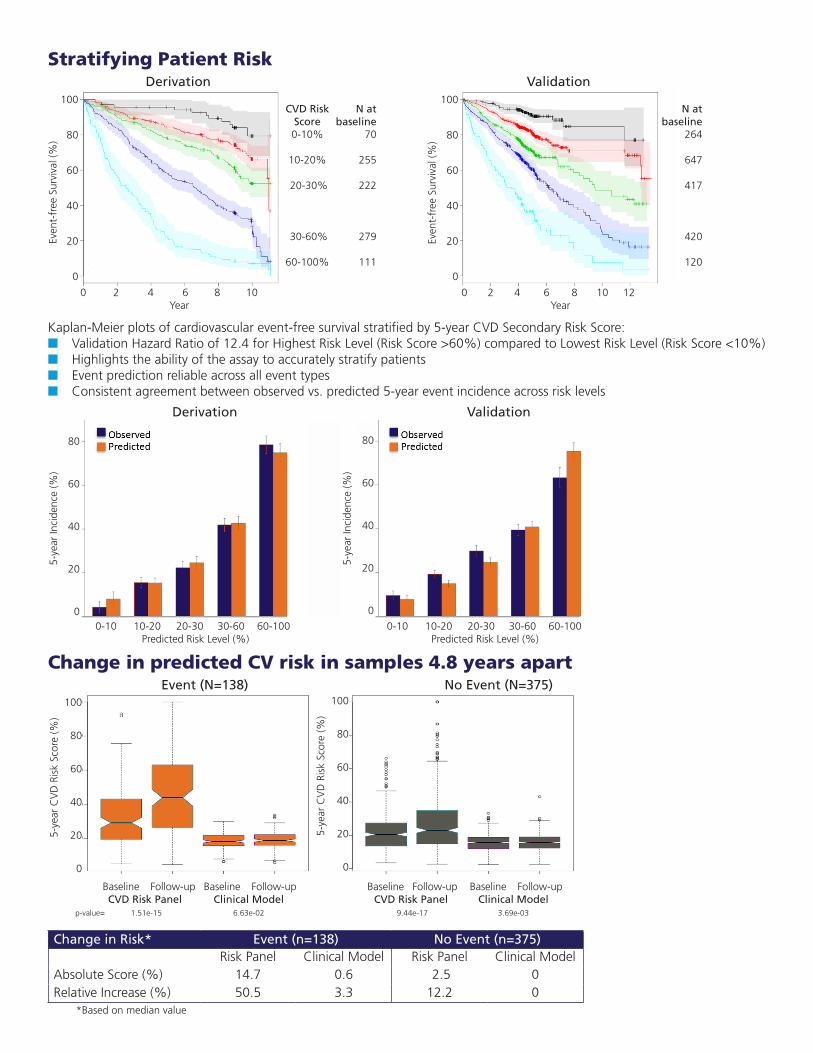
Stratifying Patient Risk Derivation Validation
Kaplan-Meier plots of cardiovascular event-free survival stratified by 5-year CVD Secondary Risk Score:■■ Validation Hazard Ratio of 12.4 for Highest Risk Level (Risk Score >60%) compared to Lowest Risk Level (Risk Score <10%)■■ Highlights the ability of the assay to accurately stratify patients■■ Event prediction reliable across all event types■■ Consistent agreement between observed vs. predicted 5-year event incidence across risk levels
Derivation Validation
Change in predicted CV risk in samples 4.8 years apart Event (N=138) No Event (N=375)
Baseline Follow-up Baseline Follow-up Baseline Follow-up Baseline Follow-up CVD Risk Panel Clinical Model CVD Risk Panel Clinical Model p-value= 1.51e-15 6.63e-02 9.44e-17 3.69e-03
Change in Risk* Event (n=138) No Event (n=375)Risk Panel Clinical Model Risk Panel Clinical Model
Absolute Score (%) 14.7 0.6 2.5 0Relative Increase (%) 50.5 3.3 12.2 0
*Based on median value
CVD Risk N at N at Score baseline baseline 0-10% 70 264
10-20% 255 647
20-30% 222 417
30-60% 279 420
60-100% 111 120
100
80
60
40
20
0
100
80
60
40
20
0
0 2 4 6 8 10Year
0 2 4 6 8 10 12Year
Even
t-fr
ee S
urvi
val (
%)
Even
t-fr
ee S
urvi
val (
%)
5-ye
ar In
cide
nce
(%)
80
60
40
20
00-10 10-20 20-30 30-60 60-100
Predicted Risk Level (%)0-10 10-20 20-30 30-60 60-100
Predicted Risk Level (%)
80
60
40
20
0
5-ye
ar In
cide
nce
(%)
5-ye
ar C
VD
Ris
k Sc
ore
(%)
100
80
60
40
20
0
5-ye
ar C
VD
Ris
k Sc
ore
(%)
100
80
60
40
20
0
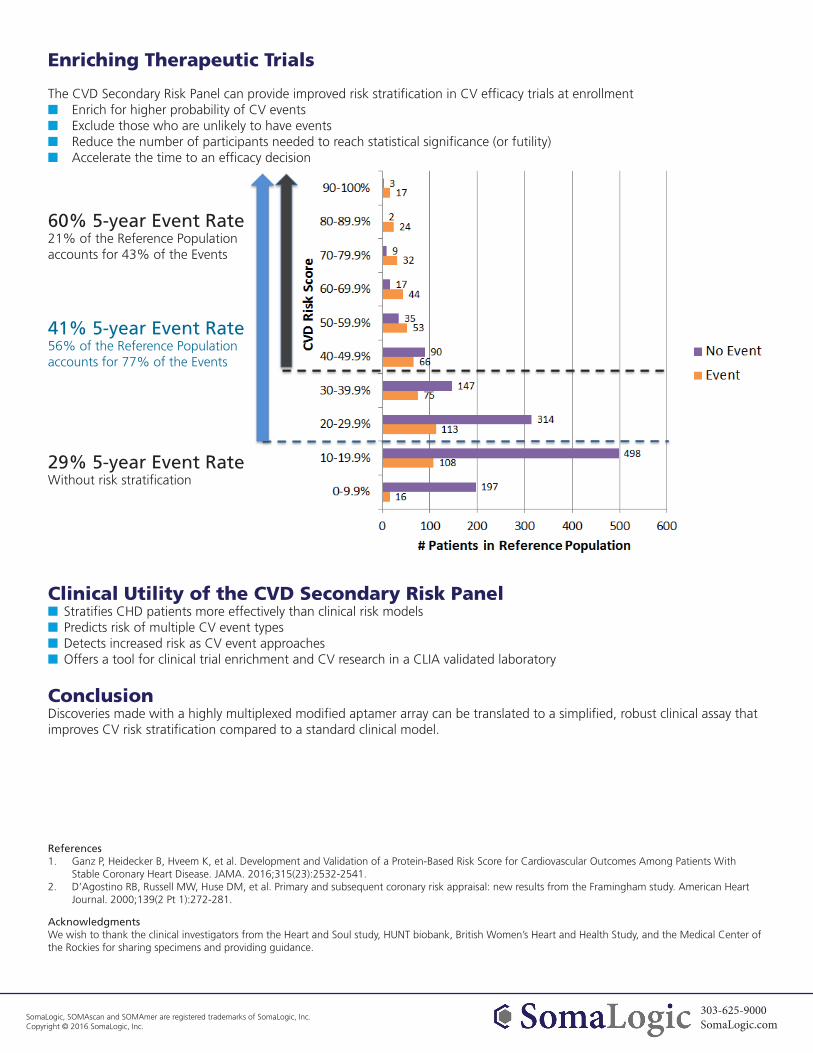
Enriching Therapeutic Trials
The CVD Secondary Risk Panel can provide improved risk stratification in CV efficacy trials at enrollment■■ Enrich for higher probability of CV events■■ Exclude those who are unlikely to have events■■ Reduce the number of participants needed to reach statistical significance (or futility)■■ Accelerate the time to an efficacy decision
60% 5-year Event Rate21% of the Reference Population accounts for 43% of the Events
41% 5-year Event Rate56% of the Reference Population accounts for 77% of the Events
29% 5-year Event RateWithout risk stratification
Clinical Utility of the CVD Secondary Risk Panel■■ Stratifies CHD patients more effectively than clinical risk models■■ Predicts risk of multiple CV event types■■ Detects increased risk as CV event approaches■■ Offers a tool for clinical trial enrichment and CV research in a CLIA validated laboratory
ConclusionDiscoveries made with a highly multiplexed modified aptamer array can be translated to a simplified, robust clinical assay that improves CV risk stratification compared to a standard clinical model.
References1. Ganz P, Heidecker B, Hveem K, et al. Development and Validation of a Protein-Based Risk Score for Cardiovascular Outcomes Among Patients With
Stable Coronary Heart Disease. JAMA. 2016;315(23):2532-2541.2. D’Agostino RB, Russell MW, Huse DM, et al. Primary and subsequent coronary risk appraisal: new results from the Framingham study. American Heart
Journal. 2000;139(2 Pt 1):272-281.
AcknowledgmentsWe wish to thank the clinical investigators from the Heart and Soul study, HUNT biobank, British Women’s Heart and Health Study, and the Medical Center of the Rockies for sharing specimens and providing guidance.
303-625-9000SomaLogic.com
SomaLogic, SOMAscan and SOMAmer are registered trademarks of SomaLogic, Inc. Copyright © 2016 SomaLogic, Inc.