post-treatment of secondary wastewater treatment plant effluent using a two-stage fluidized bed...
TRANSCRIPT

RESEARCH ARTICLE Open Access
Post-treatment of secondary wastewatertreatment plant effluent using a two-stagefluidized bed bioreactor systemGolam Hossein Safari1†, Kaan Yetilmezsoy2†, Amir Hossein Mahvi3 and Mansur Zarrabi4*†
Abstract
The aim of this study was to investigate the performance of a two-stage fluidized bed reactor (FBR) system for thepost-treatment of secondary wastewater treatment plant effluents (Shahrak Gharb, Tehran, Iran). The proposedtreatment scheme was evaluated using pilot-scale reactors (106-L of capacity) filled with PVC as the fluidized bed(first stage) and gravel for the filtration purpose (second stage). Aluminum sulfate (30 mg/L) and chlorine (1 mg/L)were used for the coagulation and disinfection of the effluent, respectively. To monitor the performance of the FBRsystem, variation of several parameters (biochemical oxygen demand (BOD5), chemical oxygen demand (COD),turbidity, total phosphorous, total coliform and fecal coliform) were monitored in the effluent wastewater samples.The results showed that the proposed system could effectively reduce BOD5 and COD below 1.95 and 4.06 mg/L,respectively. Turbidity of the effluent could be achieved below 0.75 NTU, which was lower than those reported forthe disinfection purpose. The total phosphorus was reduced to 0.52 mg/L, which was near the presentphosphorous standard for the prevention of eutrophication process. Depending on both microorganismconcentration and applied surface loading rates (5–10 m/h), about 35 to 75% and 67 to 97% of coliform wereremoved without and with the chlorine addition, respectively. Findings of this study clearly confirmed the efficiencyof the FBR system for the post-treatment of the secondary wastewater treatment plant effluents without any solidproblem during the chlorination.
Keywords: Secondary effluent, COD, Coliform, Fluidized bed reactor
IntroductionApplication of fluidized bed reactors (FBR) in wastewa-ter treatment has received much attention in the worldtoday due to their high efficiency, and low capital andoperating costs. This technology is also gaining popula-rity as a result of increasingly stringent discharge stan-dards and increased water reclamation demand. Inrecent years, FBR technology has also been conducted asan effective method to treat various types of high-strengthwastewaters such as corn steep liquor [1], distillery efflu-ent [2], synthetic sago wastewater [3], high-sulfate waste-water [4] and so on.
In general, effluents from secondary wastewater treat-ment plants are further treated in tertiary plants for re-use. In tertiary treatment plants, various methods suchas membrane processes, advanced oxidation process, ad-sorption, filtration and others can be used for purifica-tion or post-treatment of wastewater effluents [5,6]. Theproperties of wastewater effluents can directly influencethe filtration rate and selection of the appropriate filtermedia. In water treatment plants, filter media are oftenselected as sand matter and fixed in a tank [7]. In filtra-tion of secondary wastewater treatment plant effluentsfor the future reuse, the filter media sizes are oftenlighter and greater for prevention from clothing, as wellas for providing higher operation time. However, in thatcase, the filter media may not be able to properly treatthe effluents due to greater filter media size [8]. If the fil-ter media is chosen as fine as possible, the clothing andlower operation time will become the main problems.
* Correspondence: [email protected]†Equal contributors4Department of Environmental Health Engineering, Faculty of Health, AlborzUniversity of Medical Sciences, Karaj, IranFull list of author information is available at the end of the article
JOURNAL OF ENVIRONMENTAL HEALTHSCIENCE & ENGINEERING
© 2013 Safari et al.; licensee BioMed Central Ltd. This is an Open Access article distributed under the terms of the CreativeCommons Attribution License (http://creativecommons.org/licenses/by/2.0), which permits unrestricted use, distribution, andreproduction in any medium, provided the original work is properly cited.
Safari et al. Journal of Environmental Health Science and Engineering 2013, 11:10http://www.ijehse.com/content/11/1/10

To overcome these problems, a proper alternative canbe the treatment of effluents before passing through thefilter media [7]. Considering the above-mentioned facts,it is noteworthy that FBR technology can be used as aneffective method for the complete biological treatmentof the secondary wastewater effluents before the filtra-tion process.To the best of the authors' knowledge, there are no
systematic papers in the literature specifically devoted toa study regarding the application of a two-stage FBR sys-tem with a filtration column for treatment of secondaryeffluents. Therefore, clarification of the place of thepresent subject in the scheme of secondary wastewatertreatment can be considered as a specific field of investi-gation to compare results with the above-mentionedstudies. For that reason, the aim of the present work wasto investigate the performance of a two-stage fluidizedbed bioreactor system, filled with PVC as the fluidizedbed (first stage) and gravel for the filtration purpose(second stage), for the post-treatment of the secondarywastewater treatment plant effluent.
Materials and methodsWastewater sampleThe raw wastewater samples were obtained from ShahrakGharb (Tehran, Iran) wastewater treatment plant efflu-ents. The type of treatment in Shahrak Gharb wastewatertreatment plant was activated sludge with surface aerator.Some wastewater characteristics of the samples are givenin Table 1. Components of the obtained samples were de-termined by the procedures described in the StandardMethods [9].
Preparation of bacterial cultureMultiple tube fermentation method was used for deter-mination of total coliform and also fecal coliform. TheLactose broth, Brilliant Green and EC broth (Merck,Germany) were used for the preparation of the microbialculture. Microbial culture was prepared according to theprocedures described in the Standard Methods [9].
Bioreactor set-upA simple schematic of the present bioreactor is depictedin Figure 1. As seen in Figure 1, the FBR system has twocylindrical columns. The first column was filled withPVC material (0.40 m in height) with an effective size of4 mm and 0.84 g/cm3 density. About 40% of the first col-umn was filled with PVC matter for better fluidization ofthe bed. The second column was filled with gravel (0.50 min height) with an effective size of 2 mm and 2.5 g/cm3
density for the final clarification. The gravels wereobtained from the local area. Prior to filling the secondbed, the gravels were kept in 10% HCl solution to removeany clay and other residual contaminants. The externaldiameter, total height and total capacity of both columnswere 30 cm, 150 cm and 106 L, respectively. All parts ofthe reactors were made of transparent Plexiglas materialwith a wall thickness of 2 mm. The effluents were pumpedby peristaltic pumps (Masterflex Cole-Parmer VernonHills, IL, USA) at surface loading rates of 5.0, 7.5 and 10.0m/h. The range of surface loading rates was chosen basedon filter media size and target pollutant [10-12]. The FBRsystem was designed to maintain 2 cm of wastewatercolumn above both beds to ensure a continuous flow rate.Perforated diffuser plates (with 1 mm-hole diameter) wereused at the above and bottom of the beds.On the basis of the preliminary jar test results,
aluminum sulfate (30 mg/L) was added into secondaryeffluents for the coagulation purpose. Chlorine (1 mg/L)was added for the disinfection of the effluents. Thewastewater samples were mixed with a vertical stirrer(Lovibond, USA) to obtain a uniform environment infeeding material. The FBR system was operated in a con-tinuous mode feeding by pumping of the fresh feed intothe reactors. The bioreactors were maintained at re-spective temperatures for about 10 days to allowtemperature equilibration and the growth of microor-ganisms. After this period, the performance of thepresent FBR system was investigated in a temperature-controlled environment (35°C) by collecting wastewatersamples from the effluent of the second bed atpredetermined intervals of 2 h for the further microbialand physicochemical analyses.
Pressure drop and washing of bedsThe pressure drop was determined as a measure of de-crease in flow rate and removal efficiency. The height of
Table 1 Characteristics of secondary wastewatertreatment plant effluents
Parameters Minimum Maximum Average SDa
5-day Biochemical OxygenDemand (BOD5, mg/L)
16.9 21.5 18.76 1.78
Chemical Oxygen Demand(COD, mg/L)
32 40 35.38 3.61
Total Kjeldahl Nitrogen(TKN, mg/L)
0.69 2.76 1.69 0.797
Total Phosphorus (TP, mg/L) 4.5 4.9 4.75 0.16
Total Solids (TS, mg/L) 556 704.6 640.72 64.18
Turbidity (NTU) 6.2 7.5 6.86 0.559
Electrical Conductivity(EC, μmoss/cm)
730 935 833 81.06
Total Coliform (MPN/100 mL) 22 × 103 175 × 103 115800 61650
Fecal Coliform (MPN/100 mL) 14 × 103 105 × 103 58280 37420
pH 7.2 7.5 7.32 0.13a Standard deviation.
Safari et al. Journal of Environmental Health Science and Engineering 2013, 11:10 Page 2 of 9http://www.ijehse.com/content/11/1/10

the water column above of both columns was maintainedas 2 cm to ensure continuous flow rate and to avoid chan-neling of the wastewater. When the height of the watercolumn reached to about 2.2 cm, the columns were re-moved and backwashed with the distilled water. Moreover,when the pollutant concentration in bioreactor effluentsexceeded the influent concentration, the bioreactor wascleaned by backwashing. In the present work, bothmethods were applied to investigate the pressure dropproblem. The second column was backwashed once pertwo days of operation to prevent pressure drop. Duringbackwashing of the second bed, the effluent from the firstcolumn was re-circulated towards the inlet of the first bedto maintain the microbial activity. For the present case, itwas observed that most of the sludge was captured at theinternal parts of the second bed.
Results and discussionRemoval of BOD5 and CODThe concentration of biological oxygen demand (BOD5)in wastewater treatment plant effluents can significantlyinfluence the dissolved oxygen rate in receiving waterbodies. The daily standard for BOD5 in secondary waste-water effluents is limited to be maintained at or below30 mg/L by authorized organization [7,13]. In addition,the concentration of BOD5 in clean water or clean riversis restricted to as low as 2 mg/L [14]. Therefore, anytreatment methods must reduce the BOD5 concentra-tion to below 2 mg/L.Figure 2a shows the removal of BOD5 at different sur-
face loading rates. It is clear from this figure that BOD5
and surface loading rate significantly influence the re-moval efficiency. Higher removal efficiency was observedin 7.5 m/h surface rate and 18.5 mg/L of BOD5 concen-tration. In this condition, about 91% of BOD5 was
SecondColumn
FirstColumn
PeristalticPump - 2
0.50 m
1.50 m
0.40 m
Sample tap
PeristalticPump - 1
Feeding tank
Vertical stirrer
First Column effluent
Effluent
Figure 1 Schematic of the experimental set-up.
BOD5 (mg/L)
16 17 18 19 20 21 22
Rem
oval
effi
cien
cy (
%)
60
65
70
75
80
85
90
95
5.0 m/h7.5 m/h10 m/h
a
COD (mg/L)
30 32 34 36 38 40 42 44
Rem
oval
effi
cien
cy (
%)
50
60
70
80
90
100
5.0 m/h7.5 m/h10 m/h
b
Figure 2 Removal efficiency of BOD5 (a) and COD (b) atdifferent initial concentrations and surface loading rates.
Safari et al. Journal of Environmental Health Science and Engineering 2013, 11:10 Page 3 of 9http://www.ijehse.com/content/11/1/10

removed and the BOD5 concentration in the FBR effluentwas observed to be 1.67 mg/L. In addition, at that surfacerate and the initial BOD5 concentration of 19.5 mg/L, the ef-fluent concentration was measured to be about 1.95 mg/L.Therefore, it can be concluded that the present system canmeet the available standards at 7.5 m/h of hydraulic rateand the initial BOD5 concentration of 18.5 to 19.5 mg/L.The lowest removal efficiency was observed at 20.9 mg/L ofBOD5 and 10 m/h of hydraulic rate. In this condition, thefinal concentration of BOD5 was determined as 6.11 mg/L.Figure 2b illustrates the removal of COD at different
surface loading rates. Likewise, higher removal efficiencyfor COD was observed at 7.5 m/h of surface loading rateand initial COD concentration of 34 mg/L. At this con-dition, about 90.05% of COD was removed and the efflu-ent concentration was reduced to about 3.23 mg/L. Forthe initial COD concentration of 38 mg/L and at 7.5 m/hof surface loading rate, the effluent concentration ofCOD was reached to be 4.06 mg/L. Furthermore, thelower removal efficiency was observed at 10 m/h hydraulicrate. Based on the relationship between BOD5 and COD[7,9], the present system can reduce the influent CODconcentration to below available standards at initial CODconcentration of 34 to 38 mg/L and at 7.5 m/h of hy-draulic rate.In the tertiary treatment (coagulation–flocculation–
disinfection for irrigation reuse) of a secondary wastewa-ter treatment plant effluent, removal percentages forBOD5 and COD (initial BOD5 and COD concentrationswere 11.6 (± 3.1) mg/L and 38.8 (± 6.3) mg/L, respect-ively) was obtained to be 46% and 39%, respectively. Inthe study, the authors reported that the final BOD5 andCOD concentrations were reached to 6.3 (± 2.4) mg/Land 25.4 (± 4.8) mg/L, respectively [15]. In another work[16], slow sand filtration system was conducted for thepost-treatment of up-flow anaerobic sludge blanket(UASB) reactor effluent (average BOD5 and COD wasabout 50 and 120 mg/L, respectively). The study con-cluded that removal percentages for BOD5 and CODwere achieved to be 43% and 34% in during the first fewhours (36 h) and reached to be about 85% and 79% after7 days operation, respectively. Therefore, after 7 days op-eration, the BOD5 and COD concentrations in slow sandfilter effluent were observed to be 7.5 and 25.2 mg/L,respectively [16]. With respect to slow sand filtrationand coagulation–flocculation–disinfection process, re-sults obtained from the present work was remarkablesince the final concentrations of BOD5 and COD were1.67 and 3.23 mg/L, respectively, which were muchlower than those works.
Removal of turbidityRemoval of turbidity is necessary for an effective disin-fection process. In the water environment, the turbidity
agent can protect the viral and bacterial organismagainst the disinfectant matter. For an effective disinfec-tion, the authorized organization have been set up theturbidity standard as low as 1 NTU. In addition, the tur-bidity can be used as a measure of filter performanceand pressure drop [17,18]. For that reason, in this work,removal of turbidity was investigated as an importantwastewater characteristic. Figure 3 shows the removal ofturbidity at various turbidity unit and surface loadingrate. The highest removal efficiency was observed at 5m/h surface loading rate and 7.26 unit of turbidity. Atthis condition, about 89.67% of turbidity was removedand therefore final value reached to below 0.75 NTU. Asmentioned earlier, for an effective disinfection, turbiditymust be lower than 1 NTU. Therefore, the present FBRsystem is capable to reduce turbidity to below 1 NTU.Considering the higher percentage removal of turbidity
(89.67%) and lower turbidity in the effluent, it can beconcluded that the results obtained in the present workwas better than the values reported in post treatment ofUASB reactor effluent by slow sand filtration [16]. Inthat work, the average turbidity was 56.5 NTU and themaximum removal percentage was reported to be91.60%. Based on this removal efficiency, the turbidity ineffluent was reached to an average of 2.9 NTU. In thatwork, the sand depth and effective size was 54 cm and0.43 mm, respectively. As compared to that work, how-ever higher initial turbidity, the present system containinga fluidized bed with a filter medium with 50 cm graveldepths and 2 mm effective size, seem to be more effectiveand reliable for the turbidity removal. In another workconducted for the tertiary treatment of municipal sewagevia slow sand filtration, higher removal efficiency for tur-bidity was reported to be about 88% for the sand with aneffective size of 0.23 mm and a sand depth of 84 cm [19].When compared with slow sand filtration [15,19], the
Turbidity (NTU)
7,00 7,05 7,10 7,15 7,20 7,25 7,30 7,35 7,40
Rem
oval
effi
cien
cy (
%)
60
70
80
90
1005.0 m/h7.5 m/h10 m/h
Figure 3 Removal of turbidity at various turbidity unit andsurface loading rate.
Safari et al. Journal of Environmental Health Science and Engineering 2013, 11:10 Page 4 of 9http://www.ijehse.com/content/11/1/10
present results showed better removal percentage for tur-bidity. In another work for tertiary treatment of a secon-dary effluent by the coupling of coagulation–flocculation–disinfection, the initial turbidity was reported to be 6.9(± 4.3) NTU and after the treatment reached to 1.2 (± 0.4)NTU, which is near to the present results [15]. The overallresults clearly demonstrate that only slow sand filtration isnot only enough to removal of turbidity and so needsmore treatment process such as coagulation or two-stagebed filtration like the present system.
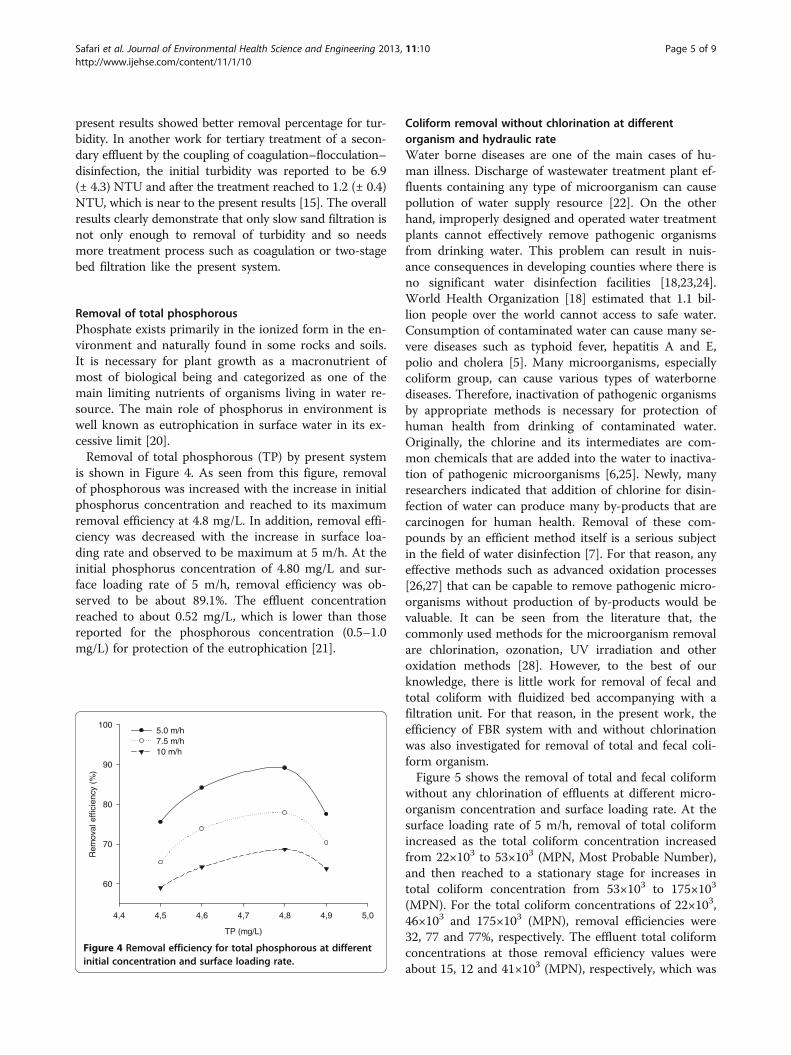
Removal of total phosphorousPhosphate exists primarily in the ionized form in the en-vironment and naturally found in some rocks and soils.It is necessary for plant growth as a macronutrient ofmost of biological being and categorized as one of themain limiting nutrients of organisms living in water re-source. The main role of phosphorus in environment iswell known as eutrophication in surface water in its ex-cessive limit [20].Removal of total phosphorous (TP) by present system
is shown in Figure 4. As seen from this figure, removalof phosphorous was increased with the increase in initialphosphorus concentration and reached to its maximumremoval efficiency at 4.8 mg/L. In addition, removal effi-ciency was decreased with the increase in surface loa-ding rate and observed to be maximum at 5 m/h. At theinitial phosphorus concentration of 4.80 mg/L and sur-face loading rate of 5 m/h, removal efficiency was ob-served to be about 89.1%. The effluent concentrationreached to about 0.52 mg/L, which is lower than thosereported for the phosphorous concentration (0.5–1.0mg/L) for protection of the eutrophication [21].
Coliform removal without chlorination at differentorganism and hydraulic rateWater borne diseases are one of the main cases of hu-man illness. Discharge of wastewater treatment plant ef-fluents containing any type of microorganism can causepollution of water supply resource [22]. On the otherhand, improperly designed and operated water treatmentplants cannot effectively remove pathogenic organismsfrom drinking water. This problem can result in nuis-ance consequences in developing counties where there isno significant water disinfection facilities [18,23,24].World Health Organization [18] estimated that 1.1 bil-lion people over the world cannot access to safe water.Consumption of contaminated water can cause many se-vere diseases such as typhoid fever, hepatitis A and E,polio and cholera [5]. Many microorganisms, especiallycoliform group, can cause various types of waterbornediseases. Therefore, inactivation of pathogenic organismsby appropriate methods is necessary for protection ofhuman health from drinking of contaminated water.Originally, the chlorine and its intermediates are com-mon chemicals that are added into the water to inactiva-tion of pathogenic microorganisms [6,25]. Newly, manyresearchers indicated that addition of chlorine for disin-fection of water can produce many by-products that arecarcinogen for human health. Removal of these com-pounds by an efficient method itself is a serious subjectin the field of water disinfection [7]. For that reason, anyeffective methods such as advanced oxidation processes[26,27] that can be capable to remove pathogenic micro-organisms without production of by-products would bevaluable. It can be seen from the literature that, thecommonly used methods for the microorganism removalare chlorination, ozonation, UV irradiation and otheroxidation methods [28]. However, to the best of ourknowledge, there is little work for removal of fecal andtotal coliform with fluidized bed accompanying with afiltration unit. For that reason, in the present work, theefficiency of FBR system with and without chlorinationwas also investigated for removal of total and fecal coli-form organism.Figure 5 shows the removal of total and fecal coliform
without any chlorination of effluents at different micro-organism concentration and surface loading rate. At thesurface loading rate of 5 m/h, removal of total coliformincreased as the total coliform concentration increasedfrom 22×103 to 53×103 (MPN, Most Probable Number),and then reached to a stationary stage for increases intotal coliform concentration from 53×103 to 175×103
(MPN). For the total coliform concentrations of 22×103,46×103 and 175×103 (MPN), removal efficiencies were32, 77 and 77%, respectively. The effluent total coliformconcentrations at those removal efficiency values wereabout 15, 12 and 41×103 (MPN), respectively, which was
TP (mg/L)
4,4 4,5 4,6 4,7 4,8 4,9 5,0
Rem
oval
effi
cien
cy (
%)
60
70
80
90
1005.0 m/h7.5 m/h10 m/h
Figure 4 Removal efficiency for total phosphorous at differentinitial concentration and surface loading rate.
Safari et al. Journal of Environmental Health Science and Engineering 2013, 11:10 Page 5 of 9http://www.ijehse.com/content/11/1/10

not acceptable for environmental discharge of effluentswithout chlorination. Removal of fecal coliform at 5 m/hof surface loading rate increased about linearly with in-creases in fecal coliform concentration from 14×103 to50×103 (MPN). Removal efficiencies were 50 and 82%for fecal coliform concentrations of 14×103 and 50×103
(MPN), respectively. According to these removal percen-tages, the effluent fecal coliform concentrations were de-termined as 7×10³ and 9×10³ (MPN), respectively. Resultsindicated that the final fecal coliform concentrations didnot meet the standard levels for the fecal coliform.At surface loading rate of 7.5 m/h, removal efficiency
was increased about linearly for fecal total coliform from52 to 60% for increases in total coliform concentrationfrom 27×103 to 140×103 (MPN), respectively. For thesevalues, the effluent total coliform concentrations were13×103 to 56×103 (MPN), respectively. For the fecal coli-form, removal efficiency increased from 44 to 73% withincreases in coliform concentration from 16×103 to105×103 (MPN), respectively. The effluent fecal coliform
concentration was 9×10³ (MPN) at 44% removal effi-ciency and 28×103 (MPN) at 73% removal efficiency. Re-sult indicated that either total coliform or fecal coliformat those values of removal efficiency did not meet thestandard levels for environmental discharges. Conse-quently, increasing of surface loading rate from 5 to 7.5m/h led to decreases in coliform removal efficiencies.At surface loading rate of 10 m/h, total and fecal coli-
form removal efficiencies decreased with the increase incoliform concentration. With the increase in total coliformconcentration from 33×103 to 110×103 (MPN), removalefficiency decreased from 64 to 45% respectively. On theother hand, fecal coliform removal efficiency was de-creased from 53 to 35% with the increase in fecal coliformconcentration from 17×103 to 60×103 (MPN), respectively.The concentration of total coliform in filter effluents was12×103 (MPN) at 64% removal efficiency and 60×103
(MPN) at 45% removal efficiency. Similarly, fecal coliformconcentration was 8×10³ (MPN) at 53% removal efficiencyand 39×103 (MPN) at 35% removal efficiency.
MPN/100 mL (× 103)
20 40 60 80 100 120 140 160 180
Rem
oval
effi
cien
cy (
%)
30
40
50
60
70
80
5 m/h7.5 m/h10 m/h
MPN/100 mL (× 103)
20 40 60 80 100
Rem
oval
effi
cien
cy (
%)
30
40
50
60
70
80
90
5 m/h7.5 m/h10 m/h
a
b
Figure 5 Removal of total coliform (a) and fecal coliform (b) atdifferent microorganism concentration and surface loading ratewithout chlorination (MPN: Most Probable Number).
MPN/100 mL (× 103)
20 40 60 80
Rem
oval
effi
cien
cy (
%)
86
88
90
92
94
96
98
5 m/h7.5 m/h10 m/h
MPN/100 mL (× 103)
5 10 15 20 25 30 35
Rem
oval
effi
cien
cy (
%)
65
70
75
80
85
90
95
5 m/h7.5 m/h10 m/h
a
b
Figure 6 Removal of total coliform (a) and fecal coliform (b) atdifferent microorganism concentration and surface loading ratewith chlorination (MPN: Most Probable Number).
Safari et al. Journal of Environmental Health Science and Engineering 2013, 11:10 Page 6 of 9http://www.ijehse.com/content/11/1/10
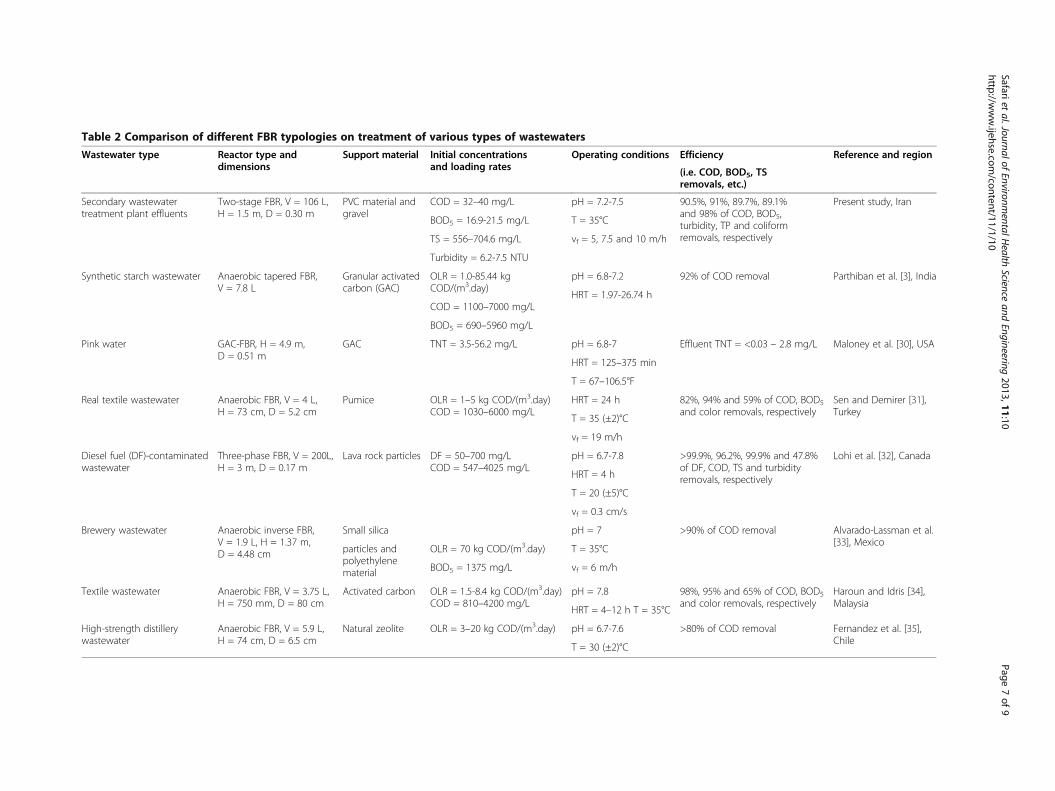
Table 2 Comparison of different FBR typologies on treatment of various types of wastewaters
Wastewater type Reactor type anddimensions
Support material Initial concentrationsand loading rates
Operating conditions Efficiency Reference and region
(i.e. COD, BOD5, TSremovals, etc.)
Secondary wastewatertreatment plant effluents
Two-stage FBR, V = 106 L,H = 1.5 m, D = 0.30 m
PVC material andgravel
COD = 32–40 mg/L pH = 7.2-7.5 90.5%, 91%, 89.7%, 89.1%and 98% of COD, BOD5,turbidity, TP and coliformremovals, respectively
Present study, Iran
BOD5 = 16.9-21.5 mg/L T = 35°C
vf = 5, 7.5 and 10 m/hTS = 556–704.6 mg/L
Turbidity = 6.2-7.5 NTU
Synthetic starch wastewater Anaerobic tapered FBR,V = 7.8 L
Granular activatedcarbon (GAC)
OLR = 1.0-85.44 kgCOD/(m3.day)
pH = 6.8-7.2 92% of COD removal Parthiban et al. [3], India
HRT = 1.97-26.74 hCOD = 1100–7000 mg/L
BOD5 = 690–5960 mg/L
Pink water GAC-FBR, H = 4.9 m,D = 0.51 m
GAC TNT = 3.5-56.2 mg/L pH = 6.8-7 Effluent TNT = <0.03 – 2.8 mg/L Maloney et al. [30], USA
HRT = 125–375 min
T = 67–106.5°F
Real textile wastewater Anaerobic FBR, V = 4 L,H = 73 cm, D = 5.2 cm
Pumice OLR = 1–5 kg COD/(m3.day)COD = 1030–6000 mg/L
HRT = 24 h 82%, 94% and 59% of COD, BOD5
and color removals, respectivelySen and Demirer [31],Turkey
T = 35 (±2)°C
vf = 19 m/h
Diesel fuel (DF)-contaminatedwastewater
Three-phase FBR, V = 200L,H = 3 m, D = 0.17 m
Lava rock particles DF = 50–700 mg/LCOD = 547–4025 mg/L
pH = 6.7-7.8 >99.9%, 96.2%, 99.9% and 47.8%of DF, COD, TS and turbidityremovals, respectively
Lohi et al. [32], Canada
HRT = 4 h
T = 20 (±5)°C
vf = 0.3 cm/s
Brewery wastewater Anaerobic inverse FBR,V = 1.9 L, H = 1.37 m,D = 4.48 cm
Small silica pH = 7 >90% of COD removal Alvarado-Lassman et al.[33], Mexico
particles andpolyethylenematerial
OLR = 70 kg COD/(m3.day) T = 35°C
vf = 6 m/hBOD5 = 1375 mg/L
Textile wastewater Anaerobic FBR, V = 3.75 L,H = 750 mm, D = 80 cm
Activated carbon OLR = 1.5-8.4 kg COD/(m3.day)COD = 810–4200 mg/L
pH = 7.8 98%, 95% and 65% of COD, BOD5
and color removals, respectivelyHaroun and Idris [34],Malaysia
HRT = 4–12 h T = 35°C
High-strength distillerywastewater
Anaerobic FBR, V = 5.9 L,H = 74 cm, D = 6.5 cm
Natural zeolite OLR = 3–20 kg COD/(m3.day) pH = 6.7-7.6 >80% of COD removal Fernandez et al. [35],Chile
T = 30 (±2)°C
Safarietal.Journalof
EnvironmentalH
ealthScience
andEngineering
2013,11:10Page
7of
9http://w
ww.ijehse.com
/content/11/1/10
Results demonstrated that total and fecal coliformcould be removed effectively in surface loading rate of 5and 7.5 m/h, with increasing in organism concentration.Decreases in coliform removal efficiency at 10 m/h sur-face rate may be attributed to the removal of biofilmlayer from the fluidized bed and also due to disorientingof the filter bed at high hydraulic loading conditions.Therefore, it can be concluded that both surface rateand microorganism concentration will affect the removalefficiency. In overall, the microorganism concentrationas coliform from wastewater plant effluent and influentto the FBR system was in the range of 15–175×103
(MPN), and the present system removed about 30% to83% of microorganism depending on the microorganismtype and the surface loading rate. However, it is notedthat the discharge standard for secondary wastewater ascoliform organism has been reported to be below 200–400 MPN/100 mL [28]. The removal percentage ofpresent system was considerable, but the FBR could notmeet the compliance with the effluent discharge stan-dards for the coliform organism without chlorination.Therefore, a proper disinfection will be required whentreating secondary wastewater with the FBR system.
Coliform removal with chlorinationFigure 6 shows the effect of chlorine addition on coli-form organism removal efficiency in used reactor. Asseen from this figure, addition of chlorine leads to in-crease in microorganism removal without affected by hy-draulic loading rate. With chlorination, almost 90 to98% of both total and fecal coliform were removed de-pending on coliform concentration and hydraulic surfaceloading rate. Considering all applied surface loadingrates and different microorganism concentrations, thefinal concentrations for both total and fecal coliformwere reached to below 2.2 MPN/100 mL. Therefore, itcan be concluded that the FBR system can meet thewater standard for drinking water with chlorine addition[13]. It is reported that chlorine concentration for theoxidation of raw or secondary wastewater can be as highas 5–20 mg/L and at such higher level; chlorine additionleads to enhance TS concentration in the treated waste-water [28]. However, in the present work, we observedno increment in TS concentration during FBR–chlorin-ation of secondary wastewater for the removal of coli-form organism. More importantly, the used chlorineconcentration (1 mg/L) applied to the secondary waste-water was very low as compared to other studies, indi-cating the advantage of the present system for themicroorganism removal.Table 2 summarizes performance data concerning the
comparison of different FBR configurations on treatmentof various types of wastewaters such as synthetic starchwastewater [29], pink water [30], real textile wastewater
[31], diesel fuel-contaminated wastewater [32], brewerywastewater [33], textile wastewater [34], and high-strength distillery wastewater [35]. The performancedata reveals that wide range of operating conditions havebeen conducted to remove COD, BOD5, color, TS, TPand others. Various types of materials such as PVC,gravel, granular activated carbon (GAC), pumice, lavarock particles, small silica particles, polyethylene mater-ial and natural zeolite, has been used as growth supportmedia. The performance data figures out that initial pHhas been conducted between 6.7 and 7.8, and a widerange of initial COD has been studied in the limits of32–7000 mg/L. On the basis of maximum removalsobtained from different FBR configurations, the presentdata seems to be comparable with those reported byothers (Table 2). However, it is noted that differences aredue to the characteristics of studied wastewaters and ex-perimental conditions such as applied loading rates, ini-tial concentration of pollutants, hydraulic retention time,operating temperature, and also different types of sup-port media. These differences may also be attributed tothe presence of several recalcitrant inorganic com-pounds, complex components, and other undesirableimpurities in the wastewaters.As seen from the recent literature, there are no sys-
tematic papers specifically devoted to a study regardingthe application of a two-stage FBR system with a filtra-tion column for the post-treatment treatment of second-ary wastewater treatment plant effluents. For this reason,the present study aimed at fulfilling the gap in this fieldby focusing upon the treatment performance of FBRtechnology on real secondary effluents. Moreover, mostof studies were conducted at laboratory-scale; however,the applicability of the FBR system was specifically in-vestigated at pilot-scale in the present work. Besidesconventional waster parameters, the efficiency of a two-stage FBR system was also investigated as a specific ob-jective for inactivation of pathogenic organisms (i.e. totaland fecal coliform organism) with and without chlorin-ation. Based on the above-mentioned facts, the noveltyof the present study is highlighted with comparison ofexperimental results from the previous publications.
ConclusionThe study revealed that a two-stage pilot-scale FBR sys-tem for secondary wastewater treatment was technicallyfeasible in terms of BOD5, COD, turbidity, TP, total coli-form and fecal coliform. Depending on both microorgan-ism concentration and applied surface loading rates, theFBR system could meet the available standards with re-moval percentages above 90%. The FBR–chlorination sys-tem could be used as a promising post-treatment processto improve the quality of the final discharge without anyincrease in TS concentration during the chlorination.
Safari et al. Journal of Environmental Health Science and Engineering 2013, 11:10 Page 8 of 9http://www.ijehse.com/content/11/1/10
Competing interestsThe authors declare that they have no competing interests.
Authors’ contributionsGHS was involved in experimental parts and take the initial samples fromwastewater treatment plant. KY was involved in drafting the manuscript orrevising it critically for important intellectual content, and made substantialcontributions to conception and design. AHM reviewed the final manuscriptand also involved in experimental parts. MZ participated in the design of thestudy, made substantial contributions to acquisition of data, or analysis andinterpretation of data, and gave final approval of the version to bepublished. All authors read and approved the final manuscript.
AcknowledgementsThe authors would like to thank the Alborz University of Medical Sciences forsupporting of this work.
Author details1Department of Environmental Health Engineering, School of Public Health,Tehran University of Medical Sciences, Tehran, Iran. 2Department ofEnvironmental Engineering, Faculty of Civil Engineering, Yildiz TechnicalUniversity, Istanbul, Turkey. 3Department of Environmental HealthEngineering & Center of Water Quality Research, Tehran University of MedicalSciences, Tehran, Iran. 4Department of Environmental Health Engineering,Faculty of Health, Alborz University of Medical Sciences, Karaj, Iran.
Received: 17 December 2012 Accepted: 9 June 2013Published: 17 June 2013
References1. Zhang W, Xie Q, Rouse JD, Qiao S, Furukawa K: Treatment of high-strength
corn steep liquor using cultivated polyvinyl alcohol gel beads in ananaerobic fluidized-bed reactor. J Biosci Bioeng 2009, 107(1):49–53.
2. Sowmeyan R, Swaminathan G: Evaluation of inverse anaerobic fluidizedbed reactor for treating high strength organic wastewater. Biores Technol2008, 99(9):3877–3880.
3. Parthiban R, Iyer P, Sekaran G: Anaerobic tapered fluidized bed reactor forstarch wastewater treatment and modeling using multilayer perceptronneural network. J Environ Sci 2007, 19(12):1416–1423.
4. Chao-Hai W, Wen-Xiang W, Zhi-Yi D, Chao-Fei W: Characteristics of high-sulfate wastewater treatment by two-phase anaerobic digestion processwith Jet-loop anaerobic fluidized bed. J Environ Sci 2007, 19(3):264–270.
5. Seven O, Dindar B, Aydemir S, Metin D, Ozinel MA, Icli S: Solarphotocatalytic disinfection of a group of bacteria and fungi aqueoussuspensions with TiO2, ZnO and Sahara desert dust. J PhotochemPhotobio A Chem 2004, 165(1–3):103–107.
6. Yin YG, Ding Y: A close to real-time prediction method of total coliformbacteria in foods based on image identification technology and artificialneural network. Food Res Inter 2009, 42(1):191–199.
7. Andreozzi R, Caprio V, Insola A, Marotta R: Advanced oxidation processes(AOP) for water purification and recovery. Catalysis Today 1999, 53(1):51–59.
8. Lonnen J, Kilvington S, Kehoe SC, Al-Touati A, McGuigan KG: Solar andphotocatalytic disinfection of protozoan, fungal and bacterial microbesin drinking water. Water Res 2005, 39(5):877–883.
9. AWWA (American Water Work Accocation): Standard methods for theexamination of water and wastewater. 21st edition. Washington DC: AWWA; 2005.
10. Ngo HH, Vigneswaran S: Application of floating medium filter in waterand wastewater treatment with contact-flocculation filtrationarrangement. Water Res 1995, 29(9):2211–2213.
11. Ngo HH, Vigneswaran S: Application of down flow floating mediumflocculator/prefilter (DFF) - coarse sand filter (CSF) in nutrient removal.Water Sci Technol 1996, 33(3):63–70.
12. Davidson J, Helwig N, Summerfelt ST: Fluidized sand biofilters used toremove ammonia, biochemical oxygen demand, total coliform bacteria,and suspended solids from an intensive aquaculture effluent. Aqua Eng2008, 39(1):6–15.
13. World Health Organization (WHO): Guidelines for the safe use of wastewater,excreta and grey water, printed in France. 2006.
14. United Nations Environment Programme (UNEP) World Health Organization(Ed): Water Quality Monitoring. Firstth edition. London, UK: Published byE&FN Spon; 1996.
15. Ustun GE, Akal Solmaz SK, Ciner F, Baskaya HS: Tertiary treatment of asecondary effluent by the coupling of coagulation–flocculation–disinfection for irrigation reuse. Desalination 2011, 277(1–3):207–212.
16. Tyagi VK, Khan AA, Kazmi AA, Mehrotra I, Chopra AK: Slow sand filtration ofUASB reactor effluent: A promising post treatment technique.Desalination 2009, 249(2):571–576.
17. Fallmann H, Krutzler T, Bauer R, Malato S, Blanco J: Applicability of thePhoto-Fenton method for treating water containing pesticides. CatalysisToday 1999, 54(2–3):309–319.
18. World Health Organization (WHO): Guidelines for Drinking-water Quality,Volume 1. 3rd edition. Geneva: Recommendation; 2004.
19. Al-Adham SS: Tertiary treatment of municipal sewage via slow sand filtration,MS Thesis. Dhahran, Saudi Arabia: King Fahd University of Petroleum &Minerals; 1989.
20. Tunali Akar S, Tosun I, Ozcan A, Gedikbey T: Phosphate removal potentialof the adsorbent material prepared from thermal decomposition ofalunite ore–KCl mixture in environmental cleanup. Desalination 2010,260(1–3):107–113.
21. Zhang J, Shen Z, Shan W, Chen Z, Mei Z, Lei Y, Wang W: Adsorptionbehavior of phosphate on Lanthanum(III) doped mesoporous silicatesmaterial. J Env Sci 2010, 22(4):507–511.
22. Hwang MG, Katayama H, Ohgaki S: Inactivation of Legionella pneumophilaand Pseudomonas aeruginosa: Evaluation of the bactericidal ability ofsilver cations. Water Res 2007, 41(18):4097–4104.
23. Ausland G, Stevik TK, Hanssen JF, Kohler JC, Jenssen PD: Intermittentfiltration of wastewater-removal of fecal coliforms and fecal streptococci.Water Res 2002, 36(14):3507–3516.
24. Oates PM, Shanahan P, Polz MF: Solar disinfection (SODIS): simulation ofsolar radiation for global assessment and application for point-of-usewater treatment in Haiti. Water Res 2003, 37(1):47–54.
25. Melian JAH, Rodroguez JMD, Suarez AV, Rendon ET, Do Campo CV, Arana J,Pena JP: The photocatalytic disinfection of urban wastewaters.Chemosphere 2000, 41(3):323–327.
26. Alrousan DMA, Dunlop PSM, McMurray TA, Byrne JA: Photocatalyticinactivation of E. coli in surface water using immobilised nanoparticleTiO2 films. Water Res 2009, 43(1):47–54.
27. Lydakis-Simantiris N, Riga D, Katsivela E, Mantzavinos D, Xekoukoulotakis NP:Disinfection of spring water and secondary treated municipalwastewater by TiO2 photocatalysis. Desalination 2010, 250(1):351–355.
28. Metcalf and Eddy: Wastewater Engineering, Treatment and Reuse. 4thedition. Singapore: Mc Graw Hill; 2005.
29. Rangasamy P, Pvr I, Ganesan S: Anaerobic tapered fluidized bed reactorfor starch wastewater treatment and modeling using multilayerperceptron neural network. J Environ Sci 2007, 19(12):1416–1423.
30. Maloney SW, Adrian NR, Hickey RF, Heine RL: Anaerobic treatment ofpinkwater in a fluidized bed reactor containing GAC. J Hazard Mater2002, 92(1):77–88.
31. Sen S, Demirer GN: Anaerobic treatment of real textile wastewater with afluidized bed reactor. Water Res 2003, 37(8):1868–1878.
32. Lohi A, Alvarez Cuenca M, Anania G, Upreti SR, Wan L: Biodegradation ofdiesel fuel-contaminated wastewater using a three-phase fluidized bedreactor. J Hazard Mater 2008, 154(1–3):105–111.
33. Alvarado-Lassman A, Rustrian E, García-Alvarado MA, Rodríguez-Jiménez GC,Houbron E: Brewery wastewater treatment using anaerobic inversefluidized bed reactors. Biores Technol 2008, 99(8):3009–3015.
34. Haroun M, Idris A: Treatment of textile wastewater with an anaerobicfluidized bed reactor. Desalination 2009, 237(1–3):357–366.
35. Fernandez N, Montalvo S, Borja R, Guerrero L, Sanchez E, Cortes I,Colmenarejo MF, Travieso L, Raposo F: Performance evaluation of ananaerobic fluidized bed reactor with natural zeolite as support materialwhen treating high-strength distillery wastewater. Renew Energ 2008,33(11):2458–2466.
doi:10.1186/2052-336X-11-10Cite this article as: Safari et al.: Post-treatment of secondary wastewatertreatment plant effluent using a two-stage fluidized bed bioreactorsystem. Journal of Environmental Health Science and Engineering 201311:10.
Safari et al. Journal of Environmental Health Science and Engineering 2013, 11:10 Page 9 of 9http://www.ijehse.com/content/11/1/10