post-remediation quantitative risk assessment for controlled … · post remediation quantitative...
TRANSCRIPT
Vertase F.L.I. Limited3000 Aviator WayManchester Business ParkManchester M22 5TG
Tel +44 (0) 161 437 2708Fax +44 (0) 161 437 6300
Email [email protected]
Post-Remediation Quantitative Risk Assessment for Controlled Waters
Former Bayer CropScience SiteHauxtonCambridgeshire
December 2012
On behalf of:
Harrow Estates Plc
Post Remediation Quantitative Risk Assessment for Controlled Waters
i
December 2012 907BRI/RevB
Table of Contents
1.0 Introduction ............................................................................................................................................. 1
1.1 Limitations ........................................................................................................................................ 2
2.0 Remediation Strategy and Approach to Risk Assessment ................................................................ 3
3.0 Summary of Site Activities and Environmental Works....................................................................... 5
4.0 Environmental Setting............................................................................................................................ 7
4.1 Site Description ................................................................................................................................ 7
4.2 Geology ............................................................................................................................................ 7 4.2.1 Pre-Remediation Ground Conditions ...................................................................................... 7 4.2.2 Post Remediation Ground Conditions ..................................................................................... 8
4.3 Hydrogeology ................................................................................................................................. 10 4.3.1 Made Ground and Drift Deposits ........................................................................................... 10 4.3.2 West Melbury Marly Chalk Formation ................................................................................... 11 4.3.3 Gault Formation..................................................................................................................... 11 4.3.4 Groundwater Levels and Flow Direction ............................................................................... 11
4.4 Hydrology ....................................................................................................................................... 16
5.0 Risk Assessment Approach ................................................................................................................ 17
5.1 Post Remediation Site Model......................................................................................................... 17 5.1.1 Contaminant Source.............................................................................................................. 17 5.1.2 Pathways ............................................................................................................................... 18 5.1.3 Receptor ................................................................................................................................ 18
5.2 Risk Assessment Methodology ...................................................................................................... 18
5.3 Assessment of CoC Distribution .................................................................................................... 19 5.3.1 Zoning of Reinstated Soil Materials....................................................................................... 19 5.3.2 Deriving Probability Density Functions.................................................................................. 19
5.4 Level 1 Assessment ....................................................................................................................... 19
5.5 Level 3 (Groundwater) Assessment............................................................................................... 20
6.0 Model Inputs.......................................................................................................................................... 22
6.1 Contaminants ................................................................................................................................. 22 6.1.1 CoC Distribution and Concentrations .................................................................................... 23
6.2 Receptors ....................................................................................................................................... 24
6.3 Selection of Screening Criteria....................................................................................................... 24 6.3.1 Derivation of Pesticide Screening Criteria............................................................................. 24 6.3.2 Selected Screening Criteria................................................................................................... 25
6.4 Soil Source Parameters – Level 1 Assessment............................................................................. 27 6.4.1 Dry Bulk Density .................................................................................................................... 27 6.4.2 Fraction of Organic Carbon ................................................................................................... 27 6.4.3 Soil Moisture Content ............................................................................................................ 28 6.4.4 Particle Density...................................................................................................................... 28
6.5 Selection of Aquifer Pathway Parameters – Level 3a Assessment ............................................... 29 6.5.1 Aquifer Thickness .................................................................................................................. 30 6.5.2 Dry Bulk Density .................................................................................................................... 30 6.5.3 Mixing Zone Thickness.......................................................................................................... 30 6.5.4 Hydraulic Conductivity ........................................................................................................... 30 6.5.5 Effective Porosity................................................................................................................... 31 6.5.6 Hydraulic Gradient................................................................................................................. 31
Post Remediation Quantitative Risk Assessment for Controlled Waters
ii
December 2012 907BRI/RevB
6.5.7 Groundwater Flow Direction .................................................................................................. 32 6.5.8 Dispersivity ............................................................................................................................ 33 6.5.9 Fraction of Organic Carbon ................................................................................................... 33 6.5.10 Summary ............................................................................................................................... 33
6.6 Model Settings................................................................................................................................ 34 6.6.1 Model Iterations and Time Slices .......................................................................................... 34 6.6.2 Level 3a Model Correlations.................................................................................................. 34 6.6.3 Simulation of Biodegradation................................................................................................. 35
6.7 Contaminant Parameters ............................................................................................................... 35 6.7.1 Data Sources......................................................................................................................... 35 6.7.2 Selection of Parameters ........................................................................................................ 37
6.8 Summary of Physical Chemical Properties used in Model ............................................................ 40
7.0 Risk Assessment .................................................................................................................................. 45
7.1 Level 1 Risk Assessments ............................................................................................................. 45
7.2 Derivation of Leachate Histograms for Level 3a Model ................................................................. 46
7.3 Level 3a Models and Risk Assessment Outcome.......................................................................... 47
8.0 Summary................................................................................................................................................ 49
9.0 References............................................................................................................................................. 51
Post Remediation Quantitative Risk Assessment for Controlled Waters
iii December 2012 907BRI/RevB
Appendices
Appendix A VertaseFLI Drawings
Appendix B Type A Material Classification Data
Appendix C Pre Remediation Trial Pit Logs
Appendix D Trial Pit photos
Appendix E Validation Borehole Logs
Appendix F Riddy Brook Levels - 2011
Appendix G Risk Assessment Flow Chart
Appendix H Contaminant of Concern Source Zones
Appendix I Contaminants of Concern – Source Distributions and
Level 1 Inputs
Appendix J Derivation of Hempa and Schradan PNEC
Appendix K Aquifer Parameter Histograms – Type A
Appendix L Aquifer Parameter Histograms – Type B
Appendix M Physical Chemical Parameters Distribution
Justifications
Appendix N Site specific Kd distributions for Bis(2-
chloroethyl)ether, Hempa and Schradan
Appendix O Level 1 Predicted Leachate Ranges and Level 3
Contaminant Inputs
Appendix P Data CD
A – Contaminant of Concern Source Concentrations
B – Infiltrometer Results
C – Aquifer Properties Data
D – Physical Chemical Data – Literature Values
E – Level 1 Models

Post Remediation Quantitative Risk Assessment for Controlled Waters
iv December 2012 907BRI/RevB
F – Level 1 Results
G – Level 3 Models
Post Remediation Quantitative Risk Assessment for Controlled Waters
1 December 2012 907BRI/RevB
1.0 Introduction
VertaseFLI have been appointed by Harrow Estates Plc to undertake remedial works at the
former Bayer Crop Science agrochemicals works in Hauxton, Cambridgeshire (the site).
The site was determined as a Special Site under Part 2a of the Environmental Protection
Act (EPA) 1990 due to significant pollutant linkages being identified with respect to
groundwater and surface water resulting from the former use of the site in the production
and storage of agrochemicals.
At the time of writing, all buildings and structures at the site had been demolished and
removed (with the exception of the Mill House in the northernmost corner of the site) and
remedial works had been completed prior to redevelopment of the site for primarily
residential purposes. Remedial works at the site comprised the following:
The excavation of contaminated soil material;
The treatment of contaminated soil material via the formation of biopiles or treatment
beds (including the addition of organic matter) and turning of the contaminated soil
material;
The recovery, treatment and discharge of contaminated groundwater, and;
The reinstatement of the remediated soil material.
During the remedial works, in order for the remediated soil material to be reinstated, it was
necessary to demonstrate through the development of an appropriately detailed risk
assessment and derivation of remedial targets, that the reinstated soils would not present a
significant risk to local receptors such as groundwater and surface water. Initial risk
assessment and remedial targets for the site were based on site investigation data collected
prior to remediation (Atkins (2007), Reference 1). As the remedial works progressed, more
data was collected regarding the properties and volumes of soil materials and a more
representative post remedial conceptual site model (CSM) was developed and the remedial
targets were revised accordingly (VertaseFLI (July 2011), Reference 2).
However, these risk assessments were still based on limited data, particularly with respect
to the hydraulic properties of the reinstated soil material, and the final distribution of residual
contaminants in the remediated soils. Therefore, as part of the validation process for the
remediated site, and in accordance with the VertaseFLI remediation method statement
(Reference 3), a final risk assessment has been undertaken for the Riddy Brook with
Post Remediation Quantitative Risk Assessment for Controlled Waters
2 December 2012 907BRI/RevB
respect to the remediated site using all available data collected during the remedial works
including final contaminant concentrations, distributions and in-situ testing of the reinstated
remediated soils.
This report therefore forms part of the validation of the site and describes and assesses the
risk assessment post remediation with respect to controlled waters including the
methodology used, the parameters used and their selection and the findings.
1.1 Limitations
It is important to note that this document refers to the CSM with respect to the controlled
waters risk assessment only. A risk assessment addressing Human Health will be
undertaken separately and submitted under separate cover.
Post Remediation Quantitative Risk Assessment for Controlled Waters
3 December 2012 907BRI/RevB
2.0 Remediation Strategy and Approach to Risk Assessment
As previously described in VertaseFLI (July 2011), Reference 2, the main strategy for the
remediation at the site was to excavate all materials at the site to ensure that all uncertainty
regarding contaminants and geological conditions are removed. All excavated soil material
was to be segregated, classified and treated as appropriate before being reinstated and
validated. Any contaminated groundwater was to be separated, treated and disposed from
the site under discharge consent. Following the remediation and reinstatement of soils, a
clean cover system will be imported from off-site above the finished levels by the developer.
Paragraphs 6.3 and 6.4 of the Remediation Method Statement (Reference 3) set out the
approach to be used in developing the risk assessment with respect to environmental
receptors as follows:
6.3 An important part of the approach of our remedial strategy will be to collect
further information on the geology, hydrogeology, contamination, material
parameters and characteristics during the remedial works. It is our intention
that this information will be used to further develop the site model to re-
evaluate the remediation targets. This will be continually re-assessed as the
remediation is continued and may ultimately result in the preparation of a
numerical model that represents exact site conditions with a high degree of
certainty to prove that materials present on site post remediation do not
represent a significant risk of significant harm to the environment and that
adequate remediation works have been completed to satisfy the
requirements under Part IIa of the Environmental Protection Act 1990.
6.4 This modelling approach will be calibrated by site based monitoring and the
mode calibrated appropriately. It does mean that some material will be
replaced at the site that does not meet the present generic criteria but
through the remediation we will have detailed data and knowledge of this
material which will allow clearer understanding of the site. This knowledge
and understanding will be used to present a new conceptual model and
appropriate risk assessment.
Based on the above approach, this report represents the final iteration of the risk
assessment as part of the validation of the reinstated soil materials. The risk assessment
model has been reassessed and updated to incorporate all relevant data collected through

Post Remediation Quantitative Risk Assessment for Controlled Waters
4 December 2012 907BRI/RevB
the remediation and validation process and any new data relating to contaminants of
concern (COCs) to accurately and robustly assess the risks to controlled waters from the
COCs in the soils at the site following completion of the remediation works.
Post Remediation Quantitative Risk Assessment for Controlled Waters
5 December 2012 907BRI/RevB
3.0 Summary of Site Activities and Environmental Works
The history and development of the site including historic site processes are discussed in
detail in Enviros (2005) (Reference 4) and Atkins (2006) (Reference 5).
The following bullet points briefly summarise the key developments at the site and the
environmental investigations / works undertaken to date:
Pre 1940, the site was largely undeveloped, with the exception of a petrol station
understood to have been located in the north of the site;
1940 - The site was occupied by a contract spraying company;
1943 – The site was first used for synthesis of pesticides;
1970’s – A bentonite clay and cement cut-off wall was constructed along the
boundary between the site and the Riddy Brook;
1986 to 1989 – The warehouse building in the south of the site was constructed;
1991 to 1996 – Aspinwall & Co (now Enviros Consulting Ltd) conducted four phases
of investigation, primarily to assess the groundwater flow regime and contaminant
levels across the site;
1991 to 1996 – It is understood that the groundwater abstraction sumps were
installed in the north of the site during this period;
2003 – The site was determined as a Special Site under Part IIa of the Environment
Protection Act (1990) by the Environment Agency (EA);
2004 – Site ceased operating;
2004 to 2006 - Decommissioning of plant and some demolition undertaken;
2005 – Enviros Consulting Ltd conducted further investigations and risk
assessments to assess the previously identified potentially significant pollutant
linkages with respect to the Part IIa Special Site designation;
2006 – Atkins prepared a preliminary Conceptual Model for the site;
2006 to 2007 – Atkins undertook intrusive investigations at the site and prepared
detailed quantitative risk assessments for both human health and controlled waters;
2007 – Demolition of above ground structures completed;
Post Remediation Quantitative Risk Assessment for Controlled Waters
6 December 2012 907BRI/RevB
2008 - First iteration of the VertaseFLI Remediation Method Statement Issued;
2010 – Remedial works commenced in March 2010;
July 2011 – Most recent iteration of groundwater risk assessment issued by
VertaseFLI (Reference 2);
November 2011 – Remedial works largely completed and all remediated soils
reinstated;
November 2011 – Addendum risk assessment to July 2011 groundwater risk
assessment issued by VertaseFLI to address risks from Contaminants not
previously identified (CNPIs) on site (Reference 6 – reissued March 2012); and
May 2012 – Remedial works completion report issued by VertaseFLI (Reference 7),
and reissued in December 2012 (Rev B);
August 2012 – Addendum completion report issued by VertaseFLI (Reference 27)
and reissued December 2012 (Rev B);
August 2012 – Groundwater Validation report issued by VertaseFLI (Reference 28)
and reissued December 2012 (Rev B);
August 20120 – Groundwater Validation Addendum Report issued by VertaseFLI
(Reference 29) reissued December 2012 (Rev B);
August 2012 – Post Remediation Risk Assessment model issued by VertaseFLI,
and reissued in December 2012
Post Remediation Quantitative Risk Assessment for Controlled Waters
7 December 2012 907BRI/RevB
4.0 Environmental Setting
4.1 Site Description
The site is situated approximately 200 m northwest of the village of Hauxton (National Grid
Ref TL 432524), and covers an area of approximately 9 hectares. A location plan is
presented in Drawing D907_01, Appendix A.
It was most recently occupied by Bayer CropScience and used for the production and
storage of agrochemicals including pesticides, insecticides and herbicides. Remedial works
have recently been completed at the site and it currently comprises reinstated soils across
the entire extent.
The site is bounded to the west by the A10 trunk road beyond which is agricultural land and
the Waste Water Treatment Plant (WWTP) for the Site. The northern and eastern site
boundaries are formed by the Riddy Brook, with Church Road forming the southern site
boundary and the southeast of the site bounded by agricultural land.
The remediated site slopes gently towards the north with ground levels falling from
approximately 13 m AOD in the extreme south to approximately 11 m AOD in the north.
4.2 Geology
4.2.1 Pre-Remediation Ground Conditions
The British Geological Survey (BGS) Solid and Drift Geology Map for the area (Sheet 205 –
Saffron Walden) (Reference 8) shows the geology in the immediate area of the site to
comprise the following:
Made Ground – Not indicated as present at the site;
Drift Deposits – The map indicates the site to be underlain by River Terrace
Deposits comprising silt, sand and gravel, with alluvium (silt, clay, sand and gravel
with peat) present along the eastern site boundary;
West Melbury Marly Chalk Formation (WMMCF) – The WMMCF is shown to
underlie the drift deposits and is described by the BGS as ‘buff, grey and off-white,
soft marly chalk and hard grey limestone’;
Cambridge Greensand Member – The Cambridge Greensand Member forms the
base of the WMMCF and is described by the BGS as ‘pale greenish grey marl rich in
phosphatic nodules (so called “coprolites”) at base’. It should be noted that the
Post Remediation Quantitative Risk Assessment for Controlled Waters
8 December 2012 907BRI/RevB
Cambridge Greensand Member was excavated extensively in the local area during
the mid to late 19th century for the phosphate rich coprolites (Reference 9). Given
the relative shallow depths to the base of the WMMCF it is considered likely that the
site has been affected by these activities.;
Gault Formation – ‘Pale to dark grey or blue grey clay or mudstone’, and
Woburn Sands Formation – Part of the Lower Greensand Group comprising
sandstone or loose sand.
Based on the information provided by Enviros (2005) and Atkins (2006) (References 4 and
5), the pre-remediation ground conditions at the site are presented in Table 1.
Table 1: Ground Conditions
Description Thickness
Made Ground (consisting of reworked sand and gravel, chalk marl, alluvium, brick rubble and clinker), foundations, drainage features and voids
Typically up to 2 m bgl, with a maximum thickness of 5 m
Superficial Deposits – Alluvium and River Terrace Gravels typically comprising
Generally < 3 m thick where present. Completely replaced by Made Ground in parts of the site
WMMCF – typically comprising stiff clay with thin isolated discontinuous lenses of sand and gravel
Present in the south and northwest of the Site only. Typically less than 3m thick with a maximum thickness of 7m in some areas.
Cambridge Greensand Not identified in available logs/data.
Gault Formation (Gault Clay)
Typically present at a depth of 5 m bgl underlying Made Ground/Superficial Deposits/WMMCF, the thickness is understood to be up to 50 m (based on historic borehole data presented in Atkins (2006) (Reference 5)
Woburn Sands Formation (Lower Greensand)
Not encountered but typically between 15 – 20 m thick based on the BGS solid and drift map.
4.2.2 Post Remediation Ground Conditions
In the main excavation/remediation areas, excavation and remediation of soil material was
typically undertaken to depths of between 5 and 6 m with the maximum depth extending to
7 m in some locations and 8 to 10m in grid squares K7 and L7 (see drawing D907_07A).
The extent and depths of excavations are shown in drawing (D907_207A). Excavated soil
material comprised the following:
Post Remediation Quantitative Risk Assessment for Controlled Waters
9 December 2012 907BRI/RevB
Type A – Granular soils including granular Made ground. The deposits of sand and
gravel were typically clayey with clay percentages typically between 20 to 60% (see
Appendix B);
Type B – WMMCF and cohesive Made Ground; and
Type C – Gault Formation.
It is important to note, that the excavation and remediation of each of the soil types resulted
in the homogenisation of the soils and in the case of the WMMCF, this has resulted in the
removal, in the remediated soils, of the lenses of sand and gravel observed in the pre-
remediation investigations and during the remedial works.
During the remediation works, a buffer zone of a minimum of 20 m (Zone 1) was set from
the site boundary with the Riddy Brook in which very stringent remedial targets were set.
Generally, only clean material comprising Type B and Type C material was reinstated in the
buffer zone with the exception of an area where clean sand and gravel was reinstated
between 1 and 2.5 m bgl with the thickness increasing towards the Riddy Brook.
Outside of the buffer zone, reinstatement of the remediated soil material replicated the
naturally occurring strata as closely as possible so that Type A material was placed over
Type B material over Type C material. During reinstatement, soil material was placed in
layers with a typical thickness of 200 mm layers and compacted in accordance with the
specification. Additionally, a hard to dig layer of crushed concrete was placed over the
reinstated soil material. The thickness of each unit is as follows:
No Dig Layer – Typically 0.3 m thick, locally 0.5 m thick in south of site (see
D907_215);
Reinstated Type A material – The Type A material was reinstated in discrete
discontinuous zones across the site. Where present the reinstated Type A material
is typically up to 0.5 m thick with a maximum thickness of 1 m in some locations. As
described above, clean sand and gravel was also reinstated within Zone 1 to depths
typically between 1 and 2.5 m bgl along a portion of the eastern site boundary
(adjacent to the Riddy Brook) with the thickness increasing towards the Riddy
Brook. The distribution of the reinstated Type A material is shown in drawing
D907_224, Appendix A;
Natural Type A material –Natural clean deposits of sand and gravel (typically slightly
clayey to clayey) remain in-situ in the south of the site as shown on drawing
Post Remediation Quantitative Risk Assessment for Controlled Waters
10 December 2012 907BRI/RevB
D907_213A. Deposits of the natural sand were between 0.7 to 2.3 m thick in the
southwest of the site and typically 1 to 1.8 m thick to the southeast. It is important to
note that following the remedial works at the site, these deposits are not continuous
and are not in connectivity with the remediated reinstated Type A material discussed
above.
Type B material – Following remediation and soil reinstatement, thickness of the
Type B material (including soils that were not excavated) in the north and centre of
the site was between 0.25 to 3.75 thick with a typical thickness of approximately 2.0
m (see drawing D907_220A). In the south of the site, thickness of the Type B
material is typically a maximum of 5 m. Borehole logs from the Atkins (2006)
investigations indicate a typical thickness of between 2 and 4 m although one
borehole located in the far southeast corner of the site (approximate grid square
D26) indicated a thickness of 7.5 m. Distribution of the WMMCF is shown in drawing
D907_213A; and
Type C material – The total thickness of Gault Formation underlying the site is
understood to be up to 50 m, the distribution of reinstated Type C material is shown
in drawing D907_212.
Cross sections showing the post remediation ground conditions are presented in drawing
D907_236, Appendix A. Further details of the treatment and reinstatement of remediated
soils are presented in the VertaseFLI completion report for the site (Reference 7).
It should be noted that prior to the final development and as detailed in the remediation
method statement (Reference 3), it will be necessary to import a minimum of 1 m thick
capping layer comprising subsoil and topsoil onto site.
4.3 Hydrogeology
4.3.1 Made Ground and Drift Deposits
The natural drift deposits at the site comprise River Terrace Gravels and Alluvium and are
classified by the Environment Agency as a Secondary A Aquifer which are described as:
‘permeable layers capable of supporting water supplies at a local rather than
strategic scale, and in some cases forming an important source of base flow to
rivers. These are generally aquifers formerly classified as minor aquifers.’
Post Remediation Quantitative Risk Assessment for Controlled Waters
11 December 2012 907BRI/RevB
4.3.2 West Melbury Marly Chalk Formation
The Lower Chalk (which includes the WMMCF) is classified by the Environment Agency as
a Principal Aquifer. A Principal Aquifer is described as:
‘These are layers of rock or drift deposits that have high intergranular and/or fracture
permeability - meaning they usually provide a high level of water storage. They may
support water supply and/or river base flow on a strategic scale. In most cases,
principal aquifers are aquifers previously designated as major aquifer.’
4.3.3 Gault Formation
The underlying Gault Formation is considered to act as an aquiclude (Atkins 2006,
Reference 5), preventing continuity between any shallow groundwater present in on the site
and the Lower Greensand which underlies the Gault.
4.3.4 Groundwater Levels and Flow Direction
4.3.4.1 Pre-Remediation Conditions
Prior to remediation, groundwater was typically present at depths between 0.69 and 2.42 m
below ground level (bgl) with an average depth on the site of 1.3 m bgl. Based on the
available site investigation data (References 4 & 5) pre remediation, groundwater flow was
assumed to occur within the granular Made Ground and drift deposits, site infrastructure,
and within the discontinuous sand and gravel lenses within the underlying WMMCF.
The local groundwater flow direction was generally from the south and west towards the
Riddy Brook and the River Cam. However, groundwater flows on site were significantly
altered due to the presence of a bentonite clay and cement cut-off wall along the northeast
site boundary and abstraction of groundwater in both the north and the south of the site. As
a result of the dewatering/groundwater abstraction in the south of the site, a groundwater
‘low’ developed which resulted in groundwater flow towards this area and a steeper
hydraulic gradient over much of the site compared to off-site. It should be noted that the
bentonite wall and all groundwater abstractions were removed during the remedial works.
4.3.4.2 Observations in WMMCF During Remediation
Prior to remediation, groundwater flow to the Riddy Brook through the site was assumed to
be through granular Made Ground and granular drift deposits with the majority of any flow
through the discontinuous lenses of sand and gravel within the WMMCF. However, the
WMMCF predominantly comprises stiff clay with thin isolated discontinuous lenses of sand
and gravel. The full thickness of WMMCF was exposed in the sides of the remediation
Post Remediation Quantitative Risk Assessment for Controlled Waters
12 December 2012 907BRI/RevB
excavations. Based on these exposed sections, groundwater flow within the in-situ
WMMCF surrounding the site was very low with any flow generally occurring as small
seepages through the discontinuous sand and gravel lenses. Once the sand and gravel
lenses were exposed, these seepages decrease with time (typically becoming dry over 3-4
weeks) suggesting negligible recharge through natural strata as would be expected given
the discontinuous nature of the sand and gravel lenses and the surrounding stiff clay/marl.
As a result, the excavations which were to depths significantly below the natural water table
over much of the site, largely remained dry (with the exception of rainfall) for the duration of
the remediation. It should also be noted that these lenses of sand and gravel have now
been removed due to homogenisation of the WMMCF/Type B material during the
remediation.
4.3.4.3 Groundwater Observations During Investigations Outside of Main Excavation
Outside of the main excavation areas at the site, trial pits were excavated in the south and
northwest corner of the site during August and September 2011. The trial pit logs are
presented in Appendix C, and show ground conditions prior to excavation/remediation
works. The trial pits were typically excavated into the WMMCF and representive photos of
the trial pits are presented in Appendix D. The depths at which groundwater was
encountered is summarised in Table 2 below. In general, during the investigations and
subsequent excavations in the south of the site, groundwater was only present within
deposits of WMMCF and was not encountered within the overlying Type A and Made
Ground deposits.
Table 2 – Groundwater Depths During Trial Pit Investigation
Trial Pit Groundwater Depth(mbgl)
Geological Unit Trial Pit Groundwater Depth (mbgl)
Geological Unit
C21 2.9 WMMCF I21 2 WMMCF
D14 3 WMMCF J20 2.8 WMMCF
D17 4 WMMCF K17 2.5 WMMCF
E17 4 WMMCF K20 2.5 WMMCF
E18 3.5 WMMCF M4 2 WMMCF
E19 4 WMMCF M5 2 WMMCF
F12 2.3 WMMCF M6 1.3 WMMCF
F17 3.2 WMMCF M7 1.8 WMMCF
F18 3.5 WMMCF M8 3.1 WMMCF
F20 3 WMMCF M9 1.85 WMMCF
F21 4 WMMCF N4 2.2 WMMCF
H21 2.5 WMMCF N5 1.9 WMMCF
Post Remediation Quantitative Risk Assessment for Controlled Waters
13 December 2012 907BRI/RevB
I18 3.6 WMMCF N6 1.8 WMMCF
Additionaly, a trial pitting exercise undertaken in April 2012 to confirm the thickness of the
clean sand and gravel deposits reinstated in the 20 m buffer zone did not identify the
presence of any groundwater. The trial pits were excavated during a period of heavy rain
and flooding in the immediate vicinity of the site which coincided with increased
groundwater levels elsewhere on the site and the absence of groundwater within the sand
and gravel has been taken as an indicator that there is negligible groundwater flow in the
reinstated soil materials within this area.
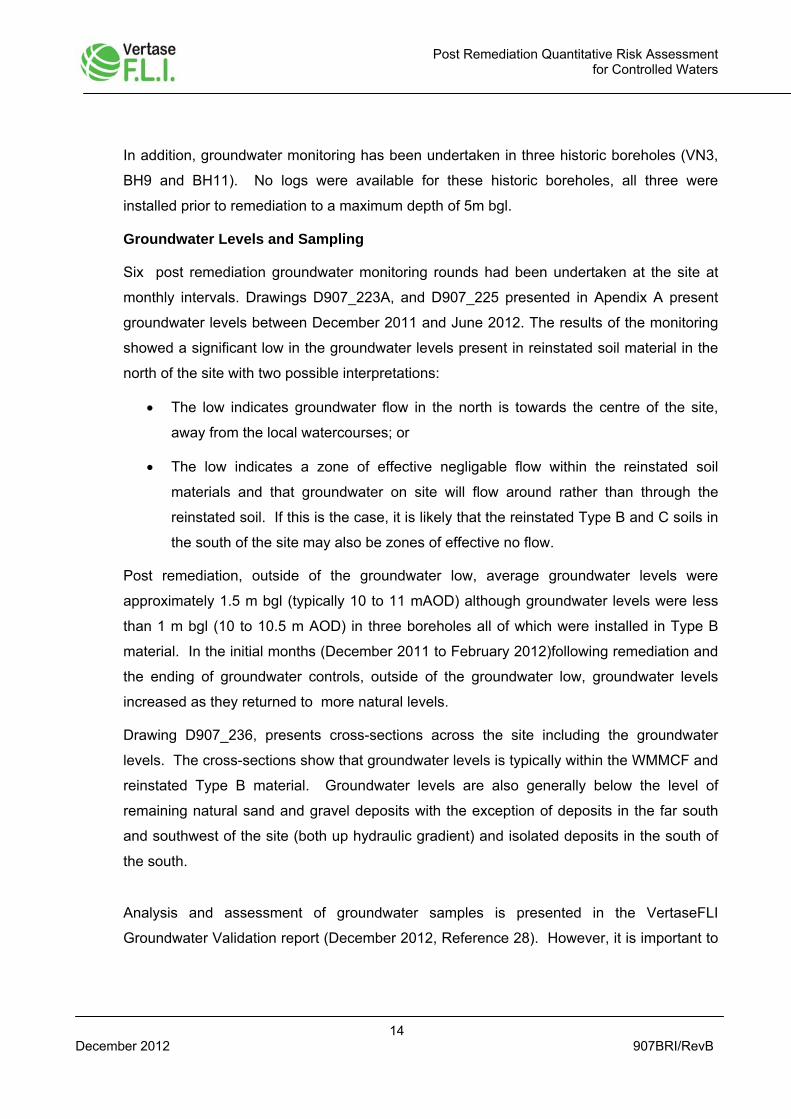
4.3.4.4 Post Remediation Conditions
Monitoring Boreholes
Sixteen on-site groundwater monitoring boreholes were installed at the site following
completion of the remedial works. The borehole locations are shown on drawing
D907_226A, and the borehole logs presented in Appendix E. All borehole locations were
agreed with the Environment Agency prior to drilling.
Details of the borehole response zones are detailed in Table 3 below.
Table 3 – Validation Borehole Response Zones
Borehole Response zone (m) Strata
A18 2-4 WMMCF
E14 2-4 WMMCF
D20 2-4 WMMCF
D25 1.3-3 Type A – Sand and Gravel
F12 2-3 WMMCF
F23 4-6 Reinstated Type B/WMMCF
G10 2-3 Reinstated Type B
G21 2.2-4 Type A – Sand and Gravel
H7 1-3 Reinstated Type B
H15 1-3 Reinstated Type B
I18 3-5 WMMCF/Gault Clay
I24 3-5 WMMCF
J10 2-5 Reinstated Type B and Type C
K5 2-5 WMMCF/Gault Clay
K14 1-3.5 Reinstated Type B
K21 3.7-5.7 WMMCF
Post Remediation Quantitative Risk Assessment for Controlled Waters
14 December 2012 907BRI/RevB
In addition, groundwater monitoring has been undertaken in three historic boreholes (VN3,
BH9 and BH11). No logs were available for these historic boreholes, all three were
installed prior to remediation to a maximum depth of 5m bgl.
Groundwater Levels and Sampling
Six post remediation groundwater monitoring rounds had been undertaken at the site at
monthly intervals. Drawings D907_223A, and D907_225 presented in Apendix A present
groundwater levels between December 2011 and June 2012. The results of the monitoring
showed a significant low in the groundwater levels present in reinstated soil material in the
north of the site with two possible interpretations:
The low indicates groundwater flow in the north is towards the centre of the site,
away from the local watercourses; or
The low indicates a zone of effective negligable flow within the reinstated soil
materials and that groundwater on site will flow around rather than through the
reinstated soil. If this is the case, it is likely that the reinstated Type B and C soils in
the south of the site may also be zones of effective no flow.
Post remediation, outside of the groundwater low, average groundwater levels were
approximately 1.5 m bgl (typically 10 to 11 mAOD) although groundwater levels were less
than 1 m bgl (10 to 10.5 m AOD) in three boreholes all of which were installed in Type B
material. In the initial months (December 2011 to February 2012)following remediation and
the ending of groundwater controls, outside of the groundwater low, groundwater levels
increased as they returned to more natural levels.
Drawing D907_236, presents cross-sections across the site including the groundwater
levels. The cross-sections show that groundwater levels is typically within the WMMCF and
reinstated Type B material. Groundwater levels are also generally below the level of
remaining natural sand and gravel deposits with the exception of deposits in the far south
and southwest of the site (both up hydraulic gradient) and isolated deposits in the south of
the south.
Analysis and assessment of groundwater samples is presented in the VertaseFLI
Groundwater Validation report (December 2012, Reference 28). However, it is important to
Post Remediation Quantitative Risk Assessment for Controlled Waters
15 December 2012 907BRI/RevB
note that it has not been possible to obtain samples from 5 of the 6 boreholes installed
within remediated soils indicating low to negligable flow rates within the remediated soils.
Groundwater Flow Direction
The groundwater contour plots suggest that in the south of the site (outside the
groundwater low), groundwater flow is typically towards the northeast although flow at the
southeast site boundary appeares to more easterly. In the northwest corner of the site,
groundwater flows in a more northerly direction.
Type C Material
As stated in Section 4.3.3, the Gault Formation is considered to be an aquiclude. Given the
level of compaction achieved in the reinstated Type C and very low permeability of the
Gault formation material it is considered that this material will also act as an aquiclude.
Type B Material
Observations during trial pitting, drilling of boreholes and groundwater monitoring indicates
that outside of the main excavations, the main groundwater body in the south of the site is
the WMMCF (see Table 2 above), with very little groundwater observed in Type A deposits
during investigations and in subsequent excavations.
111 in-situ permeability tests were undertaken within Type B material across the site.
Tests were undertaken at a range of depths in reinstated materials from the base of
excavations to the upper surface of the Type B and in trial pits excavated in areas outside
of the main excavations. The location of the permeability tests is shown in drawing
D907_238 and the results are presented in Appendix P and summarised as histograms in
Appendix L. The testing recorded a range of in-situ hydraulic conductivities between 1.6 x
10-10 to 6.1 x 10⁻⁶ ms-1 with a typical value of 2.2 x 10⁻⁷ ms-1. The results of the testing are
discussed further in Section 6.
Type A Material
Given the limited and shallow deposits of the reinstated Type A material (drawing
D907_224) (reinstated over Type B material) , it is anticipated that any flow of water will
follow the fall of the reinstated site levels and flow to the north. However, as the Type A
material was reinstated in discreet discontinuous bodies at the surface above the water
Post Remediation Quantitative Risk Assessment for Controlled Waters
16 December 2012 907BRI/RevB
table, the reinstated Type A material is not considered to represent a significant
groundwater body.
Following remediation Type A material remains in the southeast and southwest corners of
the site (Drawing D907_2123A). However, the Type A deposits are discontinuous and
given the general absence of groundwater (discussed in 4.3.4.3 above) within the natural
sand and gravel, the natural Type A material is unlikely to represent a significant
groundwater body. It should also be noted that borehole D25, installed in the sand and
gravel, to the southeast of the site has very poor recovery rates (indicative of either low
permeability material or an absence of groundwater) (VertaseFLI Groundwater Validation
report (2012)).
4.4 Hydrology
The Riddy Brook and Hauxton Mill Race are the closest water bodies to the site, forming
much of the northern and eastern site boundary. The Riddy Brook and Hauxton Mill race
meet immediately to the north of the site where they enter the River Cam. For the purposes
of the risk assessment, shallow groundwater at the site is considered to be in direct
continuity with the Riddy Brook.
Water levels in the Riddy Brook were regularly monitored at upstream and downstream
locations (see drawing D907_203A) during remediation and showed relatively little variation
Between January and October 2011 water levels in the Riddy Brook were:
Upstream – 0.16 to 0.50 m deep, median depth 0.26 m; and
Downstream – 0.14 to 0.54 m deep, median depth 0.21m.
Plots of the levels in the Riddy Brook are presented in Appendix F.
Post Remediation Quantitative Risk Assessment for Controlled Waters
17 December 2012 907BRI/RevB
5.0 Risk Assessment Approach
Previous iterations of the controlled waters risk assessments for the site have been
undertaken for a number of different reasons:
Enviros 2005 (Reference 4) – Risk assessment was undertaken to establish the
presence of risks to controlled waters under Part 2A of the Environmental Protection
Act 1990;
Atkins 2007 (Reference 1) – Risk assessment was undertaken to develop
preliminary remedial targets;
VertaseFLI 2011 (Reference 2) – Risk assessment was undertaken to revise the
preliminary remedial targets in respect of findings of the initial remedial works to
provide working targets for the remediation.
In accordance with the remedial method statement, this final iteration of the risk
assessment has been undertaken to validate the remedial works and the key outcome is to
assess the risks from the remediated site to controlled waters (the Riddy Brook). Therefore,
further remedial targets have not been derived and instead the distribution of reinstated
soils and final contaminant concentrations achieved by the remediation have been used
together with the measured soil properties to model, as accurately as possible, the
remediated site and the potential risks to the Riddy Brook.
5.1 Post Remediation Site Model
The Site Model is presented in Drawing D907_154C, Appendix A, based on the post
remediation site conditions as described in Section 4. Groundwater flow is assumed to be
towards the Riddy Brook as a conservative assumption.
5.1.1 Contaminant Source
The contaminant source in the post remediation CSM comprises the residual CoC
concentrations remaining in the remediated soils (see Section 5.3). Based on post
remediation groundwater levels and the assumed groundwater flow direction, a large
proportion of the contaminant source is present below the water table.
Post Remediation Quantitative Risk Assessment for Controlled Waters
18 December 2012 907BRI/RevB
5.1.2 Pathways
Potential pathways at the site are limited to leaching of contaminants into groundwater from
reinstated Type A and Type B material and subsequent horizontal migration via
groundwater towards the Riddy Brook.
As the remediated Type A has been reinstated as discreet discontinuous units (typically a
maximum of 0.5 m thick but up to 1.0 m thick in some locations) over Type B material no
direct pathway will exist through the Type A material with the exception of very limited
vertical migration through the unsaturated zone.
5.1.3 Receptor
The primary receptor is considered to be the Riddy Brook, located between 1 and 6 m from
the northeast boundary of the remediated site boundary. For the purposes of the risk
assessment, where the clean sand and gravel was reinstated in Zone 1, the receptor is
conservatively assumed to be the boundary between Zone 1 and the remainder of the site.
5.2 Risk Assessment Methodology
Due to the remediation and reinstatement of soil material below typical groundwater levels
at the site, the following levels of assessment will be used to conservatively assess the risks
to controlled waters:
Level 1: Used to predict the worst case porewater (leachate) concentration from the
soil material concentrations based on fundamental properties of the soil material
(porosity and bulk density) and contaminants (Henry’s Law constant and soil/water
partition coefficient)
Level 3 (Groundwater): This level of assessment (Level 3a in Consim) will be used
to model the risks to receptors from the range of groundwater concentrations
modelled by the Level 1 assessment.
The methodology was discussed in detail in VertaseFLI 2011 (Reference 2) and makes the
following conservative assumptions:
There is no attenuation of the contaminants as there is considered to be no
unsaturated zone;
There is no dilution of the groundwater/leachate concentrations in the aquifer; and
The Level 3 assessment assumes a non declining contaminant source.
Post Remediation Quantitative Risk Assessment for Controlled Waters
19 December 2012 907BRI/RevB
A flow chart outlining the methodology is presented in Appendix G.
5.3 Assessment of CoC Distribution
5.3.1 Zoning of Reinstated Soil Materials
The distribution of each CoC in the reinstated soils has been assessed and zoned based on
the locations of reinstated remediated treatment beds for both the Type A and Type B soils
(detailed in the VertaseFLI completion report, Reference 7). The zoning is based on the
presence of the CoC in 22 m grid squares used to map the reinstated soils (see Drawing
D907_07A) and will conservatively assume that the CoC is present across the entire grid
square.
5.3.2 Deriving Probability Density Functions
Probability density functions (PDFs) have been developed for each CoC in each zone
based on the range of CoC concentrations in soil material. As a conservative assumption,
PDFs were developed based only on reinstated soil from treatment beds that recorded
elevated concentrations of the CoC following remediation. It should be noted that typically,
a range of CoC concentrations were recorded in these treatment beds which including non-
detects. For the purposes of developing PDFs, all non-detects in each zone were
conservatively set to the limit of detection and treated as a single value.
Where appropriate, selection of the PDF mid-point was based on a visual assessment of
the PDF and supported with calculation of the median value of the concentration range.
5.4 Level 1 Assessment
The following equation is used in Level 1 assessments to predict porewater (leachate)
concentration from soil source concentrations in both ConSim (Reference 11) and the
Environment Remedial Targets Methodology (Reference 12):
Cl = Cs / [Kd + (θw + θs.H)/ρs]
Where Cl = Leachate concentration (mg/l)
Cs = Soil source concentration (mg/l)
Kd = partition coefficient (ml/g)
Θw = Water filled porosity of soil (fraction)
Θs = air filled porosity of soil (fraction)
H = Henry’s Law constant (dimensionless); and
ρs = soil dry bulk density
Post Remediation Quantitative Risk Assessment for Controlled Waters
20 December 2012 907BRI/RevB
For the purposes of the risk assessment, an Excel spreadsheet has been set up for each
CoC to undertake probabilistic Monte-Carlo analysis using the Level 1 equation above so
that the variability in contaminant concentrations in each zone, and the soil and contaminant
properties can be taken into account. Whilst both applications use the same equations the
use of an Excel spreadsheet has the principal advantage over ConSim in this situation is
that the result of each iteration can be viewed and the final range and distribution of
predicted leachate concentrations fully understood. Being able to fully assess the outputs
of the Level 1 assessment has allowed a representative and appropriate PDF of predicted
leachate concentrations for each CoC in each identified zone to be derived and used in the
Level 3 groundwater assessment.
The selection of contaminant and aquifer parameters is discussed in Section 6.
5.5 Level 3 (Groundwater) Assessment
The Level 3 Assessment has been undertaken using the Level 3a option in Consim. A
model has been produced for each CoC where any 95th percentile of the predicted leachate
concentration exceeded the appropriate screening criteria. Each zone has been modelled
as a separate source for each CoC using the leachate concentration PDFs derived in the
Level 1 assessment as source inputs.
All groundwater flow has been modelled through the reinstated Type B material. The
predicted 95th percentile worst case concentration (at each receptor location was then
compared with the appropriate water quality standard to assess the risks to the Riddy
Brook.
Type A Material
Considering the discontinuous deposits of natural Type A material and the negligable
groundwater observed in these deposits during trial pit and borehole excavations,
negligable groundwater flow is anticipated in this material. The reinstated remediated Type
A material is very limited in extent and thickness and is discontinuous across the site and
therefore no groundwater flow is anticipated in this material.
Based on the limited extent and thickness of the reinstated Type A material and the
proposed 1 m thick cover layer, the volume of leachate generated from the reinstated Type
A material is likely to be very low. Groundwater in the south of the site is predominantly
limited to the Type B and given the low permeability of the Type B material (see section
Post Remediation Quantitative Risk Assessment for Controlled Waters
21 December 2012 907BRI/RevB
4.3.4, upward migration of contaminants into the Type A material is considered highly
unlikely.
Given the above, the impact of leachate from the reinstated Type A material on the
groundwater and therefore risks to receptors is likely to be minimal compared with the
leachate from the Type B material. However, for completeness and to validate the risks
from the potential leachate from reinstated Type A material, a Level 3 assessment has also
been undertaken for all CoCs using the same method as described above assuming flow
through the Type B material.
Type C Material
As stated in Section 4.3.4.4, the Type C material (Gault Formation) is considered to be an
aquiclude and has therefore not been considered for modelling.
Post Remediation Quantitative Risk Assessment for Controlled Waters
22 December 2012 907BRI/RevB
6.0 Model Inputs
6.1 Contaminants
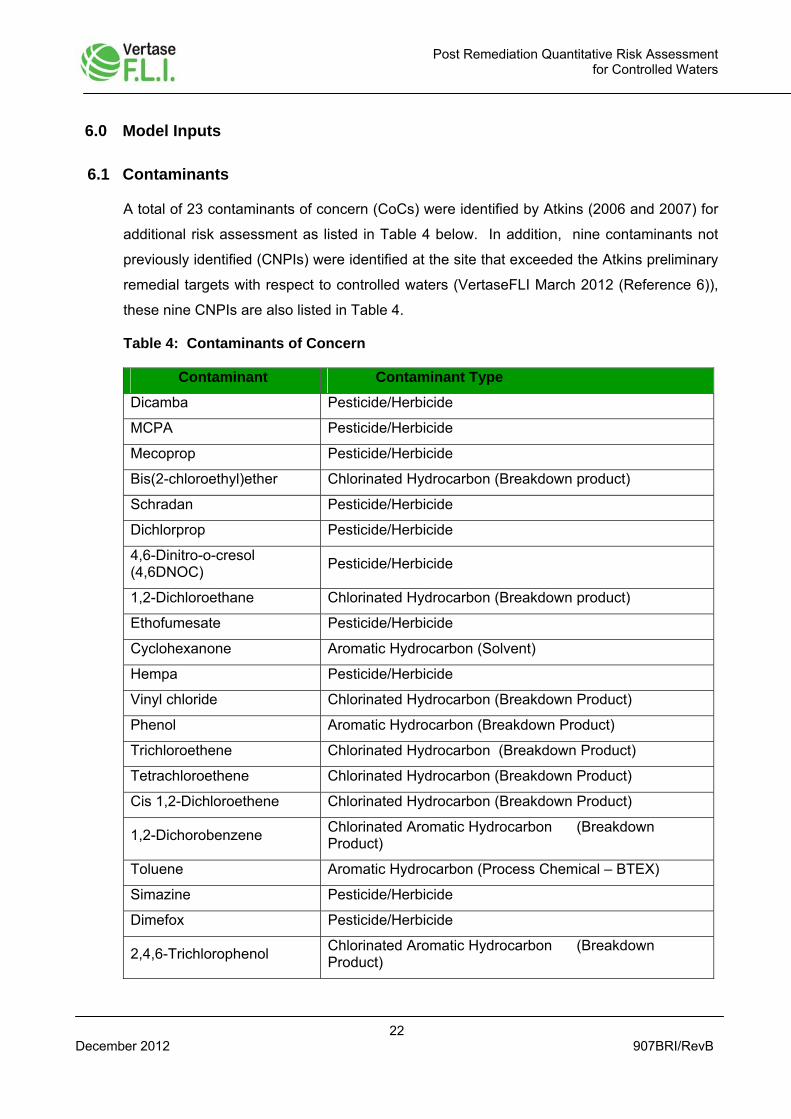
A total of 23 contaminants of concern (CoCs) were identified by Atkins (2006 and 2007) for
additional risk assessment as listed in Table 4 below. In addition, nine contaminants not
previously identified (CNPIs) were identified at the site that exceeded the Atkins preliminary
remedial targets with respect to controlled waters (VertaseFLI March 2012 (Reference 6)),
these nine CNPIs are also listed in Table 4.
Table 4: Contaminants of Concern
Contaminant Contaminant Type
Dicamba Pesticide/Herbicide
MCPA Pesticide/Herbicide
Mecoprop Pesticide/Herbicide
Bis(2-chloroethyl)ether Chlorinated Hydrocarbon (Breakdown product)
Schradan Pesticide/Herbicide
Dichlorprop Pesticide/Herbicide
4,6-Dinitro-o-cresol (4,6DNOC)
Pesticide/Herbicide
1,2-Dichloroethane Chlorinated Hydrocarbon (Breakdown product)
Ethofumesate Pesticide/Herbicide
Cyclohexanone Aromatic Hydrocarbon (Solvent)
Hempa Pesticide/Herbicide
Vinyl chloride Chlorinated Hydrocarbon (Breakdown Product)
Phenol Aromatic Hydrocarbon (Breakdown Product)
Trichloroethene Chlorinated Hydrocarbon (Breakdown Product)
Tetrachloroethene Chlorinated Hydrocarbon (Breakdown Product)
Cis 1,2-Dichloroethene Chlorinated Hydrocarbon (Breakdown Product)
1,2-Dichorobenzene Chlorinated Aromatic Hydrocarbon (Breakdown Product)
Toluene Aromatic Hydrocarbon (Process Chemical – BTEX)
Simazine Pesticide/Herbicide
Dimefox Pesticide/Herbicide
2,4,6-Trichlorophenol Chlorinated Aromatic Hydrocarbon (Breakdown Product)
Post Remediation Quantitative Risk Assessment for Controlled Waters
23 December 2012 907BRI/RevB
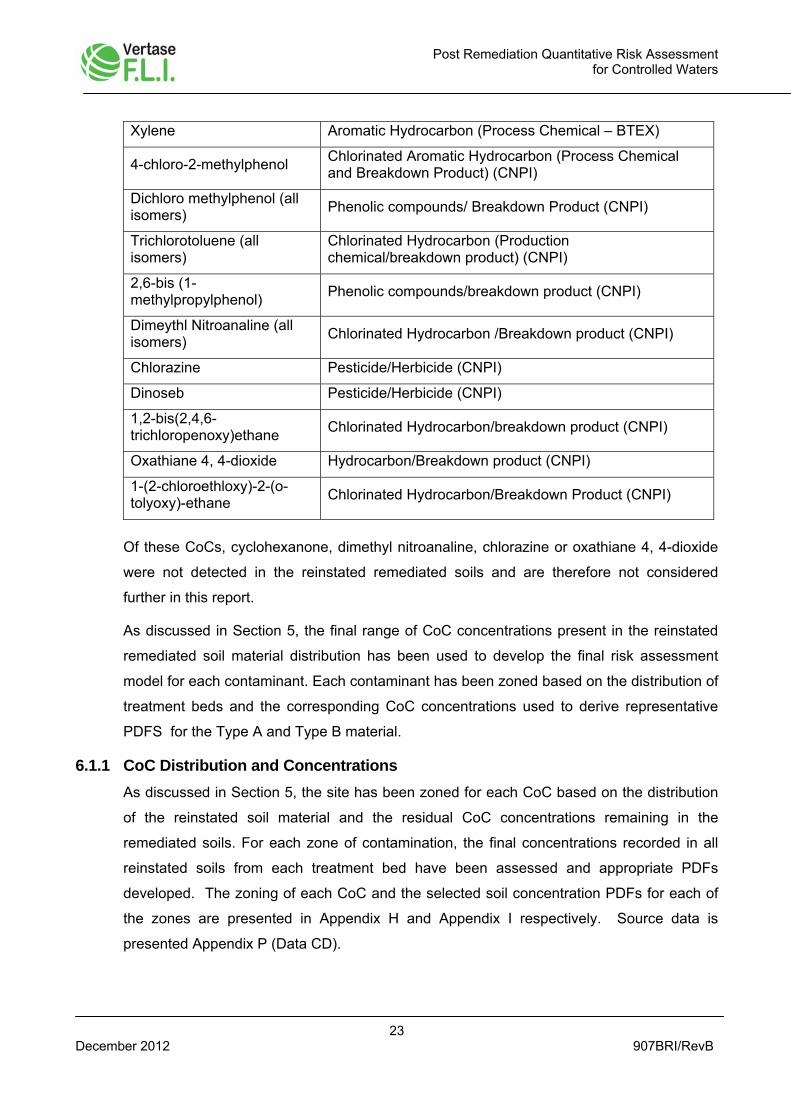
Xylene Aromatic Hydrocarbon (Process Chemical – BTEX)
4-chloro-2-methylphenol Chlorinated Aromatic Hydrocarbon (Process Chemical and Breakdown Product) (CNPI)
Dichloro methylphenol (all isomers)
Phenolic compounds/ Breakdown Product (CNPI)
Trichlorotoluene (all isomers)
Chlorinated Hydrocarbon (Production chemical/breakdown product) (CNPI)
2,6-bis (1-methylpropylphenol)
Phenolic compounds/breakdown product (CNPI)
Dimeythl Nitroanaline (all isomers)
Chlorinated Hydrocarbon /Breakdown product (CNPI)
Chlorazine Pesticide/Herbicide (CNPI)
Dinoseb Pesticide/Herbicide (CNPI)
1,2-bis(2,4,6-trichloropenoxy)ethane
Chlorinated Hydrocarbon/breakdown product (CNPI)
Oxathiane 4, 4-dioxide Hydrocarbon/Breakdown product (CNPI)
1-(2-chloroethloxy)-2-(o-tolyoxy)-ethane
Chlorinated Hydrocarbon/Breakdown Product (CNPI)
Of these CoCs, cyclohexanone, dimethyl nitroanaline, chlorazine or oxathiane 4, 4-dioxide
were not detected in the reinstated remediated soils and are therefore not considered
further in this report.
As discussed in Section 5, the final range of CoC concentrations present in the reinstated
remediated soil material distribution has been used to develop the final risk assessment
model for each contaminant. Each contaminant has been zoned based on the distribution of
treatment beds and the corresponding CoC concentrations used to derive representative
PDFS for the Type A and Type B material.
6.1.1 CoC Distribution and Concentrations
As discussed in Section 5, the site has been zoned for each CoC based on the distribution
of the reinstated soil material and the residual CoC concentrations remaining in the
remediated soils. For each zone of contamination, the final concentrations recorded in all
reinstated soils from each treatment bed have been assessed and appropriate PDFs
developed. The zoning of each CoC and the selected soil concentration PDFs for each of
the zones are presented in Appendix H and Appendix I respectively. Source data is
presented Appendix P (Data CD).
Post Remediation Quantitative Risk Assessment for Controlled Waters
24 December 2012 907BRI/RevB
6.2 Receptors
Receptors locations have been placed at regular intervals along the western bank of the
Riddy Brook (See drawing D907_227, Appendix A) to confirm that the selected screening
criteria are not exceeded on any stretch of the water course.
Where Zone 1 has been reinstated with sand and gravel, the boundary between Zone 1 and
Zone 2S/2N has been conservatively assumed to be the receptor and receptor locations
have been placed at regular intervals along the Zone1 boundary.
6.3 Selection of Screening Criteria
Since the start of the remedial works and risk assessment process, new screening criteria
have been published for a number of the CoCs. Therefore, the screening criteria used to
assess the risks to the Riddy Brook have been reviewed and where appropriate updated.
To assess the risks to the Riddy Brook, Environmental Quality Standards (EQS) values for
freshwater have been used where available. Preference has been given to UK EQS values
followed by European EQS values and then EQS values from other regulatory frameworks.
It should be noted that both UK and European EQSs are derived following the same
methodology set out in the Water Framework Directive using published ecological toxicity
data and therefore European EQSs are considered to be protective of water quality to the
UK.
Where appropriate EQS values are not available UK Drinking Water Standards (DWS) are
used, and where neither is available, detection limit is used.
6.3.1 Derivation of Pesticide Screening Criteria
For a number of pesticide CoCs such as Schradan, Hempa, Dimefox and 4,6 DNOC no
published EQS is available and the only screening value is the UK DWS for pesticides
(other than Aldrin, Dieldrin, Heptachlor and Heptachlor epoxide) is 0.1 ug/l. The DWS for
pesticides is not a health based standard but was determined by the European Drinking
Water Directive in 1980 and set at typical laboratory detection limits for pesticides in order
to prevent the occurrence of pesticides in drinking water (Defra, Reference 13).
Given the lack of scientific basis of the DWS it is considered appropriate to derive Predicted
No Effect Concentrations (PNECs) for the CoCs where appropriate ecological toxicity data
for freshwater receptors is available. Derivation of the PNECs follows the methodology set
out in UK Technical Advisory Group on the Water Framework Directive document
‘Proposals for Environmental Quality Standards for Annex VIII Substances. Final (SR1 –

Post Remediation Quantitative Risk Assessment for Controlled Waters
25 December 2012 907BRI/RevB
2007), the same methodology used to derived EQSs. Full details of the derivation of the
screening criteria for Schradan and Hempa are presented in Appendix J.
In the absence of any appropriate ecological toxicity data, the DWS screening value of 0.1
ug/l has been used for 2,4,6 Dinitro-o-cresol and Dimefox.
6.3.2 Dichlorprop
The Swedish Chemical Agency has derived an EQS of 10 ug/l for dichlorprop-p (Reference
16), an isomer of dichlorprop. Currently no EQS is available for dichlorprop. It is considered
likely that the EQS for dichlorprop-p will also be protective of fresh water for dichlorprop.
However, given the absence of specific EQS for dichlorprop, it has been conservatively
screened against the DWS for pesticides of 0.1 ug/l.
6.3.3 Selected Screening Criteria
The selected water quality screening criteria are presented in Table 5.
Table 5 – CoC/CNPI Selected Water Quality Screening Criteria Contaminant Screening
Criteria (ug/l)
Source Justification
1,2-Dichloroethane 10 EQS Freshwater
Dicamba 10 Canadian EQS for Fresh Water
Water quality guideline for the protection of aquatic life more
appropriate with respect to Riddy Brook than UK Pesticide DWS
Schradan 0.35 VertaseFLI derived PNEC
Bis(2-chloroethyl)ether 1 Limit of Detection No other screening value available
Ethofumesate 30 Swedish FreshwaterEQS
Derived using EU recommended methodology (as used for UK EQS) (Reference 16). Considered more appropriate with respect to Riddy Brook than UK Pesticide DWS
Trichloroethene 10 UK DWS
Tetrachloroethene 10 UK DWS
Cis 1,2, Dichloroethene 6.7 Dutch Freshwater Maximum Permissible
Concentration
European Freshwater quality guideline (Reference 26) considered
appropriate with respect to Riddy Brook – no other guidance values
available
Vinyl Chloride 0.5 UK DWS
Hempa 350 VertaseFLI derived PNEC
See Appendix E
Post Remediation Quantitative Risk Assessment for Controlled Waters
26 December 2012 907BRI/RevB
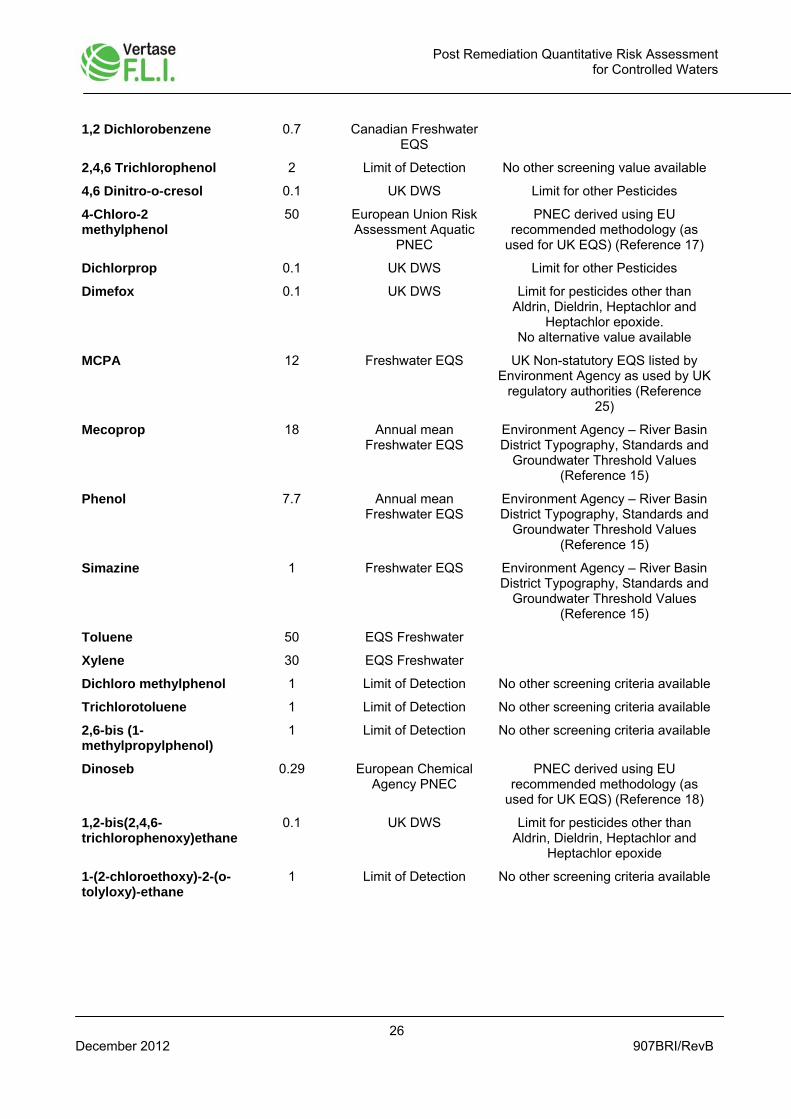
1,2 Dichlorobenzene 0.7 Canadian Freshwater EQS
2,4,6 Trichlorophenol 2 Limit of Detection No other screening value available
4,6 Dinitro-o-cresol 0.1 UK DWS Limit for other Pesticides
4-Chloro-2 methylphenol
50 European Union Risk Assessment Aquatic
PNEC
PNEC derived using EU recommended methodology (as
used for UK EQS) (Reference 17)
Dichlorprop 0.1 UK DWS Limit for other Pesticides
Dimefox 0.1 UK DWS Limit for pesticides other than Aldrin, Dieldrin, Heptachlor and
Heptachlor epoxide. No alternative value available
MCPA 12 Freshwater EQS UK Non-statutory EQS listed by Environment Agency as used by UK
regulatory authorities (Reference 25)
Mecoprop 18 Annual mean Freshwater EQS
Environment Agency – River Basin District Typography, Standards and
Groundwater Threshold Values (Reference 15)
Phenol 7.7 Annual mean Freshwater EQS
Environment Agency – River Basin District Typography, Standards and
Groundwater Threshold Values (Reference 15)
Simazine 1 Freshwater EQS Environment Agency – River Basin District Typography, Standards and
Groundwater Threshold Values (Reference 15)
Toluene 50 EQS Freshwater
Xylene 30 EQS Freshwater
Dichloro methylphenol 1 Limit of Detection No other screening criteria available
Trichlorotoluene 1 Limit of Detection No other screening criteria available
2,6-bis (1-methylpropylphenol)
1 Limit of Detection No other screening criteria available
Dinoseb 0.29 European Chemical Agency PNEC
PNEC derived using EU recommended methodology (as
used for UK EQS) (Reference 18)
1,2-bis(2,4,6-trichlorophenoxy)ethane
0.1 UK DWS Limit for pesticides other than Aldrin, Dieldrin, Heptachlor and
Heptachlor epoxide
1-(2-chloroethoxy)-2-(o-tolyloxy)-ethane
1 Limit of Detection No other screening criteria available
Post Remediation Quantitative Risk Assessment for Controlled Waters
27 December 2012 907BRI/RevB
6.4 Soil Source Parameters – Level 1 Assessment
The Level 1 assessment (see Section 5.3) requires the following soil parameters
Dry Bulk Density;
Fraction of Organic Carbon (FOC); and
Total soil Porosity – Calculated from soil moisture content, dry density and particle
density.
Due to the relatively small volumes of the Type A material reinstated at the site, site specific
data, appropriate values from previous investigations or conservative literature values have
been used in the Level 1 assessment. For the Type B material, site specific data has been
obtained for the reinstated soil material. Appropriate PDFs have been selected based on
the histogram of the data as described below. The inputs are summarised in Table 6.
6.4.1 Dry Bulk Density
Dry bulk density values for the Type A material were obtained from geotechnical testing.
Only two values were obtained (1.77 and 1.88 g/cm3) and therefore a uniform distribution
using the Consim suggested range for a sand and gravel was conservatively used in the
model.
For the type B material, over 250 in-situ measurements of dry bulk density were recorded in
the reinstated soil material with a nuclear density gauge. Based on a histogram of the
results (see Appendix L), a normal distribution was selected with an average value of 1.8
g/cm3 and a standard deviation of 0.065.
6.4.2 Fraction of Organic Carbon
Due to the relatively small volumes Type A material remediated and reinstated, only limited
testing of Type A material was undertaken during remediation and FOC values were not
obtained. Therefore, FOC for the Type A material is based on the range of site specific
values obtained by Enviros and Atkins (References 4 and 5) for sand and gravel, and
granular made ground. It should be noted that remediation works included the addition of
mushroom compost to material and therefore, the FOC values are likely to under represent
the FOC values in the reinstated Type A material. A total of FOC 34 values were obtained
by Atkins and Enviros and based on the histograms of the FOC values and log FOC values
(see Appendix K) a loguniform PDF gave the best fit to the FOC data. One value (17%)
Post Remediation Quantitative Risk Assessment for Controlled Waters
28 December 2012 907BRI/RevB
was significantly outside the range of all other values (0.72 to 5.8 %) and was therefore
discounted as an outlier.
FOC was been obtained for 33 soil samples taken from the remediated Type B material test
beds. Histograms of the FOC values and log values were plotted (see Appendix L), and
based on these it was considered that a logtriangular PDF gave the best fit to the data with
minimum and maximum values of 0.75 and 4.8 % respectively and a mean value of 1.78%.
The FOC value of 0.28 was discounted as based on assessment of both histograms it was
outside the range of the other 32 FOC values.
6.4.3 Soil Moisture Content
Type A Material – Forty five samples of Type A material were tested for moisture content.
Based on the histogram of the data (presented in Appendix K) a normal distribution based
on an average value of 10.33 % with a standard deviation of 2.95 was selected.
Type B Material – Over 250 in-situ measurements were taken of the moisture content of
the Type B material with a nuclear density gauge following reinstatement. The histogram
of the results (Appendix L) shows a normal distribution, with a average value of 17.5 % and
a standard deviation of 2.3.
6.4.4 Particle Density
Geotechnical testing of 29 samples the Type B material (presented in Appendix P) indicated
a particle density between 2.54 and 2.75 g/cm3. The PDF (see Appendix L) of the results
indicated a typical particle density of 2.73 g/cm3.
For the Type A material, at the time of writing no testing of particle density testing had been
undertaken and a value of 2.78 g/cm3 was selected based on the recommended value in
EA Remedial Targets Methodology and worksheet (Reference 12).
Post Remediation Quantitative Risk Assessment for Controlled Waters
29 December 2012 907BRI/RevB
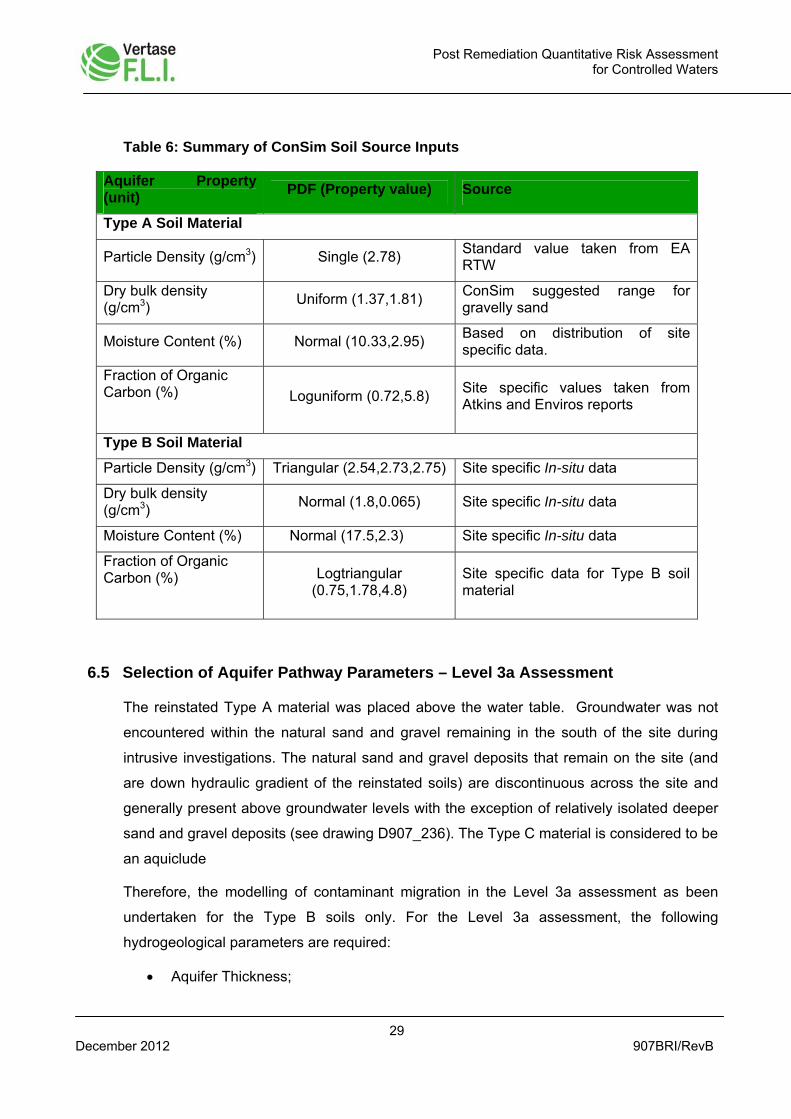
Table 6: Summary of ConSim Soil Source Inputs
Aquifer Property (unit)
PDF (Property value) Source
Type A Soil Material
Particle Density (g/cm3) Single (2.78) Standard value taken from EA RTW
Dry bulk density (g/cm3)
Uniform (1.37,1.81) ConSim suggested range for gravelly sand
Moisture Content (%) Normal (10.33,2.95) Based on distribution of site specific data.
Fraction of Organic Carbon (%)
Loguniform (0.72,5.8) Site specific values taken from Atkins and Enviros reports
Type B Soil Material
Particle Density (g/cm3) Triangular (2.54,2.73,2.75) Site specific In-situ data
Dry bulk density (g/cm3)
Normal (1.8,0.065) Site specific In-situ data
Moisture Content (%) Normal (17.5,2.3) Site specific In-situ data
Fraction of Organic Carbon (%)
Logtriangular (0.75,1.78,4.8)
Site specific data for Type B soil material
6.5 Selection of Aquifer Pathway Parameters – Level 3a Assessment
The reinstated Type A material was placed above the water table. Groundwater was not
encountered within the natural sand and gravel remaining in the south of the site during
intrusive investigations. The natural sand and gravel deposits that remain on the site (and
are down hydraulic gradient of the reinstated soils) are discontinuous across the site and
generally present above groundwater levels with the exception of relatively isolated deeper
sand and gravel deposits (see drawing D907_236). The Type C material is considered to be
an aquiclude
Therefore, the modelling of contaminant migration in the Level 3a assessment as been
undertaken for the Type B soils only. For the Level 3a assessment, the following
hydrogeological parameters are required:
Aquifer Thickness;
Post Remediation Quantitative Risk Assessment for Controlled Waters
30 December 2012 907BRI/RevB
Dry Bulk Density;
Mixing Zone Thickness;
Hydraulic Conductivity;
Effective Porosity;
Hydraulic Gradient;
Groundwater Flow direction;
Longitudinal and Lateral Dispersivity; and
Fraction of Organic Carbon.
6.5.1 Aquifer Thickness
Post remediaition, the thickness of the Type B material was (where proved) between 0.5
and 3.75 m thick with a typical thickness of 2 m. (see Drawing D907_220, Appendix A). A
histogram summarising the thickness of the reinstated Type B material is presented in
Appendix L. However, thicker deposits of the Type B material were present in the south of
the site including the borrow pit area in grid squares D22 – D25, - F22-F25 where Type B
material was typically up to 5 m thick. A borehole detailed in Atkins (2006) was drilled in the
far southeast corner of the site (approximately gridsquare D26) which identified deposits of
WMMCF 7.5 m thick, however, this borehole is up hydraulic gradient of the remediated site
and therefore not considered representative of conditions with respect to modelling
contaminant movement. Therefore, based on the available appropriate data, a triangular
PDF has been selected to model the aquifer with minimum and maximum thicknesses of 1
and 5 m and a typical thickness of 2m.
6.5.2 Dry Bulk Density
The dry bulk density of the reinstated Type B material is discussed in section 6.4.1.
6.5.3 Mixing Zone Thickness
The mixing zone thickness has been taken to be equal to the aquifer thickness (see 6.5.1).
6.5.4 Hydraulic Conductivity
111 in-situ permeability measurements were made of in-situ Type B material over the entire
site. Measurements were made in remediated Type B material at a range of depths and
locations during reinstatement; and in natural un-disturbed deposits at different levels
Post Remediation Quantitative Risk Assessment for Controlled Waters
31 December 2012 907BRI/RevB
during trial pit investigations. The test locations are shown in drawing D907_238, results
are presented in Appendix P and summarised as PDFs in Appendix L.
The range of permeabilites in the reinstated Type B was between 1.6 x 10⁻¹⁰ and 7.1 x 10⁻⁶
ms-1 with a median value of 2.2 x 10⁻⁷ ms-1. To provide an indication of variation of
permeability/hydraulic conductivity in the Type B material with depth and across the site, the
following histograms have also been plotted:
Zone 1 – PDF = 2 x 10⁻¹⁰, 1.4 x 10⁻⁷, 3.2 x 10⁻⁶ ms-1;
Zone 2 – PDF = 2.3 x 10⁻¹⁰, 2.2 x 10⁻⁷, 6.7 x 10⁻⁶ ms-1;
Zone 3 – PDF = 1.6 x 10⁻¹⁰, 4.5 x 10⁻⁷ , 7.1 x 10⁻⁶ ms-1;
0 – 2 m bgl – PDF = 2 x 10⁻¹⁰, 1.5 x 10⁻⁷, 6.7 x 10⁻⁶ ms-1; and
Below 2 m bgl – PDF = 1.6 x 10⁻¹⁰, 4.75 x 10⁻⁷, 7.1 x 10⁻⁶ ms-1.
All PDFs listed above are logtriangular, it should be noted that two values that were
recorded in the range 10-12 ms-1 were not considered representative and therefore
conservatively discounted. The histograms are presented in Appendix L and give very
similar results to the histogram for all 111 permeability values. Therefore, it is considered
that the histogram derived for all site data is representative and appropriate for use in the
model, the best fit for the histogram was a logtriangular PDF with minimum and maximum
values of 1.6 x 10⁻¹⁰ and 7.1 x 10⁻⁶ ms-1 with a mid-point (median) of 2.2 x 10⁻⁷ ms-1.
6.5.5 Effective Porosity
Reinstated soil material at the site has been compacted to a minimum of 95% MDD.
Laboratory compaction tests had been undertaken on Type B material (presented in
Appendix P) which gives an indication of the minimum air voids percentage which is taken
as equal to the effective porosity. The compaction testing indicated that for the upper levels
of compaction achievable in the Type B soil material, an air voids percentage of 3 to 7 %
would be representative. Therefore, a uniform PDF between 3 and 7% effective porosity
has been assumed for the reinstated soil material in the model.
6.5.6 Hydraulic Gradient
As discussed 4.3.4, following the reinstatement of remediated soil material, and subsequent
monitoring, a groundwater low is present in the north of the site (see drawings D907_223A,
and D907_225). This low may represent a region of groundwater flow towards the centre of
Post Remediation Quantitative Risk Assessment for Controlled Waters
32 December 2012 907BRI/RevB
the low (and away from the Riddy Brook) or an area of effective negligable flow such that
groundwater on site will flow around the negligable flow area. As shown in Drawing
D907_236, groundwater levels across the majority of the site generally suggest flow away
from the Riddy Brook
However, the potential for recharge in the Type B material over time and a subsequent
change of flow direction towards the Riddy Brook cannot be completely discounted at this
stage. It is also important to note that groundwater flow in the south of the site still appears
to flow towards the Riddy Brook. Therefore, the hydraulic gradient for use in the model has
been assessed assuming that the groundwater low is not present and that groundwater flow
is towards the Riddy Brook (based on groundwater levels recorded outside of the
groundwater low).
Based on the above assumption, hydraulic gradients have been calculated across the site
using the groundwater contour plots from all monitoring rounds following completion of
remediation (Drawings D907_223A and D907_225). Measurements have been made
across the entire site (in the direction of flow as indicated by the contours) to determine the
typical range of hydraulic gradients, averaged across the site to account for localised
variations in gradient
The measured hydraulic gradients are typically between 0.005 and 0.008 which is broadly
similar to the hydraulic gradients recorded at the waste water treatment plant to the east of
the A10 (0.007 to 0.009) from the Atkins 2006 groundwater contours (Reference 5).
6.5.7 Groundwater Flow Direction
It should be noted, that the groundwater monitoring undertaken since completion of the
remedial works indicates the following flow directions at the site:
In the north of the site a groundwater low is present (centered around borehole J10),
which may (as previously discussed) be indicative of a zone of flow towards the
centre of the site or an effective no-flow zone;
In the south of the site groundwater flow is predominantly towards the northeast,
towards the Riddy Brook and the River Cam. In the far southeast of the site,
groundwater contours appear to show a more easterly flow, although it is not
possible to verify this outside the site boundary; and
In the northwest corner of the site, groundwater flow is in a northerly direction
towards the River Cam and Riddy Brook/River Cam confluence.
Post Remediation Quantitative Risk Assessment for Controlled Waters
33 December 2012 907BRI/RevB
For the purposes of modelling, groundwater flow has been conservatively assumed to be
towards the northeast. This flow direction, ignores the identified groundwater low and
results in the shortest flow paths from the remediated soils to the closest receptor (the
Riddy Brook) compared to more northerly or easterly flows.
6.5.8 Dispersivity
Based on the guidance given in the Environment Agency Remedial Targets methodology
(References 12) longitudinal dispersivity is assumed to be 10% of the contaminant pathway
and lateral dispersivity assumed to be 1%.
Based on the most conservative pathway length, the minimum distance from the buffer
zone to Riddy Brook (1 to 2 m), uniform PDF has been used for both longitudinal and lateral
dispersivity with values in the range 0.1 to 0.2 m and 0.01 to 0.02 m respectively.
6.5.9 Fraction of Organic Carbon
See section 6.4.2.
6.5.10 Summary
The aquifer pathway parameters are summarised in Table 7 below.
Table 7: Summary of ConSim Aquifer Inputs
Aquifer Property (unit)
PDF (Property value) Source
Aquifer thickness (m) Triangular (1.0,2.0,5.0) Thickness of reinstated Type B material
Dry bulk density (g/cm3)
Normal (1.8,0.065) Site specific In-situ data
Mixing Zone thickness (m)
Triangular (1.0,2.0,5.0) Assumed same as aquifer thickness
Hydraulic conductivity (m/s)
Logtriangular (1.e-10, 2.2e-7,7.1e-6)
Site specific in-situ permeability testing
Effective Porosity (%) Uniform (3,7) Conservative assumption based on low permeability material and results of laboratory testing
Hydraulic gradient Uniform (0.005,0.008)
Results of groundwater monitoring conservatively discounting the groundwater low in the north of the site
Post Remediation Quantitative Risk Assessment for Controlled Waters
34 December 2012 907BRI/RevB
Aquifer Property (unit)
PDF (Property value) Source
Groundwater flow direction (degrees)
Single (45o)
Based on post remediation groundwater modelling and conservative
Longitudinal Dispersivity (m)
Uniform (0.1,0.2) 10% of distance from Zone 1 to Riddy Brook
Lateral Dispersivity (m) Uniform (0.01,0.02) 30% of Longitudinal Dispersivity
Fraction of Organic Carbon (%)
Logtriangular (0.75,1.78,4.8)
Site specific data for Type B soil material
6.6 Model Settings
6.6.1 Model Iterations and Time Slices
Both Level 1 and Level 3 models have been run with 1001 iterations. The Level 3a model
has been run with the following time slices: 1; 2; 5; 10; 25; 50; 100; 250; 500; 1,000; and
10,000 years.
6.6.2 Level 3a Model Correlations
Several aquifer parameters are directly related to other aquifer parameters. ConSim allows
these relationships to be included in the model by enabling the user to set correlations
between parameters. Correlations can be set between -1 to +1 where +1 is a total
correlation, -1 is an inverse correlation and 0 is equal to no correlation. For the purposes of
the model, the following correlations have been set:
Longitudinal and Lateral dispersivity are both functions of the length of the
contaminant pathway with Longitudinal dispersivity set at 10% of the contaminant
pathway and lateral dispersivity 30% of the longitudinal dispersivity. Therefore a
correlation of 1 between the two values has been selected;
Hydraulic gradient and hydraulic conductivity are inversely proportional. However,
to allow for some natural variation in aquifer properties a correlation of -0.5 was
selected; and
Effective porosity is generally proportional to hydraulic conductivity. Therefore, to
model this relationship, but allow for natural variations in the aquifer properties a
correlation between the two parameters of 0.5 was selected.
Post Remediation Quantitative Risk Assessment for Controlled Waters
35 December 2012 907BRI/RevB
6.6.3 Simulation of Biodegradation
Biodegradation is typically slower in groundwater systems where contaminants become
sorbed to the aquifer matrix (no degradation is assumed to occur to sorbed contaminants)
compared to water only systems. In modelling the degradation of contaminants, ConSim
gives two options:
Simulate degradation in dissolved phase only; and
Simulate degradation in dissolved and sorbed phases.
As stated in the ConSim help file (Reference 11), these options distinguish between
degradation rates measures in simple aquatic systems (dissolved phase only) and those
measured in groundwater systems (dissolved and sorbed phases). Where dissolved phase
only is selected, a retardation factor is applied to the degradation rate to simulate the slower
degradation rate in groundwater due to contaminants sorbing to the soil.
The selected aquifer half lives used in the models (discussed in Section 6.7) are for
groundwater systems and therefore the option to simulate degradation in dissolved and
sorbed phases has been used.
6.7 Contaminant Parameters
For the purposes of the risk assessment four physical-chemical properties were required for
each CoC:
Soil Organic Carbon to Water Partition Coefficient - Koc (ml/g);
Henry’s Law Constant (Dimensionless);
Biodegradation half life in groundwater (days or years); and
Maximum solubility in water (mg/l).
6.7.1 Data Sources
Together with chemical specific documents, key sources of physical chemical data used to
included:
Compilation of data for priority organic pollutants for derivation of Soil Guideline
Values, Science Report SC050021/SR7, Environment Agency, 2008 (Reference
20);
Post Remediation Quantitative Risk Assessment for Controlled Waters
36 December 2012 907BRI/RevB
Physical – Chemical Properties and Environmental Fate for Organic Chemicals, 2nd
Edition, Mackay et al, 2006 (Reference 19)*;
Environmental Degradation Rates, Howard et al, 1991, Lewis Publishers (Reference 21);
Handbook of Environmental Fate and Exposure Data for Organic Chemicals, Volume 1 – Large Production and Priority Pollutants, Howard et al, 1989, Lewis Publishers *;
Handbook of Environmental Fate and Exposure Data for Organic Chemicals, Volume 2 – Solvents, Howard et al, 1990, Lewis Publishers *;
Handbook of Environmental Fate and Exposure Data for Organic Chemicals, Volume 3 – Pesticides, Howard et al, 1991, Lewis Publishers *;
ChemIDplus – http://chem.sis.nlm.gov/chemicals, United States National Library of
Medicine, accessed April 2011;
Pesticide Properties Database – www.ars.usda.gov, United States Department of
Agricultural Research Services, October 2001;
Toxnet Hazardous Substances Database - http://toxnet.nlm.nih.gov – accessed April
2011;
Agrochemical and Pesticide Desk Refereence, M.A Kamrin and J.H. Montgomery,
CRC Press 2000 *;
Technical Support Document for the Hazardous Waste Identification Rule: Risk
Assessment for Human and Ecological Receptors – Volume 1, Appendix A, US
Environmental Protection Agency, Office of Solid Waste, August 1995;
Site Screening Guidance: Technical Background Document Part 5, Chemical
Specific Parameters, Report EPA/540/R-95/128, United States Environmental
Protection Agency, July 1996;
RCRA Delisting Technical Support Document – Appendix A Chemical Specific Data,
United States Environmental Protection Agency, RCRA Delisting Team, October
2008; and
Regional Screening Levels – Chemical Specific Parameters, United States
Environmental Protection Agency website –
http://www.epa.gov/region9/superfund/prg/, May 2012 (accessed June 12 2012).
Post Remediation Quantitative Risk Assessment for Controlled Waters
37 December 2012 907BRI/RevB
It should be noted that information sources marked * were listed as information sources in
the EA document ‘Compilation of data for priority organic pollutants for derivation of Soil
Guideline Values, Science Report SC050021/SR7’ listed above.
6.7.2 Selection of Parameters
In the review of literature values for physical chemical parameters, selection of parameters
for use in the models was based on the following preferences:
Experimental data was given preference over estimated values;
Environment Agency recommended values, and/or UK and European specific
parameters (if available); and
Where data sources were limited to estimates only, the estimates derived using the
most recent recommended approach from reputable data sources (Environment
Agency or US EPA) were selected.
Where no appropriate data was available, property estimations were made using the
US EPA Estimations Programmes Interface (EPI) Suite software.
Where sufficient values were available, the range of literature values was assessed using
histograms to find the most appropriate PDF and the best fit range of values. For a number
of the CoCs, several literature values were significantly higher or lower (generally by orders
of magnitude) than the typical range and distribution of values and the Environment Agency
recommended values (where available) (Reference 20). These outliers were not considered
to be appropriate for use in the PDFs as their inclusion would have significantly skewed the
selected PDF such that it would not have been representative of the typical range of values.
Histograms and Justifications for the selection of physical chemical parameters are
presented in Appendix M.
6.7.2.1 Aquifer Half Lives
The most conservative biodegradation half lives in groundwater systems were used in the
model, typically these were for anaerobic biodegradation but for compounds such as
chlorinated solvents these were aerobic biodegradation. Where more than one range of
values were available, the two most conservative values in any of the ranges was used as
the input.
Post Remediation Quantitative Risk Assessment for Controlled Waters
38 December 2012 907BRI/RevB
Very limited sources of contaminant half life data in groundwater systems or water were
available and for a number of CoCs, no literature values for half life in water were available.
In these cases a conservative anaerobic half life range of 5 to 10 years was assumed.
It should be noted that for ethofumesate, the July 2011 risk assessment assumed a half life
range of 5 to 10 years. However, a further review of information provided groundwater half
life values of 125 to 285 days. It was unclear if these values were for aerobic or anaerobic
degradation and in accordance with the methodology set out in Howard et al (1991)
(Reference 21) the half lives were conservatively multiplied by a factor of 4 to give a half life
range of 500 to 1140 days.
6.7.2.2 Calculating Kd
The values for Koc are multiplied by the fraction of organic carbon to derive Kd, the soil-water
partition coefficient (References 11 and 12).
Kd = Koc x FOC
Kd was therefore estimated using PDFs of both the Koc and FOC detailed in the sections
above.
Post Remediation Quantitative Risk Assessment for Controlled Waters
39 December 2012 907BRI/RevB
Non-Polar Organic Chemicals
It should be noted, that the above equation only applies to non-polar organic chemicals.
The majority of the 23 CoCs are non-polar, however, phenol, 2,4,6 trichlorophenol, 4,6
Dinitro-o-cresol and 4, chloro-2,methylphenol are polar organic compounds.
For polar (or ionic) organic compounds, values of Koc vary with pH. The recommended
equation to calculate Kd given in the EA Remedial Targets Methodology (Reference 10) is
as follows:
Kd = {Koc,n x (1 + 10pH-pKa)-1 + Koc,i x (1 – (1 + 10pH-pKa)-1)} x FOC
Therefore Koc = Koc,n x (1 + 10pH-pKa)-1 + Koc,i x (1 – (1 + 10pH-pKa)-1)
Where Koc,n = Koc for neutral species;
Koc,i = Koc for ionised species;
pH = pH value; and
pKa = acid dissociation constant.
However, there is no indication of neutral or ionised species in the available literature
values of Koc. Therefore, it has been assumed that the literature values represent the total
Koc (Koc,n and Koc,i) and the standard calculation for Kd can be used.
It should also be noted that for both phenol (Reference 22) and 4,chloro-2,methylphenol, at
near neutral pH, based upon the acid dissociation constant, over 99% of the ions present
are neutral and therefore the compounds will behave as non-polar compounds.
Hempa, Schradan and Bis(2-chloroethyl)ether in Type B Material
For hempa, schradan and Bis(2-chloroethyl)ether available literature values for Koc were
very limited and comprised estimated values only. A large volume of soil analysis and
leachate analysis was undertaken on Type B samples for a limited number of CoCs at the
site and therefore as an alternative to the calculating Kd using FOC and Koc literature
values, based on the Level 1 equation (see Section 5.3), site specific values of Kd were
calculated for each sample using:
Kd + (θw + θs.H)/ρs = Soil concentration (Cs) / Leachate concentration (Cl)
It should be noted that given the low values of θw , θs, and H, and to simplify the
calculations, (θw + θs.H)/ρs has been assumed to be zero.
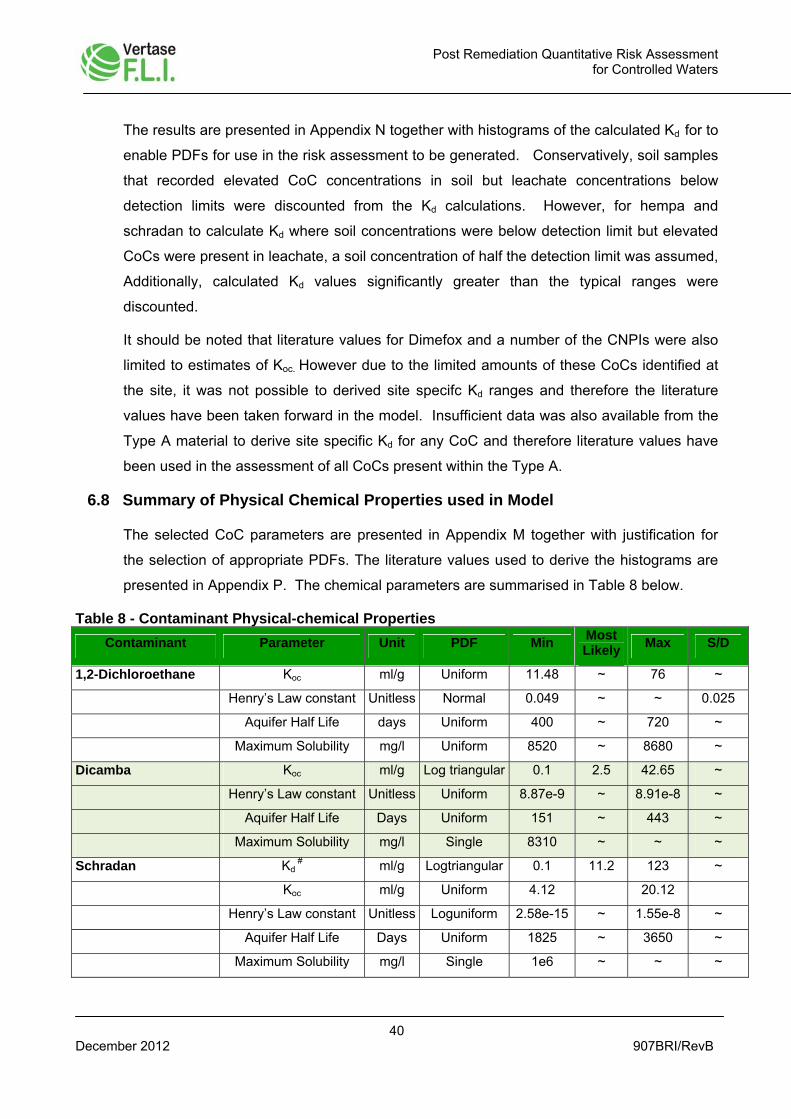
Post Remediation Quantitative Risk Assessment for Controlled Waters
40 December 2012 907BRI/RevB
The results are presented in Appendix N together with histograms of the calculated Kd for to
enable PDFs for use in the risk assessment to be generated. Conservatively, soil samples
that recorded elevated CoC concentrations in soil but leachate concentrations below
detection limits were discounted from the Kd calculations. However, for hempa and
schradan to calculate Kd where soil concentrations were below detection limit but elevated
CoCs were present in leachate, a soil concentration of half the detection limit was assumed,
Additionally, calculated Kd values significantly greater than the typical ranges were
discounted.
It should be noted that literature values for Dimefox and a number of the CNPIs were also
limited to estimates of Koc. However due to the limited amounts of these CoCs identified at
the site, it was not possible to derived site specifc Kd ranges and therefore the literature
values have been taken forward in the model. Insufficient data was also available from the
Type A material to derive site specific Kd for any CoC and therefore literature values have
been used in the assessment of all CoCs present within the Type A.
6.8 Summary of Physical Chemical Properties used in Model
The selected CoC parameters are presented in Appendix M together with justification for
the selection of appropriate PDFs. The literature values used to derive the histograms are
presented in Appendix P. The chemical parameters are summarised in Table 8 below.
Table 8 - Contaminant Physical-chemical Properties
Contaminant Parameter Unit PDF Min Most Likely
Max S/D
1,2-Dichloroethane Koc ml/g Uniform 11.48 ~ 76 ~
Henry’s Law constant Unitless Normal 0.049 ~ ~ 0.025
Aquifer Half Life days Uniform 400 ~ 720 ~
Maximum Solubility mg/l Uniform 8520 ~ 8680 ~
Dicamba Koc ml/g Log triangular 0.1 2.5 42.65 ~
Henry’s Law constant Unitless Uniform 8.87e-9 ~ 8.91e-8 ~
Aquifer Half Life Days Uniform 151 ~ 443 ~
Maximum Solubility mg/l Single 8310 ~ ~ ~
Schradan Kd # ml/g Logtriangular 0.1 11.2 123 ~
Koc ml/g Uniform 4.12 20.12
Henry’s Law constant Unitless Loguniform 2.58e-15 ~ 1.55e-8 ~
Aquifer Half Life Days Uniform 1825 ~ 3650 ~
Maximum Solubility mg/l Single 1e6 ~ ~ ~
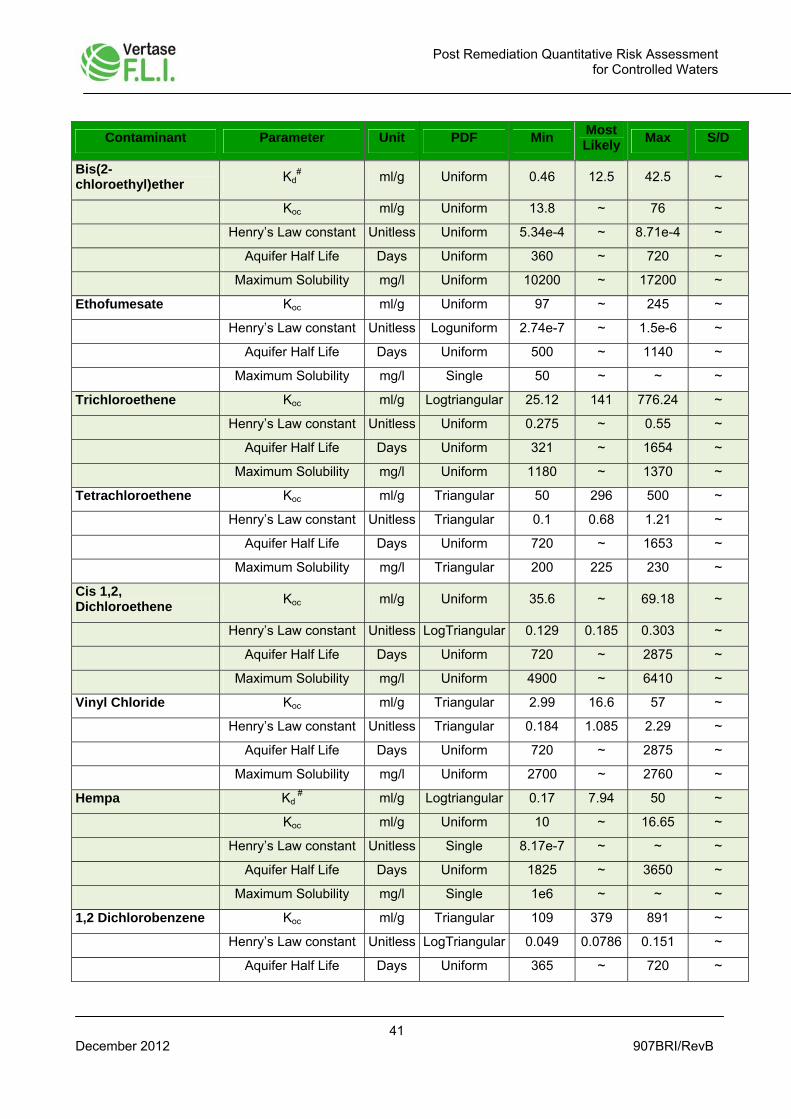
Post Remediation Quantitative Risk Assessment for Controlled Waters
41 December 2012 907BRI/RevB
Contaminant Parameter Unit PDF Min Most Likely
Max S/D
Bis(2-chloroethyl)ether
Kd# ml/g Uniform 0.46 12.5 42.5 ~
Koc ml/g Uniform 13.8 ~ 76 ~
Henry’s Law constant Unitless Uniform 5.34e-4 ~ 8.71e-4 ~
Aquifer Half Life Days Uniform 360 ~ 720 ~
Maximum Solubility mg/l Uniform 10200 ~ 17200 ~
Ethofumesate Koc ml/g Uniform 97 ~ 245 ~
Henry’s Law constant Unitless Loguniform 2.74e-7 ~ 1.5e-6 ~
Aquifer Half Life Days Uniform 500 ~ 1140 ~
Maximum Solubility mg/l Single 50 ~ ~ ~
Trichloroethene Koc ml/g Logtriangular 25.12 141 776.24 ~
Henry’s Law constant Unitless Uniform 0.275 ~ 0.55 ~
Aquifer Half Life Days Uniform 321 ~ 1654 ~
Maximum Solubility mg/l Uniform 1180 ~ 1370 ~
Tetrachloroethene Koc ml/g Triangular 50 296 500 ~
Henry’s Law constant Unitless Triangular 0.1 0.68 1.21 ~
Aquifer Half Life Days Uniform 720 ~ 1653 ~
Maximum Solubility mg/l Triangular 200 225 230 ~
Cis 1,2, Dichloroethene
Koc ml/g Uniform 35.6 ~ 69.18 ~
Henry’s Law constant Unitless LogTriangular 0.129 0.185 0.303 ~
Aquifer Half Life Days Uniform 720 ~ 2875 ~
Maximum Solubility mg/l Uniform 4900 ~ 6410 ~
Vinyl Chloride Koc ml/g Triangular 2.99 16.6 57 ~
Henry’s Law constant Unitless Triangular 0.184 1.085 2.29 ~
Aquifer Half Life Days Uniform 720 ~ 2875 ~
Maximum Solubility mg/l Uniform 2700 ~ 2760 ~
Hempa Kd # ml/g Logtriangular 0.17 7.94 50 ~
Koc ml/g Uniform 10 ~ 16.65 ~
Henry’s Law constant Unitless Single 8.17e-7 ~ ~ ~
Aquifer Half Life Days Uniform 1825 ~ 3650 ~
Maximum Solubility mg/l Single 1e6 ~ ~ ~
1,2 Dichlorobenzene Koc ml/g Triangular 109 379 891 ~
Henry’s Law constant Unitless LogTriangular 0.049 0.0786 0.151 ~
Aquifer Half Life Days Uniform 365 ~ 720 ~
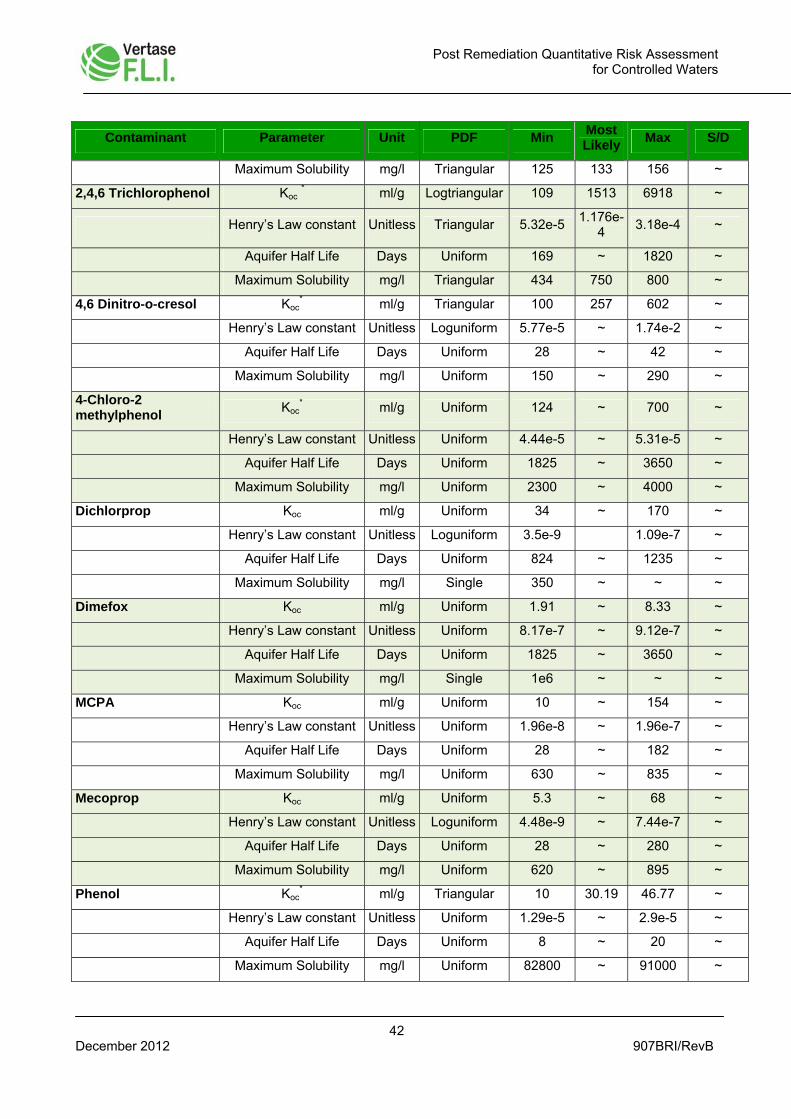
Post Remediation Quantitative Risk Assessment for Controlled Waters
42 December 2012 907BRI/RevB
Contaminant Parameter Unit PDF Min Most Likely
Max S/D
Maximum Solubility mg/l Triangular 125 133 156 ~
2,4,6 Trichlorophenol Koc * ml/g Logtriangular 109 1513 6918 ~
Henry’s Law constant Unitless Triangular 5.32e-5 1.176e-
4 3.18e-4 ~
Aquifer Half Life Days Uniform 169 ~ 1820 ~
Maximum Solubility mg/l Triangular 434 750 800 ~
4,6 Dinitro-o-cresol Koc* ml/g Triangular 100 257 602 ~
Henry’s Law constant Unitless Loguniform 5.77e-5 ~ 1.74e-2 ~
Aquifer Half Life Days Uniform 28 ~ 42 ~
Maximum Solubility mg/l Uniform 150 ~ 290 ~
4-Chloro-2 methylphenol
Koc* ml/g Uniform 124 ~ 700 ~
Henry’s Law constant Unitless Uniform 4.44e-5 ~ 5.31e-5 ~
Aquifer Half Life Days Uniform 1825 ~ 3650 ~
Maximum Solubility mg/l Uniform 2300 ~ 4000 ~
Dichlorprop Koc ml/g Uniform 34 ~ 170 ~
Henry’s Law constant Unitless Loguniform 3.5e-9 1.09e-7 ~
Aquifer Half Life Days Uniform 824 ~ 1235 ~
Maximum Solubility mg/l Single 350 ~ ~ ~
Dimefox Koc ml/g Uniform 1.91 ~ 8.33 ~
Henry’s Law constant Unitless Uniform 8.17e-7 ~ 9.12e-7 ~
Aquifer Half Life Days Uniform 1825 ~ 3650 ~
Maximum Solubility mg/l Single 1e6 ~ ~ ~
MCPA Koc ml/g Uniform 10 ~ 154 ~
Henry’s Law constant Unitless Uniform 1.96e-8 ~ 1.96e-7 ~
Aquifer Half Life Days Uniform 28 ~ 182 ~
Maximum Solubility mg/l Uniform 630 ~ 835 ~
Mecoprop Koc ml/g Uniform 5.3 ~ 68 ~
Henry’s Law constant Unitless Loguniform 4.48e-9 ~ 7.44e-7 ~
Aquifer Half Life Days Uniform 28 ~ 280 ~
Maximum Solubility mg/l Uniform 620 ~ 895 ~
Phenol Koc* ml/g Triangular 10 30.19 46.77 ~
Henry’s Law constant Unitless Uniform 1.29e-5 ~ 2.9e-5 ~
Aquifer Half Life Days Uniform 8 ~ 20 ~
Maximum Solubility mg/l Uniform 82800 ~ 91000 ~
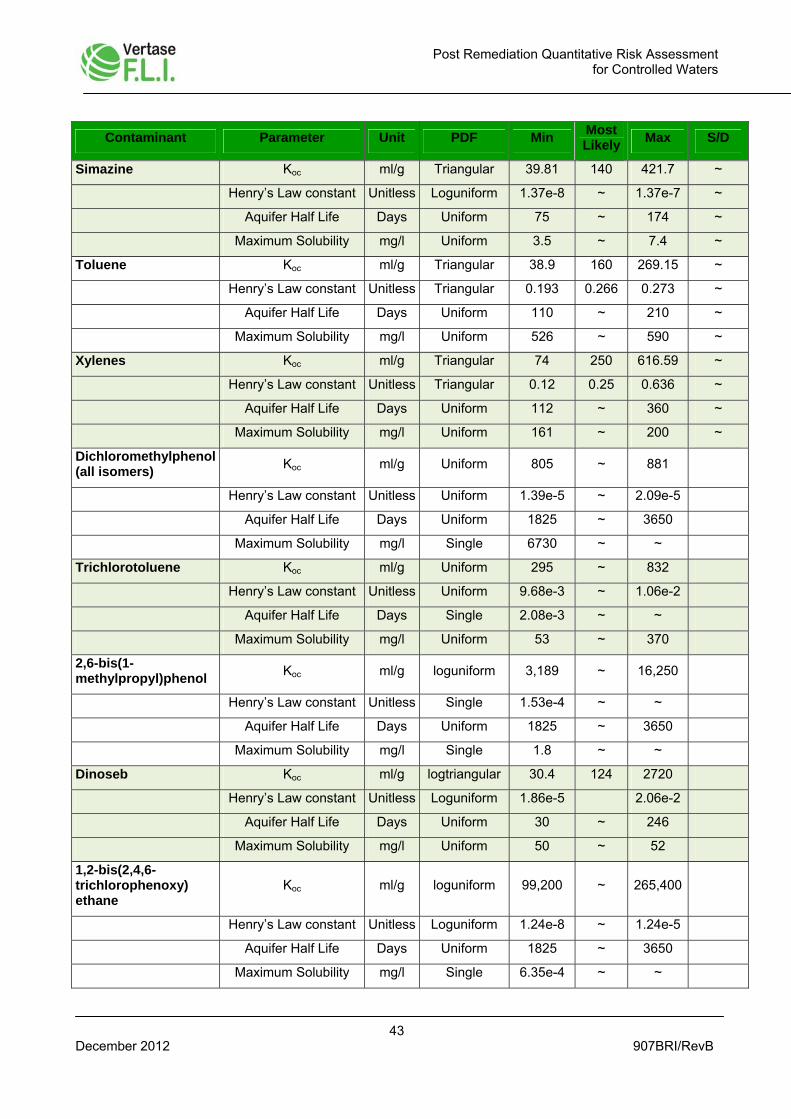
Post Remediation Quantitative Risk Assessment for Controlled Waters
43 December 2012 907BRI/RevB
Contaminant Parameter Unit PDF Min Most Likely
Max S/D
Simazine Koc ml/g Triangular 39.81 140 421.7 ~
Henry’s Law constant Unitless Loguniform 1.37e-8 ~ 1.37e-7 ~
Aquifer Half Life Days Uniform 75 ~ 174 ~
Maximum Solubility mg/l Uniform 3.5 ~ 7.4 ~
Toluene Koc ml/g Triangular 38.9 160 269.15 ~
Henry’s Law constant Unitless Triangular 0.193 0.266 0.273 ~
Aquifer Half Life Days Uniform 110 ~ 210 ~
Maximum Solubility mg/l Uniform 526 ~ 590 ~
Xylenes Koc ml/g Triangular 74 250 616.59 ~
Henry’s Law constant Unitless Triangular 0.12 0.25 0.636 ~
Aquifer Half Life Days Uniform 112 ~ 360 ~
Maximum Solubility mg/l Uniform 161 ~ 200 ~
Dichloromethylphenol (all isomers)
Koc ml/g Uniform 805 ~ 881
Henry’s Law constant Unitless Uniform 1.39e-5 ~ 2.09e-5
Aquifer Half Life Days Uniform 1825 ~ 3650
Maximum Solubility mg/l Single 6730 ~ ~
Trichlorotoluene Koc ml/g Uniform 295 ~ 832
Henry’s Law constant Unitless Uniform 9.68e-3 ~ 1.06e-2
Aquifer Half Life Days Single 2.08e-3 ~ ~
Maximum Solubility mg/l Uniform 53 ~ 370
2,6-bis(1-methylpropyl)phenol
Koc ml/g loguniform 3,189 ~ 16,250
Henry’s Law constant Unitless Single 1.53e-4 ~ ~
Aquifer Half Life Days Uniform 1825 ~ 3650
Maximum Solubility mg/l Single 1.8 ~ ~
Dinoseb Koc ml/g logtriangular 30.4 124 2720
Henry’s Law constant Unitless Loguniform 1.86e-5 2.06e-2
Aquifer Half Life Days Uniform 30 ~ 246
Maximum Solubility mg/l Uniform 50 ~ 52
1,2-bis(2,4,6-trichlorophenoxy) ethane
Koc ml/g loguniform 99,200 ~ 265,400
Henry’s Law constant Unitless Loguniform 1.24e-8 ~ 1.24e-5
Aquifer Half Life Days Uniform 1825 ~ 3650
Maximum Solubility mg/l Single 6.35e-4 ~ ~
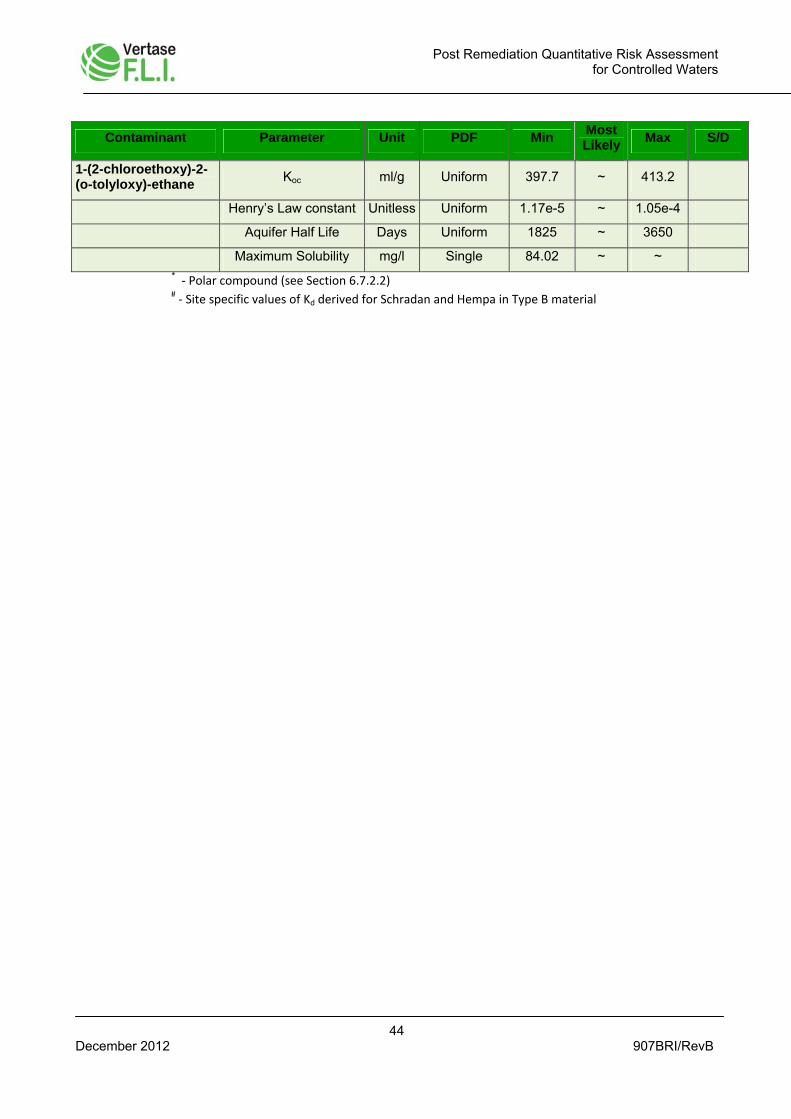
Post Remediation Quantitative Risk Assessment for Controlled Waters
44 December 2012 907BRI/RevB
Contaminant Parameter Unit PDF Min Most Likely
Max S/D
1-(2-chloroethoxy)-2-(o-tolyloxy)-ethane
Koc ml/g Uniform 397.7 ~ 413.2
Henry’s Law constant Unitless Uniform 1.17e-5 ~ 1.05e-4
Aquifer Half Life Days Uniform 1825 ~ 3650
Maximum Solubility mg/l Single 84.02 ~ ~ * ‐ Polar compound (see Section 6.7.2.2) # ‐ Site specific values of Kd derived for Schradan and Hempa in Type B material
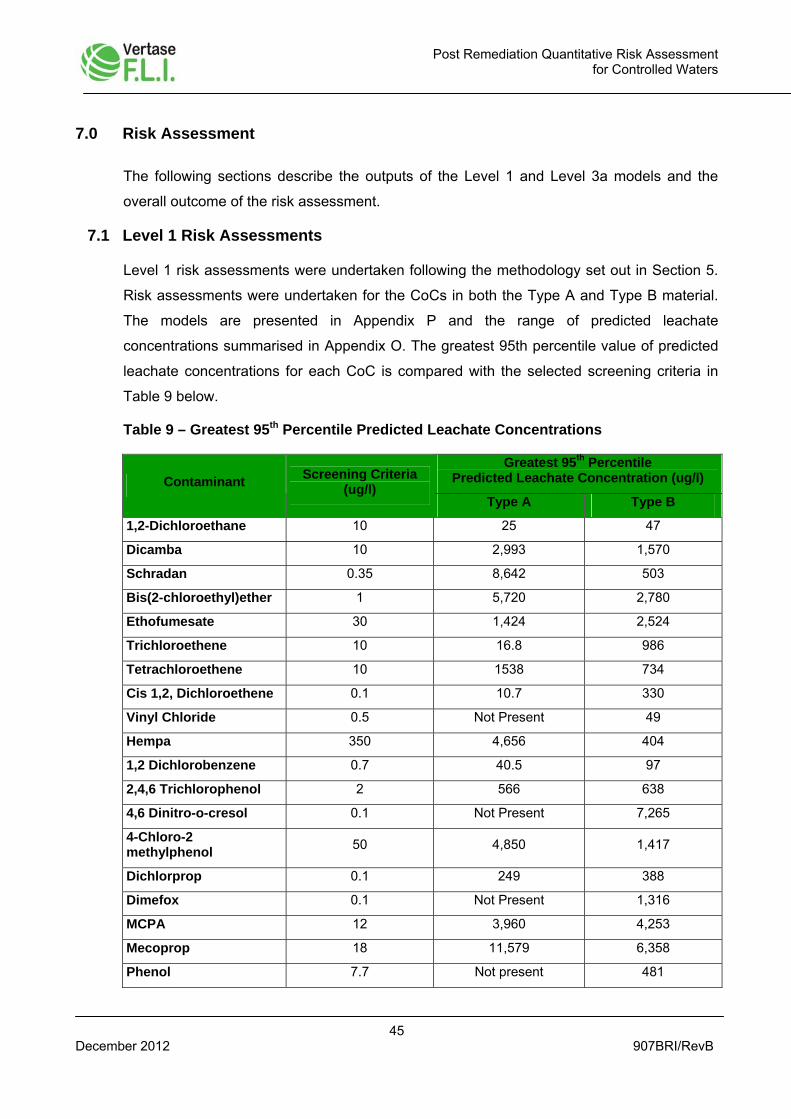
Post Remediation Quantitative Risk Assessment for Controlled Waters
45 December 2012 907BRI/RevB
7.0 Risk Assessment
The following sections describe the outputs of the Level 1 and Level 3a models and the
overall outcome of the risk assessment.
7.1 Level 1 Risk Assessments
Level 1 risk assessments were undertaken following the methodology set out in Section 5.
Risk assessments were undertaken for the CoCs in both the Type A and Type B material.
The models are presented in Appendix P and the range of predicted leachate
concentrations summarised in Appendix O. The greatest 95th percentile value of predicted
leachate concentrations for each CoC is compared with the selected screening criteria in
Table 9 below.
Table 9 – Greatest 95th Percentile Predicted Leachate Concentrations
Greatest 95th Percentile Predicted Leachate Concentration (ug/l) Contaminant
Screening Criteria (ug/l)
Type A Type B
1,2-Dichloroethane 10 25 47
Dicamba 10 2,993 1,570
Schradan 0.35 8,642 503
Bis(2-chloroethyl)ether 1 5,720 2,780
Ethofumesate 30 1,424 2,524
Trichloroethene 10 16.8 986
Tetrachloroethene 10 1538 734
Cis 1,2, Dichloroethene 0.1 10.7 330
Vinyl Chloride 0.5 Not Present 49
Hempa 350 4,656 404
1,2 Dichlorobenzene 0.7 40.5 97
2,4,6 Trichlorophenol 2 566 638
4,6 Dinitro-o-cresol 0.1 Not Present 7,265
4-Chloro-2 methylphenol
50 4,850 1,417
Dichlorprop 0.1 249 388
Dimefox 0.1 Not Present 1,316
MCPA 12 3,960 4,253
Mecoprop 18 11,579 6,358
Phenol 7.7 Not present 481
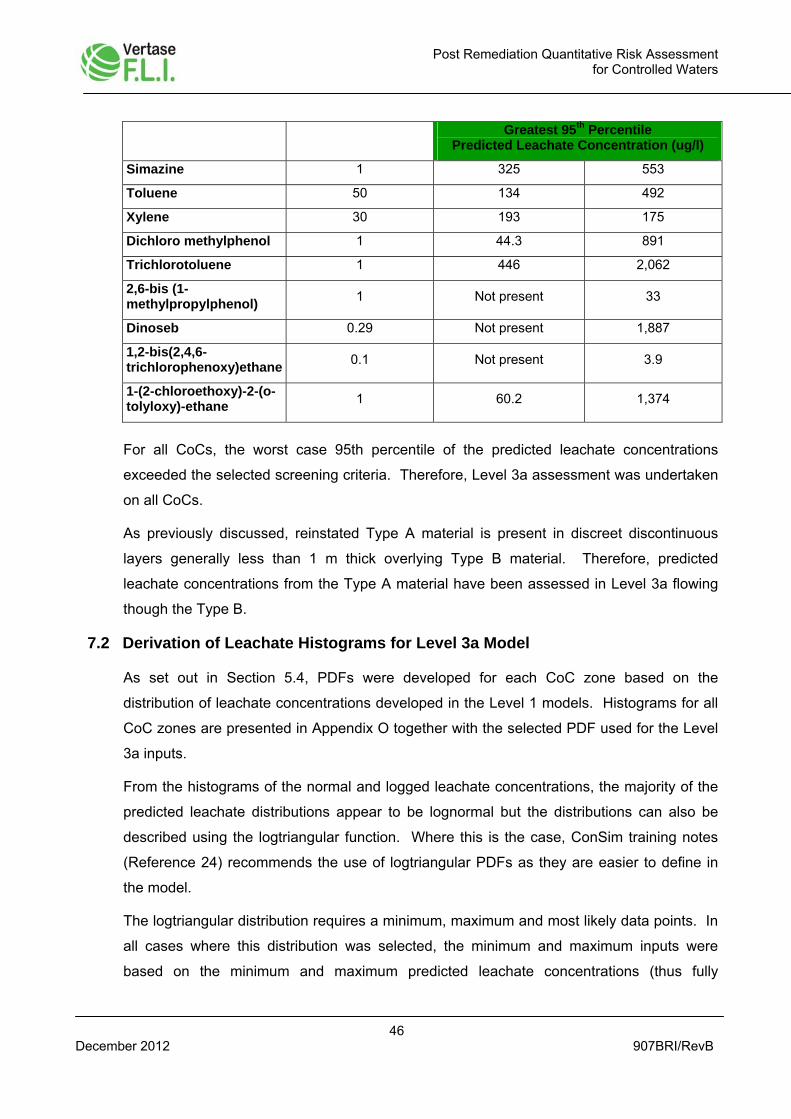
Post Remediation Quantitative Risk Assessment for Controlled Waters
46 December 2012 907BRI/RevB
Greatest 95th Percentile Predicted Leachate Concentration (ug/l)
Simazine 1 325 553
Toluene 50 134 492
Xylene 30 193 175
Dichloro methylphenol 1 44.3 891
Trichlorotoluene 1 446 2,062
2,6-bis (1-methylpropylphenol)
1 Not present 33
Dinoseb 0.29 Not present 1,887
1,2-bis(2,4,6-trichlorophenoxy)ethane
0.1 Not present 3.9
1-(2-chloroethoxy)-2-(o-tolyloxy)-ethane
1 60.2 1,374
For all CoCs, the worst case 95th percentile of the predicted leachate concentrations
exceeded the selected screening criteria. Therefore, Level 3a assessment was undertaken
on all CoCs.
As previously discussed, reinstated Type A material is present in discreet discontinuous
layers generally less than 1 m thick overlying Type B material. Therefore, predicted
leachate concentrations from the Type A material have been assessed in Level 3a flowing
though the Type B.
7.2 Derivation of Leachate Histograms for Level 3a Model
As set out in Section 5.4, PDFs were developed for each CoC zone based on the
distribution of leachate concentrations developed in the Level 1 models. Histograms for all
CoC zones are presented in Appendix O together with the selected PDF used for the Level
3a inputs.
From the histograms of the normal and logged leachate concentrations, the majority of the
predicted leachate distributions appear to be lognormal but the distributions can also be
described using the logtriangular function. Where this is the case, ConSim training notes
(Reference 24) recommends the use of logtriangular PDFs as they are easier to define in
the model.
The logtriangular distribution requires a minimum, maximum and most likely data points. In
all cases where this distribution was selected, the minimum and maximum inputs were
based on the minimum and maximum predicted leachate concentrations (thus fully
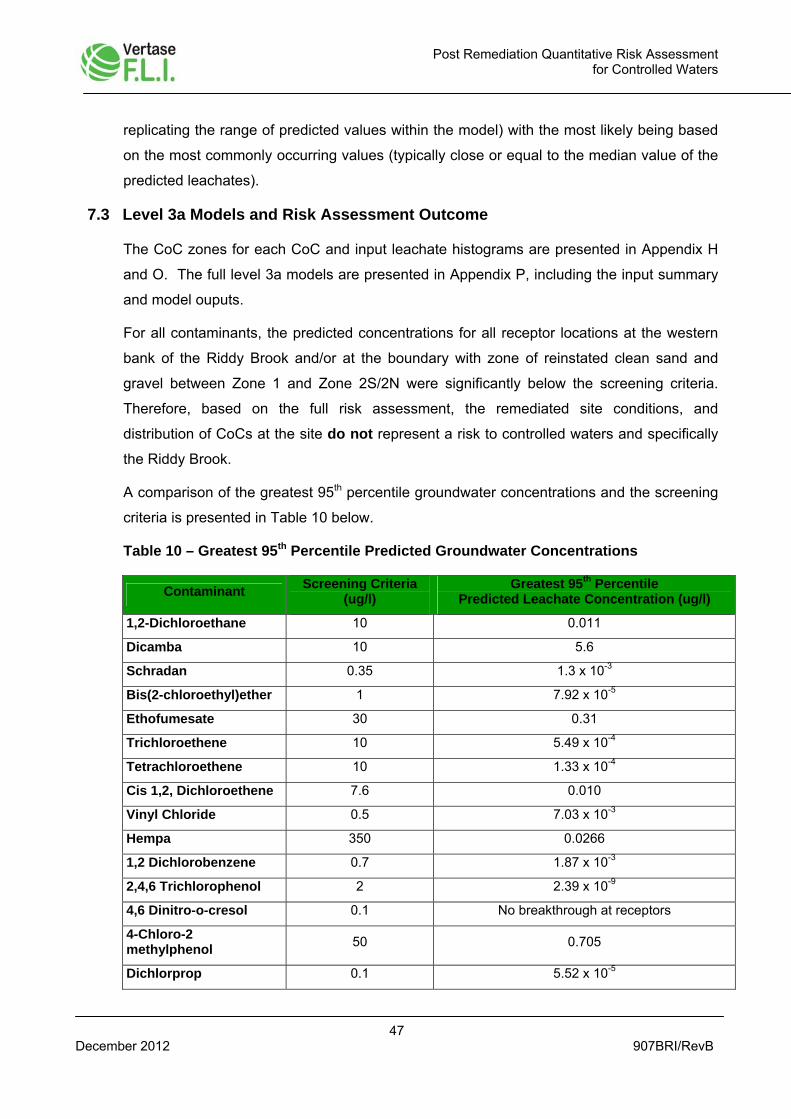
Post Remediation Quantitative Risk Assessment for Controlled Waters
47 December 2012 907BRI/RevB
replicating the range of predicted values within the model) with the most likely being based
on the most commonly occurring values (typically close or equal to the median value of the
predicted leachates).
7.3 Level 3a Models and Risk Assessment Outcome
The CoC zones for each CoC and input leachate histograms are presented in Appendix H
and O. The full level 3a models are presented in Appendix P, including the input summary
and model ouputs.
For all contaminants, the predicted concentrations for all receptor locations at the western
bank of the Riddy Brook and/or at the boundary with zone of reinstated clean sand and
gravel between Zone 1 and Zone 2S/2N were significantly below the screening criteria.
Therefore, based on the full risk assessment, the remediated site conditions, and
distribution of CoCs at the site do not represent a risk to controlled waters and specifically
the Riddy Brook.
A comparison of the greatest 95th percentile groundwater concentrations and the screening
criteria is presented in Table 10 below.
Table 10 – Greatest 95th Percentile Predicted Groundwater Concentrations
Contaminant Screening Criteria
(ug/l) Greatest 95th Percentile
Predicted Leachate Concentration (ug/l)
1,2-Dichloroethane 10 0.011
Dicamba 10 5.6
Schradan 0.35 1.3 x 10⁻³
Bis(2-chloroethyl)ether 1 7.92 x 10⁻⁵
Ethofumesate 30 0.31
Trichloroethene 10 5.49 x 10⁻⁴
Tetrachloroethene 10 1.33 x 10⁻⁴
Cis 1,2, Dichloroethene 7.6 0.010
Vinyl Chloride 0.5 7.03 x 10⁻³
Hempa 350 0.0266
1,2 Dichlorobenzene 0.7 1.87 x 10⁻³
2,4,6 Trichlorophenol 2 2.39 x 10⁻⁹
4,6 Dinitro-o-cresol 0.1 No breakthrough at receptors
4-Chloro-2 methylphenol
50 0.705
Dichlorprop 0.1 5.52 x 10⁻⁵
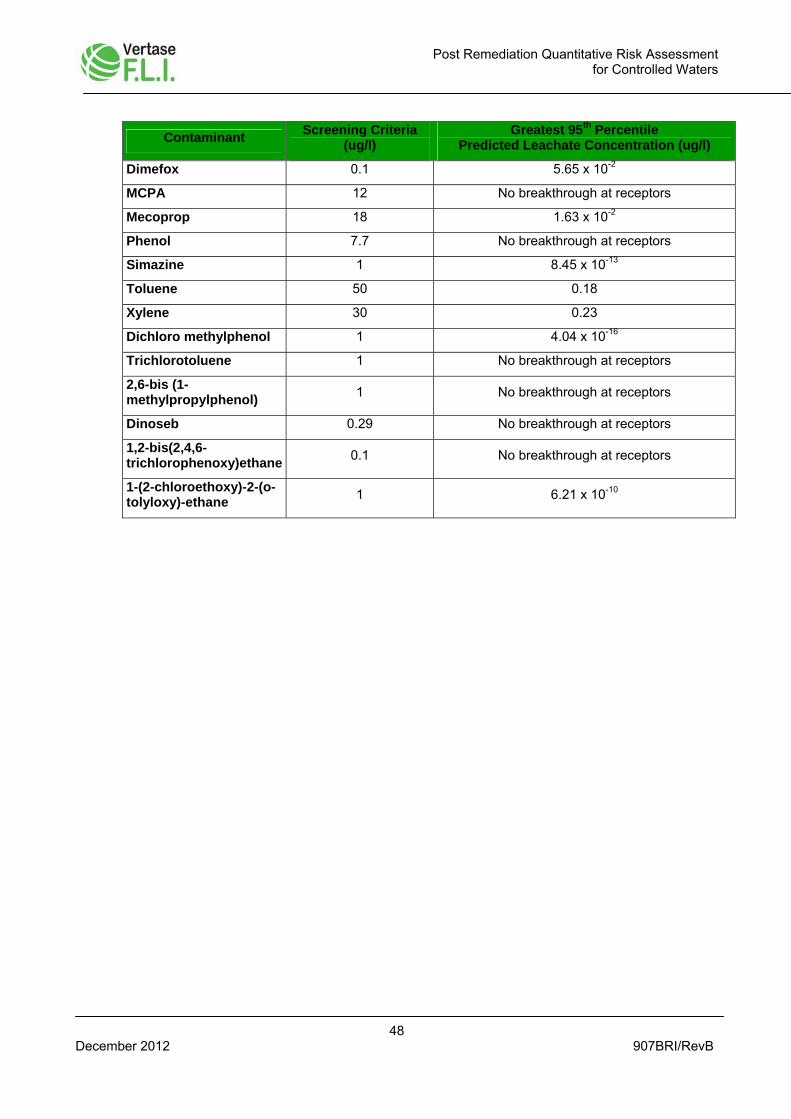
Post Remediation Quantitative Risk Assessment for Controlled Waters
48 December 2012 907BRI/RevB
Contaminant Screening Criteria
(ug/l) Greatest 95th Percentile
Predicted Leachate Concentration (ug/l)
Dimefox 0.1 5.65 x 10⁻²
MCPA 12 No breakthrough at receptors
Mecoprop 18 1.63 x 10⁻²
Phenol 7.7 No breakthrough at receptors
Simazine 1 8.45 x 10⁻¹³
Toluene 50 0.18
Xylene 30 0.23
Dichloro methylphenol 1 4.04 x 10⁻¹⁶
Trichlorotoluene 1 No breakthrough at receptors
2,6-bis (1-methylpropylphenol)
1 No breakthrough at receptors
Dinoseb 0.29 No breakthrough at receptors
1,2-bis(2,4,6-trichlorophenoxy)ethane
0.1 No breakthrough at receptors
1-(2-chloroethoxy)-2-(o-tolyloxy)-ethane
1 6.21 x 10⁻¹⁰
Post Remediation Quantitative Risk Assessment for Controlled Waters
49 December 2012 907BRI/RevB
8.0 Summary
Following the completion of the remedial works at the former Bayer Crop Science Site,
detailed post remediation risk assessments have been undertaken at the site as part of the
validation process in accordance with the VertaseFLI remediation method statement.
Building on work undertaken in previous iterations of the risk assessment, the conceptual
site model (CSM) was refined to reflect the final post remediation conditions in as much
detail and as accurately as possible; and risk assessments were run using the methodology
set out in previous reports. Large amounts of site specific data was collected during the
remedial works including in-situ measurements of permeability/hydraulic conductivity in
Type B material; geotechnical properties; and the final distribution of CoCs and their
concentrations accurately mapped to enable the final site conditions to be modelled as
accurately as possible.
A number of conservative assumptions were also made in the model as follows:
There is no attenuation of the contaminants as there is considered to be no
unsaturated zone;
There is no dilution of the groundwater/leachate concentrations in the aquifer;
The remaining CoCs in the remediated soils are non declining sources;
Groundwater flow across the site has been assumed to be towards the Riddy Brook
ignoring the groundwater low in the reinstated soil material in the north of the site
(based on current 2012 monitoring data) which suggests either negligable flow
through the reinstated soil material or groundwater flow in much of the reinstated
soils is currently away from the Riddy Brook;
Only soil material from treatment beds where elevated CoCs were recorded was
used to derive CoC probability density functions for each contaminant zone.
Therefore, data from treatment beds where CoCs were below detection limit were
conservatively discounted; and
Where deposits of clean sand and gravel were reinstated in Zone 1, the boundary
between Zone 1 and Zones 2S/2N (a minimum of 20 m from the Riddy Brook) has
been conservatively set as the receptor.
Post Remediation Quantitative Risk Assessment for Controlled Waters
50 December 2012 907BRI/RevB
Of the 23 CoCs and 9 contaminants not previously identified (CNPIs) 4 contaminants
(Cyclohexanone, Chlorzaine, Dimethyl nitroanaline and Oxathiane 4, 4-dioxide) were not
present in the reinstated soils. Using the revised CSM, all available site specific data and
the conservative assumptions listed above, risk assessment models were run for the
remaining 28 contaminants. The outcome of the risk assessments for all contaminants
confirmed that following the remedial works , the remaining contaminant concentrations do
not represent a risk to controlled waters and specifically the Riddy Brook.
Post Remediation Quantitative Risk Assessment for Controlled Waters
51 December 2012 907BRI/RevB
9.0 References
1. Atkins Ltd (2007), ‘Derivation of Pesticide Soil Screening Values and Evaluation of
Spatial Extent of Contamination, Former Bayer Site, Hauxton’, July 2007.
2. VertaseFLI (2011), ‘Further Quantitative Risk Assessment for Risks to Groundwater
and Surface Waters, Former Bayer CropScience Site, Hauxton, Cambridgeshire’, July
2011 Revision B
3. VertaseFLI (2009), ‘Remediation Method Statement – Former Bayer Crop Science
Site, Hauxton Cambridgeshire’, April 2009 – Revision 6.
4. Enviros Consulting Ltd (2005), ‘Part IIA Site Investigation Report, Report for Bayer
CropScience’, January 2005, Ref. SH0250008A.
5. Atkins Ltd (2006), ‘Remediation of Former Bayer Site, Hauxton, Preliminary
Conceptual Model Report’, August 2006 – Revision 4a.
6. VertaseFLI (2012), ’Further Quantitative Risk Assessment for Contaminants Not
Previously Identified, Former Bayer Site, Hauxton’, March 2012 – Revision A
7. VertaseFLI (2012), ‘Completion Report, Former Bayer Site, Hauxton’, December 2012
Rev B
8. British Geological Survey, ‘Solid and Drift Geology Map – Sheet 205 – Saffron
Waldon’, 2004.
9. Bernard O’Connor, ‘The Hauxton Fossil Diggings’, 2011.
10. Environment Agency, ‘Aquifer Designation Maps’, Http://maps.environment-
agency.gov.uk, accessed June 17 2012.
11. Golder Associates (2009), ‘ConSim 2.5.004, Environment Agency R& D Publication
137’
12. Environment Agency (2006), ‘Remedial Targets Methodology – Hydrogeological Risk
Assessment for Land Contamination’ .
13. Defra – Drinking Water Inspectorate, ‘Pesticides Leaflet’, January 2010 – downloaded
from: http://dwi.defra.gov.uk/consumers/advice-leaflets/pesticides.pdf
14. UK Technical Advisory Group on the Water Framework Directive, ‘Proposals for
Environmental Quality Standards for Annex VIII Substances, Final – SR1’, 2007
Post Remediation Quantitative Risk Assessment for Controlled Waters
52 December 2012 907BRI/RevB
15. Defra, ‘River Basin District Typography, Standards and Groundwater Threshold
Values (Water Framework Directive) (England and Wales) Directions’, 2009.
16. Swedish Chemicals Agency, ‘Water Quality Standards for Pesticides in Surface Water
– Summary Document’ -
http://www.kemi.se/Documents/Bekampningsmedel/Vaxtskyddsmedel/Protokoll_riktva
rden_vaxtskyddsmedel.pdf , dated April 2008, accessed June 2012.
17. Organisation for Economic Co-Operation and Chemical Properties, OECD, ‘Screening
Information Dataset – 4-Chloro-o-cresol, Identifiers, Physical and Chemical
Properties’ EINECS-No.: 216-381-3, 1998.
18. European Chemicals Agency, ‘Dinoseb Ecotoxicological Information’, downloaded
from http://apps.echa.europa.eu/registered/data/dossiers/DISS-9d9d5546-37af-1230-
e044-00144f67d249/AGGR-1e9a3dc1-e3ab-4fbd-8963-1d4bfe86d4b5_DISS-
9d9d5546-37af-1230-e044-00144f67d249.html#AGGR-1e9a3dc1-e3ab-4fbd-8963-
1d4bfe86d4b5, 18 June 2012.
19. Mackay et al (2006), ‘Handbook of Physical-Chemical Properties and Environmental
Fate for Organic Chemicals’ Second Edition, Taylor & Francis Group
20. Environment Agency (2008), ‘Compilation of data for priority organic pollutants for
derivation of Soil Guideline Values’, Science Report SC050021/SR7.
21. Howard et al, ‘Environmental Degradation Rates’, 1991, Lewis Publishers;
22. Nathanail, C.P., McCaffrey, C., Ashmore, H.H., Cheng, Y.Y., Gillett, A., Ogden, R. &
Scott, D. (2009), ‘The LQM/CIEH Generic Assessment Criteria for Human Health Risk
Assessment (2nd Edition)’, Land Quality Press, Nottingham.
23. Domenico,P.A. and Schwartz,F.W. Physical and Chemical Hydrogeology, Wiley,1990.
24. Golder Associates, ‘Consim Training Manual’, 2005.
25. Environment Agency, ‘Chemical Standards Database’, http://evidence.environment-
agency.gov.uk/ChemicalStandards/home.aspx, Accessed June 11, 2012.
26. National Institute for Public Health and the Environment, Netherlands (RIVM),
‘Ecotoxicologically based environmental risk limits for several volatile aliphatic
hydrocarbons’, RIVM report 601782002/2007, 2007,
27. VertaseFLI (2012), ‘Contract Completion Addendum Report’, December 2012
Revision B
Post Remediation Quantitative Risk Assessment for Controlled Waters
53 December 2012 907BRI/RevB
28. VertaseFLI (2012), ‘Groundwater Validation Report’, December 2012, Revision B
29. VertaseLFI (2012), ‘Groundwater Validation – Addendum Report’, December 2012,
Revision B