positioning of spanish retailers. perception of high...
TRANSCRIPT

Positioning of Spanish Retailers. Perception of high frequency versus low frequency consumers.
El posicionamiento de los distribuidores españoles. Percepciones de los consumidores de alta frecuencia versus consumidores de baja frecuencia.
Carmen Abril PhD, Associate Professor, Complutense University, Madrid, Spain. [email protected]
Diana Gavilan PhD, Associate Professor, Complutense University, Madrid, Spain. [email protected]
Maria Avello PhD, Associate Professor, Computense University, Madrid, Spain. [email protected]
Dada la alta competitividad existente en la actualidad en los mercados de gran consumo, la decisión de posicionamiento es una de las más importantes a las que los detallistas se enfrentan a la hora de determinar su estrategia competitiva en el mercado. Esta decisión es importante no sólo para los detallistas sino también para los fabricantes, porque aunque la literatura del comportamiento del consu-midor suele enfocar su análisis en la elección de marca, existe en la actualidad una clara evidencia de que los consumidores deciden antes “dónde comprar” que “qué marca” comprar.
El objetivo de esta investigación es profundizar en el posicionamiento de los deta-llistas en España, analizando las distintas percepciones existentes en el consumi-dor, distinguiendo entre consumidores de “alta frecuencia” o “habituales” y consu-midores de “repertorio” o de ”baja frecuencia”.
Nuestros resultados muestran las dificultades que los hipermercados tienen para transmitir un posicionamiento diferenciado y relevante al consumidor, y las dife-rentes percepciones de los discounters según los distintos tipos de consumidores, sugiriendo la necesidad de un reposicionamiento mas allá del puro precio. Por otra parte, se observa el abrumador dominio de Mercadona que ha sido capaz de posicionarse no sólo en precio sino en una oferta relevante de marca de distribui-dor que la sitúa en altos niveles de satisfacción y percepción de servicio por parte de los consumidores.
ABSTRACT
RESUMEN
JEL Classification: M31Key words: store brands,
positioning,
retailer strategy,
consumer satisfaction,
price.
Clasificación JEL: M31Palabras clave: marcas de distribuidor,
posicionamiento,
detallistas,
satisfacción,
precio.
In today’s highly competitive marketing environment, the positioning decision of retailers is one of the most important element of marketing management. Re-tailing positioning is an integrated management activity that takes in elements of the retail mix and is of critical importance for retailers and for manufacturers. Whereas consumer theory has traditionally place brand choice as the focus of the analysis, there is evidence that consumers are turning to shopping strategies ra-ther than brand decisions. The objective of this research is to better understand the positioning of Spanish retailers analyzing the different perceptions between high frequency and low frequency consumers. Our results show the difficulties hypermarkets are facing to deliver a distinctive consumer proposition and the di-fferent perceptions on discounters accordingly to different types of consumers reflecting the need to deliver further benefits to consumers beyond pricing. On the other hand the overwhelming superiority of Mercadona is shown through their relevant price and store brands proposition leading consumer to perceive high level of service and consumer satisfaction.
aDResearchESIC28 Segundo semestre, julio-diciembre 2010
IntroductionIn today’s highly competitive marketing environ-
ment, the positioning decision is one of the most
important element of marketing management
(Blankson et al., 2008) because of its impact on
the long-term success of companies in the mar-
ketplace. Scholars have investigated positioning
methods to guide the company’s choice of posi-
tioning strategies (Gursoy et al., 2005).
Thus, a key strategic decision of modern retail
management is to define the positioning strategy
of the retailer –ie. to define their consumer value
proposition. Positioning is the act of designing
an organization’s image to occupy a distinctive
place in the target market’s mind and it is based
on consumers’ perceptions (Brooksbank, 1994).
Its importance is given by the fact that without a
well-defined positioning paradigm, it is hard for
a product or a company to serve its intended
purpose and survive in the competitive market-
place of today (Gursoy et al., 2005).
Retailing positioning is an integrated manage-
ment activity that takes in elements of the retail
mix such as merchandising, store format, as-
sortment, price strategy, promotional efforts
(Walters and Laffy, 1996) and others like service,
advertising or the innovation factor developed by
the retailer. These factors create a point of diffe-
rentiation from the competition, and help to en-
hance the retail store brand. Intensifying retail
competition and growing market saturation are
continuously forcing retailers to develop a better
understanding of positioning to generate diffe-
rentiation tools (Amirani and Gates, 1993; Choi
and Coughlan, 2006).
A retailer’s positioning is frequently influen-
ced by consumer trends, market performance
and competitor’s seeking opportunity for profit
and growth (Corstjens and Doyle, 1989).
Whereas consumer theory has traditionally
place brand choice as the focus of the analysis,
there is evidence that consumers are turning to
shopping strategies rather than brand decisions.
Some studies indicate that decision about where
to shop precede brand choice (Millan and
Howard, 2007). There are several key factors
that can influence consumer choice and retailer
perception. Purchase experience, assortment,
price, promotion, advertising, store brand quali-
ty, service and innovation are key variables that
determine the image of retailers on consumers.
Concerning store brands, over the last few
years, private labels have steadily eroded the
market share traditionally held by national
brands (Nielsen, 2007; Juhl, 2006). In fact, in
2008, private labels increased their market share
to 25% and 50% in most European markets and
to 20% in the US (PLMA, 2009). One factor that
explains this situation is the improvement on the
consumer perception of store brands (Ipsos
Mori, 2006) leading to a change on consumer
behavior towards traditional manufacturer
brands (Burt, 2000).
Spain with 34% store brand share has one
of the highest shares worldwide (PLMA, 2009).
Growth of store brands in Spain is estimated at
115% between 2000 and 2007 (Euromoni-
tor 2008) which makes the subject even more
relevant.
As it is true for any brand, positioning a store
brand can exert an important influence on its
performance and affect retailers’ image and posi-
tioning (Sayman et al., 2002; Tarnowsky, 2007).
Then, we consider that improving our unders-
tanding on factors influencing retailers choice,
especially in the context of store brands, will be
of great relevance for the academic community
and for the industry.
29Positioning of Spanish Retailers: Perception of high frequency versus low frequency consumers
We intend to examine through several statis-
tical procedures whether consumers perceive
differences in the positioning of different retai-
lers in Spain and whether this perception stems
from different consumer purchase behavior on
the stores. We are interested in answering the
following research questions:
1. Which is the consumer perception of retailer’s
positioning in Spain?
2. What are the critical factors that define retai-
lers competitive advantage in the perceptual
map?
3. Are there significant differences on percep-
tion depending on the frequency of purchase
in the stores?
4. What are the implications for retailers strate-
gies?
Theoretical backgroundPositioning is based on consumer perceptions
(Brooksbank, 1994) and its importance is due to
the fact that is a driver of consumer choice (Knus-
ton, 2000) based in a value proposition different
from competitors (Herman and Huber, 2000).
As perception is based on image it is impor-
tant to identify which are the variables consu-
mers focus their interest on. Different authors
have defined different perceptual typologies
concerning product and service attributes rele-
vant for consumers (Abril et al., 2009). Blankson
and Kalafatis (2001) propose eight generic di-
mensions suitable for both. Lovelock and Wright
(2001) specify some attributes for services. Under
retailer context Jim Yoo and Chang, (2005) iden-
tify two set of attributes: functionals –assortment,
place, value for pricing, promotion- and psycho-
logicals– represented by sensorial cues and ex-
perience.
In order to perform our study we will analyze
some key factors consumers consider when
choosing a retailer.
Turley and Chebat (2002) established theo-
retical links between retail management strategy
and the image evoked by a wide range of tangible
and intangible factors. Therefore measuring re-
tailer image components serves to evaluate the
success of the retail strategy and the retailer's bid
to satisfy the target market.
Marketers only have partial control of their
companies and products positioning in the mar-
ketplace (Dibb et al., 1997). Retailers have even
less control in the positioning of their companies
because of the nature of the service and the de-
pendence on the assortment of brand and pro-
ducts positioning. What retailers sell are not
only physical objects, but performances and ex-
periences. Experiences differ substantially from
service provider to service provider and from
customer to customer (Brakus et al., 2009).
Thus, related to the retailer decision on their
positioning strategy it is also the management
decision to adapt retailer business to a changing
retail environment, thus repositioning their retai-
ler brand accordingly.
Retail store image is considered one of the
most important determinants of success and
there have been numerous studies attempting to
define store image (Newman and Patel, 2004).
There is a multifaceted explanation(s) of image
made up of components or attributes, both phy-
sical and psychological, all of which depict the
store in the mind of customer. It is therefore im-
portant to understand how store image shapes
customer choice criteria.
Store image attributes can vary across the re-
tail sector (Birtwistle and Shearer, 2001). In the
context of this research, it is possible to assign
aDResearchESIC30 Segundo semestre, julio-diciembre 2010
attributes that relate to stores in general, like pri-
ces, advertising and promotion, service, assort-
ment, or innovation (Yoo et al., 2000), all of them
highly indicative of retail management strategy.
For example, Newman and Pattel (1983) stres-
ses that the range of merchandise – assortment-,
promotions and the atmosphere of the stores are
the most important factors influencing consu-
mer choice. In fact, retailers deliver their offe-
rings through customer experience, thus inclu-
ding several different aspects that could
influence it. As said, the most common factors
studied in the literature are the quality of service,
product assortment, pricing policy, promotional
and advertising activity as well as store brand
quality. We will consider all of them through
validated items and scales that will reflect consu-
mer perceptions on key Spanish retailers.
Understanding how a retailer should be posi-
tioned in terms of brand assortment is of critical
importance as it is related to its image (Ailawadi
and Keller, 2004). Consumer’s perception of the
depth of a retailer’s assortment is an important
dimension of store image as well as key driver
of store choice. As the perceived assortment of
brands, flavors and sizes increases, variety-see-
king consumers will perceive greater utility.
Related to the assortment is the retailer store
brand strategy. Store brands have been consi-
dered of special importance in recent years for
retailer´s strategy (Baltas, 1999). Reason for this
is that store brands are more profitable for retai-
lers, enhance their negotiation power towards
manufacturers, and they contribute to differen-
tiate their offerings and build consumer store
loyalty. (Ailawadi et al., 2008; Alan et al., 1995).
The presence of store brands improve channel
efficiency (Chen et al., 2009) and the fact that
retailers control store brands positioning is one
of the key reasons that makes store brands so va-
luable to them (Morton and Zettelmeyer, 2004).
Since store brands influence the retailer’s
positioning and image, understanding how a re-
tailer should position itself in terms of brand
assortment is of critical importance (Ailawadi
and Keller, 2004).
Price levels and depth and frequency of pro-
motions are also of capital importance to retai-
ler perceived positioning as retailers image can
be influenced by attributes like average level
of prices and how much variation there is in
prices over time (Lattin and Bucklin, 1989).
Also other authors find significant impact of
promotions in retailer’s choice (Kumar and
Steenkamp, 2007).
Finally, purchase experience is becoming
a critical attribute which is also an important
marketing trend. We understand marketing expe-
rience as company sponsored activities and pro-
grams designed to create a special brand related
interactions (Brakus et al., 2009). Schmitt (1999),
developed the concept of Customer Experience
Management, which he defines as the process of
strategically managing a customer ‘s entire expe-
rience with a product or company.
Customer experience is thus critical for retai-
lers who are in an ideal position to create expe-
riences for their customers, as they are respon-
sible for the total purchase experience: from
location, store image, assortment, offerings, ad-
vertising, delivery, customer service and post
purchase experience.
MethodIn order to accomplish our research objectives
we performed an empirical study based on a sur-
vey of 422 interviews. Household purchase res-
ponsibles were contacted face-to-face at the exit
31Positioning of Spanish Retailers: Perception of high frequency versus low frequency consumers
of different supermarkets and hypermarkets. We
included enough sample size in order to be able
to measure perception and retailers image by
lead retailers, including international ones like
Carrefour, Dia, Auchan (Alcampo), Lidl, as well
as local ones like Mercadona and Eroski.
Personal interviews were selected as method
of survey in order to better handle the informa-
tion on brands to show consumers and explain
the rating method used with the likert scales.
Respondents were approached randomly at
the selected retailers. We divided consumers
accordingly to their purchase behavior by retai-
ler. We named one group high frequency consu-
mers of eac h specific retailer and the other group
low frequency consumers . In the high frequency
consumers we basically included consumers that
consider that store as their first choice and their
most frequently retailer visited. In the second
group we included consumers that consider that
retailer as one in their repertoire and those that
declare to shop from time to time on it.
The six retailers we analyzed account for
more than 50% of Consumer Packaged Goods
market in Spain. Carrefour captured 13.9% of
all food retailers sales in 2007 and Mercadona
was a whisker behind on 13.8%. The top five
players together accounted for around 50% of
the sector, making Spain still one of the more
fragmented markets in Western Europe.
Local retailer – Grupo Eroski– along with
French operator, Auchan, represent the second
tier, well ahead in sales terms of German hard
discounter Lidl. But while Auchan has lost mar-
ket share, Lidl and Eroski (thanks largely to the
Caprabo acquisition) are making good inroads
(Euromonitor, 2008).
We gathered consumer information by retailer
related to perceptions of key factors as previously
defined- price, store brand quality, service, assor-
tment, promotion, advertising and innovation
ratings; we also asked for consumers overall
satisfaction level.
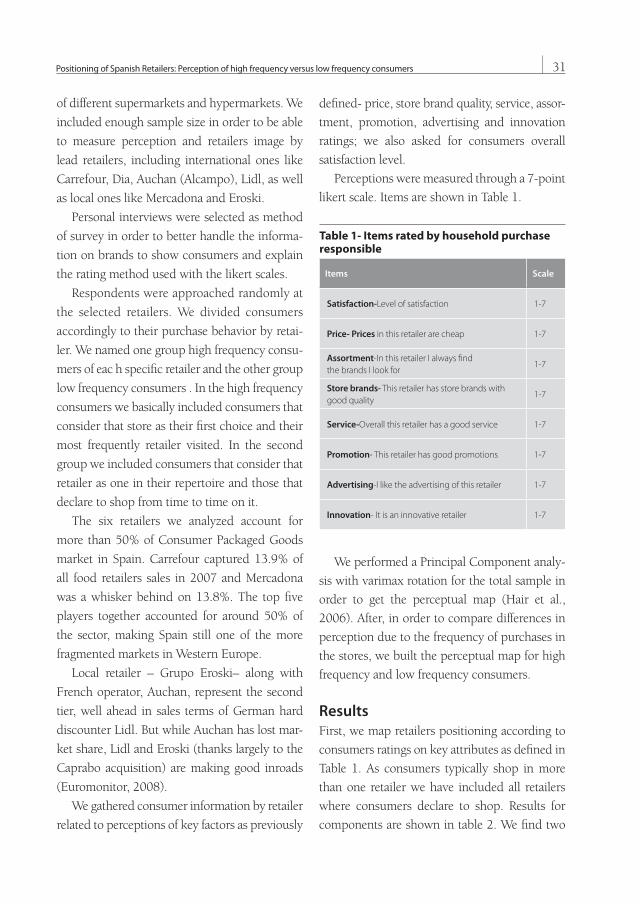
Perceptions were measured through a 7-point
likert scale. Items are shown in Table 1.
Table 1- Items rated by household purchase responsible
Items Scale
Satisfaction-Level of satisfaction 1-7
Price- Prices in this retailer are cheap 1-7
Assortment-In this retailer I always find the brands I look for
1-7
Store brands- This retailer has store brands with good quality
1-7
Service-Overall this retailer has a good service 1-7
Promotion- This retailer has good promotions 1-7
Advertising-I like the advertising of this retailer 1-7
Innovation- It is an innovative retailer 1-7
We performed a Principal Component analy-
sis with varimax rotation for the total sample in
order to get the perceptual map (Hair et al.,
2006). After, in order to compare differences in
perception due to the frequency of purchases in
the stores, we built the perceptual map for high
frequency and low frequency consumers.
ResultsFirst, we map retailers positioning according to
consumers ratings on key attributes as defined in
Table 1. As consumers typically shop in more
than one retailer we have included all retailers
where consumers declare to shop. Results for
components are shown in table 2. We find two
aDResearchESIC32 Segundo semestre, julio-diciembre 2010
factors that explain 83% of the variance in the
sample.
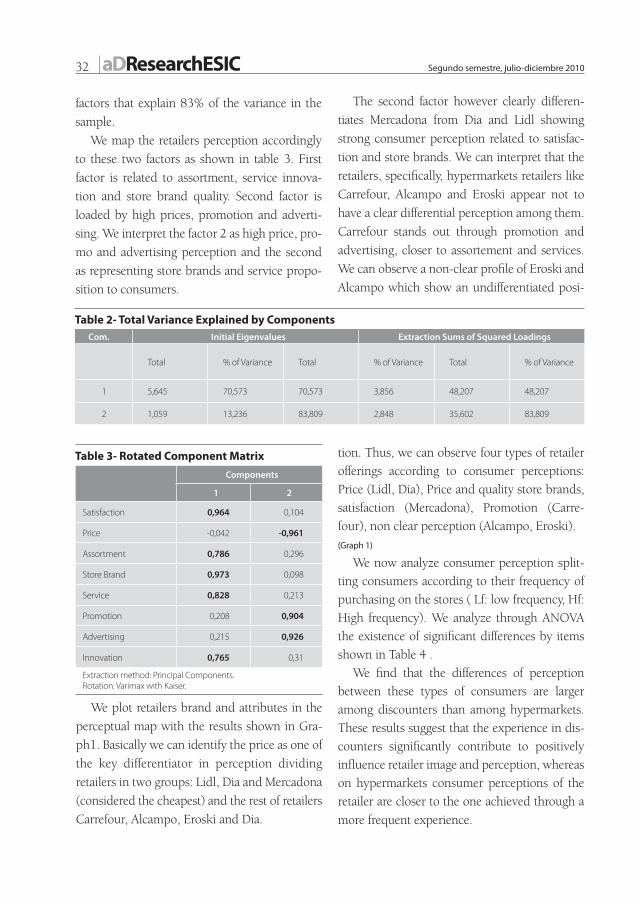
We map the retailers perception accordingly
to these two factors as shown in table 3. First
factor is related to assortment, service innova-
tion and store brand quality. Second factor is
loaded by high prices, promotion and adverti-
sing. We interpret the factor 2 as high price, pro-
mo and advertising perception and the second
as representing store brands and service propo-
sition to consumers.
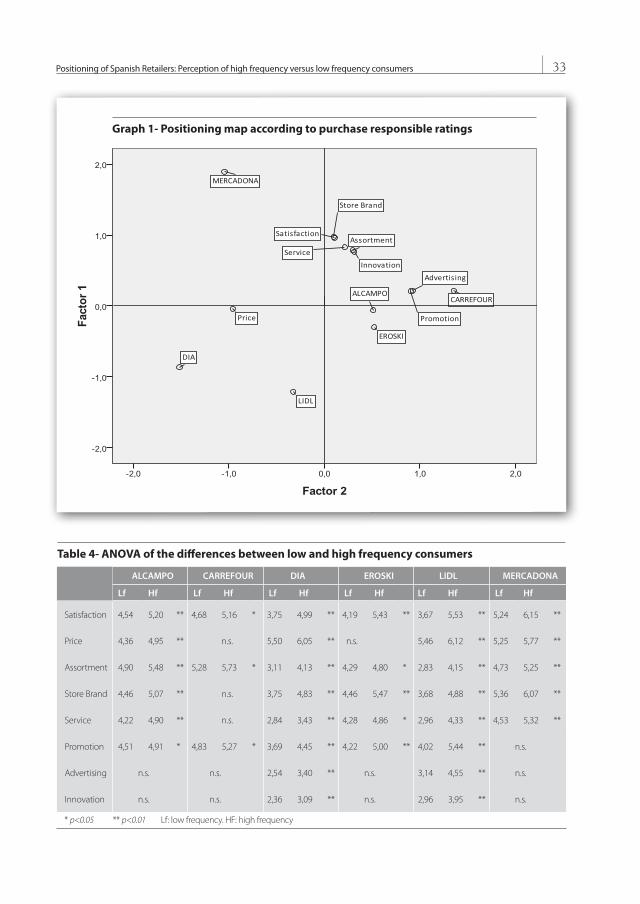
The second factor however clearly differen-
tiates Mercadona from Dia and Lidl showing
strong consumer perception related to satisfac-
tion and store brands. We can interpret that the
retailers, specifically, hypermarkets retailers like
Carrefour, Alcampo and Eroski appear not to
have a clear differential perception among them.
Carrefour stands out through promotion and
advertising, closer to assortement and services.
We can observe a non-clear profile of Eroski and
Alcampo which show an undifferentiated posi-
tion. Thus, we can observe four types of retailer
offerings according to consumer perceptions:
Price (Lidl, Dia), Price and quality store brands,
satisfaction (Mercadona), Promotion (Carre-
four), non clear perception (Alcampo, Eroski).
(Graph 1)
We now analyze consumer perception split-
ting consumers according to their frequency of
purchasing on the stores ( Lf: low frequency, Hf:
High frequency). We analyze through ANOVA
the existence of significant differences by items
shown in Table 4 .
We find that the differences of perception
between these types of consumers are larger
among discounters than among hypermarkets.
These results suggest that the experience in dis-
counters significantly contribute to positively
influence retailer image and perception, whereas
on hypermarkets consumer perceptions of the
retailer are closer to the one achieved through a
more frequent experience.
Table 2- Total Variance Explained by Components Com. Initial Eigenvalues Extraction Sums of Squared Loadings
Total % of Variance Total % of Variance Total % of Variance
1 5,645 70,573 70,573 3,856 48,207 48,207
2 1,059 13,236 83,809 2,848 35,602 83,809
Table 3- Rotated Component Matrix
Components
1 2
Satisfaction 0,964 0,104
Price -0,042 -0,961
Assortment 0,786 0,296
Store Brand 0,973 0,098
Service 0,828 0,213
Promotion 0,208 0,904
Advertising 0,215 0,926
Innovation 0,765 0,31
Extraction method: Principal Components. Rotation: Varimax with Kaiser.
We plot retailers brand and attributes in the
perceptual map with the results shown in Gra-
ph1. Basically we can identify the price as one of
the key differentiator in perception dividing
retailers in two groups: Lidl, Dia and Mercadona
(considered the cheapest) and the rest of retailers
Carrefour, Alcampo, Eroski and Dia.
33Positioning of Spanish Retailers: Perception of high frequency versus low frequency consumers
Graph 1- Positioning map according to purchase responsible ratings
Table 4- ANOVA of the differences between low and high frequency consumers
ALCAMPO CARREFOUR DIA EROSKI LIDL MERCADONA
Lf Hf Lf Hf Lf Hf Lf Hf Lf Hf Lf Hf
Satisfaction 4,54 5,20 ** 4,68 5,16 * 3,75 4,99 ** 4,19 5,43 ** 3,67 5,53 ** 5,24 6,15 **
Price 4,36 4,95 ** n.s. 5,50 6,05 ** n.s. 5,46 6,12 ** 5,25 5,77 **
Assortment 4,90 5,48 ** 5,28 5,73 * 3,11 4,13 ** 4,29 4,80 * 2,83 4,15 ** 4,73 5,25 **
Store Brand 4,46 5,07 ** n.s. 3,75 4,83 ** 4,46 5,47 ** 3,68 4,88 ** 5,36 6,07 **
Service 4,22 4,90 ** n.s. 2,84 3,43 ** 4,28 4,86 * 2,96 4,33 ** 4,53 5,32 **
Promotion 4,51 4,91 * 4,83 5,27 * 3,69 4,45 ** 4,22 5,00 ** 4,02 5,44 ** n.s.
Advertising n.s. n.s. 2,54 3,40 ** n.s. 3,14 4,55 ** n.s.
Innovation n.s. n.s. 2,36 3,09 ** n.s. 2,96 3,95 ** n.s.
* p<0.05 ** p<0.01 Lf: low frequency. HF: high frequency

aDResearchESIC34 Segundo semestre, julio-diciembre 2010
It is important to mention that in discoun-
ters, eventhough almost all the scores of the
items are quite low (except for price), the fact
of being a frequent buyer helps strengthen the
image of the retailer brand, increasing the sco-
res of all the items at a significant level.
On the other hand we can see that, as ex-
pected, advertising does not change as a con-
sequence of the experience of buying, but in
the case of discounters, it does as the percep-
tion of frequent vs. not frequent buyers is sig-
nificant.
It stands out the perception of Mercadona
as taking the “best out of both worlds” dis-
counters and hypermarkets and also showing
significant differences on the items (while both
high) between frequent and non frequent con-
sumers.
When going deeply on analyzing the per-
ceptions of frequent consumers we find a bet-
ter explanatory perceptual map with a third
factor emerging as shown in Table 5.
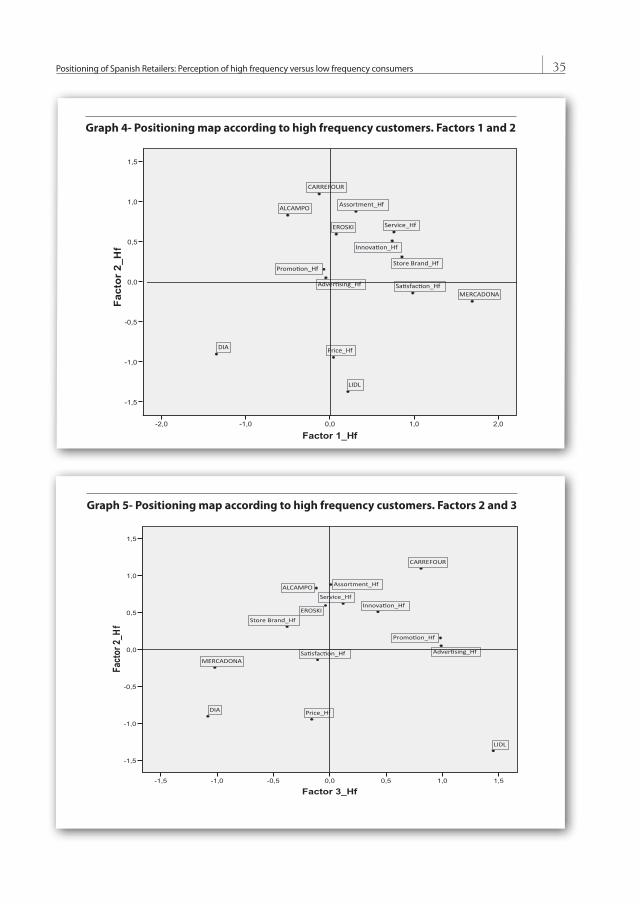
With the same method and criteria we have
mapped the attributes rated and plot the retai-
lers under these factors. The results are showed
below in Table 6 and Graph 3. Due to the diffi-
culty to visualize the three dimensions we have
plot and extended the map on graphs 4, 5 and
6 mapping factors 1 and 2, factors 2 and 3 and
factors 1 and 3 in three different maps.
The experience with the shop reflects a split
up of factor 2 within high frequency shoppers.
In this case, the customer seems to realize the
need to choose among price and assortment.
Discounters who offer best prices do not offer
wide assortments and it emerge the role of store
brands and satisfaction as a key factor for con-
sumer perception and retail image. (Graph 4)
Table 5 - Total Variance Explained by Components
Component
Initial Eigenvalues Extraction Sums of Squared Loadings
Total % of Variance Total % of Variance Total % acumulado
1 3,937 49,216 49,216 2,931 36,640 36,640
2 2,538 31,731 80,947 2,444 30,547 67,187
3 1,224 15,304 96,252 2,325 29,065 96,252
Extraction method: Principal components
Table 6- Rotated Component Matrix
Components
1 2 3
Satisfaction_Hf ,984 -,141 -,108
Price_Hf ,042 -,944 -,161
Assortment_Hf ,308 ,877 ,008
Store Brand_Hf ,856 ,308 -,379
Service_Hf ,761 ,620 ,119
Promotion_Hf -,074 ,155 ,983
Advertising_Hf -,049 ,048 ,990
Innovation_Hf ,740 ,508 ,428
Extraction method: Principal components Rotation method: Varimax with Kaiser
35Positioning of Spanish Retailers: Perception of high frequency versus low frequency consumers
Factor 1_Hf2,01,00,0-1,0-2,0
Facto
r 2_H
f
1,5
1,0
0,5
0,0
-0,5
-1,0
-1,5
Service_Hf
Store Brand_Hf
Assortment_Hf
Price_Hf
MERCADONA
LIDL
EROSKI
DIA
CARREFOUR
ALCAMPO
Graph 4- Positioning map according to high frequency customers. Factors 1 and 2
Factor 3_Hf1,51,00,50,0-0,5-1,0-1,5
Fact
or 2
_Hf
1,5
1,0
0,5
0,0
-0,5
-1,0
-1,5
Service_Hf
Store Brand_Hf
Assortment_Hf
Price_Hf
MERCADONA
LIDL
EROSKI
DIA
CARREFOUR
ALCAMPO
Graph 5- Positioning map according to high frequency customers. Factors 2 and 3
aDResearchESIC36 Segundo semestre, julio-diciembre 2010
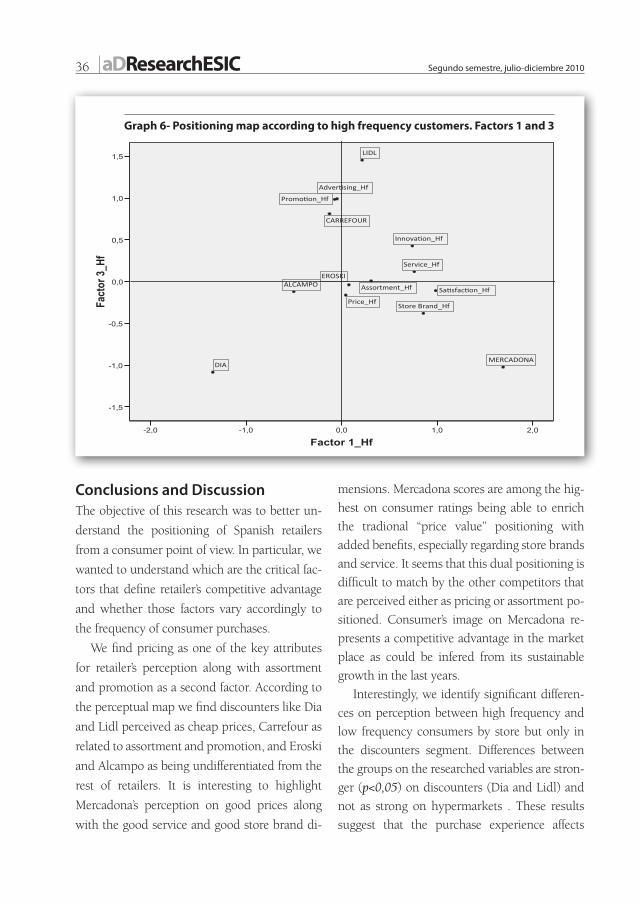
Conclusions and DiscussionThe objective of this research was to better un-
derstand the positioning of Spanish retailers
from a consumer point of view. In particular, we
wanted to understand which are the critical fac-
tors that define retailer’s competitive advantage
and whether those factors vary accordingly to
the frequency of consumer purchases.
We find pricing as one of the key attributes
for retailer’s perception along with assortment
and promotion as a second factor. According to
the perceptual map we find discounters like Dia
and Lidl perceived as cheap prices, Carrefour as
related to assortment and promotion, and Eroski
and Alcampo as being undifferentiated from the
rest of retailers. It is interesting to highlight
Mercadona’s perception on good prices along
with the good service and good store brand di-
mensions. Mercadona scores are among the hig-
hest on consumer ratings being able to enrich
the tradional “price value” positioning with
added benefits, especially regarding store brands
and service. It seems that this dual positioning is
difficult to match by the other competitors that
are perceived either as pricing or assortment po-
sitioned. Consumer’s image on Mercadona re-
presents a competitive advantage in the market
place as could be infered from its sustainable
growth in the last years.
Interestingly, we identify significant differen-
ces on perception between high frequency and
low frequency consumers by store but only in
the discounters segment. Differences between
the groups on the researched variables are stron-
ger (p<0,05) on discounters (Dia and Lidl) and
not as strong on hypermarkets . These results
suggest that the purchase experience affects
Factor 1_Hf2,01,00,0-1,0-2,0
Fact
or 3
_Hf
1,5
1,0
0,5
0,0
-0,5
-1,0
-1,5
Service_Hf
Store Brand_Hf
Assortment_Hf
Price_Hf
MERCADONA
LIDL
EROSKI
DIA
CARREFOUR
ALCAMPO
Graph 6- Positioning map according to high frequency customers. Factors 1 and 3
37Positioning of Spanish Retailers: Perception of high frequency versus low frequency consumers
more heavily discounters than the rest of the re-
tailers. Reason why could be related to the poor
image consumers have in general on discounters
in comparison with the rest of retailers, and
thus, there are more opportunities to improve it
through point of sale experience. Discounters
are rated the lowest in all scores (except for pri-
ce), however frequent buyers have highers sco-
res for all the items at a significant level, proba-
bly due to purchase experience.
Another reason for the low scores of discoun-
ters could be the polarizing effect of offering
“just price” as the only consumer proposition.
Price is very well valued by consumers interes-
ted on pricing but is not enough relevant “stand
alone” for the rest of the consumers. It is interes-
ting to mention that as expected, advertising
does not change as a consequence of the expe-
rience of shopping but in the case of discoun-
ters, it does, as the advertising perception of fre-
quent vs. not frequent buyers is significant. This
difference is possibly due to the fact that most of
the advertising on discounters is related to price
and thus will be more relevant and noticeable
for consumers that actually shop on them than
for those not interested on price.
On the contrary we find that the perception
of hypermarkets is more balanced and similar
between frequent and non frequent consumers.
The implications of these results for discoun-
ters are several. First, it seems that discounters
should enhance their value proposition to con-
sumers beyond price to attract new consumers.
By doing so, the experience in the shop will im-
prove in turn their retail image. Recent changes
on discounters strategies seem to endorse this
recommendation. It is the case of Lidl and its
recent initiative to launch a gourmet private la-
bel line “Deluxe” endorsed by famous chef Sergi
Arola. This initiative aims to enhance Lidl value
proposition beyond price.
Dia has also tried to enrich their consumer
proposition redecorating their stores and laun-
ching Dia- Market stores to broaden their consu-
mer offer.
For hypermarkets our results show the low
effect that their strategies to communicate “best
price “ have had on their image, and thus, the
necessity to create and reinvent a differentiated
space beyond Mercadona offer.
We doubt on the effectiveness of recent poli-
ces to imitate “Mercadona” proposition. On the
contrary, we believe hypermarkets should be
able to build an enhanced and distinctive consu-
mer proposition based on a broader meaning of
“value” to consumers.
In this sense it seems that retailers positioning
in Spain is heavily influenced by Mercadona po-
sitioning which has been able to combine a cre-
dible positioning delivering pricing as well as
service and innovation through their store
brands.
Different assortment, including private label
tier strategy, will be from our perspective the
only gap that Mercadona could leave as a com-
petitive advantage to their current competitors,
especially to hypermarkets as they will be able to
combine their assortment perception with a va-
lue proposition.
Limitations and further researchThis study is not exempt of limitations. First, we
are measuring only the top six retailers in Spain
that despite representing a significant share of
the market, beyond 50%, are not representing
regional chains. Secondly we are measuring de-
clared consumer behavior and this measure-
ment could differ from real purchase behavior;
aDResearchESIC38 Segundo semestre, julio-diciembre 2010
and third, we are not considering perceptions of
other types of purchase influencers apart from
the purchase responsible.
Opportunities for further research could take
into consideration the above limitations and en-
hance the scope of the study to include regional
chains. We believe that tracking the retailers po-
sitioning in a consumer panel can also shed light
on the effectiveness of retailers recent actions to
reposition their brand and how different marke-
ting activities influence consumers perception of
the retailers.
References
Abril, C., Avello, M. y Gavilan, D. (2009). Positioning
Analysis and Consumer Typologies of Spanish Store Brand
Consumers International Academy of Management and
Business, Istanbul, Oct, 2009.
Abril, C., Gavilan, D. y Avello, M. (2009). Influence of the
perception of different types of store brands on consumer
typologies and satisfaction levels. Innovative Marketing, 5(4),
75-82.
Ailawadi, K. L. and Keller, K. L. (2004). Understanding
retail branding: Conceptual insights and research priorities.
Journal of Retailing, 80(4), 331-342.
Ailawadi, K. L., Pauwels, K., Steenkamp, J. E. M. (2008).
Private-label use and store loyalty. Journal of Marketing, 72
(3), 19-30.
Alan, D., Jain, A. and Richardson, P. (1995). Correlates
of store brand proneness: Some empirical observations.
Journal of Product and Brand Management, 4(4), 15-27.
Amirani, S. and Gates, R. (1993). An attribute-anchored
conjoint approach to measuring store image. International
Journal of Retail and Distribution Management, 21(5), 30-39.
Baltas, G. (1999). Understanding and managing store
brands. Journal of Brand Management, 16(3), 175-187.
Birtwistle, G. and Shearer, L. (2001). Consumer perception
of five UK fashion retailers. Journal of Fashion Marketing and
Management, 5(1), 9-18.
Blankson, Ch., Kalafatis, S. P, Cheng, J. M. and
Hadjicharalambous, C. (2008). Impact of positioning
strategies on corporate performance. Journal of Advertising
Research, 48(1), 106-122.
Brakus, J. J., Schmitt, B. H., and Zarantonello, L. (2009).
Brand experience: What is it? How is it measured? Does it
affect loyalty? Journal of Marketing, 73(3), 52-68.
Brooksbank, R. (1994). The anatomy of marketing posi-
tioning strategy. Marketing Intelligence and Planning, 12(4),
10-15.
Burt, S. (2000). The strategic Role of Retail Brands in British
Grocery Retailing. European Journal of Marketing, 34(8) 875-
890.
Chen, C.M., Shan-Yu Chou and Lu Hsiao (2009). Private
labels and new product development. Marketing Letters
(20), 227-243.
Choi, S. C. and Coughlan, A. T. (2006). Private label
positioning: Quality versus feature differentiation from the
national brand, Journal of Retailing, 82(2), 79-93.
Corstjen, M. and Doyle, P. (1989). Evaluating alternative
retail repositining strategies. Marketing Science, 8(2), 170-180.
Dibb, S., Simkin, L., Pride, W., Ferrell, O.C. (1997).
Marketing: Concepts and Strategies, Houghton Mifflin,
Boston, MA.
Gursoy, D., Chen, M. and Kim, H.M. (2005). The US
airlines relative positioning based on attributes of service
quality. Tourism Management, 26, 57-67.
Hair, J.F., Black, W.C., Babin, B.J., Anderson, R.E., Tatham,
R.L. (2006). Multivariate Data Analysis, 6th ed., Prentice-
Hall, Englewood Cliffs, NJ.
Herman, A. and Huber, F. ( 2000 ). Value-oriented brand
positioning. International Revenue of Retail, Distribution and
Consumer Research, 10(1), 95-112.
Ipsos Mori. (2006). Star power: The growing influence of
store brands in the US.
Jin Yoo, S. and Jae Chang, Y. (2005). An Exploratory
Research on the Store Image Attributes Affecting Its Store
Loyalty. Seoul Journal of Business, 11(1), 19-41.

39Positioning of Spanish Retailers: Perception of high frequency versus low frequency consumers
Juhl, H. J., Esbjerg, L., Grunert, K. G., Bech-Larsen, T. and
Brunso, K. (2006). The fight between store brands and
national brands. What’s the score? Journal of Retailing and
Consumer Services, 13(5), 331-33.
Knuston, B.J. (2000). College students and fast food: How
students perceive restaurant brands. The Cornell Hotel and
Restaurant Administration Quarterly, 41(3), 68-74.
Kumar, N. and Steenkamp, J. E. M. (2007). Private label
strategy: How to meet the store brand challenge (hardcover).
Lattin, J. M., and Bucklin, R. E. (1989). Reference effects of
price and promotion on brand choice behavior. Journal of
Marketing Research, 26(3), 299-310.
Lovelock, C., & Wright, L. (2001). Principles of service
marketing and management (2nd ed.). Upper Saddle
River, NJ: Prentice-Hall.
Mendez J.l., Oubiña, J. Rubio, N. (2008). Expert quality
evaluation and price of store vs. manufacturer Brands: An
analysis of the Spanish mass market. Journal of Retailing and
Consumer Services, 15, 144-155.
Millan, E. S., Howard, E. (2007). Shopping for pleasure?
Shopping experiences of Hungarian consumers. International
Journal of Retail y Distribution Management, 36(6), 474-487.
Morton, F., Zettelmeyer, F. (2004). The strategic positioning
of store brands in retailer-manufacture negotiations. Review
of Industrial Organization, 24, 161-194.
Newman, A.J. and Patel, D. (2004). The marketing
directions of two fashion retailers. European Journal of
Marketing, 38(7), 770-789.
Nielsen AC (2007). The power of private label 2005 — A
review of growth trends around the world ’, www.acnielsen.
se/site/documents/The Power of Private Label 2005_A4.pdf
(accessed 30th nov 2009).
PLMA (2009). Private label manufacturing association.
http://www.plmainternational.com/en/private_label_en3.
htm latest retrieved 30th nov 2009.
Sayman, S., Hoch, S., and Raju, J. (2002). Positioning of
Store Brands. Marketing Science, 21(4), 378-397.
Schmitt, B.H. (1999). Experiential Marketing. New York,
Free Press.
Tarnowsky, J. (2007). Thinking like a brand. Progressive
Grocer, 86(15), 16-22.
Turley, L.W. and Chebat, J.C. (2002). Linking retail setrategy,
atmospheric design and shopping behaviour. Journal of
Markteing Management, 18, 125-44.
Walters, D. and Laffy, D. (1996). Managing retailing
Productivity and Profitability. Macmillan, London.
Yoo, B., Donthu, N. and Lee, S. (2000). An examination of
selected marketing mix elements and brand equity. Journal
of the Academy of Marketing Science, 28(2), 195-211.