portfolio visualization and prioritization for business...
TRANSCRIPT

Portfolio Visualization and Prioritization For Business Agility - Workshop
It’s the People not the Tool

This is a workshop and we want to reserve the time for your work.
Use the Law of Two Feet.
Agenda
• About Us
• A quick view of some Visual Management Systems (Printed copies are at your table)
• Working session (You will Build a VMS)
• Workshop readout
Bob Payne
@AgileToolkit
About Us
George Dinwiddie
@gdinwiddie

The Ball Game

Workers Need Direct Access to Information
http://imgproc.airlt/photos/airliners/7/8/9/1190987.jpg?v=v40

h"p://www.ny*mes.com/interac*ve/2011/05/18/business/delta-northwest-merger-graphic.html
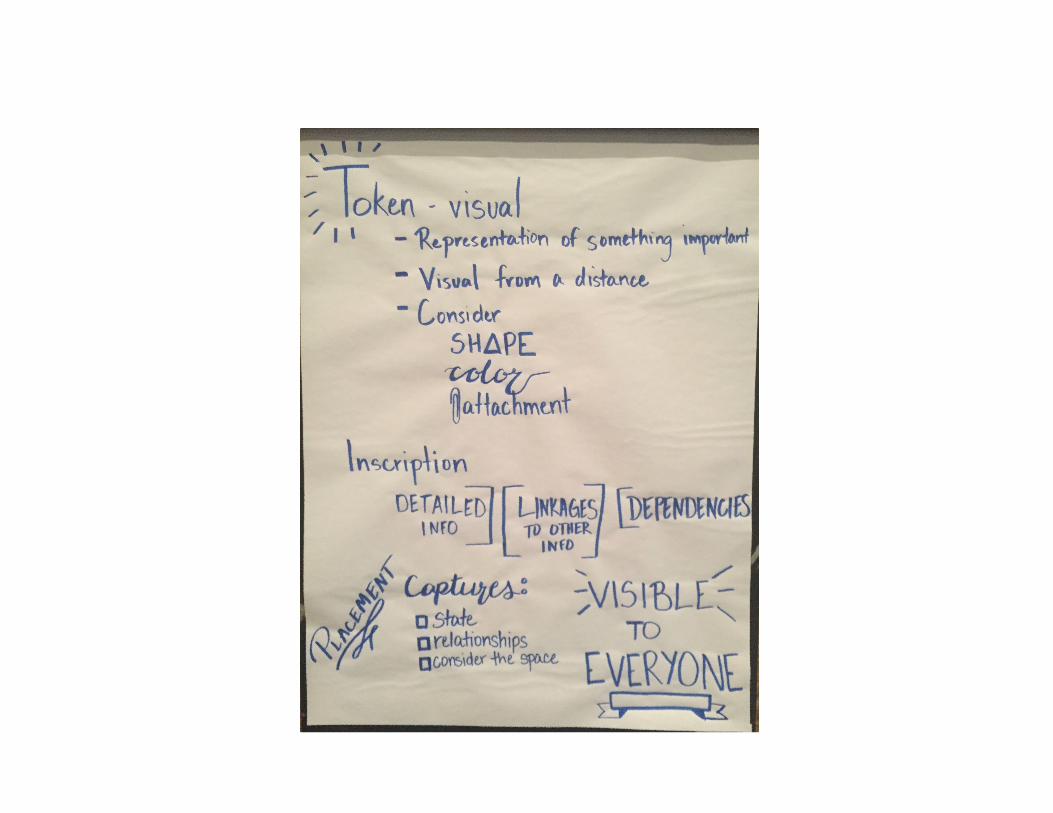
An Established & Proven Pattern

T.I.P. Token – Visual Representation of Something that is Important, Visible from a Distance
Inscription – What is written or represented on those tokens, Greater Detail
Placement – How the tokes relate to each other or to the whole, Create the Space that has Information

Team Level

Backlog Refinement

Nursery

Preschool

Nearly Ready
Stories being researched and prepared for the upcoming iterations.
Three Amigos discussions happen here.
Also, technical and process improvements that have been identified and can be worked when product work is blocked or done.

Nearly Ready
ß Stories being researched and prepared for the upcoming iterations
Three Amigos discussions happen here à

Current Iteration
You may find that 3 columns Ready - In Process - Done
Is sufficient

Product Discovery Ideas Prioritized To Do Doing Done

Another way of showing the current iteration
Tasks on yellow stickies
Box on sticky filled in to indicate how far along the work has been done
Red card for blocker
Stories at the top

Conversations at the Wall

Multiple Release Burn-Up
A lot of information in a clear format

Niko-Niko Calendar

Cumulative Flow Diagram

Progress
List of other activities competing
for attention

Outcomes, Key Performance Indicators
0 2 4 6 8
10 12 14 16 18
9 10 11 12 13 14 15 16 17 18 19 20 21 Week number
Conversions (1000s) Customer Service Calls

New Team Members
Program Level

Visualize Project Traffic
Use visual boards to track projects Note where projects are in the process And how long they have been there If projects are not flowing through to done regularly then you probably have a system problem (not a team problem!)
Each card is a project
Q: Do you have too many efforts going on?

Whittling It Down We asked one team to write down all of the current efforts underway
12 simultaneous projects for a 10-person team!
Senior managers weren’t aware that this team was spending time on all of these items
Score the efforts on several factors:
T-Shirt Size (S,M,L)
Biz Value ($, $$, $$$) Agreed to put all focus on smaller efforts of high business value first and deprioritize everything else

Portfolio Alignment Wall

Release Plan

Release Plan / Story Map

Visualize Team Metrics and Health
Use visual boards to track Metrics Note where projects are in the process Encourage “RED” Teams live in an Environment not in Isolation Resolve problems quickly
Q: Do you have too many efforts going on?

Visualize Management Work
Use visual boards to track Management Work Teams know where the support is coming from Managers concentrate on Valuable work
Q: Do you have too many efforts going on?

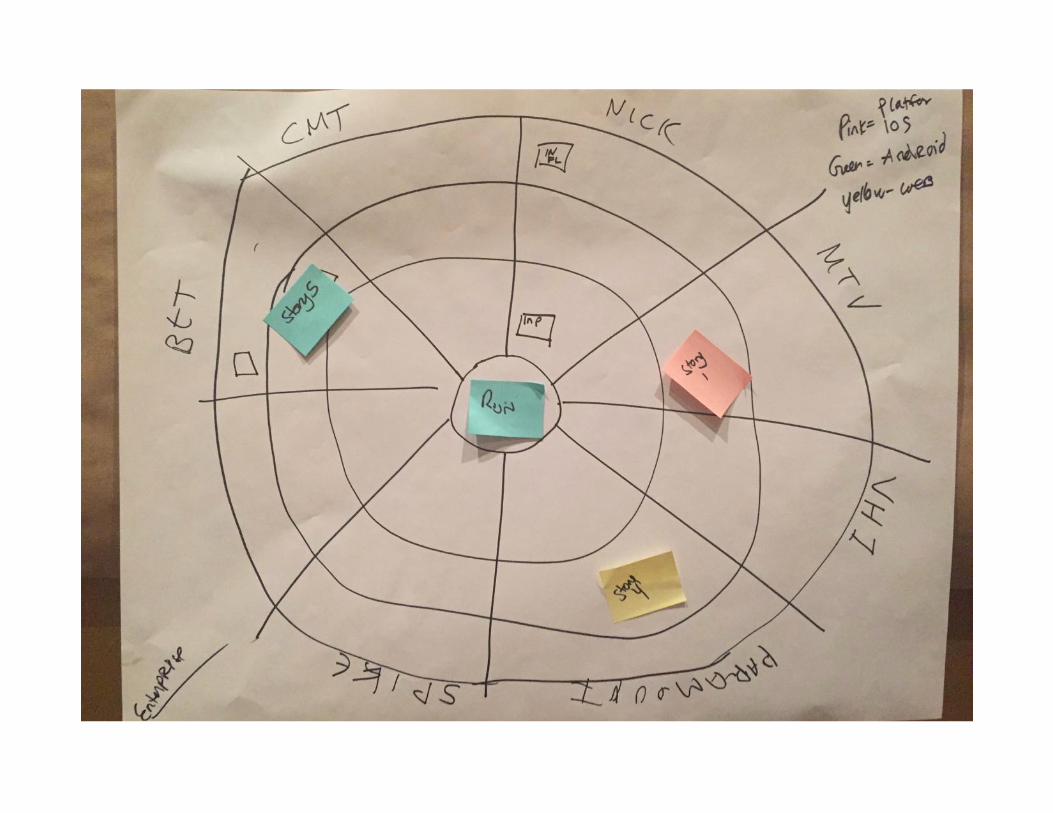
Enterprise Level

• Each sector is a different business area
• Concentric circles represent time
• Managers put their approximate project timing needs on the board
• The center circles represent what’s going on right now
• Use it to drive hard discussions
• If you keep saying ‘Yes’ to everything, you have a work-intake problem, not a PM problem!
Work Intake “We have 12 more efforts scheduled to start next month” But we aren’t finished with what is going on right now What are we going to do?

Go to the Gemba


Visualize Releases
Use visual boards to track Releases Allows for rapid replanning Teams can spot dependencies
Q: Do you have too many efforts going on?

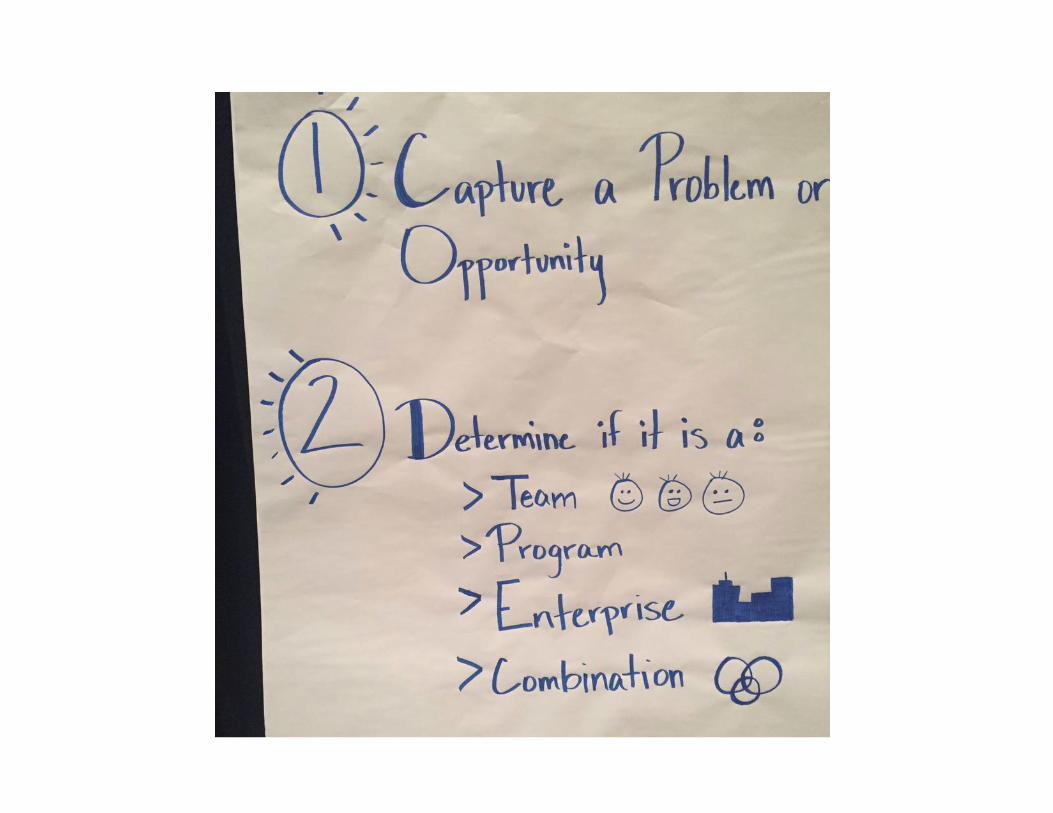
Workshop
• Pick a problem to work on for your table and Write It Down
• Does the data need to be managed/seen at Team, Portfolio, Enterprise Level
• Prototype a VMS to represent the data (Several if you wish)
• Brainstorm the people processes around the VMS
• Post your Results on the Big Wall

Bob Payne • Change Agent
• Experience: 25 years industry, 17+ years of Agile/Lean
• Specialties: Agile, Lean, Innovation
• Practitioner, consultant, trainer, author, speaker and community organizer
• AgileDC is October 16th this year!
@AgileToolkit
Q&A
George Dinwiddie • Coach and Trusted Advisor
• All levels, Code to Executive
• Experience: 35+ years industry, 17 years of Agile/Lean
• Focused on Effective Software Development, Collaboration
@gdinwiddie

Links to Resources
Live Stream of the Talk https://www.pscp.tv/w/1ZkKzOlAEQZGv
Making the Case for Visualization https://hbr.org/2016/06/visualizations-that-really-work
Information Visualization for Agile Software Development http://ieeexplore.ieee.org/abstract/document/6980227/?reload=true
Managing trade-offs between conflicting goals through a portfolio visualization process http://archives.datapages.com/data/bulletns/2008/10oct/BLTN08068/BLTN08068.htm?doi=10.1306%2F06040808068
https://www.comindware.com/blog/thought-leadership/what-is-visual-workflow-management-and-how-can-it-help-your-business/
Tips on How to Start
http://txm.com.au/blog/five-tips-designing-effective-team-visual-management-board
https://www.comindware.com/blog/thought-leadership/how-workflow-simulation-can-benefit-your-business/
http://www.leankor.com/what-departments-can-use-kanban-boards/

Workshop Results