portfolio analysis and cash flows - wordpress.com · assist in portfolio planning ... into the...
TRANSCRIPT

Portfolio Analysis and Cash Flows
Introduction
Portfolio means invest in more than one assets (securities and/or other assets)
Portfolio selection is the periodic activity involved in selecting a portfolio of projects which meet an organization’s stated objectives without exceeding the available resources or violating other constraints (Ghasemzadeh & Archer, 2000)
A corporate body can consider its SBU as part of a portfolio of business
SBU can consider its projects as a portfolio of investments

Active vs Passive Management (1)
Active
Trying to secure better than average performance
Must balance returns and costs
Passive
Trying to get average returns rather than do better than the market
Mix of Passive and Active

Active vs Passive Management
Active Management
Finding undervalued securities
Timing the market
Passive Management
No attempt to find undervalued securities
No attempt to time
Holding an efficient portfolio
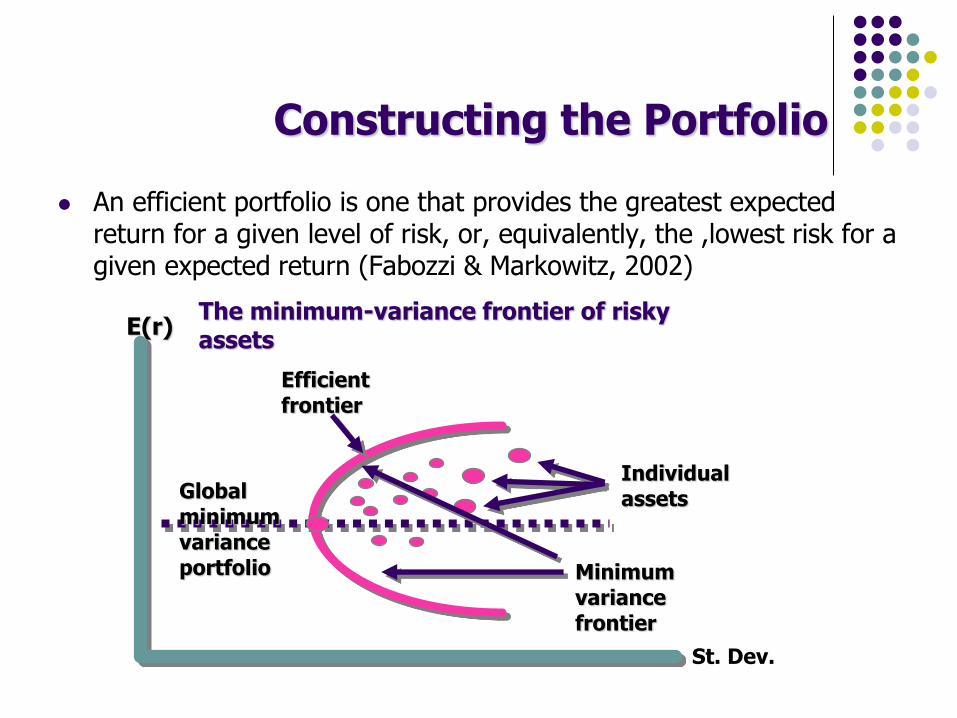
Constructing the Portfolio
An efficient portfolio is one that provides the greatest expected return for a given level of risk, or, equivalently, the ,lowest risk for a given expected return (Fabozzi & Markowitz, 2002)
E(r) The minimum-variance frontier of risky assets
Efficient frontier
Global minimum variance portfolio Minimum
variance frontier
Individual assets
St. Dev.
s
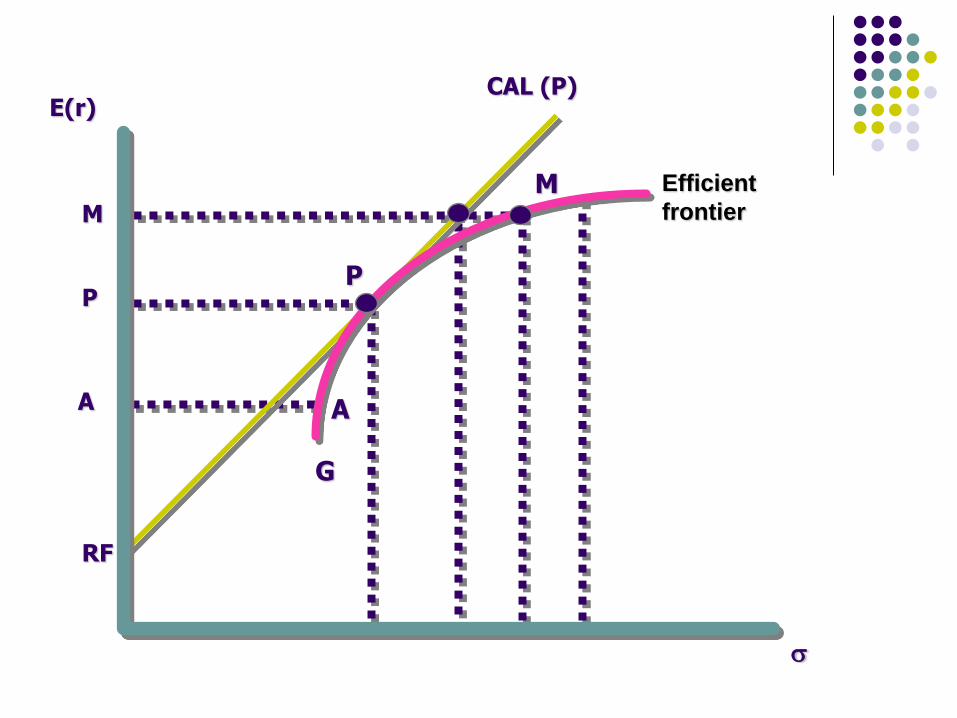
E(r) CAL (P)
M
P
A
RF
A
G
P
M Efficient
frontier

Risk of Portfolio
Number of stocks in portfolio
Risk
Total Risk
Unique risk
Market risk/systematic risk

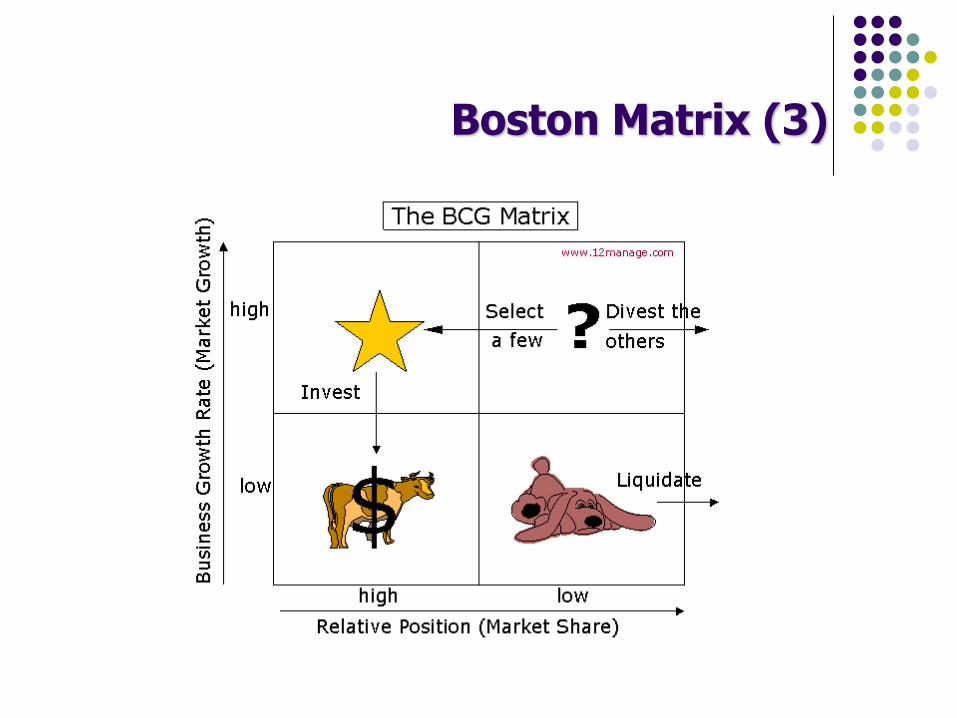
Boston Matrix (1)
The Boston matrix is a management tool developed to assist in portfolio planning
It has two controlling aspects:
Market share (meaning relative to the competition)
The rate of market growth
Each individual product or project in a portfolio is placed into the matrix to determine relative market share

Boston Matrix (2)
The BCG Matrix method is the most well-known portfolio management tool. It is based on product life cycle theory. It was developed in the early 70s by
the Boston Consulting Group. The BCG Matrix can be used to determine what priorities should be given in the product portfolio of a business unit. To
ensure long-term value creation, a company should have a portfolio of products that contains both high-growth products in need of cash inputs and low growth
products that generate a lot of cash. The Boston Consulting Group Matrix has 2 dimensions: market share and market growth. The basic idea
behind it is: if a product has a bigger market share, or if the product's market grows faster, it is better for the company
Boston Matrix (3)

Boston Matrix (4)
Stars (high growth, high market share) Stars are using large amounts of cash. Stars are leaders in the
business. Therefore they should also generate large amounts of cash.
Stars are frequently roughly in balance on net cash flow. However if needed any attempt should be made to hold your market share in Stars, because the rewards will be Cash Cows if market share is kept.
Cash Cows (low growth, high market share) Profits and cash generation should be high. Because of the low
growth, investments which are needed should be low.
Cash Cows are often the stars of yesterday and they are the foundation of a company.
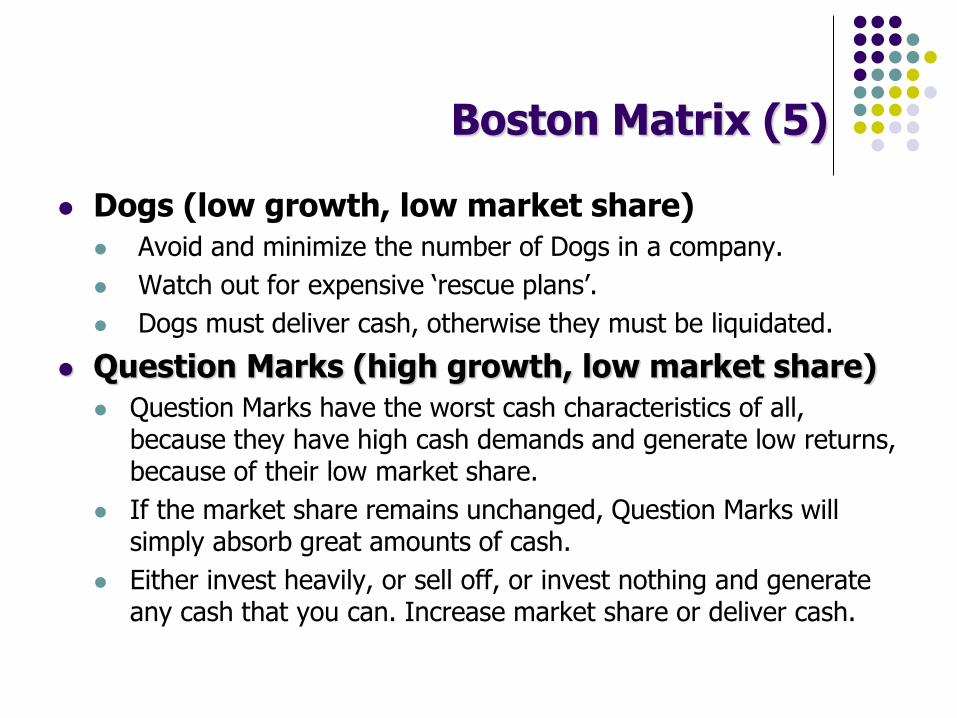
Boston Matrix (5)
Dogs (low growth, low market share)
Avoid and minimize the number of Dogs in a company.
Watch out for expensive ‘rescue plans’.
Dogs must deliver cash, otherwise they must be liquidated.
Question Marks (high growth, low market share)
Question Marks have the worst cash characteristics of all, because they have high cash demands and generate low returns, because of their low market share.
If the market share remains unchanged, Question Marks will simply absorb great amounts of cash.
Either invest heavily, or sell off, or invest nothing and generate any cash that you can. Increase market share or deliver cash.

Boston Matrix (6)
Benefits: If a company is able to use the experience curve to its
advantage, it should be able to manufacture and sell new products at a price that is low enough to get early market share leadership. Once it becomes a star, it is destined to be profitable.
BCG model is helpful for managers to evaluate balance in the firm’s current portfolio of Stars, Cash Cows, Question Marks and Dogs.
BCG method is applicable to large companies that seek volume and experience effects.
The model is simple and easy to understand. It provides a base for management to decide and prepare
for future actions.

Boston Matrix (7)
Limitations: It neglects the effects of synergy between business units. High market share is not the only success factor. Market growth is not the only indicator for attractiveness of a
market. Sometimes Dogs can earn even more cash as Cash Cows. The problems of getting data on the market share and market
growth. There is no clear definition of what constitutes a "market". A high market share does not necessarily lead to profitability all the
time. The model uses only two dimensions – market share and growth
rate. This may tempt management to emphasize a particular product, or to divest prematurely.
A business with a low market share can be profitable too. The model neglects small competitors that have fast growing market
shares.

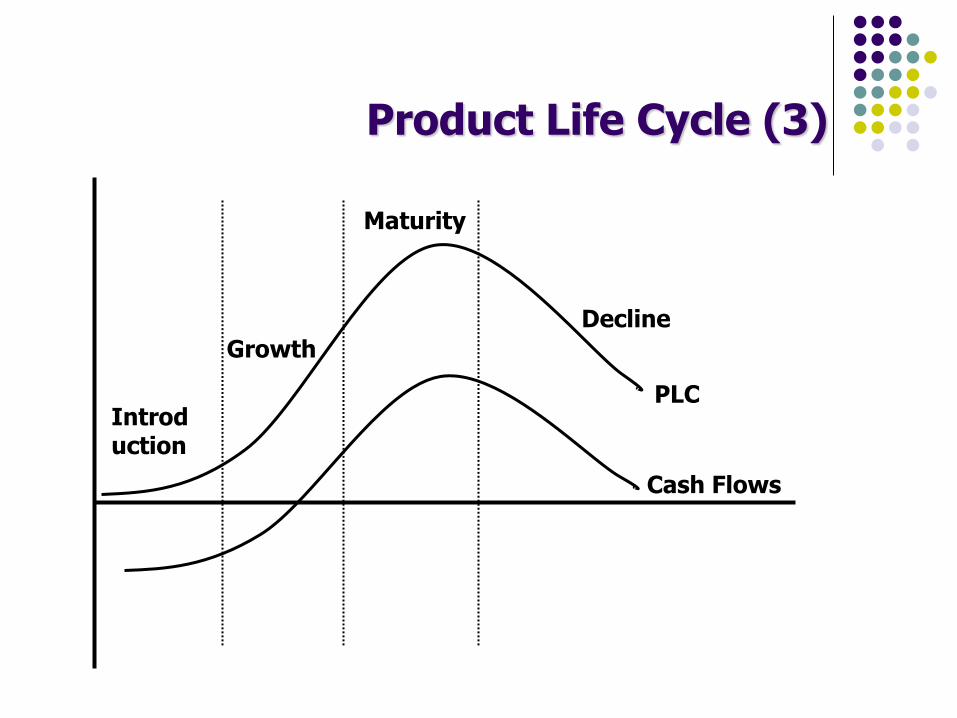
Product Life Cycle (1)
The Product Life Cycle model can help to analyze maturity stages of products and industries
The term was used for the first time by Theodore Levitt in 1965 in an Harvard Business Review article: "Exploit the Product Life Cycle" (Vol 43, November-December 1965, pp 81-94).
Any company is constantly seeking ways to grow future cash flows by maximizing revenue from the sale of products and services. Cash Flow allows a company to maintain its viability, invest in new product development and improve its workforce.
All this in an effort to acquire additional market share and become a leader in its respective industry.

Product Life Cycle (2)
Product Life Cycle (3)
PLC
Cash Flows
Introduction
Growth
Maturity
Decline

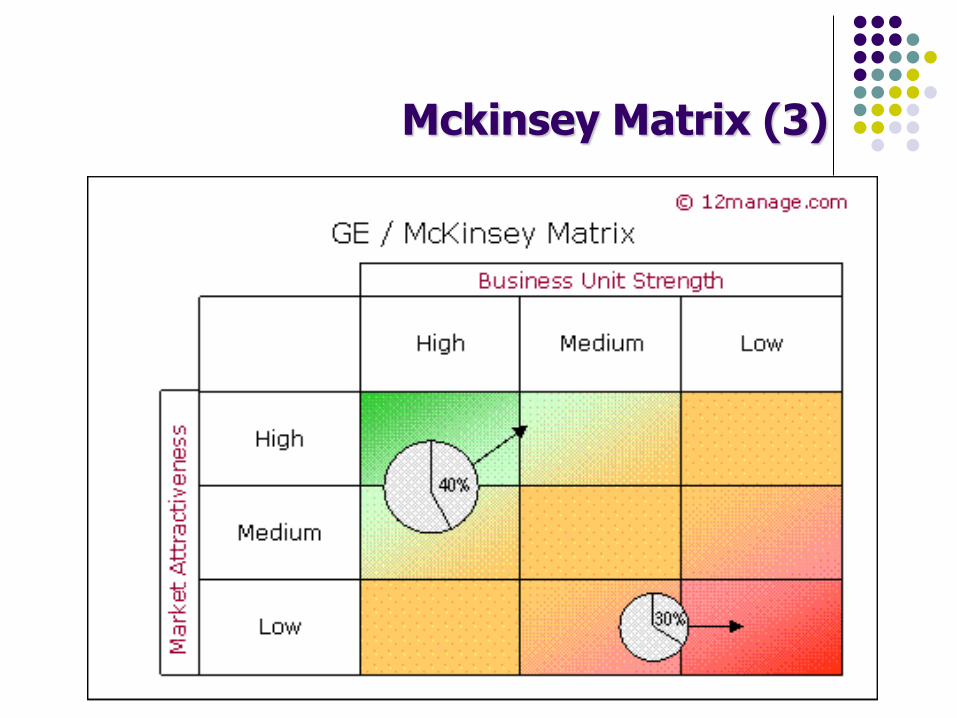
Mckinsey Matrix (1)
The McKinsey Matrix is a model to perform a business portfolio analysis on the Strategic Business Units of a corporation.
A business portfolio is the collection of Strategic Business Units (SBU) that together form a corporation. The optimal business portfolio is one that fits perfectly to the company's strengths and helps to exploit the most attractive industries or markets.
A Strategic Business Unit (SBU) can either be an entire medium size Company or a division of a large corporation. As long as it formulates its own business level strategy and has separate objectives from the parent company.

Mckinsey Matrix (2)
The Aim of Portfolio Analysis:
1. Analyze its current business portfolio and decide which SBU's should receive more or less investment
2. Develop growth strategies for adding new products and businesses to the portfolio
3. Decide which businesses or products should no longer be retained.
Mckinsey Matrix (3)
Scenario Analysis/Planning (1)
Scenario Planning is a model that can be used to explore and learn the future in which a corporate strategy is formed. It works by describing a small number of scenarios, by creating stories how the future may unfold, and how this may affect an issue that confronts the corporation.
Royal Dutch Shell, one of the first adopters, defines scenarios as follows: Scenarios are carefully crafted stories about the future embodying a wide variety of ideas and integrating them in a way that is communicable and useful. Scenarios help us to link uncertainties about the future to the decisions that we must make today.
Scenario analysis is a derivative of sensitivity analysis, which tests alternative scenario as options
Scenario Analysis/Planning (2)
The scenario planning method works by understanding the nature and impact of the most uncertain and important driving forces affecting the future.
It is a group process which encourages knowledge exchange and development of mutual deeper understanding of central issues that are important to the future of your business.
The goal is to create and craft a number of diverging stories by extrapolating uncertain and heavily influencing driving forces.
The stories, plus the processes to create them, have a dual aim: to increase the knowledge of the business environment and to widen both the receiver's and participant's perception of possible future events.
The method is most widely used as a strategic management tool, but it is also used for enabling group discussion about a common future.

Scenario Analysis/Planning (3)
Steps in Scenario Planning Process: 1. Identify people who will contribute a wide range of
perspectives. 2. Comprehensive interviews/workshop about how participants
see big shifts coming in society, economics, politics, technology, etc.
3. Group (cluster) these views into connected patterns. 4. Group draws a list of priorities (the best ideas). 5. Create rough pictures of the future, based on these priorities.
Stories and rough scenarios. 6. Add further detail to get impact scenarios. Determine in what
way each scenario will affect the corporation. 7. Identify early warning signals. Things that are indicative for a
particular scenario to unfold. 8. The scenarios are monitored, evaluated and reviewed
Diversification
Diversification is used to minimize the risk
Diversification is the key to the management of portfolio risk because it allows investors to lower portfolio risk significantly without adversely effecting return
Correlation is the glue that allows investors to aggregate returns on individual assets into a return for the portfolio. This is the process of identifying how the risks in the portfolio are related to each other
Correlation is a key concept in risk diversification
Correlation can range from -1 to +1
Portfolio Risk Management (1)
There are two reasons for adopting portfolio risk management:
1. Risks inherent in projects cannot be separated from the aspects of general business management
2. All projects are unique, therefore risk and uncertainty belong to a significant part of project business. Whether or not these risks are brought through to the portfolio is a different matter
Portfolio Risk Management (2)
Benefits:
1. Reduces the cost of capital by managing portfolio risk rather than individual project risks
2. Reduces the risk of projects from developing their own inertia and boundary definition
3. Increase the awareness of the critical risks by senior managers
4. Reduces project overrun and overspend
5. Identifies which risks exploit competitive advantages
6. Protects and enhances shareholder value

Efficient Diversification (1)
Two-Security Portfolio: Return
rp = W1r1 + W2r2 W1 = Proportion of funds in Security 1
W2 = Proportion of funds in Security 2
r1 = Expected return on Security 1
r2 = Expected return on Security 2
W i S i =1
n
= 1 n
S i =1
r p = x w i r i
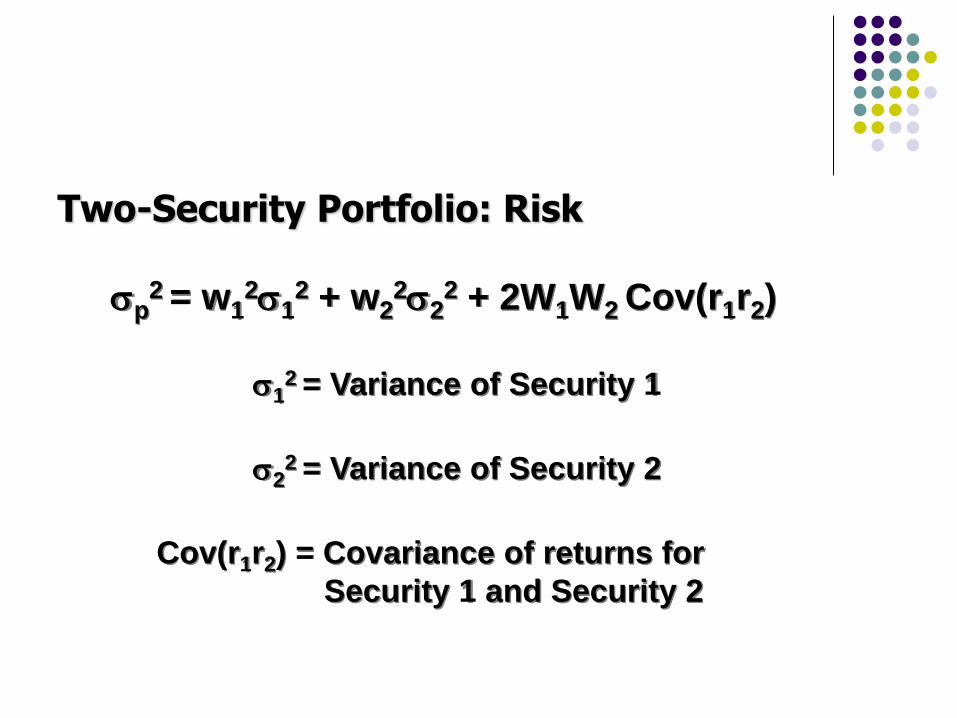
Two-Security Portfolio: Risk
sp2
= w12s1
2 + w22s2
2 + 2W1W2 Cov(r1r2)
s12 = Variance of Security 1
s22 = Variance of Security 2
Cov(r1r2) = Covariance of returns for
Security 1 and Security 2
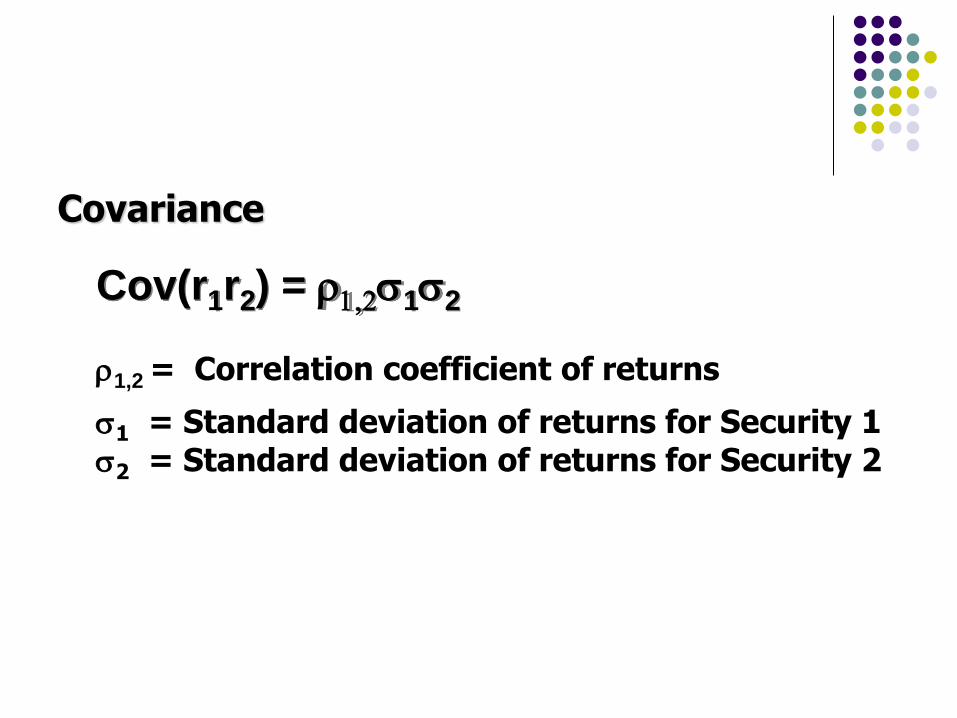
Covariance
Cov(r1r2) = r1,2s1s2
r1,2 = Correlation coefficient of returns
s1 = Standard deviation of returns for Security 1 s2 = Standard deviation of returns for Security 2