polunin funds - fundweblibrary.com · polunin funds - emerging markets small cap fund ... bradesco...
TRANSCRIPT
as at 31 December 2016
Database Publishing System: CO-Reporter® by CO-Link, Belgium.
Annual report including the audited financial statements
POLUNIN FUNDSSociété d'Investissement à Capital Variable
RCS Luxembourg B131.312
POLUNIN FUNDS
Table of Contents
Page 2
Page Management and Administration 3 Management Report 5 Report of the Réviseur d’Entreprises agréé 8 Consolidated Statement of Net Assets as at 31 December 2016 11 Statement of Operations and Changes in Net Assets from 1 January 2016 to 31 December 2016 12 POLUNIN FUNDS - Developing Countries Fund Statement of Net Assets as at 31 December 2016 14 Statement of Operations and Changes in Net Assets from 1 January 2016 to 31 December 2016 15 Changes in number of shares outstanding from 1 January 2016 to 31 December 2016 16 Key figures relating to the last 3 years 16 Securities portfolio as at 31 December 2016 17
Geographical breakdown 21 Economical breakdown 22 POLUNIN FUNDS - Emerging Markets Small Cap Fund Statement of Net Assets as at 31 December 2016 24 Statement of Operations and Changes in Net Assets from 1 January 2016 to 31 December 2016 25 Changes in number of shares outstanding from 1 January 2016 to 31 December 2016 26 Key figures relating to the last 3 years 26 Securities portfolio as at 31 December 2016 27
Geographical breakdown 31 Economical breakdown 32 Notes to the financial statements 33 Unaudited information 41 No subscription can be received on the basis of financial reports. Subscriptions are only valid if made on the basis of the current Prospectus and the Key Investor Information Document, accompanied by the latest available annual report of the fund and the latest semi-annual report if published after such annual report.

POLUNIN FUNDS
Management and Administration
Page 3
Registered Office 5, Allée Scheffer L-2520 Luxembourg Grand Duchy of Luxembourg
Chairman of the Board of Directors of the Fund
Members of the Board of Directors of the Fund
Franck A. Willaime * Certified Independent Director Michael Sanders * Managing Director Alceda Fund Management S.A. 5, Heienhaff L-1736 Senningerberg Grand Duchy of Luxembourg Julian Garel-Jones Director Polunin Capital Partners Limited London, United Kingdom Stefan Corthouts ** Independent Director Serge Dollendorf ** Senior Director Alceda Fund Management S.A. 5, Heienhaff L-1736 Senningerberg Grand Duchy of Luxembourg
Management Company Carne Global Fund Managers (Luxembourg) S.A. *** European Bank & Business Center 6B, route de Trèves L-2633 Senningerberg Grand Duchy of Luxembourg Alceda Fund Management S.A. *** 5, Heienhaff L-1736 Senningerberg Grand Duchy of Luxembourg
Members of the Board of Directors of the Management Company
John Alldis Director Carne Global Financial Services (Luxembourg) S.à r.l. European Bank & Business Center 6B, route de Trèves L-2633 Senningerberg Grand Duchy of Luxembourg
* Michael Sanders resigned from the Board of Directors of the Fund effective 13 October 2016. On the same day, Franck A. Willaime was appointed Chairman of the Board of Directors of the Fund. ** Serge Dollendorf resigned from the Board of Directors of the Fund effective 13 October 2016. On the same day, Stefan Corthouts was appointed member of the Board of Directors of the Fund.
*** Alceda Fund Management S.A. was formerly the Management Company of Polunin Funds until 13 October 2016. On the same day, Carne Global Fund Managers (Luxembourg) S.A. was appointed as Management Company of Polunin Funds.
POLUNIN FUNDS
Management and Administration (continued)
Page 4
Members of the Board of Directors of the Management Company (continued)
William Blackwell Principal Carne Financial Services (UK) LLP 107-111 Fleet Street London EC4A 2AB United Kingdom Veronica Buffoni **** Director Carne Global Financial Services (Switzerland) GmbH Industriestrasse 9 6300 Zug Switzerland Steve Bernat ***** Chief Executive Officer Carne Global Fund Managers (Luxembourg) S.A. European Bank & Business Center 6B, route de Trèves L-2633 Senningerberg Grand Duchy of Luxembourg
Investment Manager & Principle Distributor
Polunin Capital Partners Limited 10, Cavalry Square London, SW3 4RB United Kingdom
Investment Adviser Polunin Capital Partners Pte. Limited 80 Raffles Place #20-01 UOB Plaza 048624 Singapore
Administrative Agent, Domiciliary Agent, Registrar and Transfer Agent
CACEIS Bank Luxembourg 5, Allée Scheffer L-2520 Luxembourg Grand Duchy of Luxembourg
Depositary and Paying Agent
CACEIS Bank Luxembourg 5, Allée Scheffer L-2520 Luxembourg Grand Duchy of Luxembourg
Independent Auditor of the Fund
Deloitte Audit Société à responsabilité limitée Cabinet de Révision agréé 560, rue de Neudorf L-2220 Luxembourg Grand Duchy of Luxembourg
**** Veronica Buffoni resigned from the Board of Directors of the Fund effective 5 February 2016.
***** Steve Bernat was appointed member of the Board of Directors of the Fund effective 5 February 2016.
POLUNIN FUNDS
Management Report
The figures stated in the report are historical and not necessarily indicative of future performance. Page 5
Fund
POLUNIN FUNDS
Reporting Period 1 January 2016 until 31 December 2016
Introduction The Investment Objective of the Sub-Fund Developing Countries Fund is to outperform the MSCI EM Total Return (Net) Index in USD over rolling 5 year time periods. The Investment Objective for the Sub-Fund Emerging Markets Small Cap Fund is to outperform the MSCI EM Small Cap Index over rolling 5 year time periods. In truth, 2016 ended with a bit of whimper for emerging markets. By contrast, the MSCI World Equity Index made new highs at the end of the year, led by the S&P, the NASDAQ even the NIKKEI. Only the Euro area looked as weak as the Emerging Market indices as the year finished, weighed down by the uncertainties introduced by the British Brexit vote. Both sub-funds acquitted themselves very well in an extremely challenging year. The Developing Countries Fund’s NAV per share rose by 18.34% (Class A), compared with a rise of 11.19% for its benchmark. For the Emerging Markets Small Cap Fund the results were even better in relative terms, returning a net 12.18% (Class A) compared with a very small rise of just 0.27% for the benchmark. It was difficult making the bear case for emerging equities last year, and even harder to sustain it through the euphoric recovery experienced between late January and October 2016 (a 34% trough to peak rally). Now, however, the distinct feeling from interaction with other asset managers is that the consensus trade is the bearish one, and that raises concerns. The instinct is to remain bearish for longer on pure fundamental valuation grounds, but the weight of anecdotal evidence is building against that position.
Content In sharp contrast to 2015, it was the large cap stocks which performed best in 2016, driven by a surge of buying in ETFs and other index products. As Investment Manager, we have previously stated that we do not know when global monetary policy might start to normalise, and what event(s) might kick start the process. Now investors seem to be convinced that 2016, taken in aggregate, was the “event”. It is plain to see why a bearish stance has become the easy consensus. Few long term investors were sucked into the EM rally during 2016. In fact the evidence from market interactions is that asset allocators have been taking money off the table. Worse, and in contrast to the global trend of active managers losing assets to passive funds, emerging market investors do not appear to be swapping active for passive allocations. Rather they are reducing the emerging markets asset class after almost six and a half years of poor relative and absolute returns. “De-risking” is the word most often used.

POLUNIN FUNDS
Management Report (continued)
The figures stated in the report are historical and not necessarily indicative of future performance. Page 6
Content (continued) Performance Review – Countries Performance Review – Stocks
The end result of all the noise in 2016 is that markets appear to be back where they started. The total market value of emerging equities according to Datastream is up 12.2% (because of dilution the MSCI EM price index is only up 8.6% and including dividends it is +11.2%). The P/E has risen from 13.09 to 13.50 and the P/BV from 1.55 to 1.65. Perhaps more encouragingly, Enterprise Values have risen just 2.98%. This suggests that total debt has either risen more slowly than market capitalisation or it has actually fallen a little in USD terms, perhaps due to significant local currency appreciation. Looking at the EV to Replacement Cost ratio tracked by the Investment Manager, it appears that some industries that were already cheap on this metric have remained cheap, or in some cases have actually risen a bit (for example Steel and Mining). By contrast the expensive industries one year ago have mostly declined in valuation (mainly Consumer sectors such as Food, Media, Hotels etc). In summary it appears that Emerging Markets are getting a little cheaper overall, and that debt reduction has played a part. Unlike 2015, stock selection dominated the excess return calculation in 2016. Part of the reason was that the Fund’s stock picking worked especially well even in markets where it was incorrectly positioned. For example China, Turkey, South Africa. Allocation gains were centred on Russia, Pakistan, Mexico and India. Country positioning was least positive in Brazil, Turkey and Greece. The Russian utilities Federal Grid and Inter Rao were purchased in 2013 and 2014, respectively, during the currency weakness caused by the Crimea crisis. The performance has been partly currency revaluation and partly investors chasing high dividend yields. Metals producers KAZAKHMYS, Vale and Anglo American have essentially benefitted from higher prices, but recent currency strength has dented their appeal. China High Speed is a gearbox manufacturer for wind turbines which was subject to a takeover bid. Several big index stocks significantly outperformed, posing a noteworthy obstacle to the Sub-Fund which did not own them. Samsung, TSMC, Tencent and Brazilian banks Itau and Bradesco were good examples of the index buying that characterised the year. EMBRAER (aircraft manufacturer) in Brazil was heavily impacted by the rise in the BRL as it exports in USD but has local currency costs. CIECH a soda ash producer in Poland suffered from a severe bout of profit taking after being amongst our best investments in 2015.
POLUNIN FUNDS
Management Report (continued)
The figures stated in the report are historical and not necessarily indicative of future performance. Page 7
Performance Review – Sector (continued)
Stock selection within sectors was even stronger than selection within countries. The Utilities sector was the biggest contributor to overall alpha, with Russian utilities leading, followed by CEMIG (Brazil) and CHINA WATER AFFAIRS. Materials is a very diverse sector comprising Chemicals, Construction Materials, Pulp & Paper and Metals & Mining. The portfolio benefitted from being overweight these Industries and from stock selection within them. The Materials leaders were iron ore miner Vale in Brazil, Kazakh copper producer KAZ Minerals, NOVOLIPETSK STEEL in Russia and South African Anglo American. The portfolio was hurt by its exposure in the Financials sector. The Sub-Fund remained too underweight and the portfolio was punished, mainly because it did not own the largest and best performing index shares, Bradesco and Itau in Brazil. The IT sector exposure also detracted from portfolio returns. The overweight exposure served the Sub-Fund well but stock selection was badly affected by the lack of exposure to the top performing index stocks mentioned above. The Emerging Markets Small Cap Fund, being a much more stock specific portfolio, was driven primarily by stock selection gains in Pakistan, Russia, Peru and China. The Fund shared exposure in the Russian utilities with the all cap Developing Countries Fund, but retains a more extensive portfolio of smaller cap stocks in Pakistan such as MARI PETROLEUM which rose 95.5%, NATIONAL REFINERY (+162.8%) and SUI NORTHERN GAS (+237.7%). The Sub-Fund’s sole Peruvian exposure was in BUENAVENTURA with rose 143.2% and the Chinese companies were Hong Kong listed Texhong Textiles (+82.1%) and KINGBOARD LAMINATES (+141.3%).
Luxembourg, 8 February 2017
Deloitte Audit Société à responsabilité limitée 560, rue de Neudorf L-2220 Luxembourg B.P.1173 L-1011 Luxembourg Tel: +352 451 451 www.deloitte.lu
To the Shareholders of POLUNIN FUNDS Société d’Investissement à Capital Variable 5, Allée Scheffer L-2520 Luxembourg Grand Duchy of Luxembourg
Report of the Réviseur d’Entreprises agréé
Following our appointment by the Annual General Meeting of the Shareholders dated 29 April 2016, we have audited the accompanying financial statements of POLUNIN FUNDS (the “Fund”) and of each of its sub-funds, which comprise the Statements of Net Assets and the Securities portfolio as at 31 December 2016 and the Statements of Operations and Changes in Net Assets for the year then ended and a summary of significant accounting policies and other explanatory notes to the financial statements.
Responsibility of the Board of Directors of the Fund for the financial statements The Board of Directors of the Fund is responsible for the preparation and fair presentation of these financial statements in accordance with the Luxembourg legal and regulatory requirements relating to the preparation of the financial statements and for such internal control as the Board of Directors of the Fund determines is necessary to enable the preparation of financial statements that are free from material misstatement, whether due to fraud or error.
Responsibility of the Réviseur d’Entreprises agréé Our responsibility is to express an opinion on these financial statements based on our audit. We conducted our audit in accordance with International Standards on Auditing as adopted for Luxembourg by the Commission de Surveillance du Secteur Financier. Those standards require that we comply with ethical requirements and plan and perform the audit to obtain reasonable assurance whether the financial statements are free from material misstatement. An audit involves performing procedures to obtain audit evidence about the amounts and disclosures in the financial statements. The procedures selected depend on the Réviseur d’Entreprises agréé’s judgement, including the assessment of the risks of material misstatement of the financial statements, whether due to fraud or error. In making those risk assessments, the Réviseur d’Entreprises agréé considers internal control relevant to the entity’s preparation and fair presentation of the financial statements in order to design audit procedures that are appropriate in the circumstances, but not for the purpose of expressing an opinion on the effectiveness of the entity’s internal control. An audit also includes evaluating the appropriateness of accounting policies used and the reasonableness of accounting estimates made by the Board of Directors of the Fund, as well as evaluating the overall presentation of the financial statements. We believe that the audit evidence we have obtained is sufficient and appropriate to provide a basis for our audit opinion.
Société à responsabilité limitée au capital de 35.000 EUR RCS Luxembourg B 67.895 Autorisation d’établissement 10022179
Page 8
Deloitte.
Opinion
In our opinion, the financial statements give a true and fair view of the financial position of POL UN IN FUNDS and of each of its sub-funds as of31December2016 and of the results of their operations and changes in their net assets for the year then ended in accordance with Luxembourg legal and regulatory requirements relating to the preparation of the financial statements.
Other information
The Board of Directors of the Fund is responsible for the other information. The other information comprises the information included in the annual report but does not include the financial statements and our report of Reviseur d 'Entreprises agree thereon.
Our opinion on the financial statements does not cover the other information and we do not express any form of assurance conclusion thereon.
In connection with our audit of the financial statements, our responsibility is to read the other information and, in doing so, consider whether the other information is materially inconsistent with the financial statements or our knowledge obtained in the audit or otherwise appears to be materially misstated. If, based on the work we have performed, we conclude that there is a material misstatement of this other information, we are required to report this fact. We have nothing to report in this regard.
itte Audit, Cabinet de Revision agree
Luxembourg, 21 April 20 I 7
Societe a responsab1lite limitee au capital de 35.000 EUR RCS Luxembourg 8 67.895 Autonsation d'etablissement 10022179
Page 9
10Page
POLUNIN FUNDSConsolidated
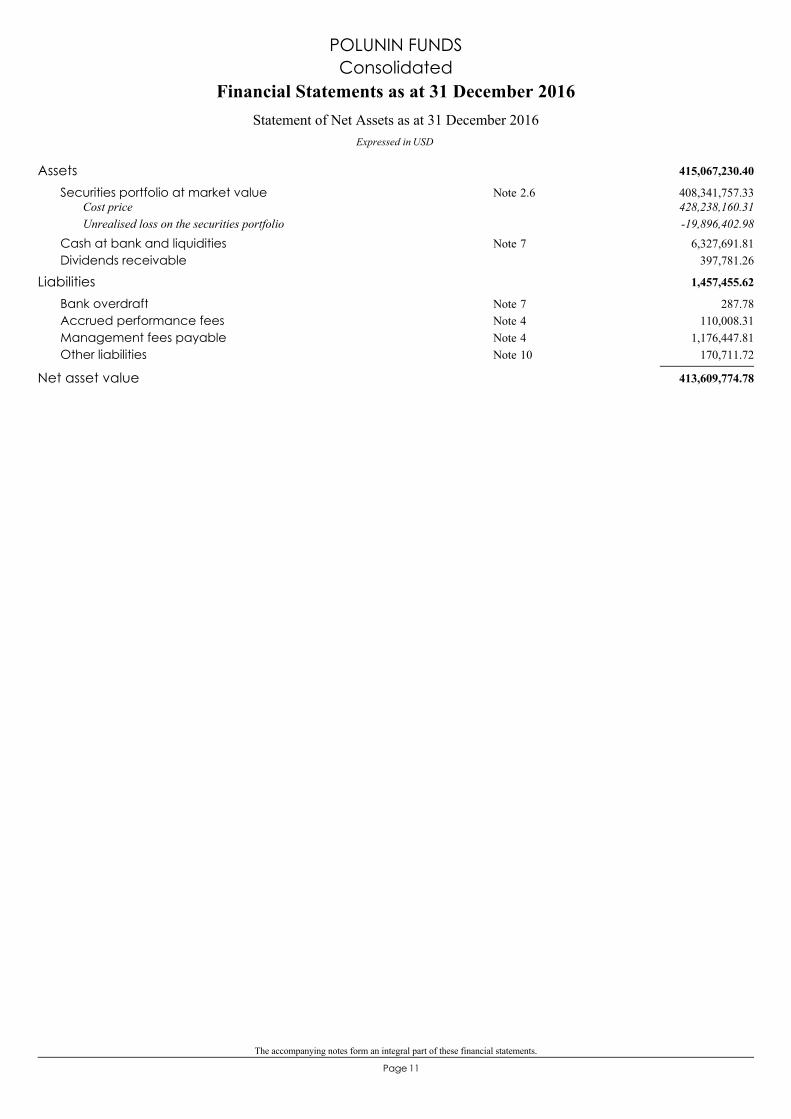
The accompanying notes form an integral part of these financial statements.
11Page
415,067,230.40Assets408,341,757.33Securities portfolio at market value 2.6Note428,238,160.31Cost price-19,896,402.98Unrealised loss on the securities portfolio
6,327,691.81Cash at bank and liquidities 7Note397,781.26Dividends receivable
1,457,455.62Liabilities287.78Bank overdraft 7Note
110,008.31Accrued performance fees 4Note1,176,447.81Management fees payable 4Note
170,711.72Other liabilities 10Note
413,609,774.78Net asset value
POLUNIN FUNDS
Financial Statements as at 31 December 2016
Expressed in USD
Statement of Net Assets as at 31 December 2016
Consolidated

The accompanying notes form an integral part of these financial statements.
12Page
12,563,623.72Income11,588,220.53Net dividends 2.9Note
194.12Bank interest on cash account975,209.07Other income 2.10Note
8,343,990.05Expenses332,756.10Management Company fees 5Note
4,622,172.23Management fees 4Note505,325.03Depositary fees & sub-custodian fees 6Note75,270.71Taxe d'abonnement 3Note
489,170.99Administrative Agent fees 6Note1,026,582.55Performance fees 4Note
16,577.96Domiciliation fees22,527.29Professional fees12,128.09Bank interest on overdrafts
110,992.74Legal fees960,984.81Transaction fees 2.12Note169,501.55Other expenses 11Note
4,219,633.67Net income from investments
Net realised profit / loss on:13,587,008.68- sales of securities portfolio 2.11Note
-10,340,960.77- foreign exchange 2.8Note
7,465,681.58Net realised profit
Movement in net unrealised appreciation / depreciation on:59,432,801.15- securities portfolio
66,898,482.73Increase in net assets as a result of operations
98,284,573.93Subscription capitalisation shares51,352,947.93Subscription distribution shares
-80,986,246.04Redemption capitalisation shares-100,186,713.20Redemption distribution shares
35,363,045.35Increase in net assets
378,246,729.43Net assets at the beginning of the year
413,609,774.78Net assets at the end of the year
USD
Statement of Operations and Changes in Net Assets from 1 January 2016 to 31 December 2016
POLUNIN FUNDSConsolidated
Expressed in

13Page
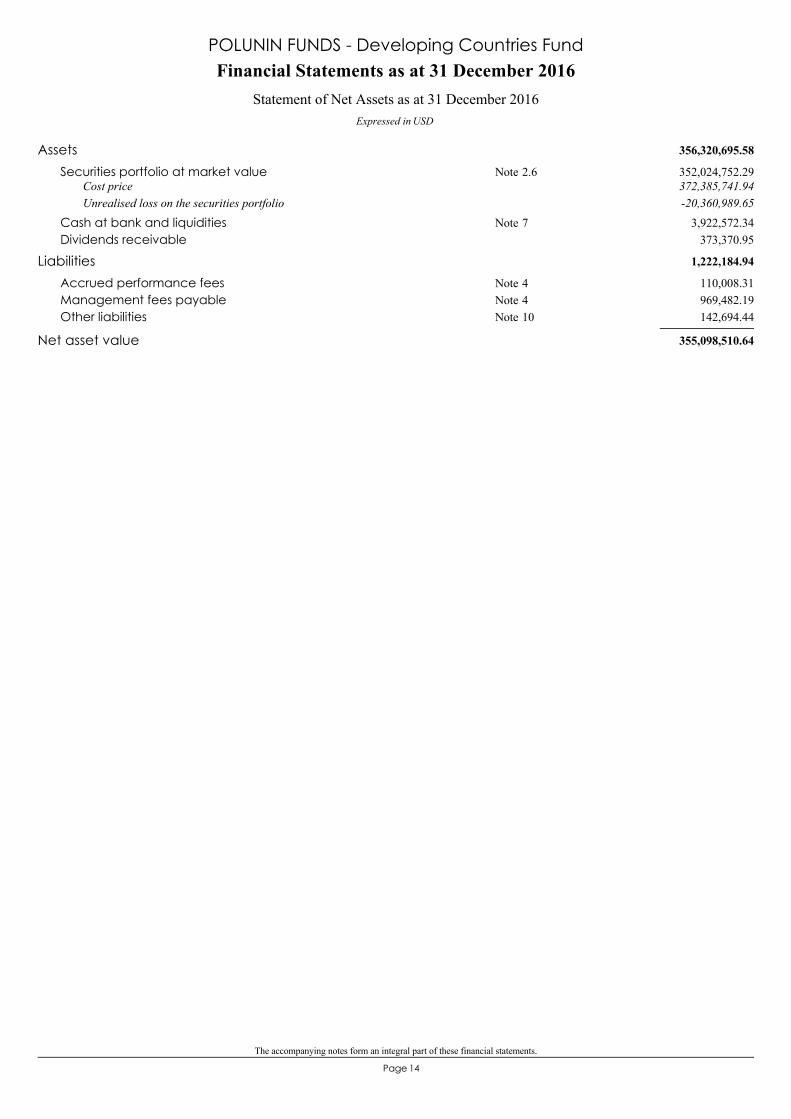
POLUNIN FUNDS- Developing Countries Fund
The accompanying notes form an integral part of these financial statements.
14Page
356,320,695.58Assets352,024,752.29Securities portfolio at market value 2.6Note372,385,741.94Cost price-20,360,989.65Unrealised loss on the securities portfolio
3,922,572.34Cash at bank and liquidities 7Note373,370.95Dividends receivable
1,222,184.94Liabilities110,008.31Accrued performance fees 4Note969,482.19Management fees payable 4Note142,694.44Other liabilities 10Note
355,098,510.64Net asset value
Financial Statements as at 31 December 2016
Expressed in USD
Statement of Net Assets as at 31 December 2016
POLUNIN FUNDS - Developing Countries Fund

The accompanying notes form an integral part of these financial statements.
15Page
Statement of Operations and Changes in Net Assets from 1 January 2016 to 31 December 2016Expressed in USD
POLUNIN FUNDS - Developing Countries Fund
11,113,277.50Income10,209,057.12Net dividends 2.9Note
91.80Bank interest on cash account904,128.58Other income 2.10Note
6,124,855.04Expenses270,703.39Management Company fees 5Note
3,814,462.00Management fees 4Note418,567.27Depositary fees & sub-custodian fees 6Note69,484.16Taxe d'abonnement 3Note
426,770.53Administrative Agent fees 6Note110,641.92Performance fees 4Note
9,951.99Domiciliation fees18,273.67Professional fees10,715.47Bank interest on overdrafts77,931.62Legal fees
799,617.13Transaction fees 2.12Note97,735.89Other expenses 11Note
4,988,422.46Net income from investmentsNet realised profit / loss on:
8,862,305.96- sales of securities portfolio 2.11Note-9,390,145.44- foreign exchange 2.8Note
4,460,582.98Net realised profitMovement in net unrealised appreciation / depreciation on:
55,643,602.43- securities portfolio
60,104,185.41Increase in net assets as a result of operations
72,803,765.32Class B10,522,955.87Class D14,957,852.74Class E
98,284,573.93Subscription capitalisation shares
51,352,947.93Class A51,352,947.93Subscription distribution shares
-5,042,899.33Class B-70,257,295.20Class C
-75,300,194.53Redemption capitalisation shares
-100,186,713.20Class A-100,186,713.20Redemption distribution shares
34,254,799.54Increase in net assets
320,843,711.10Net assets at the beginning of the year
355,098,510.64Net assets at the end of the year
The accompanying notes form an integral part of these financial statements.
16Page
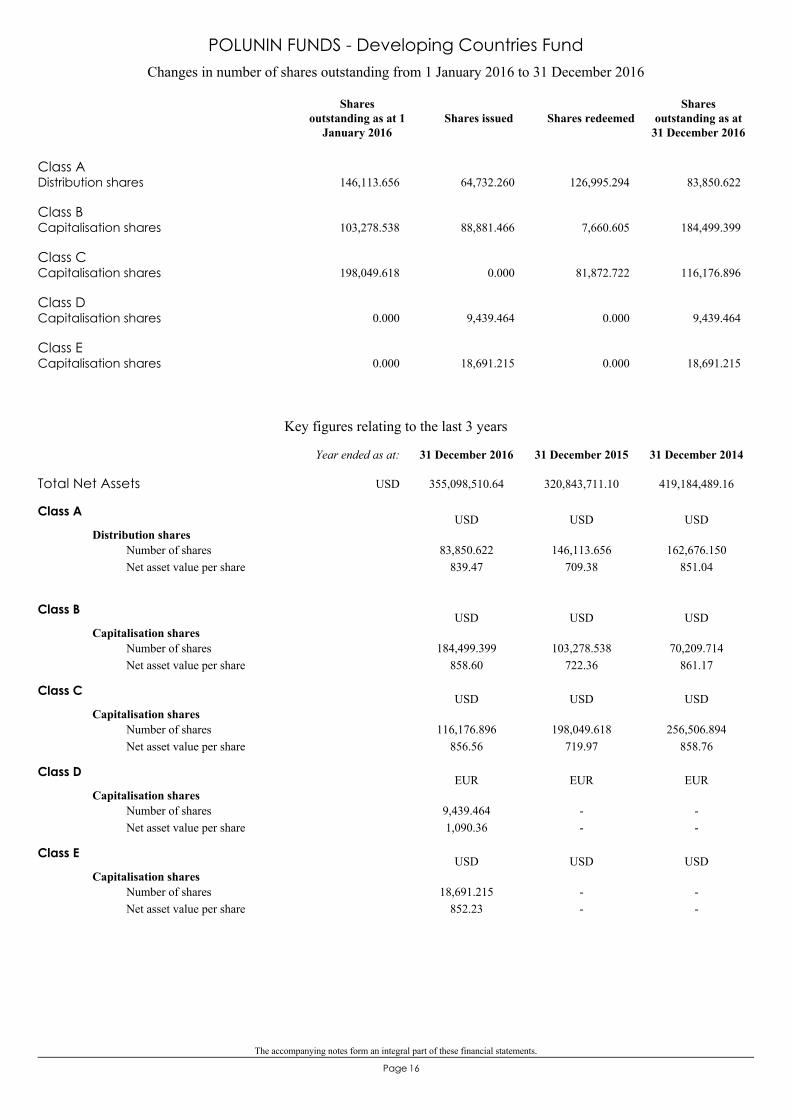
Class ADistribution shares 146,113.656 64,732.260 126,995.294 83,850.622
Class BCapitalisation shares 103,278.538 88,881.466 7,660.605 184,499.399
Class CCapitalisation shares 198,049.618 0.000 81,872.722 116,176.896
Class DCapitalisation shares 0.000 9,439.464 0.000 9,439.464
Class ECapitalisation shares 0.000 18,691.215 0.000 18,691.215
Changes in number of shares outstanding from 1 January 2016 to 31 December 2016
Shares issued Shares redeemedShares
outstanding as at31 December 2016
Sharesoutstanding as at 1
January 2016
POLUNIN FUNDS - Developing Countries Fund
Key figures relating to the last 3 years
Class A
Distribution shares
839.4783,850.622 146,113.656
709.38162,676.150
851.04Number of sharesNet asset value per share
USD USD USD
Class B
Capitalisation shares
858.60184,499.399 103,278.538
722.3670,209.714
861.17Number of sharesNet asset value per share
USD USD USD
Class C
Capitalisation shares
856.56116,176.896 198,049.618
719.97256,506.894
858.76Number of sharesNet asset value per share
USD USD USD
Class D
Capitalisation shares
1,090.369,439.464 -
---
Number of sharesNet asset value per share
EUR EUR EUR
Class E
Capitalisation shares
852.2318,691.215 -
---
Number of sharesNet asset value per share
USD USD USD
Total Net Assets 355,098,510.64 320,843,711.10 419,184,489.16
31 December 201431 December 201531 December 2016Year ended as at:
USD
The accompanying notes form an integral part of these financial statements.
17Page
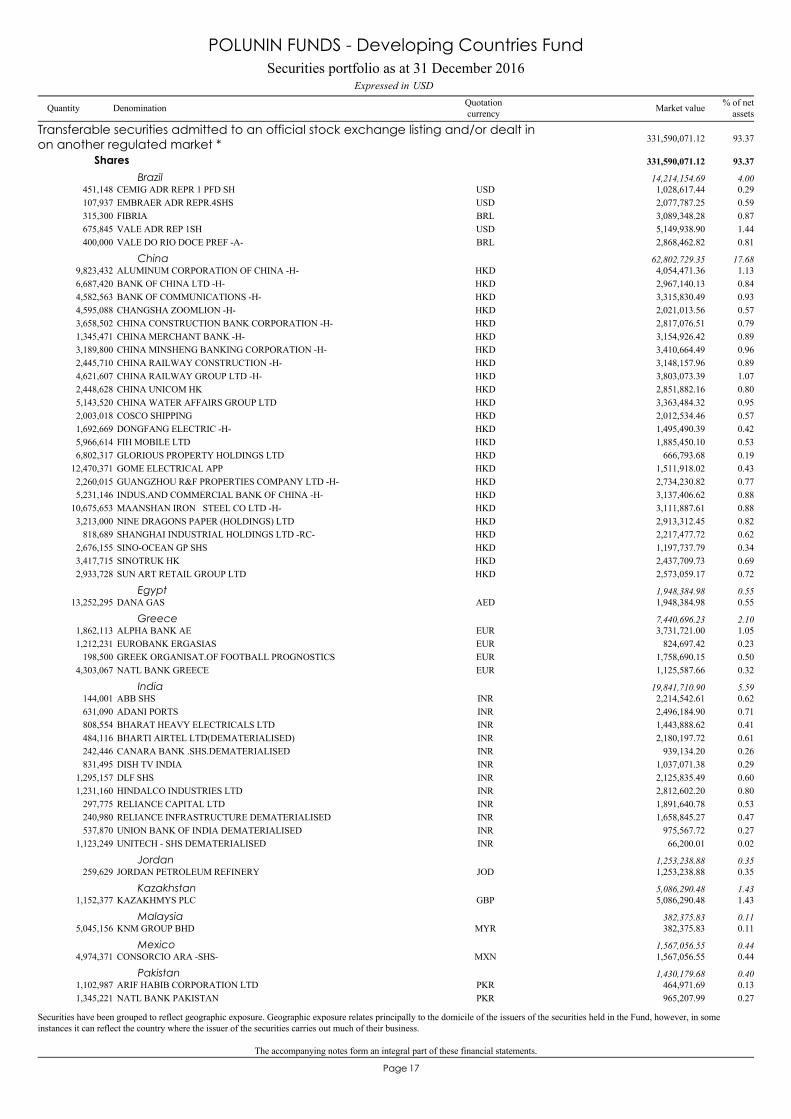
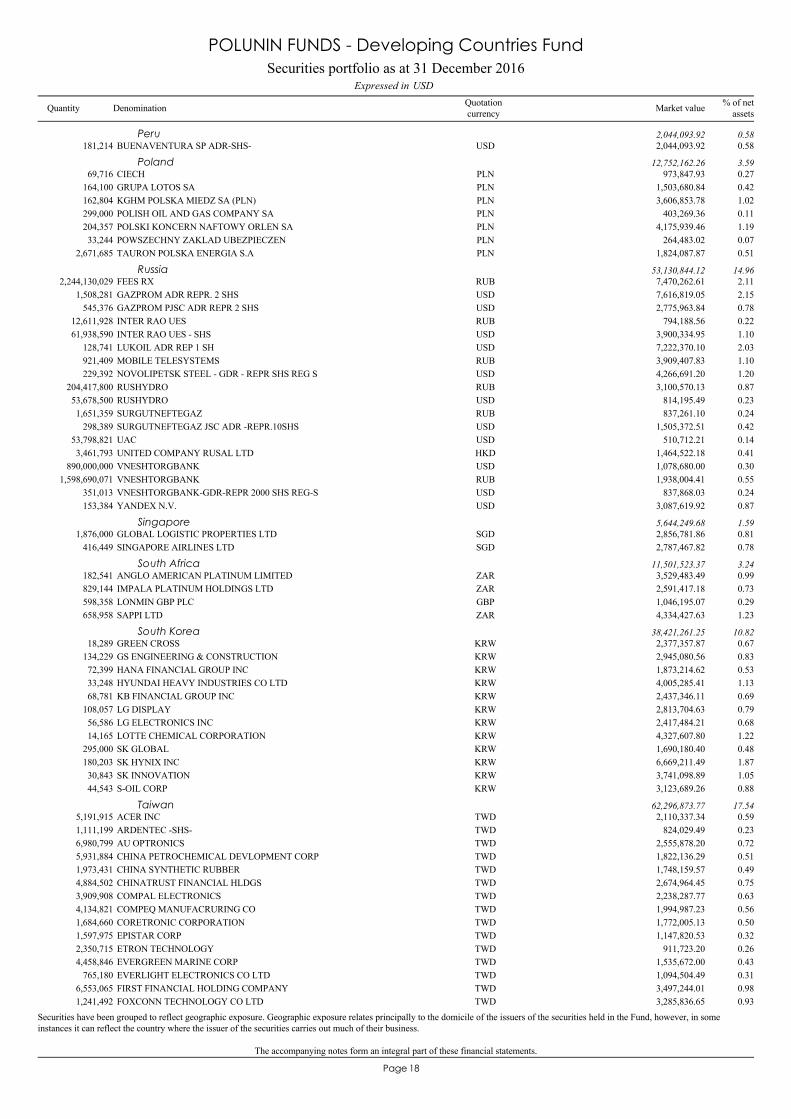
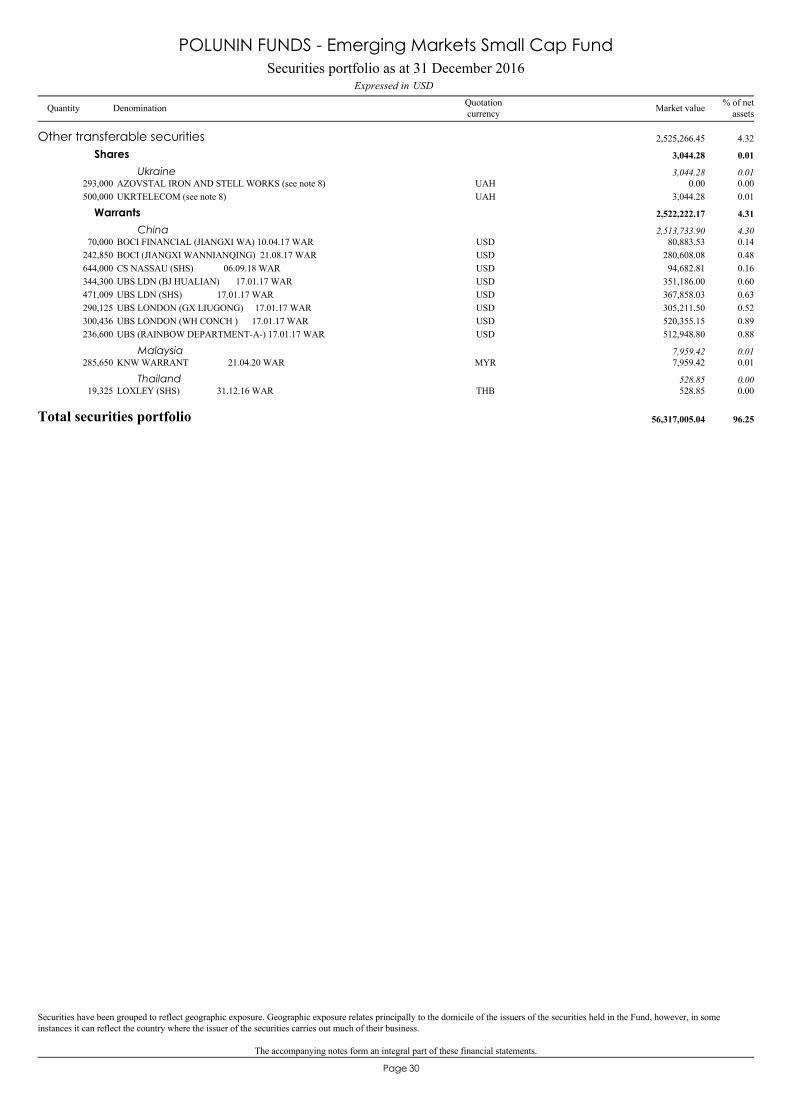
Securities have been grouped to reflect geographic exposure. Geographic exposure relates principally to the domicile of the issuers of the securities held in the Fund, however, in someinstances it can reflect the country where the issuer of the securities carries out much of their business.
CEMIG ADR REPR 1 PFD SH451,148 1,028,617.44 0.29USD
Transferable securities admitted to an official stock exchange listing and/or dealt inon another regulated market * 331,590,071.12 93.37
Shares 331,590,071.12 93.37
Brazil 14,214,154.69 4.00
EMBRAER ADR REPR.4SHS107,937 2,077,787.25 0.59USDFIBRIA315,300 3,089,348.28 0.87BRLVALE ADR REP 1SH675,845 5,149,938.90 1.44USDVALE DO RIO DOCE PREF -A-400,000 2,868,462.82 0.81BRL
ALUMINUM CORPORATION OF CHINA -H-9,823,432 4,054,471.36 1.13HKDChina 62,802,729.35 17.68
BANK OF CHINA LTD -H-6,687,420 2,967,140.13 0.84HKDBANK OF COMMUNICATIONS -H-4,582,563 3,315,830.49 0.93HKDCHANGSHA ZOOMLION -H-4,595,088 2,021,013.56 0.57HKDCHINA CONSTRUCTION BANK CORPORATION -H-3,658,502 2,817,076.51 0.79HKDCHINA MERCHANT BANK -H-1,345,471 3,154,926.42 0.89HKDCHINA MINSHENG BANKING CORPORATION -H-3,189,800 3,410,664.49 0.96HKDCHINA RAILWAY CONSTRUCTION -H-2,445,710 3,148,157.96 0.89HKDCHINA RAILWAY GROUP LTD -H-4,621,607 3,803,073.39 1.07HKDCHINA UNICOM HK2,448,628 2,851,882.16 0.80HKDCHINA WATER AFFAIRS GROUP LTD5,143,520 3,363,484.32 0.95HKDCOSCO SHIPPING2,003,018 2,012,534.46 0.57HKDDONGFANG ELECTRIC -H-1,692,669 1,495,490.39 0.42HKDFIH MOBILE LTD5,966,614 1,885,450.10 0.53HKDGLORIOUS PROPERTY HOLDINGS LTD6,802,317 666,793.68 0.19HKDGOME ELECTRICAL APP12,470,371 1,511,918.02 0.43HKDGUANGZHOU R&F PROPERTIES COMPANY LTD -H-2,260,015 2,734,230.82 0.77HKDINDUS.AND COMMERCIAL BANK OF CHINA -H-5,231,146 3,137,406.62 0.88HKDMAANSHAN IRON STEEL CO LTD -H-10,675,653 3,111,887.61 0.88HKDNINE DRAGONS PAPER (HOLDINGS) LTD3,213,000 2,913,312.45 0.82HKDSHANGHAI INDUSTRIAL HOLDINGS LTD -RC-818,689 2,217,477.72 0.62HKDSINO-OCEAN GP SHS2,676,155 1,197,737.79 0.34HKDSINOTRUK HK3,417,715 2,437,709.73 0.69HKDSUN ART RETAIL GROUP LTD2,933,728 2,573,059.17 0.72HKD
DANA GAS13,252,295 1,948,384.98 0.55AEDEgypt 1,948,384.98 0.55
ALPHA BANK AE1,862,113 3,731,721.00 1.05EURGreece 7,440,696.23 2.10
EUROBANK ERGASIAS1,212,231 824,697.42 0.23EURGREEK ORGANISAT.OF FOOTBALL PROGNOSTICS198,500 1,758,690.15 0.50EURNATL BANK GREECE4,303,067 1,125,587.66 0.32EUR
ABB SHS144,001 2,214,542.61 0.62INRIndia 19,841,710.90 5.59
ADANI PORTS631,090 2,496,184.90 0.71INRBHARAT HEAVY ELECTRICALS LTD808,554 1,443,888.62 0.41INRBHARTI AIRTEL LTD(DEMATERIALISED)484,116 2,180,197.72 0.61INRCANARA BANK .SHS.DEMATERIALISED242,446 939,134.20 0.26INRDISH TV INDIA831,495 1,037,071.38 0.29INRDLF SHS1,295,157 2,125,835.49 0.60INRHINDALCO INDUSTRIES LTD1,231,160 2,812,602.20 0.80INRRELIANCE CAPITAL LTD297,775 1,891,640.78 0.53INRRELIANCE INFRASTRUCTURE DEMATERIALISED240,980 1,658,845.27 0.47INRUNION BANK OF INDIA DEMATERIALISED537,870 975,567.72 0.27INRUNITECH - SHS DEMATERIALISED1,123,249 66,200.01 0.02INR
JORDAN PETROLEUM REFINERY259,629 1,253,238.88 0.35JODJordan 1,253,238.88 0.35
KAZAKHMYS PLC1,152,377 5,086,290.48 1.43GBPKazakhstan 5,086,290.48 1.43
KNM GROUP BHD5,045,156 382,375.83 0.11MYRMalaysia 382,375.83 0.11
CONSORCIO ARA -SHS-4,974,371 1,567,056.55 0.44MXNMexico 1,567,056.55 0.44
ARIF HABIB CORPORATION LTD1,102,987 464,971.69 0.13PKRPakistan 1,430,179.68 0.40
NATL BANK PAKISTAN1,345,221 965,207.99 0.27PKR
Securities portfolio as at 31 December 2016USDExpressed in
POLUNIN FUNDS - Developing Countries Fund
Quantity Denomination Quotationcurrency
% of netassetsMarket value
The accompanying notes form an integral part of these financial statements.
18Page
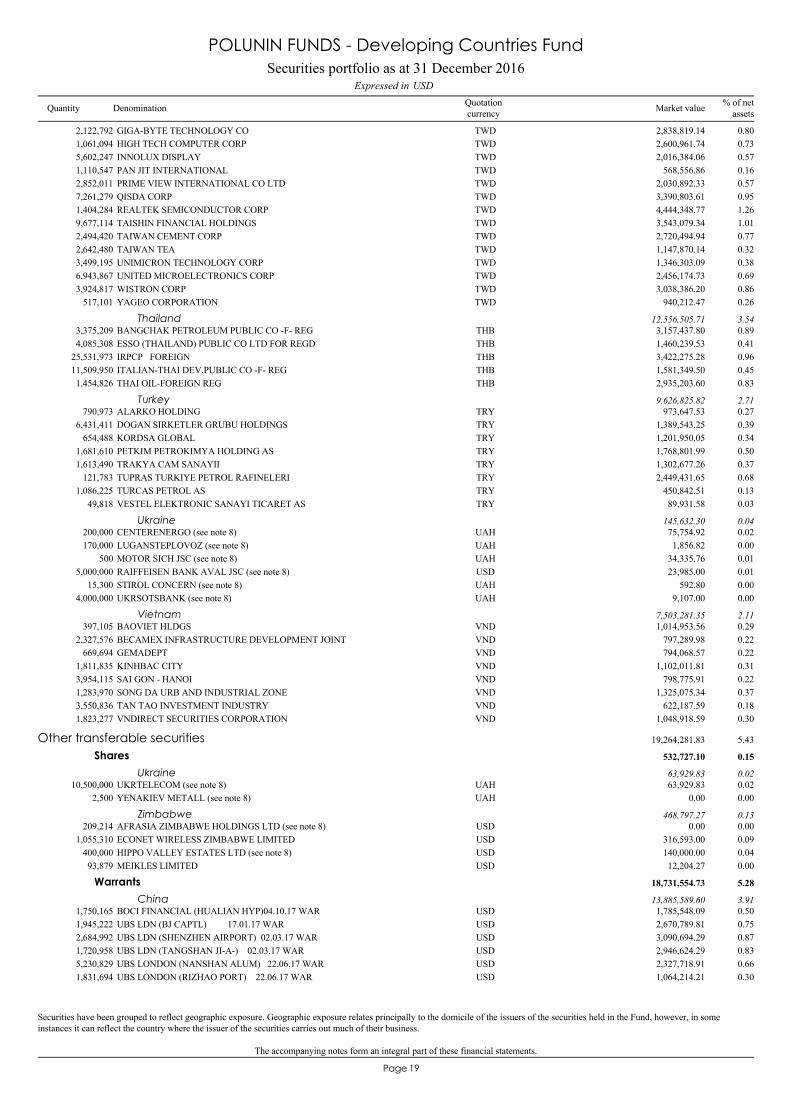
Securities have been grouped to reflect geographic exposure. Geographic exposure relates principally to the domicile of the issuers of the securities held in the Fund, however, in someinstances it can reflect the country where the issuer of the securities carries out much of their business.
BUENAVENTURA SP ADR-SHS-181,214 2,044,093.92 0.58USDPeru 2,044,093.92 0.58
CIECH69,716 973,847.93 0.27PLNPoland 12,752,162.26 3.59
GRUPA LOTOS SA164,100 1,503,680.84 0.42PLNKGHM POLSKA MIEDZ SA (PLN)162,804 3,606,853.78 1.02PLNPOLISH OIL AND GAS COMPANY SA299,000 403,269.36 0.11PLNPOLSKI KONCERN NAFTOWY ORLEN SA204,357 4,175,939.46 1.19PLNPOWSZECHNY ZAKLAD UBEZPIECZEN33,244 264,483.02 0.07PLNTAURON POLSKA ENERGIA S.A2,671,685 1,824,087.87 0.51PLN
FEES RX2,244,130,029 7,470,262.61 2.11RUBRussia 53,130,844.12 14.96
GAZPROM ADR REPR. 2 SHS1,508,281 7,616,819.05 2.15USDGAZPROM PJSC ADR REPR 2 SHS545,376 2,775,963.84 0.78USDINTER RAO UES12,611,928 794,188.56 0.22RUBINTER RAO UES - SHS61,938,590 3,900,334.95 1.10USDLUKOIL ADR REP 1 SH128,741 7,222,370.10 2.03USDMOBILE TELESYSTEMS921,409 3,909,407.83 1.10RUBNOVOLIPETSK STEEL - GDR - REPR SHS REG S229,392 4,266,691.20 1.20USDRUSHYDRO204,417,800 3,100,570.13 0.87RUBRUSHYDRO53,678,500 814,195.49 0.23USDSURGUTNEFTEGAZ1,651,359 837,261.10 0.24RUBSURGUTNEFTEGAZ JSC ADR -REPR.10SHS298,389 1,505,372.51 0.42USDUAC53,798,821 510,712.21 0.14USDUNITED COMPANY RUSAL LTD3,461,793 1,464,522.18 0.41HKDVNESHTORGBANK890,000,000 1,078,680.00 0.30USDVNESHTORGBANK1,598,690,071 1,938,004.41 0.55RUBVNESHTORGBANK-GDR-REPR 2000 SHS REG-S351,013 837,868.03 0.24USDYANDEX N.V.153,384 3,087,619.92 0.87USD
GLOBAL LOGISTIC PROPERTIES LTD1,876,000 2,856,781.86 0.81SGDSingapore 5,644,249.68 1.59
SINGAPORE AIRLINES LTD416,449 2,787,467.82 0.78SGD
ANGLO AMERICAN PLATINUM LIMITED182,541 3,529,483.49 0.99ZARSouth Africa 11,501,523.37 3.24
IMPALA PLATINUM HOLDINGS LTD829,144 2,591,417.18 0.73ZARLONMIN GBP PLC598,358 1,046,195.07 0.29GBPSAPPI LTD658,958 4,334,427.63 1.23ZAR
GREEN CROSS18,289 2,377,357.87 0.67KRWSouth Korea 38,421,261.25 10.82
GS ENGINEERING & CONSTRUCTION134,229 2,945,080.56 0.83KRWHANA FINANCIAL GROUP INC72,399 1,873,214.62 0.53KRWHYUNDAI HEAVY INDUSTRIES CO LTD33,248 4,005,285.41 1.13KRWKB FINANCIAL GROUP INC68,781 2,437,346.11 0.69KRWLG DISPLAY108,057 2,813,704.63 0.79KRWLG ELECTRONICS INC56,586 2,417,484.21 0.68KRWLOTTE CHEMICAL CORPORATION14,165 4,327,607.80 1.22KRWSK GLOBAL295,000 1,690,180.40 0.48KRWSK HYNIX INC180,203 6,669,211.49 1.87KRWSK INNOVATION30,843 3,741,098.89 1.05KRWS-OIL CORP44,543 3,123,689.26 0.88KRW
ACER INC5,191,915 2,110,337.34 0.59TWDTaiwan 62,296,873.77 17.54
ARDENTEC -SHS-1,111,199 824,029.49 0.23TWDAU OPTRONICS6,980,799 2,555,878.20 0.72TWDCHINA PETROCHEMICAL DEVLOPMENT CORP5,931,884 1,822,136.29 0.51TWDCHINA SYNTHETIC RUBBER1,973,431 1,748,159.57 0.49TWDCHINATRUST FINANCIAL HLDGS4,884,502 2,674,964.45 0.75TWDCOMPAL ELECTRONICS3,909,908 2,238,287.77 0.63TWDCOMPEQ MANUFACRURING CO4,134,821 1,994,987.23 0.56TWDCORETRONIC CORPORATION1,684,660 1,772,005.13 0.50TWDEPISTAR CORP1,597,975 1,147,820.53 0.32TWDETRON TECHNOLOGY2,350,715 911,723.20 0.26TWDEVERGREEN MARINE CORP4,458,846 1,535,672.00 0.43TWDEVERLIGHT ELECTRONICS CO LTD765,180 1,094,504.49 0.31TWDFIRST FINANCIAL HOLDING COMPANY6,553,065 3,497,244.01 0.98TWDFOXCONN TECHNOLOGY CO LTD1,241,492 3,285,836.65 0.93TWD
Securities portfolio as at 31 December 2016USDExpressed in
POLUNIN FUNDS - Developing Countries Fund
Quantity Denomination Quotationcurrency
% of netassetsMarket value
The accompanying notes form an integral part of these financial statements.
19Page
Securities have been grouped to reflect geographic exposure. Geographic exposure relates principally to the domicile of the issuers of the securities held in the Fund, however, in someinstances it can reflect the country where the issuer of the securities carries out much of their business.
GIGA-BYTE TECHNOLOGY CO2,122,792 2,838,819.14 0.80TWDHIGH TECH COMPUTER CORP1,061,094 2,600,961.74 0.73TWDINNOLUX DISPLAY5,602,247 2,016,384.06 0.57TWDPAN JIT INTERNATIONAL1,110,547 568,556.86 0.16TWDPRIME VIEW INTERNATIONAL CO LTD2,852,011 2,030,892.33 0.57TWDQISDA CORP7,261,279 3,390,803.61 0.95TWDREALTEK SEMICONDUCTOR CORP1,404,284 4,444,348.77 1.26TWDTAISHIN FINANCIAL HOLDINGS9,677,114 3,543,079.34 1.01TWDTAIWAN CEMENT CORP2,494,420 2,720,494.94 0.77TWDTAIWAN TEA2,642,480 1,147,870.14 0.32TWDUNIMICRON TECHNOLOGY CORP3,499,195 1,346,303.09 0.38TWDUNITED MICROELECTRONICS CORP6,943,867 2,456,174.73 0.69TWDWISTRON CORP3,924,817 3,038,386.20 0.86TWDYAGEO CORPORATION517,101 940,212.47 0.26TWD
BANGCHAK PETROLEUM PUBLIC CO -F- REG3,375,209 3,157,437.80 0.89THBThailand 12,556,505.71 3.54
ESSO (THAILAND) PUBLIC CO LTD FOR REGD4,085,308 1,460,239.53 0.41THBIRPCP FOREIGN25,531,973 3,422,275.28 0.96THBITALIAN-THAI DEV.PUBLIC CO -F- REG11,509,950 1,581,349.50 0.45THBTHAI OIL-FOREIGN REG1,454,826 2,935,203.60 0.83THB
ALARKO HOLDING790,973 973,647.53 0.27TRYTurkey 9,626,825.82 2.71
DOGAN SIRKETLER GRUBU HOLDINGS6,431,411 1,389,543.25 0.39TRYKORDSA GLOBAL654,488 1,201,950.05 0.34TRYPETKIM PETROKIMYA HOLDING AS1,681,610 1,768,801.99 0.50TRYTRAKYA CAM SANAYII1,613,490 1,302,677.26 0.37TRYTUPRAS TURKIYE PETROL RAFINELERI121,783 2,449,431.65 0.68TRYTURCAS PETROL AS1,086,225 450,842.51 0.13TRYVESTEL ELEKTRONIC SANAYI TICARET AS49,818 89,931.58 0.03TRY
CENTERENERGO (see note 8)200,000 75,754.92 0.02UAHUkraine 145,632.30 0.04
LUGANSTEPLOVOZ (see note 8)170,000 1,856.82 0.00UAHMOTOR SICH JSC (see note 8)500 34,335.76 0.01UAHRAIFFEISEN BANK AVAL JSC (see note 8)5,000,000 23,985.00 0.01USDSTIROL CONCERN (see note 8)15,300 592.80 0.00UAHUKRSOTSBANK (see note 8)4,000,000 9,107.00 0.00UAH
BAOVIET HLDGS397,105 1,014,953.56 0.29VNDVietnam 7,503,281.35 2.11
BECAMEX INFRASTRUCTURE DEVELOPMENT JOINT2,327,576 797,289.98 0.22VNDGEMADEPT669,694 794,068.57 0.22VNDKINHBAC CITY1,811,835 1,102,011.81 0.31VNDSAI GON - HANOI3,954,115 798,775.91 0.22VNDSONG DA URB AND INDUSTRIAL ZONE1,283,970 1,325,075.34 0.37VNDTAN TAO INVESTMENT INDUSTRY3,550,836 622,187.59 0.18VNDVNDIRECT SECURITIES CORPORATION1,823,277 1,048,918.59 0.30VND
UKRTELECOM (see note 8)10,500,000 63,929.83 0.02UAH
Other transferable securities 19,264,281.83 5.43
Shares 532,727.10 0.15
Ukraine 63,929.83 0.02
YENAKIEV METALL (see note 8)2,500 0.00 0.00UAH
AFRASIA ZIMBABWE HOLDINGS LTD (see note 8)209,214 0.00 0.00USDZimbabwe 468,797.27 0.13
ECONET WIRELESS ZIMBABWE LIMITED1,055,310 316,593.00 0.09USDHIPPO VALLEY ESTATES LTD (see note 8)400,000 140,000.00 0.04USDMEIKLES LIMITED93,879 12,204.27 0.00USD
BOCI FINANCIAL (HUALIAN HYP)04.10.17 WAR1,750,165 1,785,548.09 0.50USD
Warrants 18,731,554.73 5.28
China 13,885,589.60 3.91
UBS LDN (BJ CAPTL) 17.01.17 WAR1,945,222 2,670,789.81 0.75USDUBS LDN (SHENZHEN AIRPORT) 02.03.17 WAR2,684,992 3,090,694.29 0.87USDUBS LDN (TANGSHAN JI-A-) 02.03.17 WAR1,720,958 2,946,624.29 0.83USDUBS LONDON (NANSHAN ALUM) 22.06.17 WAR5,230,829 2,327,718.91 0.66USDUBS LONDON (RIZHAO PORT) 22.06.17 WAR1,831,694 1,064,214.21 0.30USD
Securities portfolio as at 31 December 2016USDExpressed in
POLUNIN FUNDS - Developing Countries Fund
Quantity Denomination Quotationcurrency
% of netassetsMarket value
The accompanying notes form an integral part of these financial statements.
20Page
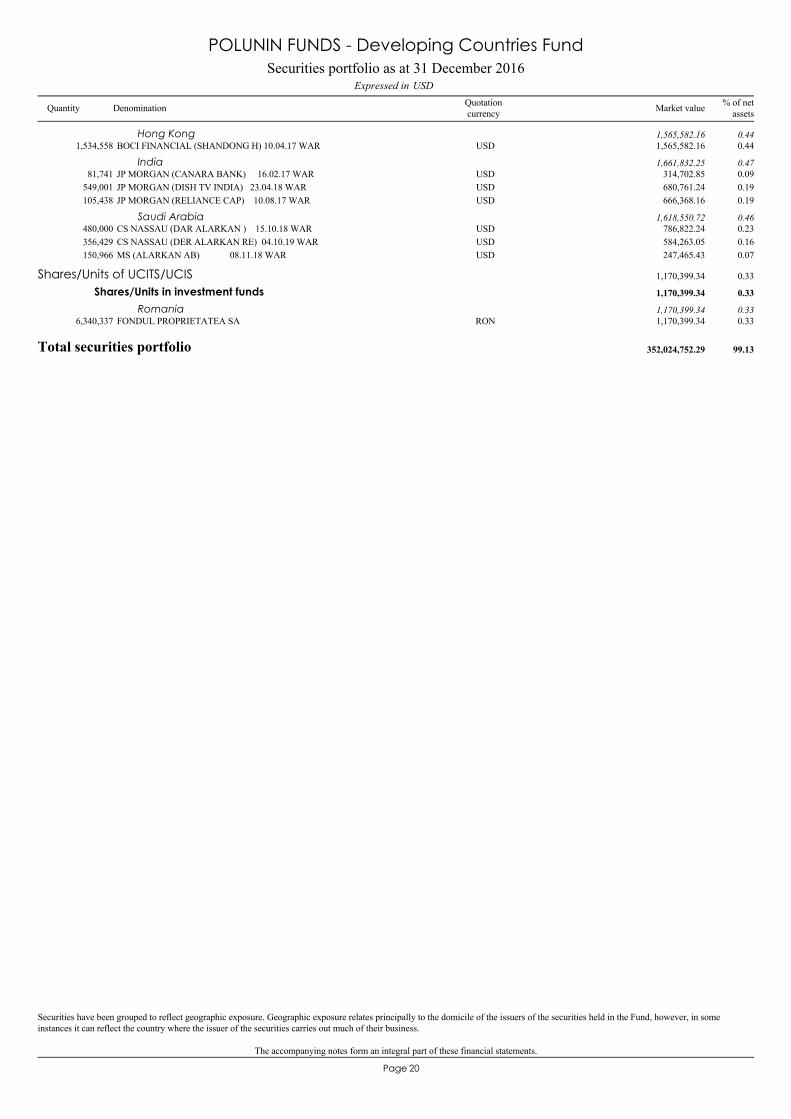
Securities have been grouped to reflect geographic exposure. Geographic exposure relates principally to the domicile of the issuers of the securities held in the Fund, however, in someinstances it can reflect the country where the issuer of the securities carries out much of their business.
BOCI FINANCIAL (SHANDONG H) 10.04.17 WAR1,534,558 1,565,582.16 0.44USDHong Kong 1,565,582.16 0.44
JP MORGAN (CANARA BANK) 16.02.17 WAR81,741 314,702.85 0.09USDIndia 1,661,832.25 0.47
JP MORGAN (DISH TV INDIA) 23.04.18 WAR549,001 680,761.24 0.19USDJP MORGAN (RELIANCE CAP) 10.08.17 WAR105,438 666,368.16 0.19USD
CS NASSAU (DAR ALARKAN ) 15.10.18 WAR480,000 786,822.24 0.23USDSaudi Arabia 1,618,550.72 0.46
CS NASSAU (DER ALARKAN RE) 04.10.19 WAR356,429 584,263.05 0.16USDMS (ALARKAN AB) 08.11.18 WAR150,966 247,465.43 0.07USD
FONDUL PROPRIETATEA SA6,340,337 1,170,399.34 0.33RON
Shares/Units of UCITS/UCIS 1,170,399.34 0.33
Shares/Units in investment funds 1,170,399.34 0.33
Romania 1,170,399.34 0.33
Total securities portfolio 352,024,752.29 99.13
Securities portfolio as at 31 December 2016USDExpressed in
POLUNIN FUNDS - Developing Countries Fund
Quantity Denomination Quotationcurrency
% of netassetsMarket value

21Page
The accompanying notes form an integral part of these financial statements.
China 21.79Taiwan 17.71Russia 15.09South Korea 10.91India 6.11Brazil 4.04Poland 3.62Thailand 3.57South Africa 3.27Turkey 2.73Vietnam 2.13Greece 2.11Singapore 1.60Kazakhstan 1.44Peru 0.58Egypt 0.55Saudi Arabia 0.46Hong Kong 0.44Mexico 0.45Pakistan 0.41Jordan 0.36Romania 0.33Zimbabwe 0.13Malaysia 0.11Ukraine 0.06
100.00
Breakdown per country % of portfolio
Geographical breakdown
POLUNIN FUNDS - Developing Countries Fund

22Page
The accompanying notes form an integral part of these financial statements.
Banks and credit institutions 13.54Petroleum 12.16Holding and finance companies 8.70Electronics and semiconductors 8.40Coal mining and steel industry 5.82Building materials and trade 5.69Utilities 5.58Office supplies and computing 5.58Electrical engineering and electronics 5.28Chemicals 4.13Non-ferrous metals 3.68Communications 3.33Real estate companies 2.98Paper and forest products 2.94Transportation 2.73Precious metals and stones 2.32Machine and apparatus construction 1.85Internet and Internet services 0.88Aerospace industry 0.74Retail trade, department stores 0.73Road vehicles 0.69Pharmaceuticals and cosmetics 0.68Hotels and restaurants 0.50Insurance 0.36Tires and rubber 0.34Miscellaneous trading companies 0.33Miscellaneous sectors 0.04Miscellaneous services -
100.00
Breakdown per sector % of portfolio
Economical breakdown
POLUNIN FUNDS - Developing Countries Fund
23Page
POLUNIN FUNDS- Emerging Markets Small Cap Fund

The accompanying notes form an integral part of these financial statements.
24Page
58,746,534.82Assets56,317,005.04Securities portfolio at market value 2.6Note55,852,418.37Cost price
464,586.67Unrealised profit on the securities portfolio2,405,119.47Cash at bank and liquidities 7Note
24,410.31Dividends receivable
235,270.68Liabilities287.78Bank overdraft 7Note
206,965.62Management fees payable 4Note28,017.28Other liabilities 10Note
58,511,264.14Net asset value
Financial Statements as at 31 December 2016
Expressed in USD
Statement of Net Assets as at 31 December 2016
POLUNIN FUNDS - Emerging Markets Small Cap Fund
The accompanying notes form an integral part of these financial statements.
25Page
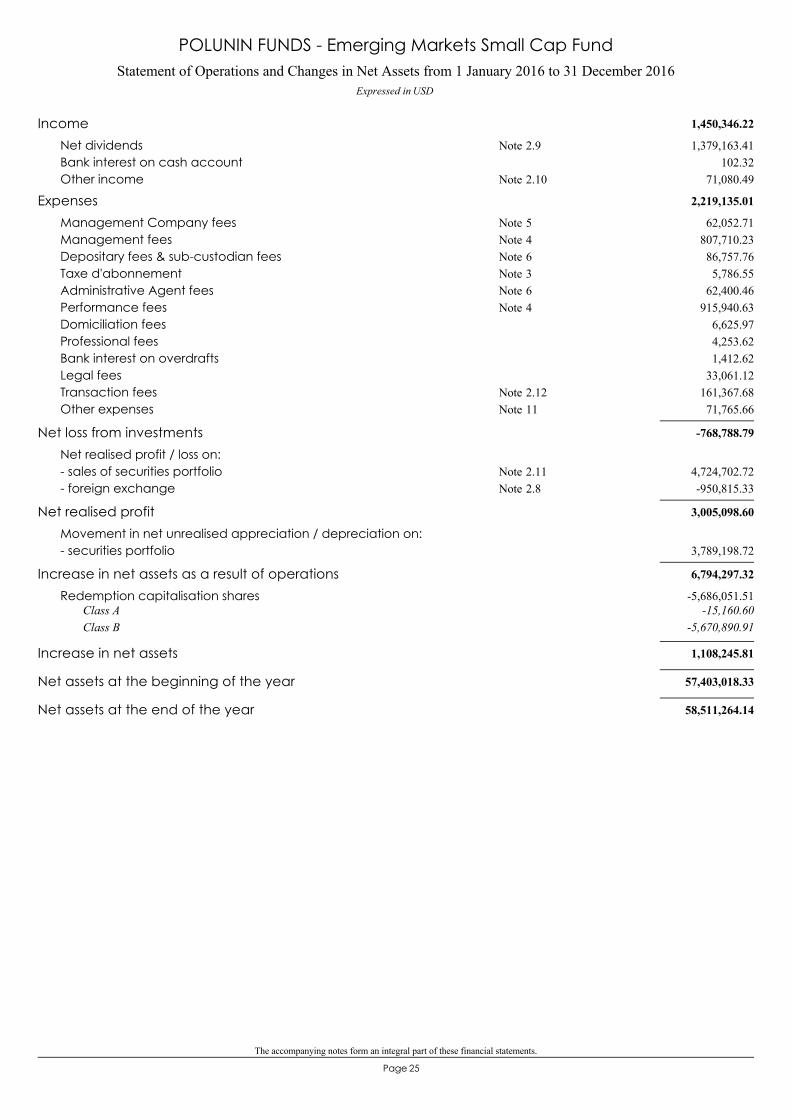
Statement of Operations and Changes in Net Assets from 1 January 2016 to 31 December 2016Expressed in USD
POLUNIN FUNDS - Emerging Markets Small Cap Fund
1,450,346.22Income1,379,163.41Net dividends 2.9Note
102.32Bank interest on cash account71,080.49Other income 2.10Note
2,219,135.01Expenses62,052.71Management Company fees 5Note
807,710.23Management fees 4Note86,757.76Depositary fees & sub-custodian fees 6Note5,786.55Taxe d'abonnement 3Note
62,400.46Administrative Agent fees 6Note915,940.63Performance fees 4Note
6,625.97Domiciliation fees4,253.62Professional fees1,412.62Bank interest on overdrafts
33,061.12Legal fees161,367.68Transaction fees 2.12Note71,765.66Other expenses 11Note
-768,788.79Net loss from investmentsNet realised profit / loss on:
4,724,702.72- sales of securities portfolio 2.11Note-950,815.33- foreign exchange 2.8Note
3,005,098.60Net realised profitMovement in net unrealised appreciation / depreciation on:
3,789,198.72- securities portfolio
6,794,297.32Increase in net assets as a result of operations
-15,160.60Class A-5,670,890.91Class B
-5,686,051.51Redemption capitalisation shares
1,108,245.81Increase in net assets
57,403,018.33Net assets at the beginning of the year
58,511,264.14Net assets at the end of the year

The accompanying notes form an integral part of these financial statements.
26Page
Class ACapitalisation shares 14,729.739 0.000 10.000 14,719.739
Class BCapitalisation shares 26,586.324 0.000 3,888.700 22,697.624
Changes in number of shares outstanding from 1 January 2016 to 31 December 2016
Shares issued Shares redeemedShares
outstanding as at31 December 2016
Sharesoutstanding as at 1
January 2016
POLUNIN FUNDS - Emerging Markets Small Cap Fund
Key figures relating to the last 3 years
Class A
Capitalisation shares
1,557.8614,719.739 14,729.739
1,388.6327,237.0701,384.96
Number of sharesNet asset value per share
USD USD USD
Class B
Capitalisation shares
1,567.5722,697.624 26,586.324
1,389.77--
Number of sharesNet asset value per share
USD USD USD
Total Net Assets 58,511,264.14 57,403,018.33 37,722,188.06
31 December 201431 December 201531 December 2016Year ended as at:
USD
The accompanying notes form an integral part of these financial statements.
27Page
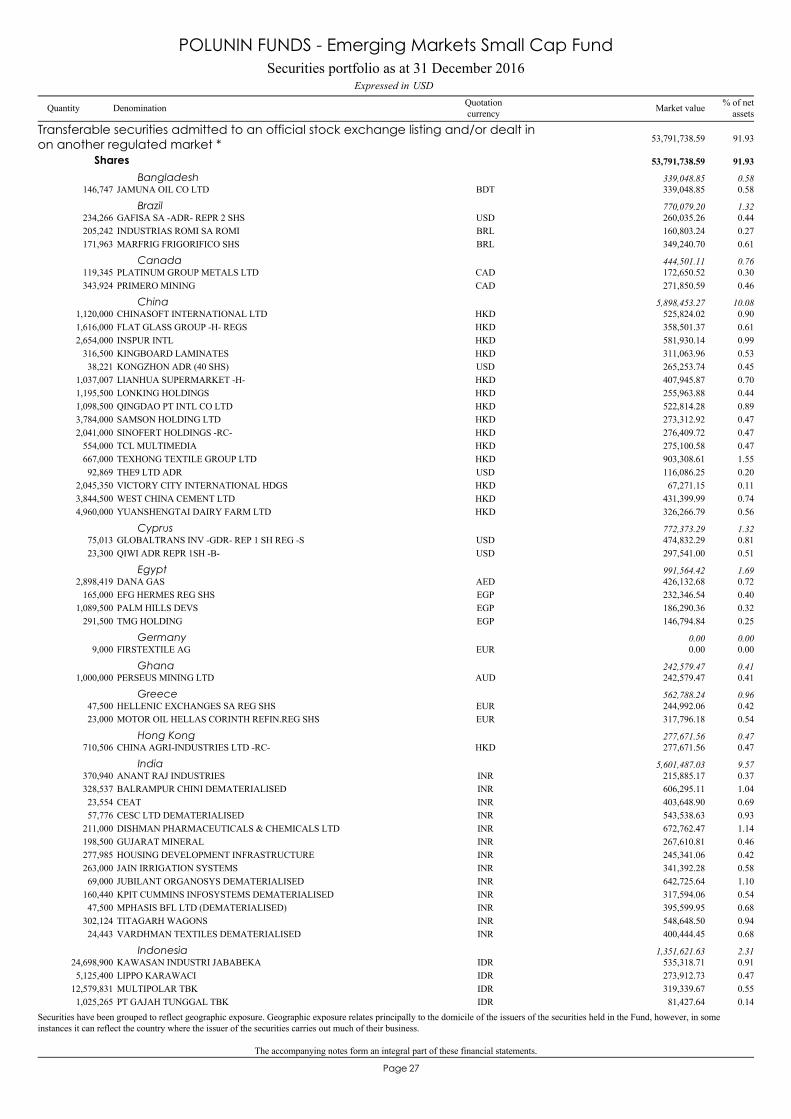
Securities have been grouped to reflect geographic exposure. Geographic exposure relates principally to the domicile of the issuers of the securities held in the Fund, however, in someinstances it can reflect the country where the issuer of the securities carries out much of their business.
JAMUNA OIL CO LTD146,747 339,048.85 0.58BDT
Transferable securities admitted to an official stock exchange listing and/or dealt inon another regulated market * 53,791,738.59 91.93
Shares 53,791,738.59 91.93
Bangladesh 339,048.85 0.58
GAFISA SA -ADR- REPR 2 SHS234,266 260,035.26 0.44USDBrazil 770,079.20 1.32
INDUSTRIAS ROMI SA ROMI205,242 160,803.24 0.27BRLMARFRIG FRIGORIFICO SHS171,963 349,240.70 0.61BRL
PLATINUM GROUP METALS LTD119,345 172,650.52 0.30CADCanada 444,501.11 0.76
PRIMERO MINING343,924 271,850.59 0.46CAD
CHINASOFT INTERNATIONAL LTD1,120,000 525,824.02 0.90HKDChina 5,898,453.27 10.08
FLAT GLASS GROUP -H- REGS1,616,000 358,501.37 0.61HKDINSPUR INTL2,654,000 581,930.14 0.99HKDKINGBOARD LAMINATES316,500 311,063.96 0.53HKDKONGZHON ADR (40 SHS)38,221 265,253.74 0.45USDLIANHUA SUPERMARKET -H-1,037,007 407,945.87 0.70HKDLONKING HOLDINGS1,195,500 255,963.88 0.44HKDQINGDAO PT INTL CO LTD1,098,500 522,814.28 0.89HKDSAMSON HOLDING LTD3,784,000 273,312.92 0.47HKDSINOFERT HOLDINGS -RC-2,041,000 276,409.72 0.47HKDTCL MULTIMEDIA554,000 275,100.58 0.47HKDTEXHONG TEXTILE GROUP LTD667,000 903,308.61 1.55HKDTHE9 LTD ADR92,869 116,086.25 0.20USDVICTORY CITY INTERNATIONAL HDGS2,045,350 67,271.15 0.11HKDWEST CHINA CEMENT LTD3,844,500 431,399.99 0.74HKDYUANSHENGTAI DAIRY FARM LTD4,960,000 326,266.79 0.56HKD
GLOBALTRANS INV -GDR- REP 1 SH REG -S75,013 474,832.29 0.81USDCyprus 772,373.29 1.32
QIWI ADR REPR 1SH -B-23,300 297,541.00 0.51USD
DANA GAS2,898,419 426,132.68 0.72AEDEgypt 991,564.42 1.69
EFG HERMES REG SHS165,000 232,346.54 0.40EGPPALM HILLS DEVS1,089,500 186,290.36 0.32EGPTMG HOLDING291,500 146,794.84 0.25EGP
FIRSTEXTILE AG9,000 0.00 0.00EURGermany 0.00 0.00
PERSEUS MINING LTD1,000,000 242,579.47 0.41AUDGhana 242,579.47 0.41
HELLENIC EXCHANGES SA REG SHS47,500 244,992.06 0.42EURGreece 562,788.24 0.96
MOTOR OIL HELLAS CORINTH REFIN.REG SHS23,000 317,796.18 0.54EUR
CHINA AGRI-INDUSTRIES LTD -RC-710,506 277,671.56 0.47HKDHong Kong 277,671.56 0.47
ANANT RAJ INDUSTRIES370,940 215,885.17 0.37INRIndia 5,601,487.03 9.57
BALRAMPUR CHINI DEMATERIALISED328,537 606,295.11 1.04INRCEAT23,554 403,648.90 0.69INRCESC LTD DEMATERIALISED57,776 543,538.63 0.93INRDISHMAN PHARMACEUTICALS & CHEMICALS LTD211,000 672,762.47 1.14INRGUJARAT MINERAL198,500 267,610.81 0.46INRHOUSING DEVELOPMENT INFRASTRUCTURE277,985 245,341.06 0.42INRJAIN IRRIGATION SYSTEMS263,000 341,392.28 0.58INRJUBILANT ORGANOSYS DEMATERIALISED69,000 642,725.64 1.10INRKPIT CUMMINS INFOSYSTEMS DEMATERIALISED160,440 317,594.06 0.54INRMPHASIS BFL LTD (DEMATERIALISED)47,500 395,599.95 0.68INRTITAGARH WAGONS302,124 548,648.50 0.94INRVARDHMAN TEXTILES DEMATERIALISED24,443 400,444.45 0.68INR
KAWASAN INDUSTRI JABABEKA24,698,900 535,318.71 0.91IDRIndonesia 1,351,621.63 2.31
LIPPO KARAWACI5,125,400 273,912.73 0.47IDRMULTIPOLAR TBK12,579,831 319,339.67 0.55IDRPT GAJAH TUNGGAL TBK1,025,265 81,427.64 0.14IDR
Securities portfolio as at 31 December 2016USDExpressed in
POLUNIN FUNDS - Emerging Markets Small Cap Fund
Quantity Denomination Quotationcurrency
% of netassetsMarket value
The accompanying notes form an integral part of these financial statements.
28Page
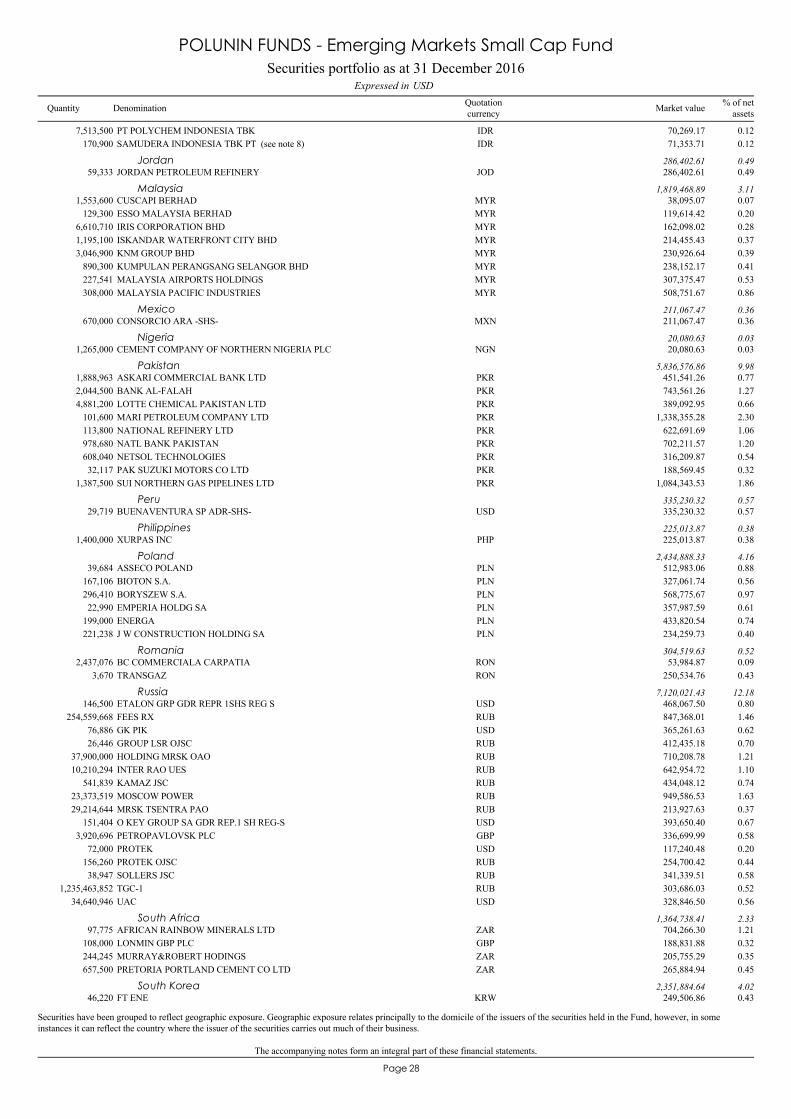
Securities have been grouped to reflect geographic exposure. Geographic exposure relates principally to the domicile of the issuers of the securities held in the Fund, however, in someinstances it can reflect the country where the issuer of the securities carries out much of their business.
PT POLYCHEM INDONESIA TBK7,513,500 70,269.17 0.12IDRSAMUDERA INDONESIA TBK PT (see note 8)170,900 71,353.71 0.12IDR
JORDAN PETROLEUM REFINERY59,333 286,402.61 0.49JODJordan 286,402.61 0.49
CUSCAPI BERHAD1,553,600 38,095.07 0.07MYRMalaysia 1,819,468.89 3.11
ESSO MALAYSIA BERHAD129,300 119,614.42 0.20MYRIRIS CORPORATION BHD6,610,710 162,098.02 0.28MYRISKANDAR WATERFRONT CITY BHD1,195,100 214,455.43 0.37MYRKNM GROUP BHD3,046,900 230,926.64 0.39MYRKUMPULAN PERANGSANG SELANGOR BHD890,300 238,152.17 0.41MYRMALAYSIA AIRPORTS HOLDINGS227,541 307,375.47 0.53MYRMALAYSIA PACIFIC INDUSTRIES308,000 508,751.67 0.86MYR
CONSORCIO ARA -SHS-670,000 211,067.47 0.36MXNMexico 211,067.47 0.36
CEMENT COMPANY OF NORTHERN NIGERIA PLC1,265,000 20,080.63 0.03NGNNigeria 20,080.63 0.03
ASKARI COMMERCIAL BANK LTD1,888,963 451,541.26 0.77PKRPakistan 5,836,576.86 9.98
BANK AL-FALAH2,044,500 743,561.26 1.27PKRLOTTE CHEMICAL PAKISTAN LTD4,881,200 389,092.95 0.66PKRMARI PETROLEUM COMPANY LTD101,600 1,338,355.28 2.30PKRNATIONAL REFINERY LTD113,800 622,691.69 1.06PKRNATL BANK PAKISTAN978,680 702,211.57 1.20PKRNETSOL TECHNOLOGIES608,040 316,209.87 0.54PKRPAK SUZUKI MOTORS CO LTD32,117 188,569.45 0.32PKRSUI NORTHERN GAS PIPELINES LTD1,387,500 1,084,343.53 1.86PKR
BUENAVENTURA SP ADR-SHS-29,719 335,230.32 0.57USDPeru 335,230.32 0.57
XURPAS INC1,400,000 225,013.87 0.38PHPPhilippines 225,013.87 0.38
ASSECO POLAND39,684 512,983.06 0.88PLNPoland 2,434,888.33 4.16
BIOTON S.A.167,106 327,061.74 0.56PLNBORYSZEW S.A.296,410 568,775.67 0.97PLNEMPERIA HOLDG SA22,990 357,987.59 0.61PLNENERGA199,000 433,820.54 0.74PLNJ W CONSTRUCTION HOLDING SA221,238 234,259.73 0.40PLN
BC COMMERCIALA CARPATIA2,437,076 53,984.87 0.09RONRomania 304,519.63 0.52
TRANSGAZ3,670 250,534.76 0.43RON
ETALON GRP GDR REPR 1SHS REG S146,500 468,067.50 0.80USDRussia 7,120,021.43 12.18
FEES RX254,559,668 847,368.01 1.46RUBGK PIK76,886 365,261.63 0.62USDGROUP LSR OJSC26,446 412,435.18 0.70RUBHOLDING MRSK OAO37,900,000 710,208.78 1.21RUBINTER RAO UES10,210,294 642,954.72 1.10RUBKAMAZ JSC541,839 434,048.12 0.74RUBMOSCOW POWER23,373,519 949,586.53 1.63RUBMRSK TSENTRA PAO29,214,644 213,927.63 0.37RUBO KEY GROUP SA GDR REP.1 SH REG-S151,404 393,650.40 0.67USDPETROPAVLOVSK PLC3,920,696 336,699.99 0.58GBPPROTEK72,000 117,240.48 0.20USDPROTEK OJSC156,260 254,700.42 0.44RUBSOLLERS JSC38,947 341,339.51 0.58RUBTGC-11,235,463,852 303,686.03 0.52RUBUAC34,640,946 328,846.50 0.56USD
AFRICAN RAINBOW MINERALS LTD97,775 704,266.30 1.21ZARSouth Africa 1,364,738.41 2.33
LONMIN GBP PLC108,000 188,831.88 0.32GBPMURRAY&ROBERT HODINGS244,245 205,755.29 0.35ZARPRETORIA PORTLAND CEMENT CO LTD657,500 265,884.94 0.45ZAR
FT ENE46,220 249,506.86 0.43KRWSouth Korea 2,351,884.64 4.02
Securities portfolio as at 31 December 2016USDExpressed in
POLUNIN FUNDS - Emerging Markets Small Cap Fund
Quantity Denomination Quotationcurrency
% of netassetsMarket value
The accompanying notes form an integral part of these financial statements.
29Page
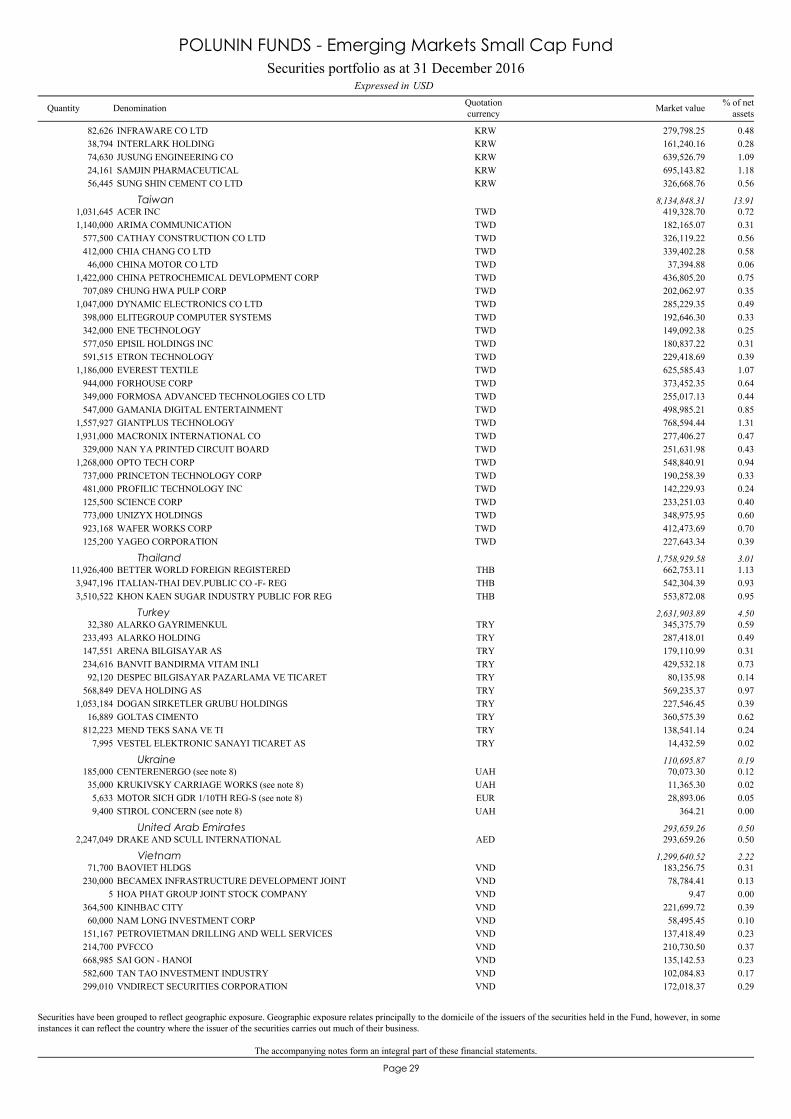
Securities have been grouped to reflect geographic exposure. Geographic exposure relates principally to the domicile of the issuers of the securities held in the Fund, however, in someinstances it can reflect the country where the issuer of the securities carries out much of their business.
INFRAWARE CO LTD82,626 279,798.25 0.48KRWINTERLARK HOLDING38,794 161,240.16 0.28KRWJUSUNG ENGINEERING CO74,630 639,526.79 1.09KRWSAMJIN PHARMACEUTICAL24,161 695,143.82 1.18KRWSUNG SHIN CEMENT CO LTD56,445 326,668.76 0.56KRW
ACER INC1,031,645 419,328.70 0.72TWDTaiwan 8,134,848.31 13.91
ARIMA COMMUNICATION1,140,000 182,165.07 0.31TWDCATHAY CONSTRUCTION CO LTD577,500 326,119.22 0.56TWDCHIA CHANG CO LTD412,000 339,402.28 0.58TWDCHINA MOTOR CO LTD46,000 37,394.88 0.06TWDCHINA PETROCHEMICAL DEVLOPMENT CORP1,422,000 436,805.20 0.75TWDCHUNG HWA PULP CORP707,089 202,062.97 0.35TWDDYNAMIC ELECTRONICS CO LTD1,047,000 285,229.35 0.49TWDELITEGROUP COMPUTER SYSTEMS398,000 192,646.30 0.33TWDENE TECHNOLOGY342,000 149,092.38 0.25TWDEPISIL HOLDINGS INC577,050 180,837.22 0.31TWDETRON TECHNOLOGY591,515 229,418.69 0.39TWDEVEREST TEXTILE1,186,000 625,585.43 1.07TWDFORHOUSE CORP944,000 373,452.35 0.64TWDFORMOSA ADVANCED TECHNOLOGIES CO LTD349,000 255,017.13 0.44TWDGAMANIA DIGITAL ENTERTAINMENT547,000 498,985.21 0.85TWDGIANTPLUS TECHNOLOGY1,557,927 768,594.44 1.31TWDMACRONIX INTERNATIONAL CO1,931,000 277,406.27 0.47TWDNAN YA PRINTED CIRCUIT BOARD329,000 251,631.98 0.43TWDOPTO TECH CORP1,268,000 548,840.91 0.94TWDPRINCETON TECHNOLOGY CORP737,000 190,258.39 0.33TWDPROFILIC TECHNOLOGY INC481,000 142,229.93 0.24TWDSCIENCE CORP125,500 233,251.03 0.40TWDUNIZYX HOLDINGS773,000 348,975.95 0.60TWDWAFER WORKS CORP923,168 412,473.69 0.70TWDYAGEO CORPORATION125,200 227,643.34 0.39TWD
BETTER WORLD FOREIGN REGISTERED11,926,400 662,753.11 1.13THBThailand 1,758,929.58 3.01
ITALIAN-THAI DEV.PUBLIC CO -F- REG3,947,196 542,304.39 0.93THBKHON KAEN SUGAR INDUSTRY PUBLIC FOR REG3,510,522 553,872.08 0.95THB
ALARKO GAYRIMENKUL32,380 345,375.79 0.59TRYTurkey 2,631,903.89 4.50
ALARKO HOLDING233,493 287,418.01 0.49TRYARENA BILGISAYAR AS147,551 179,110.99 0.31TRYBANVIT BANDIRMA VITAM INLI234,616 429,532.18 0.73TRYDESPEC BILGISAYAR PAZARLAMA VE TICARET92,120 80,135.98 0.14TRYDEVA HOLDING AS568,849 569,235.37 0.97TRYDOGAN SIRKETLER GRUBU HOLDINGS1,053,184 227,546.45 0.39TRYGOLTAS CIMENTO16,889 360,575.39 0.62TRYMEND TEKS SANA VE TI812,223 138,541.14 0.24TRYVESTEL ELEKTRONIC SANAYI TICARET AS7,995 14,432.59 0.02TRY
CENTERENERGO (see note 8)185,000 70,073.30 0.12UAHUkraine 110,695.87 0.19
KRUKIVSKY CARRIAGE WORKS (see note 8)35,000 11,365.30 0.02UAHMOTOR SICH GDR 1/10TH REG-S (see note 8)5,633 28,893.06 0.05EURSTIROL CONCERN (see note 8)9,400 364.21 0.00UAH
DRAKE AND SCULL INTERNATIONAL2,247,049 293,659.26 0.50AEDUnited Arab Emirates 293,659.26 0.50
BAOVIET HLDGS71,700 183,256.75 0.31VNDVietnam 1,299,640.52 2.22
BECAMEX INFRASTRUCTURE DEVELOPMENT JOINT230,000 78,784.41 0.13VNDHOA PHAT GROUP JOINT STOCK COMPANY5 9.47 0.00VNDKINHBAC CITY364,500 221,699.72 0.39VNDNAM LONG INVESTMENT CORP60,000 58,495.45 0.10VNDPETROVIETMAN DRILLING AND WELL SERVICES151,167 137,418.49 0.23VNDPVFCCO214,700 210,730.50 0.37VNDSAI GON - HANOI668,985 135,142.53 0.23VNDTAN TAO INVESTMENT INDUSTRY582,600 102,084.83 0.17VNDVNDIRECT SECURITIES CORPORATION299,010 172,018.37 0.29VND
Securities portfolio as at 31 December 2016USDExpressed in
POLUNIN FUNDS - Emerging Markets Small Cap Fund
Quantity Denomination Quotationcurrency
% of netassetsMarket value
The accompanying notes form an integral part of these financial statements.
30Page
Securities have been grouped to reflect geographic exposure. Geographic exposure relates principally to the domicile of the issuers of the securities held in the Fund, however, in someinstances it can reflect the country where the issuer of the securities carries out much of their business.
AZOVSTAL IRON AND STELL WORKS (see note 8)293,000 0.00 0.00UAH
Other transferable securities 2,525,266.45 4.32
Shares 3,044.28 0.01
Ukraine 3,044.28 0.01
UKRTELECOM (see note 8)500,000 3,044.28 0.01UAH
BOCI FINANCIAL (JIANGXI WA) 10.04.17 WAR70,000 80,883.53 0.14USD
Warrants 2,522,222.17 4.31
China 2,513,733.90 4.30
BOCI (JIANGXI WANNIANQING) 21.08.17 WAR242,850 280,608.08 0.48USDCS NASSAU (SHS) 06.09.18 WAR644,000 94,682.81 0.16USDUBS LDN (BJ HUALIAN) 17.01.17 WAR344,300 351,186.00 0.60USDUBS LDN (SHS) 17.01.17 WAR471,009 367,858.03 0.63USDUBS LONDON (GX LIUGONG) 17.01.17 WAR290,125 305,211.50 0.52USDUBS LONDON (WH CONCH ) 17.01.17 WAR300,436 520,355.15 0.89USDUBS (RAINBOW DEPARTMENT-A-) 17.01.17 WAR236,600 512,948.80 0.88USD
KNW WARRANT 21.04.20 WAR285,650 7,959.42 0.01MYRMalaysia 7,959.42 0.01
LOXLEY (SHS) 31.12.16 WAR19,325 528.85 0.00THBThailand 528.85 0.00
Total securities portfolio 56,317,005.04 96.25
Securities portfolio as at 31 December 2016USDExpressed in
POLUNIN FUNDS - Emerging Markets Small Cap Fund
Quantity Denomination Quotationcurrency
% of netassetsMarket value
31Page
The accompanying notes form an integral part of these financial statements.
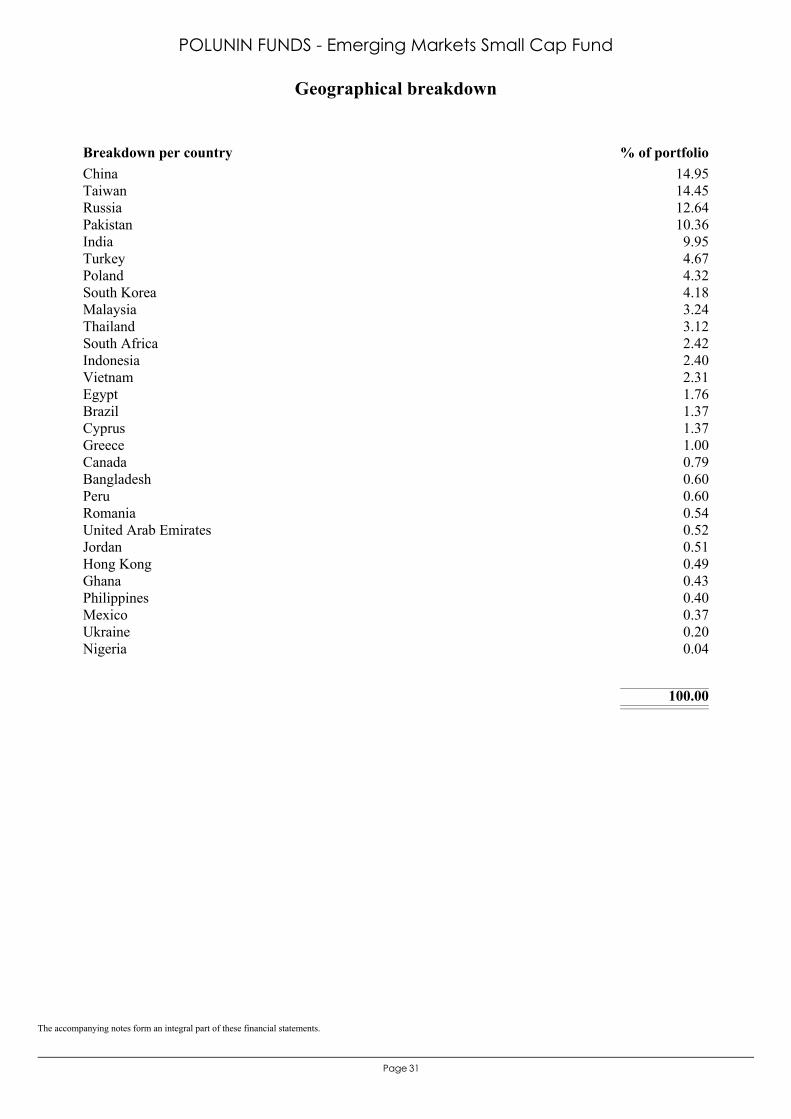
China 14.95Taiwan 14.45Russia 12.64Pakistan 10.36India 9.95Turkey 4.67Poland 4.32South Korea 4.18Malaysia 3.24Thailand 3.12South Africa 2.42Indonesia 2.40Vietnam 2.31Egypt 1.76Brazil 1.37Cyprus 1.37Greece 1.00Canada 0.79Bangladesh 0.60Peru 0.60Romania 0.54United Arab Emirates 0.52Jordan 0.51Hong Kong 0.49Ghana 0.43Philippines 0.40Mexico 0.37Ukraine 0.20Nigeria 0.04
100.00
Breakdown per country % of portfolio
Geographical breakdown
POLUNIN FUNDS - Emerging Markets Small Cap Fund
32Page
The accompanying notes form an integral part of these financial statements.
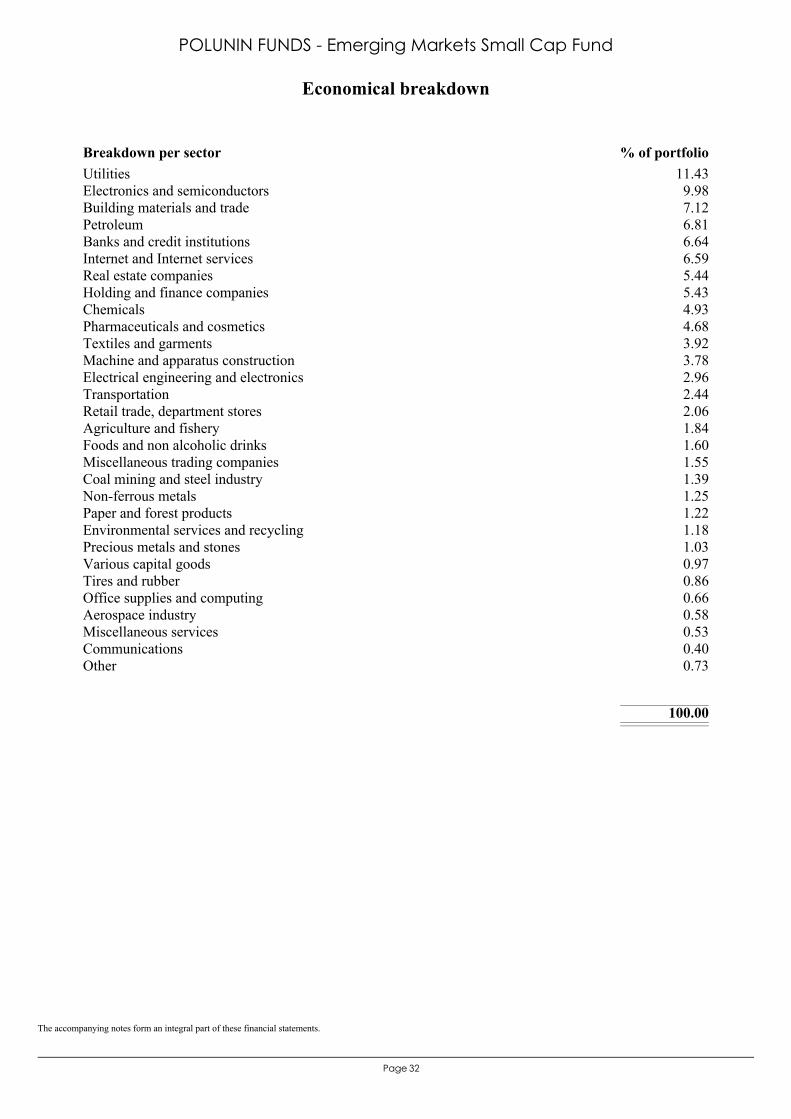
Utilities 11.43Electronics and semiconductors 9.98Building materials and trade 7.12Petroleum 6.81Banks and credit institutions 6.64Internet and Internet services 6.59Real estate companies 5.44Holding and finance companies 5.43Chemicals 4.93Pharmaceuticals and cosmetics 4.68Textiles and garments 3.92Machine and apparatus construction 3.78Electrical engineering and electronics 2.96Transportation 2.44Retail trade, department stores 2.06Agriculture and fishery 1.84Foods and non alcoholic drinks 1.60Miscellaneous trading companies 1.55Coal mining and steel industry 1.39Non-ferrous metals 1.25Paper and forest products 1.22Environmental services and recycling 1.18Precious metals and stones 1.03Various capital goods 0.97Tires and rubber 0.86Office supplies and computing 0.66Aerospace industry 0.58Miscellaneous services 0.53Communications 0.40Other 0.73
100.00
Breakdown per sector % of portfolio
Economical breakdown
POLUNIN FUNDS - Emerging Markets Small Cap Fund
33Page
POLUNIN FUNDSNotes to the financial statements
POLUNIN FUNDS
Notes to the financial statements as at 31 December 2016
Page 34
NOTE 1 – General POLUNIN FUNDS (the “Fund”) is an open-ended investment fund organised under the Laws of Luxembourg as a société d’investissement à capital variable (SICAV). The Fund was incorporated on 30 August 2007 as a société d’investissement à capital variable - fonds d’investissement spécialisé subject to the Law of 13 February 2007 (the “2007 Law”), as amended, relating to specialised investment funds. Following resolutions of its Shareholders at the extraordinary general meeting held on 15 June 2012, the Fund was converted into an investment company with variable capital authorised under part I of the amended Law of 17 December 2010 (the “2010 Law”) relating to undertakings for collective investment. As at 13 October 2016, Carne Global Fund Managers (Luxembourg) S.A. has been appointed as Management Company governed by Part IV, Chapter 15 of the 2010 Law in replace of Alceda Fund Management S.A.. The Fund is registered with the Registre de Commerce et des Sociétés of Luxembourg under number B 131.312. The deed of incorporation, including the Articles were published in the Mémorial C, Recueil des Sociétés et Associations. As at 31 December 2016, two sub-funds are open to investors:
• POLUNIN FUNDS - Developing Countries Fund • POLUNIN FUNDS - Emerging Markets Small Cap Fund
Several Classes of Shares reserved to institutional investors can be issued within each sub-fund with different fee structures, distribution, marketing targets, currency or other specific features. As at 31 December 2016, the following classes of shares are open :
• POLUNIN FUNDS - Developing Countries Fund : A, B, C, D and E share classes • POLUNIN FUNDS - Emerging Markets Small Cap Fund : A and B shares classes
As from 8 July 2016 (day of first NAV calculation), POLUNIN FUNDS - Developing Countries Fund E share classes was launched.
As from 19 July 2016 (day of first NAV calculation), POLUNIN FUNDS - Developing Countries Fund D share classes was launched. Julian Garel-Jones is a Director of the Fund and a Director of the Investment Manager Polunin Capital Partners Limited. The 31 Founder Shares in the Fund were allotted and issued to the Investment Manager.
NOTE 2 – Significant accounting policies The financial statements of the Fund are prepared in accordance with generally accepted accounting principles and Luxembourg regulations relating to undertakings for collective investment in transferable securities. The consolidated financial statements of the Fund are prepared in USD and are the sum of the sub-funds' net assets. The reference currency of each sub-fund is USD.
2.1 The Fund, each sub-fund and each Class in a Sub-fund have a Net Asset Value determined in accordance with the Articles. The Reference Currency of the Fund is the USD. The Net Asset Value of each sub-fund and Class is calculated in the Reference Currency of the sub-fund or Class, as it is stipulated in the relevant Special Section of the prospectus, and is determined by the Central Administration for each Transaction Day as at each NAV Calculation Day as stipulated in the relevant Special Section of the prospectus, by calculating the aggregate of:
(a) the value of all assets of the Fund which are allocated to the relevant sub-fund and Class in accordance with the provisions of the Articles; less
(b) all the liabilities of the Fund which are allocated to the relevant sub-fund and Class in accordance with the provisions of the Articles, and all fees attributable to the relevant sub-fund and Class, for which fees have been accrued but are unpaid on the relevant Transaction Day.
2.2 The Net Asset Value per Share for a Transaction Day is calculated in the Reference Currency of the relevant sub-fund and is calculated by the Central Administration as at the NAV Calculation Day of the relevant sub-fund by dividing the Net Asset Value of the relevant sub-fund by the number of shares which are in issue on such Transaction Day in the relevant sub-fund (including Shares in relation to which a shareholder has requested redemption on such Transaction Day in relation to such NAV Calculation Day).
POLUNIN FUNDS
Notes to the financial statements as at 31 December 2016 (continued)
Page 35
NOTE 2 – Significant accounting policies (continued) 2.3 If the sub-fund has more than one Class in issue, the Central Administration will calculate the Net Asset Value per Share of each Class for a Transaction Day by dividing the portion of the Net Asset Value of the relevant sub-fund attributable to a particular Class by the number of Shares of such Class in the relevant sub-fund which are in issue on such Transaction Day (including Shares in relation to which a Shareholder has requested redemption on such Transaction Day in relation to such NAV Calculation Day). 2.4 The Net Asset Value per Share may be rounded up or down to the nearest whole hundredth share of the currency in which the Net Asset Value of the relevant Shares are calculated. 2.5 The allocation of assets and liabilities of the Fund between sub-funds (and within each sub-fund between the different Classes) is effected so that:
(a) The subscription price received by the Fund on the issue of Shares, and reductions in the value of the Fund as a consequence of the redemption of Shares, will be attributed to the Sub-fund (and within that sub-fund, the Class) to which the relevant Shares belong.
(b) Assets acquired by the Fund upon the investment of the subscription proceeds and income and capital appreciation in relation to such investments which relate to a specific sub-fund (and within a sub-fund, to a specific Class) will be attributed to such sub-fund (or Class in the sub-fund).
(c) Assets disposed of by the Fund as a consequence of the redemption of Shares and liabilities, expenses and capital depreciation relating to investments made by the Fund and other operations of the Fund, which relate to a specific sub-fund (and within a sub-fund, to a specific Class) will be attributed to such sub-fund (or Class in the sub-fund).
(d) Where the use of foreign exchange transactions, instruments or financial techniques relates to a specific sub-fund (and within a sub-fund, to a specific Class) the consequences of their use will be attributed to such sub-fund (or Class in the sub-fund).
(e) Where assets, income, capital appreciations, liabilities, expenses, capital depreciations or the use of foreign exchange transactions, instruments or techniques relate to more than one sub-fund (or within a sub-fund, to more than one Class), they will be attributed to such sub-funds (or Classes, as the case may be) in proportion to the extent to which they are attributable to each such sub-fund (or each such Class).
(f) Where assets, income, capital appreciations, liabilities, expenses, capital depreciations or the use of foreign exchange transactions, instruments or techniques cannot be attributed to a particular sub-fund, they will be divided equally between all sub-funds or, in so far as is justified by the amounts, will be attributed in proportion to the relative Net Asset Value of the sub-funds (or Classes in the sub-fund) if the Fund, in its sole discretion, determines that this is the most appropriate method of attribution.
(g) Upon payment of dividends to the Shareholders of a sub-fund (and within a sub-fund, to a specific Class) the net assets of this sub-fund (or Class in the sub-fund) are reduced by the amount of such dividend.
2.6 The assets of the Fund are valued as follows:
(a) Transferable Securities or Money Market Instruments quoted or traded on an official stock exchange or any other Regulated Market, are valued on the basis of the last known price, and, if the securities or money market instruments are listed on several stock exchanges or Regulated Markets, the last known price of the stock exchange which is the principal market for the security or Money Market Instrument in question, unless these prices are not representative.
(b) For Transferable Securities or Money Market Instruments not quoted or traded on an official stock exchange or any other Regulated Market, and for quoted Transferable Securities or Money Market Instruments, but for which the last known price is not representative, valuation is based on the probable sales price estimated prudently and in good faith by the Board of Directors of the Fund.
(c) Units and shares issued by UCITS (Undertakings for Collective Investment In Transferable Securities) or other UCIs (Undertakings for Collective Investment) will be valued at their last available net asset value.
(d) The liquidating value of forward or options contracts that are not traded on exchanges or on other Regulated Markets will be determined pursuant to the policies established in good faith by the Board of Directors of the Fund, on a basis consistently applied. The liquidating value of futures or options contracts traded on exchanges or on other Regulated Markets will be based upon the last available settlement prices of these contracts on exchanges and Regulated Markets on which the particular futures, forward or options contracts are traded; provided that if a futures, forward or options contract could not be liquidated on such Business Day with respect to which a Net Asset Value is being determined, then the basis for determining the liquidating value of such contract will be such value as the Board of Directors of the Fund may, in good faith and pursuant to verifiable valuation procedures, deem fair and reasonable.
POLUNIN FUNDS
Notes to the financial statements as at 31 December 2016 (continued)
Page 36
NOTE 2 – Significant accounting policies (continued)
(e) Liquid assets and Money Market Instruments with a maturity of less than twelve months may be valued at nominal value plus any accrued interest or using an amortised cost method (it being understood that the method which is more likely to represent the fair market value will be retained). This amortised cost method may result in periods during which the value deviates from the price the relevant Company would receive if it sold the investment. The Board of Directors of the Fund may, from time to time, assess this method of valuation and recommend changes, where necessary, to ensure that such assets will be valued at their fair value as determined in good faith pursuant to procedures established by the Board of Directors of the Fund. If the Board of Directors of the Fund believes that a deviation from the amortised cost per Share may result in material dilution or other unfair results to Shareholders, the Board of Directors of the Fund will take such corrective action, if any, as it deems appropriate, to eliminate or reduce, to the extent reasonably practicable, the dilution or unfair results.
(f) The swap transactions will be consistently valued based on a calculation of the net present value of their expected cash flows. For certain sub-funds using Over The Counter (“OTC”) Derivatives as part of their main Investment Policy, the valuation method of the OTC Derivative will be further specified in the relevant Special Section of the prospectus.
(g) Accrued interest on securities is included if it is not reflected in the Share price. (h) Cash is valued at nominal value, plus accrued interest. (i) All assets denominated in a currency other than the Reference Currency of the respective sub-fund/Class is
converted at the mid-market conversion rate between the Reference Currency and the currency of denomination. (j) All other securities and other permissible assets as well as any of the above mentioned assets for which the
valuation in accordance with the above sub-paragraphs would not be possible or practicable, or would not be representative of their probable realisation value, will be valued at probable realisation value, as determined with care and in good faith pursuant to procedures established by the Board of Directors of the Fund.
2.7 Warrants are valued with the last available price of the underlying security on the valuation date and, if this security is traded on several markets, on the basis of the last price known on the market considered to be the main market for trading this security.
If the last known price is not representative, the valuation will be based on the probable realisation value estimated by the Board of Directors of the Fund with prudence and in good faith.
2.8 Securities expressed in a currency other than USD are converted on the basis of exchange rates prevailing in Luxembourg on the relevant valuation date.
Assets and liabilities expressed in currencies other than USD are translated into USD at the year-end exchange rates.
Income and expenses in currencies other than USD are translated at the appropriate exchange rates prevailing at the transaction dates.
Net realised profits and losses arising on foreign exchange operations are recorded in the Statement of Operations and Changes in Net Assets.
As at 31 December 2016, the following exchange rates are used:
AED/USD 0.272264 IDR/USD 0.000074 RON/USD 0.232196 AUD/USD 0.724118 INR/USD 0.014734 RUB/USD 0.016382 BDT/USD 0.012723 JOD/USD 1.411414 SGD/USD 0.692184 BRL/USD 0.307248 KRW/USD 0.000828 THB/USD 0.027925 CAD/USD 0.745696 MAD/USD 0.098805 TRY/USD 0.284284 CHF/USD 0.983909 MXN/USD 0.048540 TWD/USD 0.031028 CNY/USD 0.143896 MYR/USD 0.222914 UAH/USD 0.036900 EGP/USD 0.055157 NGN/USD 0.003175 VND/USD 0.000044 EUR/USD 1.054750 NOK/USD 0.116175 ZAR/USD 0.073126 GBP/USD 1.235649 PHP/USD 0.020116 HKD/USD 0.128980 PKR/USD 0.009581 HUF/USD 0.003415 PLN/USD 0.239561
2.9 Dividends are recognised as income on the date securities are first quoted ex-dividend. Dividends are recorded net of any eventual withholding taxation. Interest is accrued for each net asset valuation.
POLUNIN FUNDS
Notes to the financial statements as at 31 December 2016 (continued)
Page 37
NOTE 2 – Significant accounting policies (continued) 2.10 The Investment Manager needs to undertake transactions in order to maintain the desired asset allocation as a result of subscriptions or redemptions, which may generate additional costs for the Fund and its Shareholders. As a consequence, in order to protect the existing investors’ interest from these capital movements, an adjustment of the NAV per share used is applied. This adjustment reflects the estimated tax and dealing costs that may be incurred by the Fund as a result of these transactions, and the estimated bid-offer spread of the assets in which the Fund invests. A periodic review is undertaken in order to verify the appropriateness of the swing factor being applied. The NAV per share as disclosed in the statistical information is the published NAV per share whereas the total net assets disclosed in the Statement of Net Assets is the total net asset value excluding any year end swing adjustment. As at year end, swing pricing was applied on the NAV per share of both POLUNIN FUNDS - Developing Countries Fund and POLUNIN FUNDS - Emerging Markets Small Cap Fund. 2.11 The net realised profit or loss on sales of securities portfolio is the difference between the historical average cost of the investment and the sales proceeds. The net realised profit or loss on sales of investment is shown in the Statement of Operations and Changes in Net Assets as “Movement in net unrealised appreciation/depreciation on securities portfolio”. 2.12 The transaction fees, i.e. fees charged by the brokers and the Depositary for securities transactions and similar transactions, are recorded separately in the Statement of Operations and Changes in Net Assets.
NOTE 3 – Subscription tax (“Taxe d’abonnement”) Under current Law and practice, the Fund is not liable to any Luxembourg income tax, nor are dividends (if any) paid by the Fund liable to any Luxembourg withholding tax. The Fund is liable in Luxembourg to a subscription tax (taxe d’abonnement) of 0.05% per annum of its net assets attributable to the shares of each sub-fund (except for sub-funds or classes which are reserved to Institutional Investors or UCIs which are subject to a tax at a reduced rate of 0.01% per annum of its net assets). Such tax is payable quarterly and calculated on the net asset value of the relevant class at the end of the relevant quarter. To the extent that the assets of the Fund are invested in underlying investment funds which are undertakings for collective investment established in Luxembourg, no such tax is payable, if already taxed elsewhere.
NOTE 4 – Management and Performance fees The Fund pays a management fee quarterly in arrears to the Investment Manager and the Investment Adviser applied on each sub-fund’s net assets. This management fee includes the following maximum annual rates:
Class A Shares
Class B Shares
Class C Shares
Class D Shares
Class E Shares
POLUNIN FUNDS - Developing Countries Fund
1.50% 1.00% 0.90% 1.50% 1.50%
Investment Manager Fee 0.90% 0.60% 0.54% 0.90% 0.90%* Investment Advisor Fee 0.60% 0.40% 0.36% 0.60% 0.60%
POLUNIN FUNDS - Emerging Markets Small Cap Fund
1.50% 1.375% Not active Not active Not active
Investment Manager Fee 0.90% 0.825% - - - Investment Advisor Fee 0.60% 0.55% - - -
In addition, the Investment Manager is entitled to receive performance fees which correspond to 10% (6% in the case of the Investment Manager + 4% in the case of the Investment Advisor of the Net Profit above the Hurdle Rate and provided that the return is above the High Water Mark) of any excess return over the Hurdle Rate. The Hurdle Rate is the calendar quarter return of the following:
• MSCI Emerging Markets Free Index in USD for Class A shares and Class B Shares of the sub-fund POLUNIN FUNDS - Developing Countries Fund, the MSCI Emerging Markets Index in EUR for Class D shares of the sub-fund POLUNIN FUNDS - Developing Countries Fund.
* The Investment Management Fee for the Class E shares is waived in accordance with the Resolution of the Board of Directors.
POLUNIN FUNDS
Notes to the financial statements as at 31 December 2016 (continued)
Page 38
NOTE 4 – Management and Performance fees (continued)
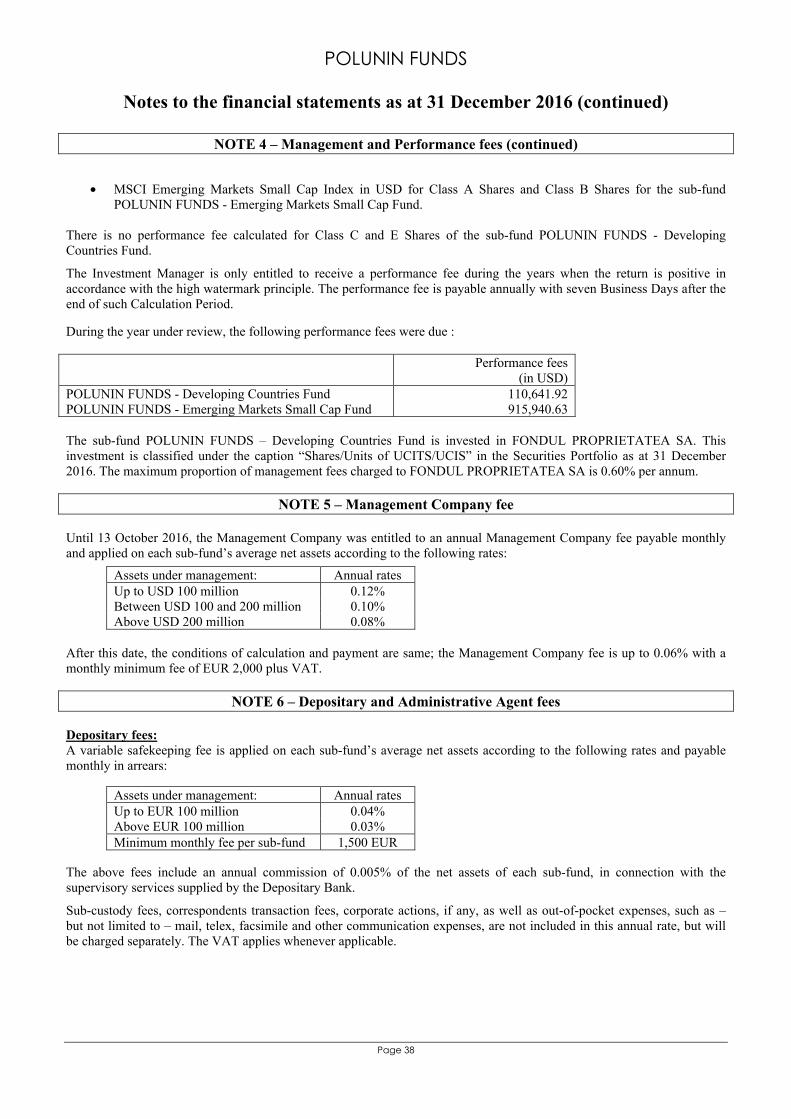
• MSCI Emerging Markets Small Cap Index in USD for Class A Shares and Class B Shares for the sub-fund POLUNIN FUNDS - Emerging Markets Small Cap Fund.
There is no performance fee calculated for Class C and E Shares of the sub-fund POLUNIN FUNDS - Developing Countries Fund.
The Investment Manager is only entitled to receive a performance fee during the years when the return is positive in accordance with the high watermark principle. The performance fee is payable annually with seven Business Days after the end of such Calculation Period. During the year under review, the following performance fees were due : Performance fees
(in USD) POLUNIN FUNDS - Developing Countries Fund 110,641.92 POLUNIN FUNDS - Emerging Markets Small Cap Fund 915,940.63 The sub-fund POLUNIN FUNDS – Developing Countries Fund is invested in FONDUL PROPRIETATEA SA. This investment is classified under the caption “Shares/Units of UCITS/UCIS” in the Securities Portfolio as at 31 December 2016. The maximum proportion of management fees charged to FONDUL PROPRIETATEA SA is 0.60% per annum.
NOTE 5 – Management Company fee Until 13 October 2016, the Management Company was entitled to an annual Management Company fee payable monthly and applied on each sub-fund’s average net assets according to the following rates:
Assets under management: Annual rates Up to USD 100 million 0.12% Between USD 100 and 200 million 0.10% Above USD 200 million 0.08%
After this date, the conditions of calculation and payment are same; the Management Company fee is up to 0.06% with a monthly minimum fee of EUR 2,000 plus VAT.
NOTE 6 – Depositary and Administrative Agent fees Depositary fees: A variable safekeeping fee is applied on each sub-fund’s average net assets according to the following rates and payable monthly in arrears:
Assets under management: Annual rates Up to EUR 100 million 0.04% Above EUR 100 million 0.03% Minimum monthly fee per sub-fund 1,500 EUR
The above fees include an annual commission of 0.005% of the net assets of each sub-fund, in connection with the supervisory services supplied by the Depositary Bank.
Sub-custody fees, correspondents transaction fees, corporate actions, if any, as well as out-of-pocket expenses, such as – but not limited to – mail, telex, facsimile and other communication expenses, are not included in this annual rate, but will be charged separately. The VAT applies whenever applicable.
POLUNIN FUNDS
Notes to the financial statements as at 31 December 2016 (continued)
Page 39
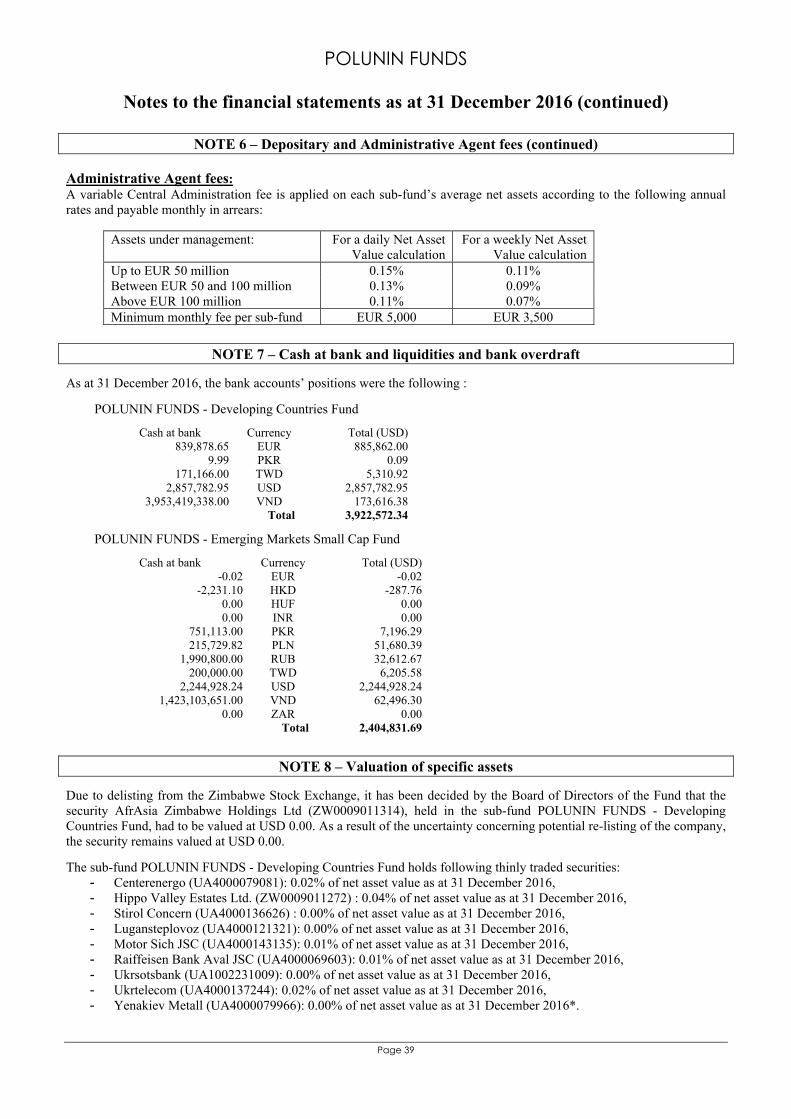
NOTE 6 – Depositary and Administrative Agent fees (continued) Administrative Agent fees: A variable Central Administration fee is applied on each sub-fund’s average net assets according to the following annual rates and payable monthly in arrears:
Assets under management: For a daily Net Asset Value calculation
For a weekly Net Asset Value calculation
Up to EUR 50 million 0.15% 0.11% Between EUR 50 and 100 million 0.13% 0.09% Above EUR 100 million 0.11% 0.07% Minimum monthly fee per sub-fund EUR 5,000 EUR 3,500
NOTE 7 – Cash at bank and liquidities and bank overdraft
As at 31 December 2016, the bank accounts’ positions were the following :
POLUNIN FUNDS - Developing Countries Fund
Cash at bank Currency Total (USD) 839,878.65 EUR 885,862.00
9.99 PKR 0.09 171,166.00 TWD 5,310.92
2,857,782.95 USD 2,857,782.95 3,953,419,338.00 VND 173,616.38
Total 3,922,572.34
POLUNIN FUNDS - Emerging Markets Small Cap Fund
Cash at bank Currency Total (USD) -0.02 EUR -0.02
-2,231.10 HKD -287.76 0.00 HUF 0.00 0.00 INR 0.00
751,113.00 PKR 7,196.29 215,729.82 PLN 51,680.39
1,990,800.00 RUB 32,612.67 200,000.00 TWD 6,205.58
2,244,928.24 USD 2,244,928.24 1,423,103,651.00 VND 62,496.30
0.00 ZAR 0.00 Total 2,404,831.69
NOTE 8 – Valuation of specific assets Due to delisting from the Zimbabwe Stock Exchange, it has been decided by the Board of Directors of the Fund that the security AfrAsia Zimbabwe Holdings Ltd (ZW0009011314), held in the sub-fund POLUNIN FUNDS - Developing Countries Fund, had to be valued at USD 0.00. As a result of the uncertainty concerning potential re-listing of the company, the security remains valued at USD 0.00. The sub-fund POLUNIN FUNDS - Developing Countries Fund holds following thinly traded securities:
- Centerenergo (UA4000079081): 0.02% of net asset value as at 31 December 2016, - Hippo Valley Estates Ltd. (ZW0009011272) : 0.04% of net asset value as at 31 December 2016, - Stirol Concern (UA4000136626) : 0.00% of net asset value as at 31 December 2016, - Lugansteplovoz (UA4000121321): 0.00% of net asset value as at 31 December 2016, - Motor Sich JSC (UA4000143135): 0.01% of net asset value as at 31 December 2016, - Raiffeisen Bank Aval JSC (UA4000069603): 0.01% of net asset value as at 31 December 2016, - Ukrsotsbank (UA1002231009): 0.00% of net asset value as at 31 December 2016, - Ukrtelecom (UA4000137244): 0.02% of net asset value as at 31 December 2016, - Yenakiev Metall (UA4000079966): 0.00% of net asset value as at 31 December 2016*.
POLUNIN FUNDS
Notes to the financial statements as at 31 December 2016 (continued)
Page 40
NOTE 8 – Valuation of specific assets (continued) The shares are being traded on the local stock exchanges. Since the trade volumes are low, the larger trades may lead to price changes beyond the normal range. Potential sale prices may diverge from the recently observed market price. HippoValley is valued with price as of 23 December 2016. The sub-fund POLUNIN FUNDS - Emerging Markets Small Cap Fund holds following thinly traded securities:
- Azovstal Iron and Steel works (UA4000075758) : 0.00% of net asset value as at 31 December 2016*, - Centerenergo (UA4000079081): 0.12% of net asset value as at 31 December 2016, - Samudera Indonesia Tbk, PT (ID1000075906) : 0.12% of net asset value as at 31 December 2016, - Stirol Concern (UA4000136626) : 0.00% of net asset value as at 31 December 2016, - Krukivsky Carriage Works (UA4000074058) : 0.02% of net asset value as at 31 December 2016, - Motor Sich GDR 1/10TH REG-S (US6200501046) : 0.05% of net asset value as at 31 December 2016, - Ukrtelecom (UA4000137244): 0.01% of net asset value as at 31 December 2016.
The shares are being traded on the local stock exchanges. Since the trade volumes are low, the larger trades may lead to price changes beyond the normal range. Potential sale prices may diverge from the recently observed market price. * Those investments are valued with nil due to delisting of the investment.
NOTE 9 – Changes in the securities portfolio statement The report on the changes in the securities portfolio statement is available free of charge upon request at the registered office of the Fund.
NOTE 10 – Other liabilities Other liabilities disclosed in the Statement of Net Assets for the total amount of 170,711.72 USD are mainly composed of Management Company fees, Net Asset Value calculation fees, Audit fees and Depositary fees.
NOTE 11 – Other expenses This account includes mainly general ongoing expenses. Other expenses disclosed in the Statement of Operations and Changes in Net Assets for the total amount of 169,501.55 USD are mainly composed of risk management, consultants and Paying Agent fees.
NOTE 12 – Stock Exchange Listing The share class A of POLUNIN FUNDS - Developing Countries Fund is listed at the Luxembourg Stock Exchange and has been since 31 December 2015.
NOTE 13 – Subsequent Event As at 31 December 2016, CACEIS Bank Luxembourg changed its name and became CACEIS Bank, Luxembourg Branch with effective date 1 January 2017. The Management Company, with the approval and upon recommendation of the Fund, has delegated CACEIS Bank, Luxembourg Branch as the Administrative Agent, Domiciliary Agent, Registrar and Transfer Agent, Depositary and Paying Agent functions effective 1 January 2017.
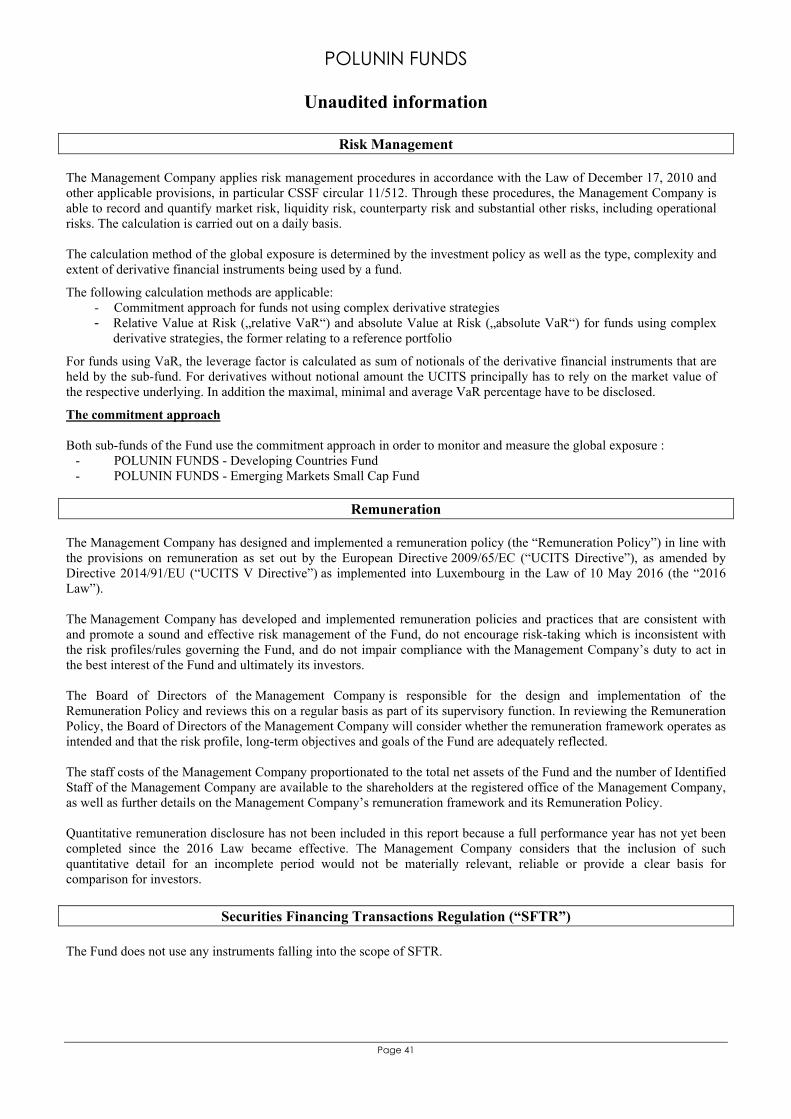
POLUNIN FUNDS
Unaudited information
Page 41
Risk Management The Management Company applies risk management procedures in accordance with the Law of December 17, 2010 and other applicable provisions, in particular CSSF circular 11/512. Through these procedures, the Management Company is able to record and quantify market risk, liquidity risk, counterparty risk and substantial other risks, including operational risks. The calculation is carried out on a daily basis.
The calculation method of the global exposure is determined by the investment policy as well as the type, complexity and extent of derivative financial instruments being used by a fund.
The following calculation methods are applicable: - Commitment approach for funds not using complex derivative strategies - Relative Value at Risk („relative VaR“) and absolute Value at Risk („absolute VaR“) for funds using complex
derivative strategies, the former relating to a reference portfolio
For funds using VaR, the leverage factor is calculated as sum of notionals of the derivative financial instruments that are held by the sub-fund. For derivatives without notional amount the UCITS principally has to rely on the market value of the respective underlying. In addition the maximal, minimal and average VaR percentage have to be disclosed.
The commitment approach
Both sub-funds of the Fund use the commitment approach in order to monitor and measure the global exposure : - POLUNIN FUNDS - Developing Countries Fund - POLUNIN FUNDS - Emerging Markets Small Cap Fund
Remuneration The Management Company has designed and implemented a remuneration policy (the “Remuneration Policy”) in line with the provisions on remuneration as set out by the European Directive 2009/65/EC (“UCITS Directive”), as amended by Directive 2014/91/EU (“UCITS V Directive”) as implemented into Luxembourg in the Law of 10 May 2016 (the “2016 Law”). The Management Company has developed and implemented remuneration policies and practices that are consistent with and promote a sound and effective risk management of the Fund, do not encourage risk-taking which is inconsistent with the risk profiles/rules governing the Fund, and do not impair compliance with the Management Company’s duty to act in the best interest of the Fund and ultimately its investors. The Board of Directors of the Management Company is responsible for the design and implementation of the Remuneration Policy and reviews this on a regular basis as part of its supervisory function. In reviewing the Remuneration Policy, the Board of Directors of the Management Company will consider whether the remuneration framework operates as intended and that the risk profile, long-term objectives and goals of the Fund are adequately reflected. The staff costs of the Management Company proportionated to the total net assets of the Fund and the number of Identified Staff of the Management Company are available to the shareholders at the registered office of the Management Company, as well as further details on the Management Company’s remuneration framework and its Remuneration Policy. Quantitative remuneration disclosure has not been included in this report because a full performance year has not yet been completed since the 2016 Law became effective. The Management Company considers that the inclusion of such quantitative detail for an incomplete period would not be materially relevant, reliable or provide a clear basis for comparison for investors.
Securities Financing Transactions Regulation (“SFTR”) The Fund does not use any instruments falling into the scope of SFTR.