policy reform to lower sugar prices in indonesia · commodity market coordinated by commodity...
TRANSCRIPT

by Novani Karina Saputri and Hizkia Respatiadi
Policy Reform to LowerSugar Prices in Indonesia
Policy Reform to Lower Sugar Prices in Indonesia
Author:
Novani Karina Saputri
Hizkia Respatiadi
Center for Indonesian Policy Studies (CIPS)
Jakarta, Indonesia
October, 2018
Copyright © 2018 by Center for Indonesian Policy Studies
4
Executive Summary
In the first half of 2018, sugarcane productivity in Indonesia decreased by 2.56 tonnes/ha while the extraction rate fell by 0.36 percentage point compared to 2017. Meanwhile, the demand for sugar is growing steadily, as indicated by an increase in per capita consumption of more than 22% from 2009 to 2017. The combination of lower productivity and higher demand contributes to high prices for white crystal sugar—the domestic price was nearly three times the international market price in August 2018.
High prices impact both private consumers and the food and beverages (F&B) industry. They also affect agricultural workers in general because two-thirds of them are net food consumers paying these higher prices. Government programs to improve domestic productivity via regulations by the Minister of Agriculture (MOA) 53/2015 and Minister of Industry (MOI) 50/2012 have not achieved their intended results.
The implementation of import quotas and limiting licenses to state-owned enterprises (SOEs), as stipulated in the regulation of the Minister of Trade (MOT) 117/2015, aggravates the situation. Restricting entry to the market through a non-transparent import licensing process contributes to Indonesia’s uncompetitive sugar market. As a result, imports cannot lower sugar prices to help the consumers in Indonesia.
We propose a two-step policy reform to lower sugar prices that provides sufficient time for relevant stakeholders to adjust to the new policies. First, within five years, the government should revise MOT 117/2015 Article 5 (2) on import licensing to allow qualified private sector companies to import sugar. This revision must include a more transparent licensing process to prevent cartel practices by either SOEs or private importers. Consumers will enjoy more options when buying sugar thanks to the increasing number of importers. In this first stage of reform, the quantity of sugar imported will remain under government control to limit the impact of the reform on sugarcane prices for the domestic farmers.
The first stage might be insufficient to address the competing goals of lowering sugar prices for consumers and keeping sugarcane prices high to protect farmers. This is why a second stage of reform is necessary. In the first ten years of reform, the government must provide support for restructuring the practices and upgrading the technology used by farmers and sugar milling factories. This support must be accompanied by a specific target for increased productivity. After these first ten years, the government should remove the import quota stipulated in MOT 117/2015 Article 3, allowing imports to satisfy domestic market demand. This timeframe should provide sugarcane farmers and the national sugar industry with sufficient time to prepare for competition with imported sugar. These reforms will result in a more competitive sugar market with lower sugar prices for Indonesian consumers.
5
Current Situation
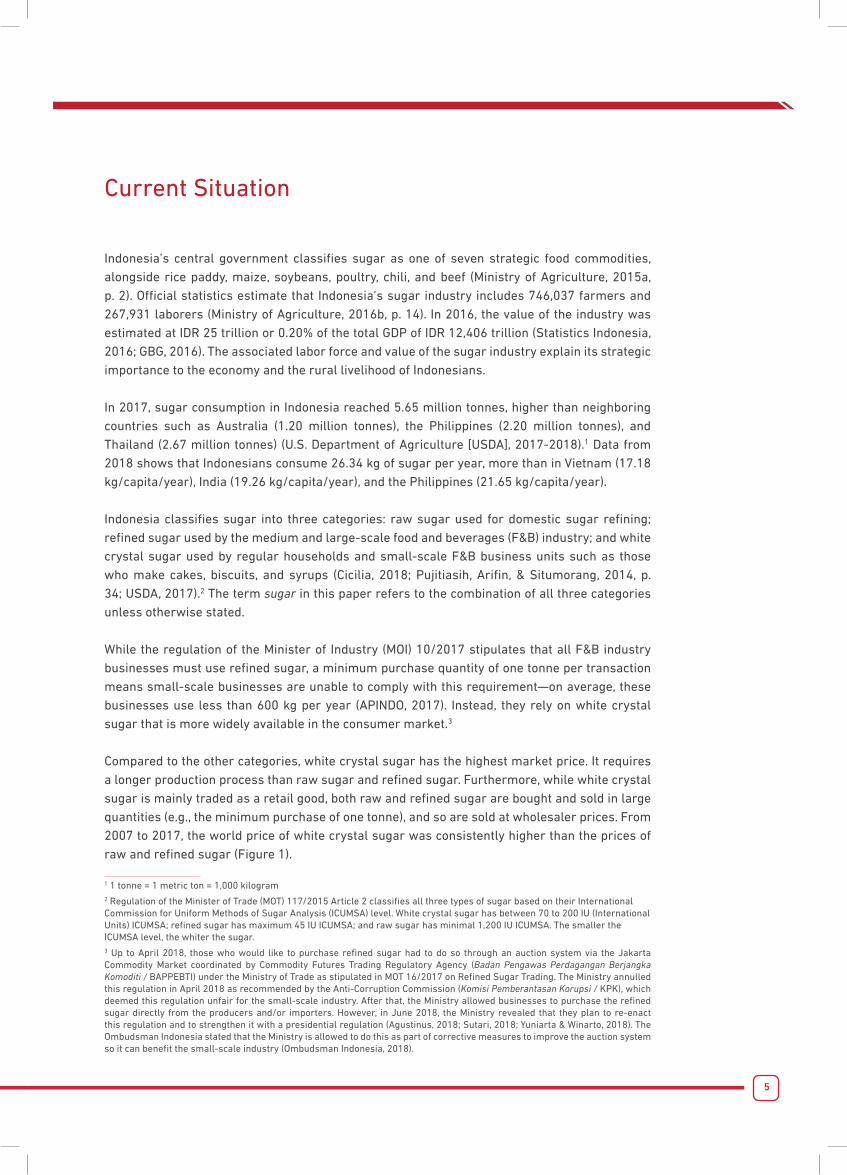
Indonesia’s central government classifies sugar as one of seven strategic food commodities, alongside rice paddy, maize, soybeans, poultry, chili, and beef (Ministry of Agriculture, 2015a, p. 2). Official statistics estimate that Indonesia’s sugar industry includes 746,037 farmers and 267,931 laborers (Ministry of Agriculture, 2016b, p. 14). In 2016, the value of the industry was estimated at IDR 25 trillion or 0.20% of the total GDP of IDR 12,406 trillion (Statistics Indonesia, 2016; GBG, 2016). The associated labor force and value of the sugar industry explain its strategic importance to the economy and the rural livelihood of Indonesians.
In 2017, sugar consumption in Indonesia reached 5.65 million tonnes, higher than neighboring countries such as Australia (1.20 million tonnes), the Philippines (2.20 million tonnes), and Thailand (2.67 million tonnes) (U.S. Department of Agriculture [USDA], 2017-2018).1 Data from 2018 shows that Indonesians consume 26.34 kg of sugar per year, more than in Vietnam (17.18 kg/capita/year), India (19.26 kg/capita/year), and the Philippines (21.65 kg/capita/year).
Indonesia classifies sugar into three categories: raw sugar used for domestic sugar refining; refined sugar used by the medium and large-scale food and beverages (F&B) industry; and white crystal sugar used by regular households and small-scale F&B business units such as those who make cakes, biscuits, and syrups (Cicilia, 2018; Pujitiasih, Arifin, & Situmorang, 2014, p. 34; USDA, 2017).2 The term sugar in this paper refers to the combination of all three categories unless otherwise stated.
While the regulation of the Minister of Industry (MOI) 10/2017 stipulates that all F&B industry businesses must use refined sugar, a minimum purchase quantity of one tonne per transaction means small-scale businesses are unable to comply with this requirement—on average, these businesses use less than 600 kg per year (APINDO, 2017). Instead, they rely on white crystal sugar that is more widely available in the consumer market.3
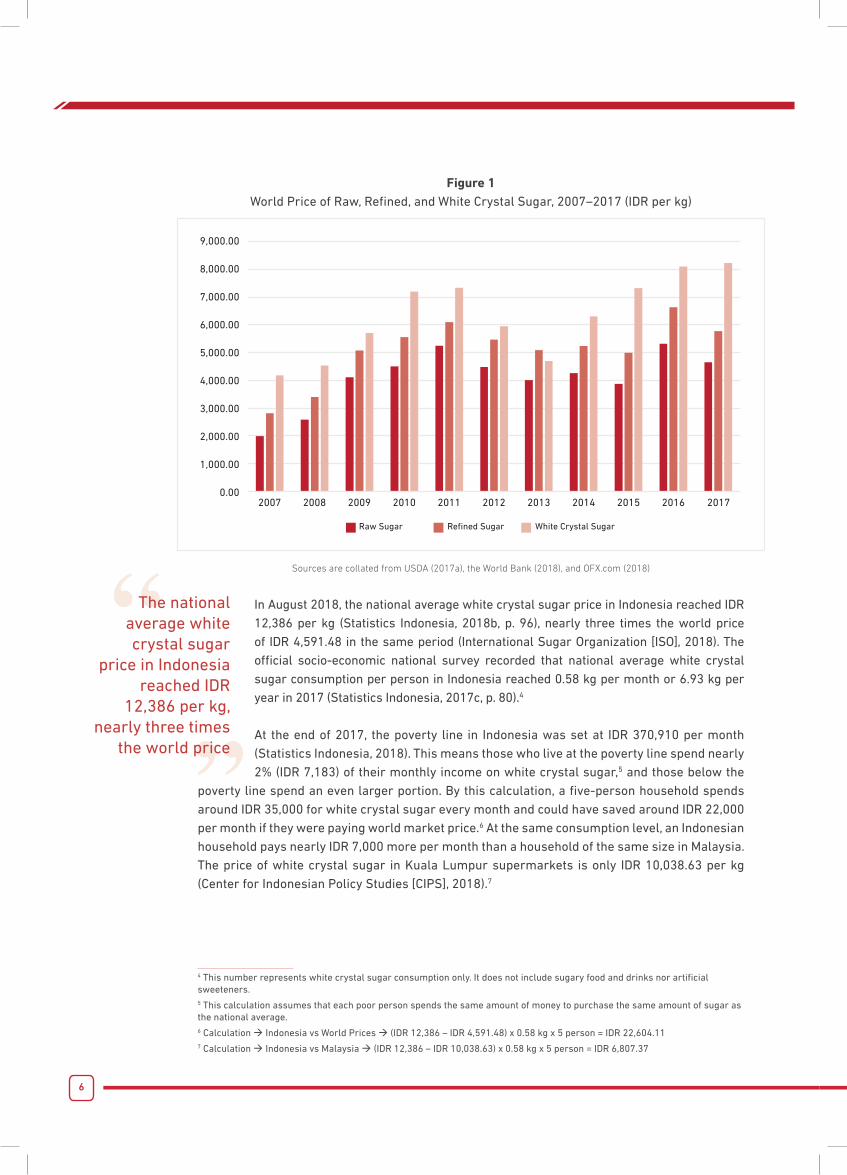
Compared to the other categories, white crystal sugar has the highest market price. It requires a longer production process than raw sugar and refined sugar. Furthermore, while white crystal sugar is mainly traded as a retail good, both raw and refined sugar are bought and sold in large quantities (e.g., the minimum purchase of one tonne), and so are sold at wholesaler prices. From 2007 to 2017, the world price of white crystal sugar was consistently higher than the prices of raw and refined sugar (Figure 1).
1 1 tonne = 1 metric ton = 1,000 kilogram2 Regulation of the Minister of Trade (MOT) 117/2015 Article 2 classifies all three types of sugar based on their International Commission for Uniform Methods of Sugar Analysis (ICUMSA) level. White crystal sugar has between 70 to 200 IU (International Units) ICUMSA; refined sugar has maximum 45 IU ICUMSA; and raw sugar has minimal 1,200 IU ICUMSA. The smaller the ICUMSA level, the whiter the sugar.3 Up to April 2018, those who would like to purchase refined sugar had to do so through an auction system via the Jakarta Commodity Market coordinated by Commodity Futures Trading Regulatory Agency (Badan Pengawas Perdagangan Berjangka Komoditi / BAPPEBTI) under the Ministry of Trade as stipulated in MOT 16/2017 on Refined Sugar Trading. The Ministry annulled this regulation in April 2018 as recommended by the Anti-Corruption Commission (Komisi Pemberantasan Korupsi / KPK), which deemed this regulation unfair for the small-scale industry. After that, the Ministry allowed businesses to purchase the refined sugar directly from the producers and/or importers. However, in June 2018, the Ministry revealed that they plan to re-enact this regulation and to strengthen it with a presidential regulation (Agustinus, 2018; Sutari, 2018; Yuniarta & Winarto, 2018). The Ombudsman Indonesia stated that the Ministry is allowed to do this as part of corrective measures to improve the auction system so it can benefit the small-scale industry (Ombudsman Indonesia, 2018).
6
Figure 1World Price of Raw, Refined, and White Crystal Sugar, 2007–2017 (IDR per kg)
2017
9,000.00
8,000.00
7,000.00
6,000.00
5,000.00
4,000.00
3,000.00
2,000.00
1,000.00
0.002007 2008 2009
Raw Sugar Refined Sugar White Crystal Sugar
2010 2011 2012 2013 2014 2015 2016
Sources are collated from USDA (2017a), the World Bank (2018), and OFX.com (2018)
In August 2018, the national average white crystal sugar price in Indonesia reached IDR 12,386 per kg (Statistics Indonesia, 2018b, p. 96), nearly three times the world price of IDR 4,591.48 in the same period (International Sugar Organization [ISO], 2018). The official socio-economic national survey recorded that national average white crystal sugar consumption per person in Indonesia reached 0.58 kg per month or 6.93 kg per year in 2017 (Statistics Indonesia, 2017c, p. 80).4
At the end of 2017, the poverty line in Indonesia was set at IDR 370,910 per month (Statistics Indonesia, 2018). This means those who live at the poverty line spend nearly 2% (IDR 7,183) of their monthly income on white crystal sugar,5 and those below the
poverty line spend an even larger portion. By this calculation, a five-person household spends around IDR 35,000 for white crystal sugar every month and could have saved around IDR 22,000 per month if they were paying world market price.6 At the same consumption level, an Indonesian household pays nearly IDR 7,000 more per month than a household of the same size in Malaysia. The price of white crystal sugar in Kuala Lumpur supermarkets is only IDR 10,038.63 per kg (Center for Indonesian Policy Studies [CIPS], 2018).7
4 This number represents white crystal sugar consumption only. It does not include sugary food and drinks nor artificial sweeteners.5 This calculation assumes that each poor person spends the same amount of money to purchase the same amount of sugar as the national average.6 Calculation Indonesia vs World Prices (IDR 12,386 – IDR 4,591.48) x 0.58 kg x 5 person = IDR 22,604.117 Calculation Indonesia vs Malaysia (IDR 12,386 – IDR 10,038.63) x 0.58 kg x 5 person = IDR 6,807.37
The national average white crystal sugar
price in Indonesia reached IDR
12,386 per kg, nearly three times
the world price
7
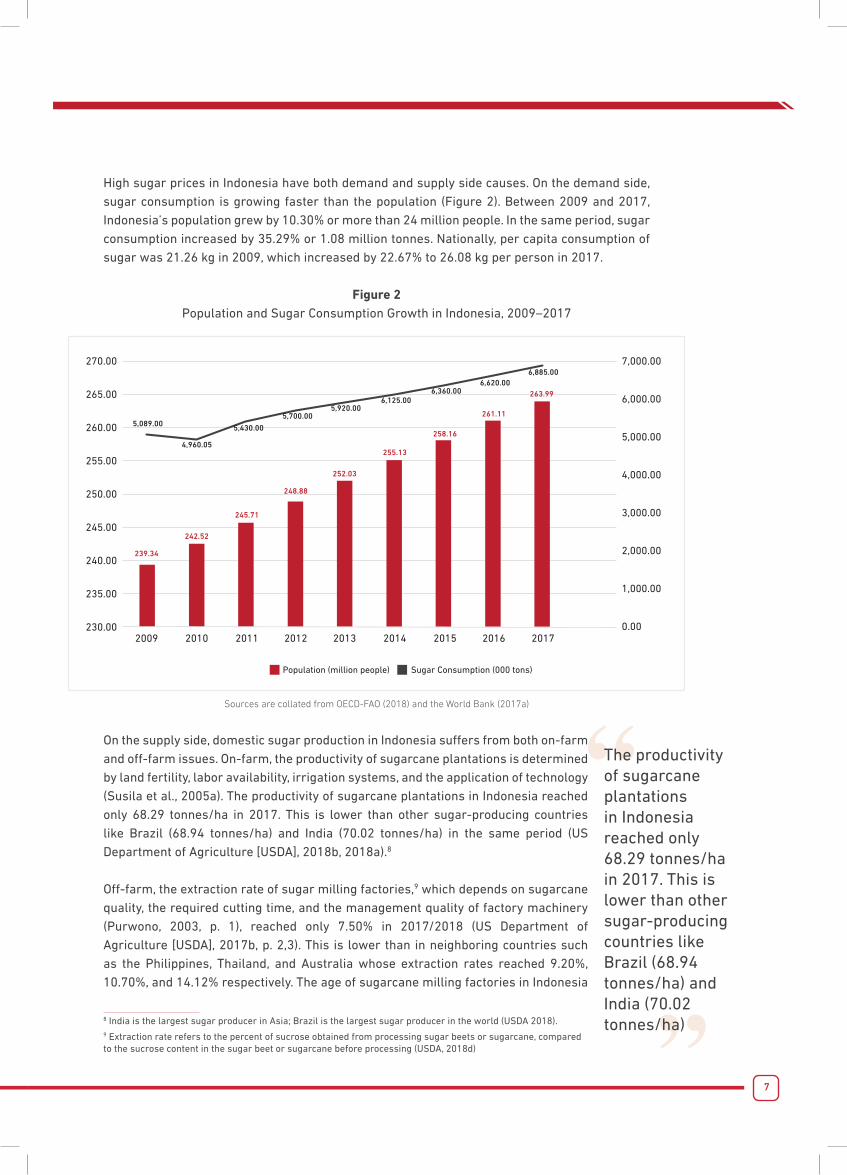
High sugar prices in Indonesia have both demand and supply side causes. On the demand side, sugar consumption is growing faster than the population (Figure 2). Between 2009 and 2017, Indonesia’s population grew by 10.30% or more than 24 million people. In the same period, sugar consumption increased by 35.29% or 1.08 million tonnes. Nationally, per capita consumption of sugar was 21.26 kg in 2009, which increased by 22.67% to 26.08 kg per person in 2017.
Figure 2Population and Sugar Consumption Growth in Indonesia, 2009–2017
2017
263.99
6,885.00270.00
265.00
260.00
255.00
250.00
245.00
240.00
235.00
230.00
7,000.00
6,000.00
5,000.00
4,000.00
3,000.00
2,000.00
1,000.00
0.002009
239.34
5,089.00
2010
242.52
4,960.05
2011
245.71
5,430.00
2012
248.88
5,700.00
2013
252.03
5,920.00
2014
255.13
6,125.00
2015
258.16
6,360.00
2016
261.11
6,620.00
Population (million people) Sugar Consumption (000 tons)
Sources are collated from OECD-FAO (2018) and the World Bank (2017a)
On the supply side, domestic sugar production in Indonesia suffers from both on-farm and off-farm issues. On-farm, the productivity of sugarcane plantations is determined by land fertility, labor availability, irrigation systems, and the application of technology (Susila et al., 2005a). The productivity of sugarcane plantations in Indonesia reached only 68.29 tonnes/ha in 2017. This is lower than other sugar-producing countries like Brazil (68.94 tonnes/ha) and India (70.02 tonnes/ha) in the same period (US Department of Agriculture [USDA], 2018b, 2018a).8
Off-farm, the extraction rate of sugar milling factories,9 which depends on sugarcane quality, the required cutting time, and the management quality of factory machinery (Purwono, 2003, p. 1), reached only 7.50% in 2017/2018 (US Department of Agriculture [USDA], 2017b, p. 2,3). This is lower than in neighboring countries such as the Philippines, Thailand, and Australia whose extraction rates reached 9.20%, 10.70%, and 14.12% respectively. The age of sugarcane milling factories in Indonesia
8 India is the largest sugar producer in Asia; Brazil is the largest sugar producer in the world (USDA 2018).9 Extraction rate refers to the percent of sucrose obtained from processing sugar beets or sugarcane, compared to the sucrose content in the sugar beet or sugarcane before processing (USDA, 2018d)
The productivity of sugarcane plantations in Indonesia reached only 68.29 tonnes/ha in 2017. This is lower than other sugar-producing countries like Brazil (68.94 tonnes/ha) and India (70.02 tonnes/ha)
8
contributes to their low extraction rate. Of 63 factories in the country, approximately 40 are over 100 years old, and the oldest one is 184 years old (2017b, p. 4).
The age of sugarcane milling factories in Indonesia contributes to their low extraction rate. Of 63 factories in the
country, approximately 40 are over 100 years old, and the oldest one is 184 years old
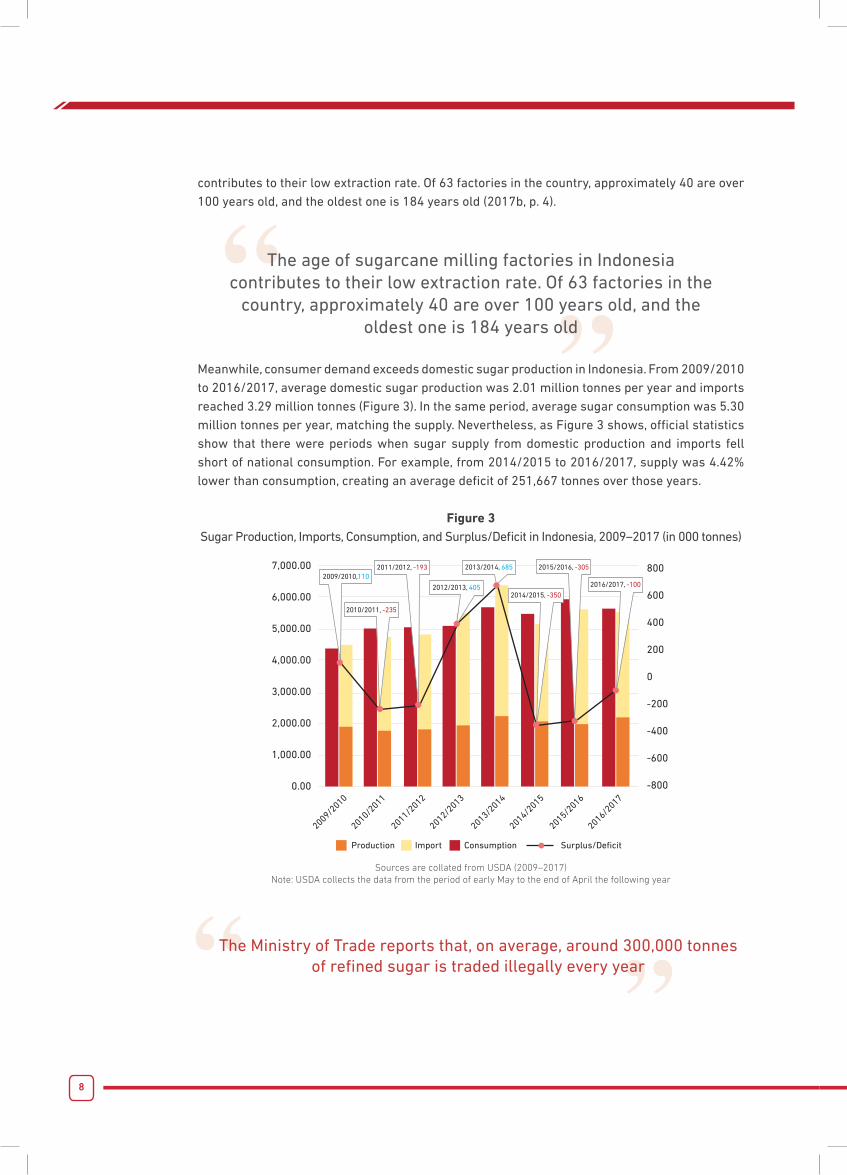
Meanwhile, consumer demand exceeds domestic sugar production in Indonesia. From 2009/2010 to 2016/2017, average domestic sugar production was 2.01 million tonnes per year and imports reached 3.29 million tonnes (Figure 3). In the same period, average sugar consumption was 5.30 million tonnes per year, matching the supply. Nevertheless, as Figure 3 shows, official statistics show that there were periods when sugar supply from domestic production and imports fell short of national consumption. For example, from 2014/2015 to 2016/2017, supply was 4.42% lower than consumption, creating an average deficit of 251,667 tonnes over those years.
Figure 3Sugar Production, Imports, Consumption, and Surplus/Deficit in Indonesia, 2009–2017 (in 000 tonnes)
7,000.00
6,000.00
5,000.00
4,000.00
3,000.00
2,000.00
1,000.00
0.00
2009/2010
2010/2011
2011/2012
2012/2013
2013/2014
2014/2015
2015/2016
2016/2017
Production Import Consumption Surplus/Deficit
800
600
400
200
0
-200
-400
-600
-800
2015/2016, -305
2016/2017, -100
2013/2014, 685
2014/2015, -350
2011/2012, -193
2012/2013, 405
2009/2010,110
2010/2011, -235
Sources are collated from USDA (2009–2017)Note: USDA collects the data from the period of early May to the end of April the following year
The Ministry of Trade reports that, on average, around 300,000 tonnes of refined sugar is traded illegally every year
9
According to those in the sugar industry, the deficit was caused by a lack of clarity about the quantity of remaining stock (before production and import) at the beginning of each time period (Former Representative of PT. RNI, 2018; Representative of PT. OI & PT. KTM, 2018).10 Refined sugar intended for industry use was siphoned into the consumer market and sold as white crystal sugar at the higher price of white crystal sugar. This illegal practice contributed to the lack of clarity in available data because it created “phantom stock” that was not recorded in the official statistics. The Ministry of Trade reports that, on average, around 300,000 tonnes of refined sugar is traded illegally every year (Idris, 2017; Primadhyta, 2017; Safutra, 2017).
10 The name of interviewee remains anonymous for privacy reasons.
10
Existing Policies
1. On-farm and off-farm policiesThe Indonesian government has two ministerial regulations aimed at increasing domestic sugar productivity. The regulation of the Minister of Agriculture (MOA) 53/2015 focuses on improving on-farm practices by improving sugarcane cultivation techniques through the development of prime types of sugarcane varieties, estimation of the best planting periods, and dissemination of information about good planting practices. This regulation also works to ensure the welfare of sugarcane farmers and sugar milling factory workers by providing them with healthcare insurance, food and beverages, and, when necessary, medical treatments.
Off-farm, the government implements MOI 50/2012, which stipulates that the central government provide financial support for state-owned sugar milling factories to fully or partially replace and/or repair their machinery and provide technological upgrades as part of a revitalization program (Article 3 (1)). In 2018, the government allocated IDR 8.6 billion of the state budget to this program, along with revitalization of machinery for forestry and other plantation products, including timber and palm oil (Ministry of Industry, 2017, p. 67).
2. International trade policiesThe Indonesian government imposes Minister of Trade (MOT) regulation 117/2015, which aims to use imports to stabilize sugar prices (Article 4). By implementing this regulation, the government controls the quantity of sugar imported and tries to maintain a difficult balance between affordable prices for consumers and profitable production for domestic sugar producers. Article 3 of the regulation stipulates that the quantity of imported sugar is determined through the ministerial coordination meeting. Meanwhile, Article 5 (2) states that sugar import licenses are reserved for state-owned enterprises (SOEs) with a General Importer Identification Number (API-U).
11
Analysis
Ideal Cultivation Practices for Sugarcane in IndonesiaAccording to the Good Agricultural Practices guideline published by the Ministry of Agriculture (2015b, p. 7), sugarcane in Indonesia can grow in either irrigated or rain-fed farmland. A majority (57%) of farmland is irrigated, while 36% is rain-fed type and the rest (7%) is river-based (Ministry of Agriculture, 2016a, pp. 9–10). For irrigated sugarcane plantations, planting is ideally conducted near the start of or during the dry season, between April and August.11 Ideal planting for rain-fed sugarcane takes place between September and November, near the end of dry season and up to the beginning of rainy season.12
The harvest should be conducted at least 11 months after planting when sugarcane has reached a minimum height of two meters (Indrawanto, Purwono, Siswanto, Syakir, & Rumini, 2010, p. 9). During the harvest period, the less rainfall the better. High rainfall causes water to seep into the sugarcane stalk, reducing its sucrose content (Department of Agriculture, Forestry, and Fisheries of South Africa, 2014, p. 21).
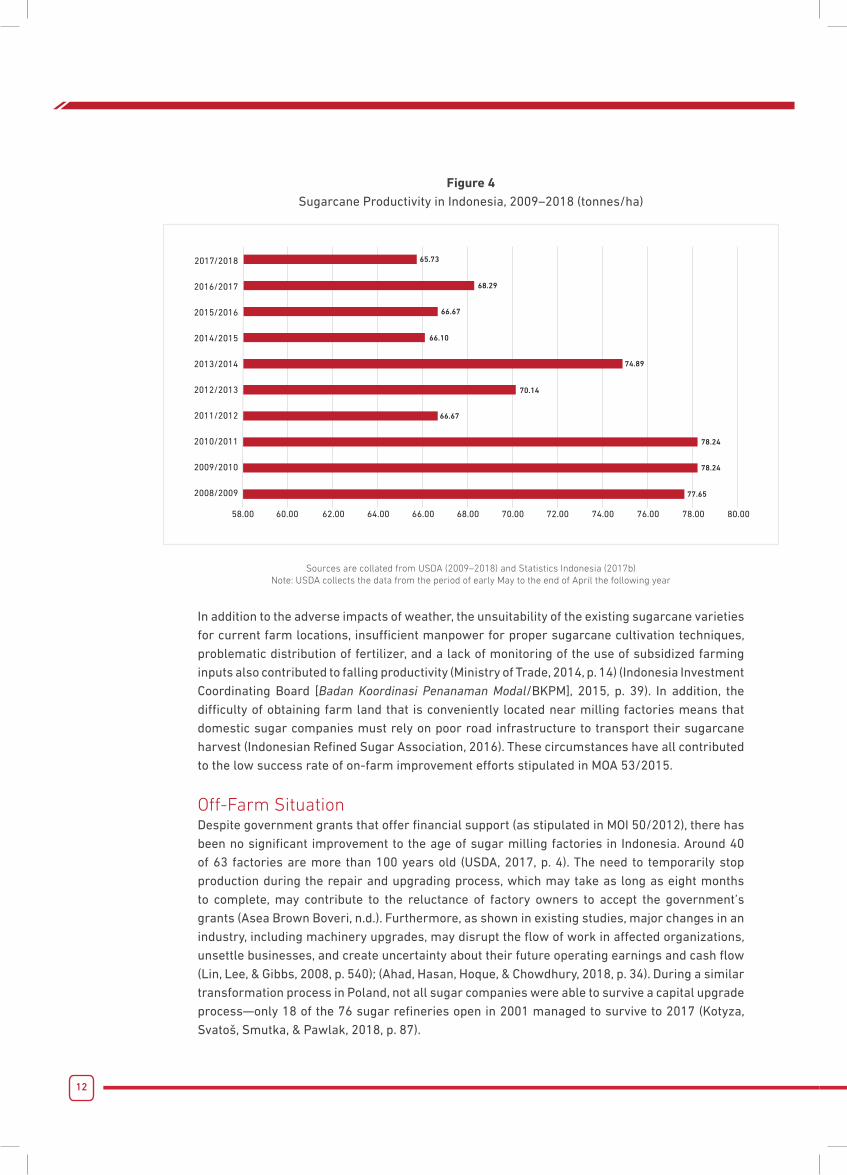
On-Farm Situation After the implementation of MOA 53/2015 in October 2015, sugarcane productivity in Indonesia increased by 2.44% from 66.67 tonnes/ha in 2015/2016 to 68.29 tonnes/ha in 2016/2017 (Figure 3). In 2017/2018, however, it decreased by 3.76% to 65.73 tonnes/ha. In spite of policy interventions, rather than increasing once the regulation was implemented, average productivity fell by 8.52%, from 73.13 tonnes/ha in 2008–2014 to 66.90 tonnes/ha in 2015–2018.
Prolonged drought caused by El Nino13 contributed to falling productivity. In 2011/2012, productivity decreased by nearly 15%, from 78.24 tonnes/ha in the previous period to 66.67 tonnes/ha (Figure 4), in part due to El Nino hitting the country from June to November 2012 (Maulidiya, Ihwan, & Jumarang, 2012, pp. 6, 13, 14). Similarly, in 2014 and 2015 El Nino caused delays to the planting period. These delays decreased productivity by 11.74% from 74.89 tonnes/ha in 2013/2014 to 66.10 tonnes/ha in 2014/2015 (USDA, 2014, p. 4, 2015, p. 5, 2016, p. 6).
11 In normal conditions, the dry season in Indonesia runs from May to October (Meteorology, Climate, and Geophysics Agency [Badan Meteorologi Klimatologi dan Geofisika/BMKG], 2018b, p. 28).12 In normal conditions, the rainy season in Indonesia runs from November to April (BMKG, 2018a, p. 30).13 El Nino (literal meaning, “The Little Boy”) refers to the large-scale climate interaction between the ocean and the atmosphere that typically leads to warmer-than-average temperatures and drier-than-average conditions in various parts of the world for an extended period of time (National Oceanic and Atmospheric Administration [NOAA], 2018).
In spite of policy interventions, rather than increasing once the regulation was implemented, average
productivity fell by 8.52%
12
Figure 4Sugarcane Productivity in Indonesia, 2009–2018 (tonnes/ha)
74.00
65.73
68.29
2017/2018
2016/2017
2015/2016
2014/2015
2013/2014
2012/2013
2011/2012
2010/2011
2009/2010
2008/2009
58.00 60.00 62.00 64.00 66.00 68.00 70.00 72.00 76.00 78.00 80.00
66.67
66.10
74.89
70.14
66.67
78.24
78.24
77.65
Sources are collated from USDA (2009–2018) and Statistics Indonesia (2017b)Note: USDA collects the data from the period of early May to the end of April the following year
In addition to the adverse impacts of weather, the unsuitability of the existing sugarcane varieties for current farm locations, insufficient manpower for proper sugarcane cultivation techniques, problematic distribution of fertilizer, and a lack of monitoring of the use of subsidized farming inputs also contributed to falling productivity (Ministry of Trade, 2014, p. 14) (Indonesia Investment Coordinating Board [Badan Koordinasi Penanaman Modal/BKPM], 2015, p. 39). In addition, the difficulty of obtaining farm land that is conveniently located near milling factories means that domestic sugar companies must rely on poor road infrastructure to transport their sugarcane harvest (Indonesian Refined Sugar Association, 2016). These circumstances have all contributed to the low success rate of on-farm improvement efforts stipulated in MOA 53/2015.
Off-Farm SituationDespite government grants that offer financial support (as stipulated in MOI 50/2012), there has been no significant improvement to the age of sugar milling factories in Indonesia. Around 40 of 63 factories are more than 100 years old (USDA, 2017, p. 4). The need to temporarily stop production during the repair and upgrading process, which may take as long as eight months to complete, may contribute to the reluctance of factory owners to accept the government’s grants (Asea Brown Boveri, n.d.). Furthermore, as shown in existing studies, major changes in an industry, including machinery upgrades, may disrupt the flow of work in affected organizations, unsettle businesses, and create uncertainty about their future operating earnings and cash flow (Lin, Lee, & Gibbs, 2008, p. 540); (Ahad, Hasan, Hoque, & Chowdhury, 2018, p. 34). During a similar transformation process in Poland, not all sugar companies were able to survive a capital upgrade process—only 18 of the 76 sugar refineries open in 2001 managed to survive to 2017 (Kotyza, Svatoš, Smutka, & Pawlak, 2018, p. 87).
13
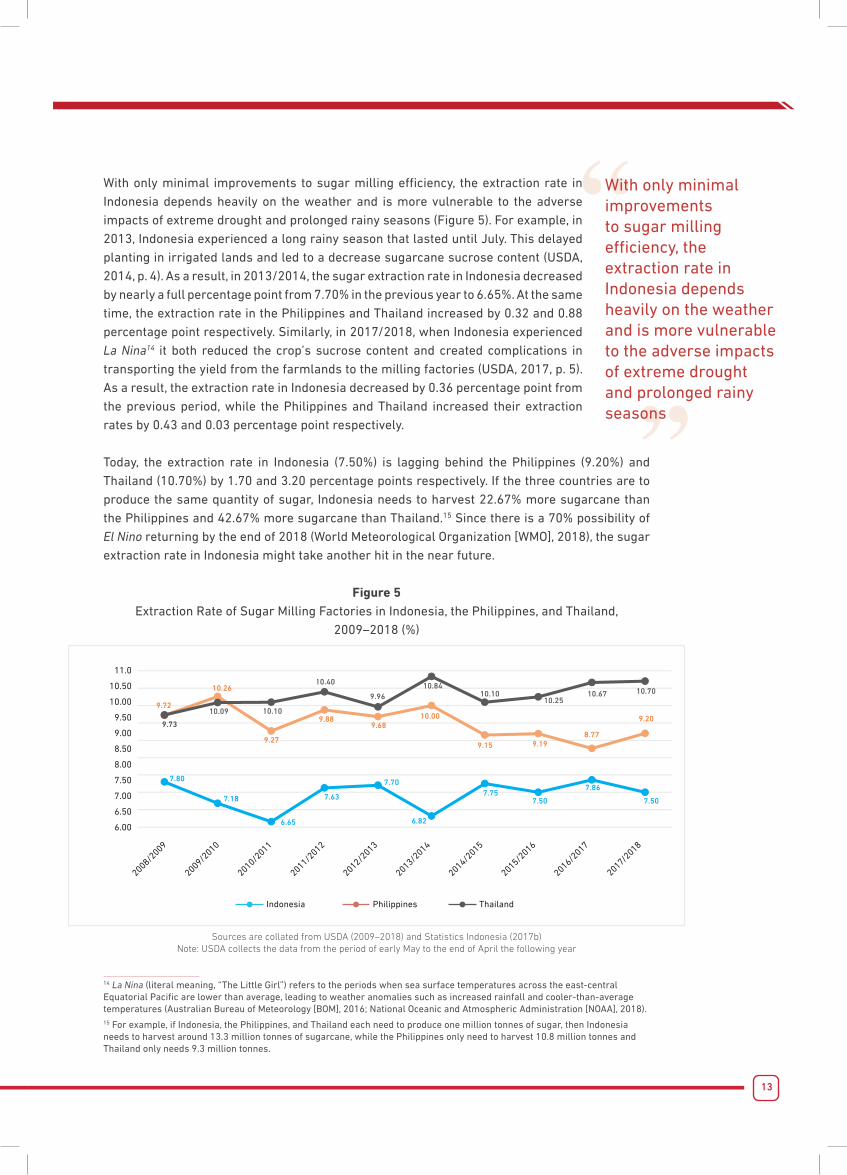
With only minimal improvements to sugar milling efficiency, the extraction rate in Indonesia depends heavily on the weather and is more vulnerable to the adverse impacts of extreme drought and prolonged rainy seasons (Figure 5). For example, in 2013, Indonesia experienced a long rainy season that lasted until July. This delayed planting in irrigated lands and led to a decrease sugarcane sucrose content (USDA, 2014, p. 4). As a result, in 2013/2014, the sugar extraction rate in Indonesia decreased by nearly a full percentage point from 7.70% in the previous year to 6.65%. At the same time, the extraction rate in the Philippines and Thailand increased by 0.32 and 0.88 percentage point respectively. Similarly, in 2017/2018, when Indonesia experienced La Nina14 it both reduced the crop’s sucrose content and created complications in transporting the yield from the farmlands to the milling factories (USDA, 2017, p. 5). As a result, the extraction rate in Indonesia decreased by 0.36 percentage point from the previous period, while the Philippines and Thailand increased their extraction rates by 0.43 and 0.03 percentage point respectively.
Today, the extraction rate in Indonesia (7.50%) is lagging behind the Philippines (9.20%) and Thailand (10.70%) by 1.70 and 3.20 percentage points respectively. If the three countries are to produce the same quantity of sugar, Indonesia needs to harvest 22.67% more sugarcane than the Philippines and 42.67% more sugarcane than Thailand.15 Since there is a 70% possibility of El Nino returning by the end of 2018 (World Meteorological Organization [WMO], 2018), the sugar extraction rate in Indonesia might take another hit in the near future.
Figure 5Extraction Rate of Sugar Milling Factories in Indonesia, the Philippines, and Thailand,
2009–2018 (%)
11.0
10.50
10.00
9.50
9.00
8.50
8.00
7.50
7.00
6.50
6.00
2008/2009
2009/2010
2010/2011
2011/2012
2012/2013
2013/2014
2014/2015
2015/2016
2017/2018
2016/2017
7.80
7.18
6.65
7.63
7.70
6.82
7.757.50
7.86
7.50
9.73
10.10
10.40
9.9610.84
10.1010.25
10.67 10.70
10.099.72
10.26
9.27
9.6810.00
9.15 9.198.77
9.209.88
Indonesia Philippines Thailand
Sources are collated from USDA (2009–2018) and Statistics Indonesia (2017b)Note: USDA collects the data from the period of early May to the end of April the following year
14 La Nina (literal meaning, “The Little Girl”) refers to the periods when sea surface temperatures across the east-central Equatorial Pacific are lower than average, leading to weather anomalies such as increased rainfall and cooler-than-average temperatures (Australian Bureau of Meteorology [BOM], 2016; National Oceanic and Atmospheric Administration [NOAA], 2018).15 For example, if Indonesia, the Philippines, and Thailand each need to produce one million tonnes of sugar, then Indonesia needs to harvest around 13.3 million tonnes of sugarcane, while the Philippines only need to harvest 10.8 million tonnes and Thailand only needs 9.3 million tonnes.
With only minimal improvements to sugar milling efficiency, the extraction rate in Indonesia depends heavily on the weather and is more vulnerable to the adverse impacts of extreme drought and prolonged rainy seasons
14
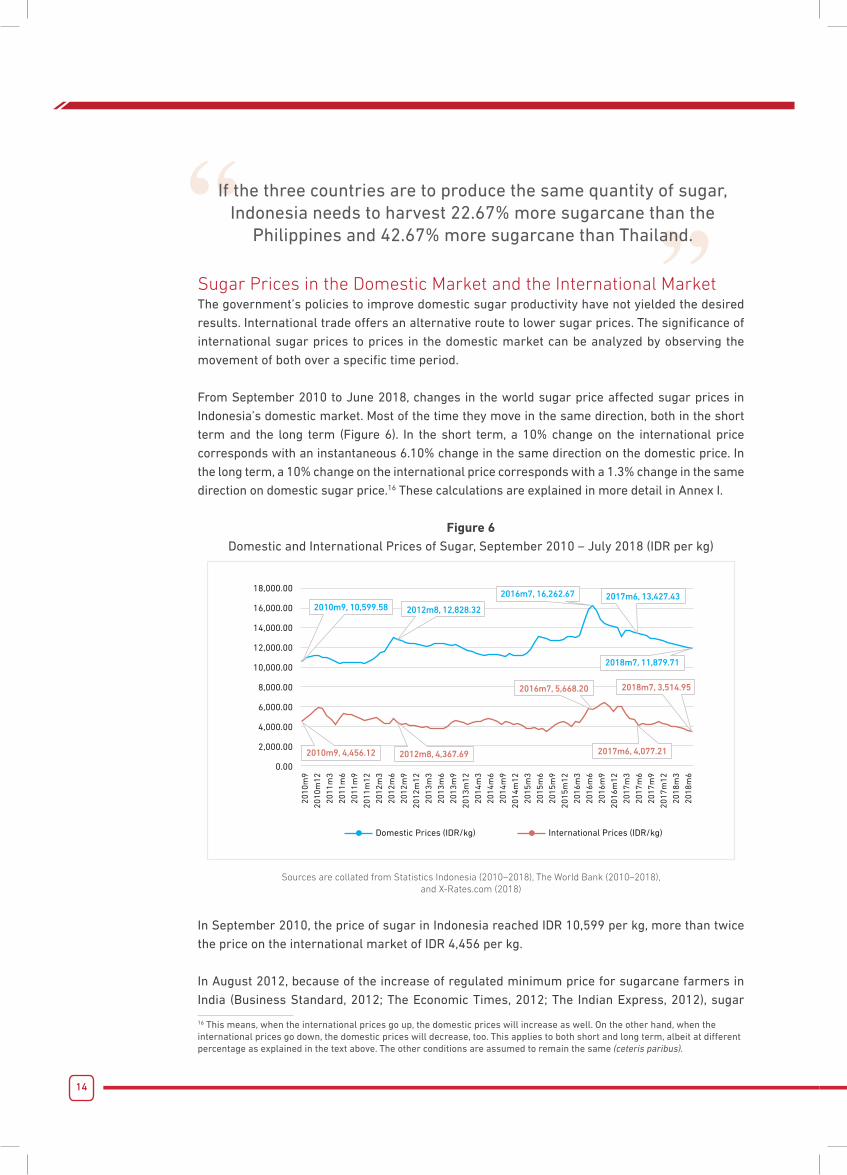
Sugar Prices in the Domestic Market and the International MarketThe government’s policies to improve domestic sugar productivity have not yielded the desired results. International trade offers an alternative route to lower sugar prices. The significance of international sugar prices to prices in the domestic market can be analyzed by observing the movement of both over a specific time period.
From September 2010 to June 2018, changes in the world sugar price affected sugar prices in Indonesia’s domestic market. Most of the time they move in the same direction, both in the short term and the long term (Figure 6). In the short term, a 10% change on the international price corresponds with an instantaneous 6.10% change in the same direction on the domestic price. In the long term, a 10% change on the international price corresponds with a 1.3% change in the same direction on domestic sugar price.16 These calculations are explained in more detail in Annex I.
Figure 6Domestic and International Prices of Sugar, September 2010 – July 2018 (IDR per kg)
18,000.00
16,000.00
14,000.00
12,000.00
10,000.00
8,000.00
6,000.00
4,000.00
2,000.00
0.00
Domestic Prices (IDR/kg) International Prices (IDR/kg)
2010m9, 10,599.58 2012m8, 12,828.32
2016m7, 16,262.67 2017m6, 13,427.43
2018m7, 11,879.71
2010m9, 4,456.12 2012m8, 4,367.69
2016m7, 5,668.20 2018m7, 3,514.95
2017m6, 4,077.21
2010
m9
2010
m12
2011
m3
2011
m6
2011
m9
2011
m12
2012
m3
2012
m6
2012
m9
2012
m12
2013
m3
2013
m6
2013
m9
2013
m12
2014
m3
2014
m6
2014
m9
2014
m12
2015
m3
2015
m6
2015
m9
2015
m12
2016
m3
2016
m6
2016
m9
2016
m12
2017
m3
2017
m6
2017
m9
2017
m12
2018
m3
2018
m6
Sources are collated from Statistics Indonesia (2010–2018), The World Bank (2010–2018), and X-Rates.com (2018)
In September 2010, the price of sugar in Indonesia reached IDR 10,599 per kg, more than twice the price on the international market of IDR 4,456 per kg.
In August 2012, because of the increase of regulated minimum price for sugarcane farmers in India (Business Standard, 2012; The Economic Times, 2012; The Indian Express, 2012), sugar
16 This means, when the international prices go up, the domestic prices will increase as well. On the other hand, when the international prices go down, the domestic prices will decrease, too. This applies to both short and long term, albeit at different percentage as explained in the text above. The other conditions are assumed to remain the same (ceteris paribus).
If the three countries are to produce the same quantity of sugar, Indonesia needs to harvest 22.67% more sugarcane than the
Philippines and 42.67% more sugarcane than Thailand.
15
prices in the international market rose to IDR 4,367 per kg, but it was still 1.98% cheaper than in September 2010. In the same period, sugar prices in Indonesia rose to IDR 12,828 per kg, 21.03% more expensive than in September 2010.
In July 2016, the declining supply of sugar in the international market (ISO, 2016) led to an increase in the price to IDR 5,668 per kg, 27.2% higher than in September 2010. Domestically, though, the sugar price in Indonesia reached its peak at IDR 16,262 per kg, 53.43% than in September 2010.
In June 2017, due to increased production in top sugar producing countries such India, China, and Thailand (USDA, 2017), sugar prices in the international market fell to IDR 4,077 per kg, 8.50% cheaper than in September 2010. In the same period, sugar prices in Indonesia also fell to IDR 13,427 per kg, yet this was still 26.68% more expensive than the domestic price in September 2010.
In July 2018, while sugar prices in Indonesia went down along with the price decrease in the international market, the price difference between them had grown 36.16% larger than it was in September 2010.
These shifts and differences in price illustrate the correlation between sugar prices in Indonesia and the international market. In spite of this correlation, the domestic market is unable to take full advantage of falling international market prices when they occur. On the other hand, the domestic market is prone to sharp price increases when international prices rise.
MOT 117/2015, which regulates sugar imports, contributes to the inability of the domestic sugar market in Indonesia to take advantage of lower international sugar prices. This regulation renders the import mechanism ineffective because it allows the government to intervene in the market by restricting imports both via quota and by excluding the qualified private sector from sugar importation, thereby reducing the level of competition in the licensing process.
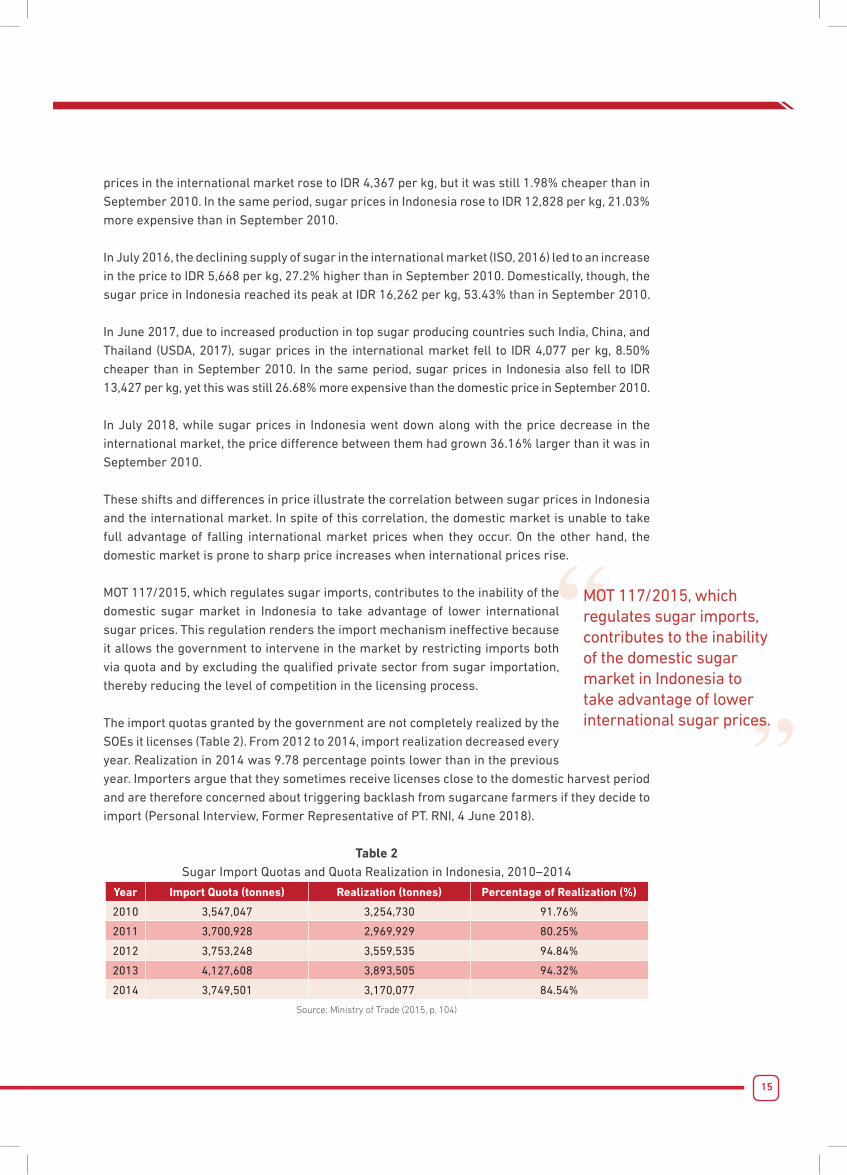
The import quotas granted by the government are not completely realized by the SOEs it licenses (Table 2). From 2012 to 2014, import realization decreased every year. Realization in 2014 was 9.78 percentage points lower than in the previous year. Importers argue that they sometimes receive licenses close to the domestic harvest period and are therefore concerned about triggering backlash from sugarcane farmers if they decide to import (Personal Interview, Former Representative of PT. RNI, 4 June 2018).
Table 2Sugar Import Quotas and Quota Realization in Indonesia, 2010–2014
Year Import Quota (tonnes) Realization (tonnes) Percentage of Realization (%)
2010 3,547,047 3,254,730 91.76%
2011 3,700,928 2,969,929 80.25%
2012 3,753,248 3,559,535 94.84%
2013 4,127,608 3,893,505 94.32%
2014 3,749,501 3,170,077 84.54%
Source: Ministry of Trade (2015, p. 104)
MOT 117/2015, which regulates sugar imports, contributes to the inability of the domestic sugar market in Indonesia to take advantage of lower international sugar prices.
16
The lack of competition in the import licensing process is exacerbated by the fact that the government uses a non-transparent method to grant licenses (Anti-Monopoly Commission [Komisi Pengawas Persaingan Usaha/KPPU], 2010). The process creates oligopolistic competition17 in the sugar market since there are only three or four licensed importers in a given time period (Personal Interview, Head Of Research, Regulatory Analysis and Advocation Department, KPPU, 30 May 2018; KPPU, 2010). These companies are free to control their supply to retailers and therefore they are also able to control sugar prices. This situation makes the sugar market prone to cartel practices in which the license-holding companies seek to collude and block the entry of new market players, stifling the competition and keeping sugar prices high for consumers.
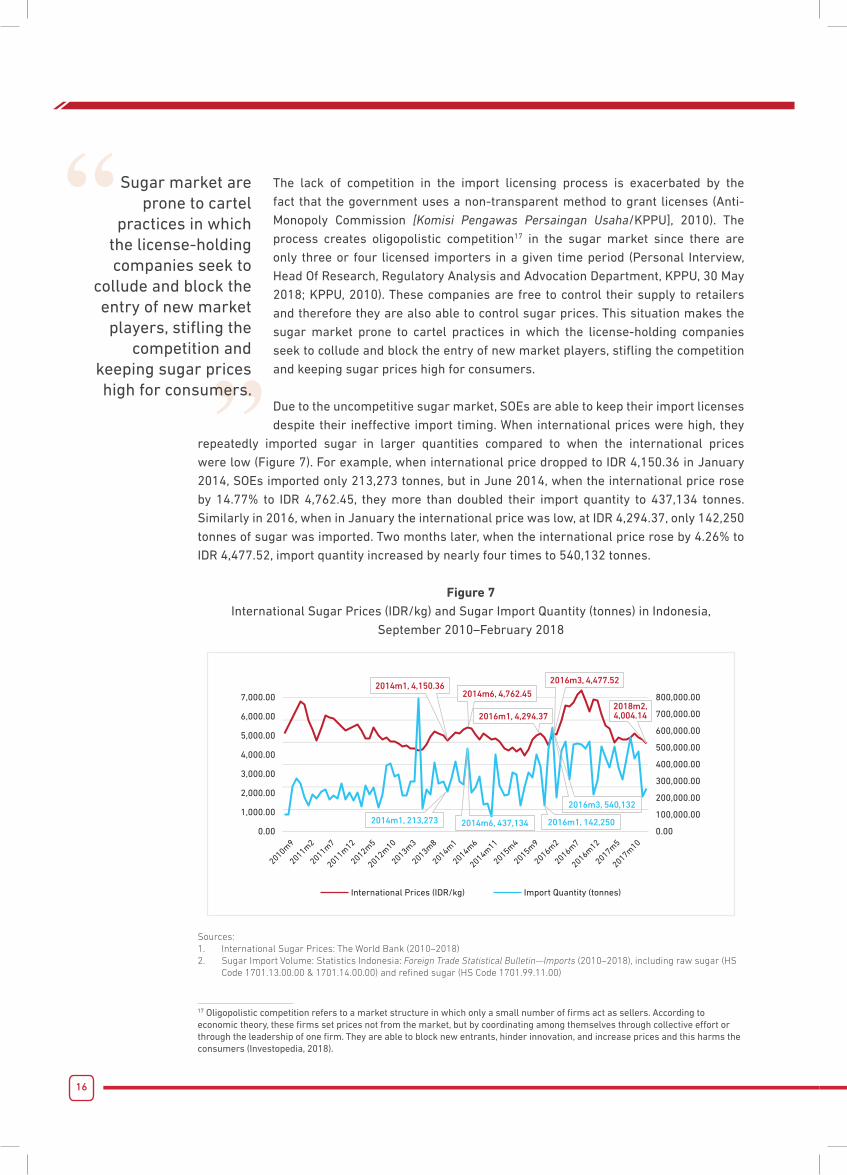
Due to the uncompetitive sugar market, SOEs are able to keep their import licenses despite their ineffective import timing. When international prices were high, they
repeatedly imported sugar in larger quantities compared to when the international prices were low (Figure 7). For example, when international price dropped to IDR 4,150.36 in January 2014, SOEs imported only 213,273 tonnes, but in June 2014, when the international price rose by 14.77% to IDR 4,762.45, they more than doubled their import quantity to 437,134 tonnes. Similarly in 2016, when in January the international price was low, at IDR 4,294.37, only 142,250 tonnes of sugar was imported. Two months later, when the international price rose by 4.26% to IDR 4,477.52, import quantity increased by nearly four times to 540,132 tonnes.
Figure 7International Sugar Prices (IDR/kg) and Sugar Import Quantity (tonnes) in Indonesia,
September 2010–February 2018
International Prices (IDR/kg) Import Quantity (tonnes)
7,000.00
6,000.00
5,000.00
4,000.00
3,000.00
2,000.00
1,000.00
0.00
800,000.00
700,000.00
600,000.00
500,000.00
400,000.00
300,000.00
200,000.00
100,000.00
0.00
2010m9
2011m2
2011m7
2011m12
2012m5
2012m10
2013m3
2013m8
2014m1
2015m9
2014m6
2016m2
2014m11
2016m7
2017m5
2015m4
2016m12
2017m10
2014m1, 213,273 2014m6, 437,134
2014m1, 4,150.36
2016m1, 4,294.372018m2, 4,004.14
2014m6, 4,762.45
2016m3, 4,477.52
2016m1, 142,250
2016m3, 540,132
Sources:1. International Sugar Prices: The World Bank (2010–2018)2. Sugar Import Volume: Statistics Indonesia: Foreign Trade Statistical Bulletin—Imports (2010–2018), including raw sugar (HS
Code 1701.13.00.00 & 1701.14.00.00) and refined sugar (HS Code 1701.99.11.00)
17 Oligopolistic competition refers to a market structure in which only a small number of firms act as sellers. According to economic theory, these firms set prices not from the market, but by coordinating among themselves through collective effort or through the leadership of one firm. They are able to block new entrants, hinder innovation, and increase prices and this harms the consumers (Investopedia, 2018).
Sugar market are prone to cartel
practices in which the license-holding companies seek to
collude and block the entry of new market players, stifling the
competition and keeping sugar prices high for consumers.
17
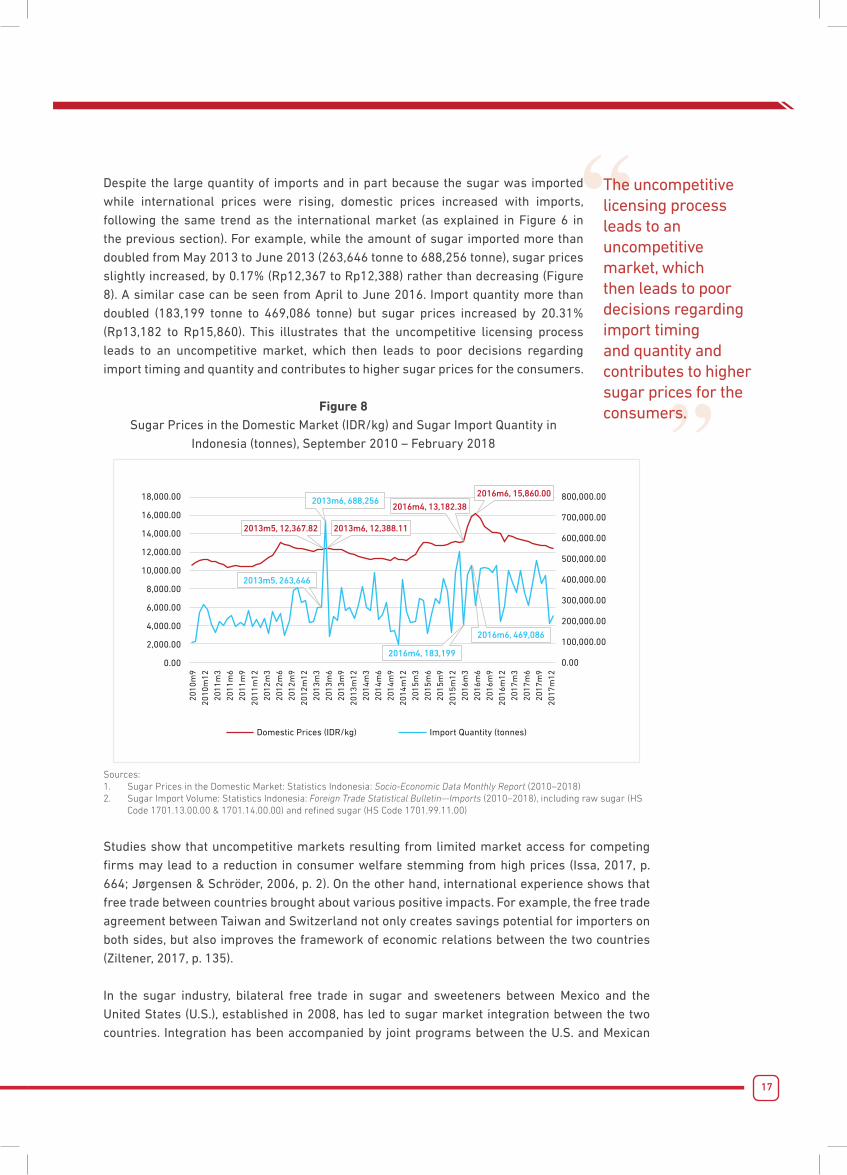
Despite the large quantity of imports and in part because the sugar was imported while international prices were rising, domestic prices increased with imports, following the same trend as the international market (as explained in Figure 6 in the previous section). For example, while the amount of sugar imported more than doubled from May 2013 to June 2013 (263,646 tonne to 688,256 tonne), sugar prices slightly increased, by 0.17% (Rp12,367 to Rp12,388) rather than decreasing (Figure 8). A similar case can be seen from April to June 2016. Import quantity more than doubled (183,199 tonne to 469,086 tonne) but sugar prices increased by 20.31% (Rp13,182 to Rp15,860). This illustrates that the uncompetitive licensing process leads to an uncompetitive market, which then leads to poor decisions regarding import timing and quantity and contributes to higher sugar prices for the consumers.
Figure 8Sugar Prices in the Domestic Market (IDR/kg) and Sugar Import Quantity in
Indonesia (tonnes), September 2010 – February 2018
Domestic Prices (IDR/kg) Import Quantity (tonnes)
18,000.00
16,000.00
14,000.00
12,000.00
10,000.00
8,000.00
6,000.00
4,000.00
2,000.00
0.00
800,000.00
700,000.00
600,000.00
500,000.00
400,000.00
300,000.00
200,000.00
100,000.00
0.00
2010
m9
2010
m12
2011
m3
2011
m6
2011
m9
2011
m12
2012
m3
2012
m6
2012
m9
2012
m12
2013
m3
2013
m6
2013
m9
2013
m12
2014
m3
2014
m6
2014
m9
2014
m12
2015
m3
2015
m6
2015
m9
2015
m12
2016
m3
2016
m6
2016
m9
2016
m12
2017
m3
2017
m6
2017
m9
2017
m12
2016m4, 183,199
2016m6, 469,086
2013m5, 12,367.82
2016m4, 13,182.38
2013m6, 12,388.11
2016m6, 15,860.002013m6, 688,256
2013m5, 263,646
Sources:1. Sugar Prices in the Domestic Market: Statistics Indonesia: Socio-Economic Data Monthly Report (2010–2018) 2. Sugar Import Volume: Statistics Indonesia: Foreign Trade Statistical Bulletin—Imports (2010–2018), including raw sugar (HS
Code 1701.13.00.00 & 1701.14.00.00) and refined sugar (HS Code 1701.99.11.00)
Studies show that uncompetitive markets resulting from limited market access for competing firms may lead to a reduction in consumer welfare stemming from high prices (Issa, 2017, p. 664; Jørgensen & Schröder, 2006, p. 2). On the other hand, international experience shows that free trade between countries brought about various positive impacts. For example, the free trade agreement between Taiwan and Switzerland not only creates savings potential for importers on both sides, but also improves the framework of economic relations between the two countries (Ziltener, 2017, p. 135).
In the sugar industry, bilateral free trade in sugar and sweeteners between Mexico and the United States (U.S.), established in 2008, has led to sugar market integration between the two countries. Integration has been accompanied by joint programs between the U.S. and Mexican
The uncompetitive licensing process leads to an uncompetitive market, which then leads to poor decisions regarding import timing and quantity and contributes to higher sugar prices for the consumers.
18
governments in which they exchange, analyze, and publish up-to-date and transparent data on the sugar market. As a result, sugarcane farmers and sugar importers in both countries have access to reliable market information when conducting their respective businesses (Zahniser & Moreno, 2014, pp. 216–217).
The ScenariosDepending on what sugar trade policy that the government decides to pursue, there are four scenarios that could come about in the sugar market. These scenarios assume there is no significant improvement to either on-farm or off-farm productivity levels, which are explained in the previous section.
Scenario I - Business as UsualThe first scenario is that the government maintains its existing policies. The trade restrictions stipulated in MOT 117/2015 Article 3 and Article 5 (2) prevent the import mechanism from lowering sugar prices. The impact of restrictive trade policies on consumer prices is measured using nominal rates of protection (NRP). NRP calculates the proportion by which domestic sugar producer prices exceed the prices of imported sugar at the country’s border due to trade policy (Marks, 2015, p. 10).
The NRP for sugar reached 48.10% in 2015. This means the price of domestic sugar from sugarcane farmers in Indonesia is 48.10% more expensive than sugar from Thailand (or any international market) arriving for import at major Indonesian ports.18 Indonesian non-tariff trade policies, such as its non-transparent and uncompetitive licensing process, are responsible for more than 74% of the NRP value.19
Meanwhile, since productivity levels remain the same, domestic sugarcane farmers are unable to improve their income through their farming activities, and since two-thirds of all farmers in Indonesia are net food consumers (McCulloch & Timmer, 2008, p. 35), high sugar prices have a negative impact on their ability to purchase sugar and other food items.
Scenario II - Eliminating Import Quotas MechanismThe second scenario refers to the removal of the import quota stipulated in MOT 117/2015 (Article 3) while the import licensing system stays the same. Licenses are only granted to the SOEs, as stated in Article 5(2). In this scenario, while there is no limitation on the quantity of sugar imported, import market competition will remain oligopolistic due to the limited number of importers. In these circumstances, the SOEs are able to control sugar prices by controlling the quantity of imported sugar. Consumers will still have limited options for buying sugar, the quantity of imported sugar may be insufficient to fulfil the deficit of domestic production when compared to demand, and sugar prices in Indonesia’s domestic market will remain higher than in the international market. These outcomes are similar to outcomes to those in the first scenario.
18 Including all expenses for Cost, Insurance, and Freight (CIF) required to bring the imported sugar from the producing country to Indonesia.19 If the NRP on sugar only calculates the import tariffs and export taxes, its value would only reach 12.5%, or around 26% of the total NRP value.
19
Scenario III - Revising Restrictive Import LicenseThe third scenario is one in which import license policy as stipulated in MOT 117/2015 Article 5 (2) is revised while the government remains in control of the sugar import quantity as stipulated in Article 3. In this scenario, import licenses would be granted not only to SOEs, but also to the qualified private sector. This means that import licenses would primarily serve for identification and not as a restriction to the market.
This reform must focus on preventing cartel practices by either SOEs or private importers. It should do this by ensuring that the licensing process becomes more open, more transparent, and easier and faster to complete. This would make stock hoarding and price speculation less likely because importers will be subject to increasing competition. Eliminating cartel practices, stock hoarding, and price speculation would allow consumers to enjoy more options for sugar as the market supply comes from more importers.
Since the government would still control the quantity of imported sugar in the market, the impact of imports on the income of domestic sugarcane farmers should be limited. On the other hand, maintaining the government’s interventions on the sugar supply might limit the ability of a more open and transparent licensing system to lower sugar prices for consumers, including the small-scale sugarcane farmers who are net consumers.
Scenario IV - Eliminating the Import Quota System and Revising Restrictive Im-port LicenseThe fourth scenario refers to the most comprehensive reform to MOT 117/2015, in which the import licensing process (Article 5 (2)) is reformed and the import quota (Article 3) is removed. In this scenario, the impact of the revision to Article 5 (2) is the same as explained the third scenario. Meanwhile, the removal of import quota should allow the import mechanism to help the domestic market more fully adjust to the international market situation. These reforms would pave the way for imported sugar to enter the market more quickly and more effectively fill the deficit between domestic sugar supply and consumer demand. As a result, sugar prices should become lower for consumers.
The NRP value for sugar, which reaches 48.10% under the current restrictions, suggests that more open trade has the potential to reduce sugar prices in the domestic market by nearly half of their current level.
These reforms and their outcomes would also benefit around 67 million households20 who are net sugar consumers, since they do not work on sugarcane farms nor in the sugar industry. On the other hand, this situation might present difficulties for domestic sugarcane farmers and sugar milling factories, who would have to compete with imported sugar sold at cheaper prices.
All four scenarios mentioned above and their expected outcomes are presented in a matrix in Annex II.
20 The total population of Indonesia was 263,991,379 people (The World Bank, 2017b), while there were only 746,037 sugarcane farmers and 267,931 laborers (Ministry of Agriculture, 2016b, p. 14). The people who do not work as sugarcane farmers nor as sugar industry laborers are considered net sugar consumers. With an average size of 3.9 people per household, there were around 262,977,411 people, or approximately 67.43 million households, of net sugar consumers in Indonesia (Statistics Indonesia, 2017d, p. 86).
20
Recommendations
Government policy to improve domestic sugar productivity as stipulated in MOA 53/2015 and MOI 50/2012 has not worked as intended, either on-farm or off-farm. Sugarcane productivity in 2017/2018 was lower than in 2016/2017, and even lower than it was in 2008/2009. Meanwhile, the extraction rate of sugar milling factories has not improved significantly since 2008 and has lagged behind the Philippines and Thailand. Meanwhile, import restrictions stated in MOT 117/2015 contribute to the uncompetitive nature of the sugar market in Indonesia, especially the import licensing process. All of these factors contribute to high sugar prices in Indonesia, in which white crystal sugar was nearly three times more expensive than in the international market in August 2018.
Based on the scenarios projected in the previous section, we propose a two-stage policy reform to lower sugar prices while providing sufficient time for the relevant stakeholders to adjust to the new policies.
First, in the first five years of reform the government should implement the third scenario, in which they revise MOT 117/2015 Article 5 (2) on import licensing, opening sugar importation not only to SOEs but also to the qualified private sector. This revision must emphasize creating a more transparent and fair licensing process to prevent cartel practices by either SOEs or private importers. Once these reforms are in place, companies will be unlikely to hoard stock and speculate on prices as they face increasing competition with a larger number of importers. As for consumers, they will have more options when buying sugar as the supply comes from an increasing number of importers.
While implementing these reforms, the government should keep its control over the quantity of imported sugar as stipulated in MOT 117/2015 Article 3. So long as
government control over import quantities remains strong, reform of the licensing process will be met with minimum resistance from domestic sugarcane farmers and the domestic sugar industry. This will make reform less challenging to implement and make it possible to garner support from both the public and members of legislature.
The second stage of reforms is related to the policy dilemma faced by the government when it comes to sugar prices: if prices fall, domestic farmers might suffer, but if prices keep increasing, consumers will suffer. Opening up imports as mentioned in the first stage of this reform is not sufficient to solve this dilemma. Therefore, the farmers and milling factories need to receive substantial support during the early part of the second stage of reforms to prepare them for its remaining process.
In the first ten years of reform, the government must assist farmers and local sugar milling factories in restructuring farming practices and investing in better technology. This assistance must be given with a clear and specific target for productivity increases and extraction rate improvement in accordance with the government’s objectives for on-farm and off-farm programs. Without such a target, programs might fail yet again and as a result sugar prices will further rise and hurt consumers.
First, in the first five years of reform the government should
revise MOT 117/2015 Article 5 (2) on import
licensing, opening sugar importation not only
to SOEs but also to the qualified private sector.
21
In the first ten years of reform, the government must assist farmers and local sugar milling factories in restructuring
farming practices and investing in better technology.
After ten years, the government should implement the fourth scenario, which is in addition to revising the import licensing process as in the first stage of reforms, it also should remove the import quota stipulated in MOT 117/2015 Article 3 and allowing import quantities to be determined by market supply and demand. This timeframe should give sufficient time for the government to implement both on-farm and off-farm programs to increase productivity, extraction rate, and the overall quality of domestic sugar industry. This will mean that sugarcane farmers and the national sugar industry should be better prepared to compete with imported sugar. As long as the on-farm and off-farm programs start showing positive results within this timeframe, the government should be able to minimize resistance to this reform from domestic sugarcane farmers and sugar milling factories.
After ten years, the government should remove the import quota stipulated in MOT 117/2015 Article
3 and allow import quantities to be determined by market supply and demand.
Most importantly, consumers will enjoy the benefit of a more competitive sugar market that will lower sugar prices. As detailed in the fourth scenario, more open trade in imported sugar could potentially reduce sugar prices in the consumers market by nearly half of its current level.
22
References
Agustinus, M. (2018, April 6). Pemerintah Siapkan Perpres untuk Lanjutkan Lelang Gula Rafinasi [Government Prepares Presidential Regulation to Continue Refined Sugar Auction]. Retrieved September 17, 2018, from https://kumparan.com/@kumparanbisnis/pemerintah-siapkan-perpres-untuk-lanjutkan-lelang-gula-rafinasi
Ahad, A., Hasan, S., Hoque, M. R., & Chowdhury, S. R. (2018). Challenges and Impacts of Technology Integration/ Up-gradation in the Education Industry: A Case Study. JOURNAL OF SYSTEMS INTEGRATION, 12.
Anti-Monopoly Commission [Komisi Pengawas Persaingan Usaha/KPPU]. (2010). Position Paper Komisi Pengawas Persaingan Usaha Terhadap Kebijakan Dalam Industri Gula [Position Paper of Anti-Monopoly Commission on Sugar Industry Policies]. KPPU.
APINDO. (2017). APINDO tolak wacana lelang Gula Kristal Rafinasi. Retrieved from http://apindo.or.id/id/press/read/apindo-tolak-wacana-lelang-gula-kristal-rafinasi
Asea Brown Boveri. (n.d.). How Digitalization addresses sugar production challenges. Retrieved from https://search-ext.abb.com/library/Download.aspx?DocumentID=2PAA118121&LanguageCode=en&DocumentPartId=&Action=Launch
Australian Bureau of Meteorology [BOM]. (2016, August). What is La Niña and how does it impact Australia? Retrieved September 1, 2018, from http://www.bom.gov.au/climate/updates/articles/a020.shtml
Business Standard. (2012, July 20). Govt approves 17% hike in sugarcane price. Retrieved from https://www.business-standard.com/article/pti-stories/govt-approves-17pc-hike-in-sugarcane-price-for-2012-13-mktg-yr-112072000194_1.html
Center for Indonesian Policy Studies [CIPS]. (2018). Indeks Harga Bulanan Rumah Tangga - Agustus 2018 [Monthly Household Price Index - August 2018].
Cicilia, S. (2018). Uji coba perdana lelang gula rafinasi digelar besok [Initial Testing Period for Refined Sugar Auction Scheduled Tomorrow]. Retrieved from https://industri.kontan.co.id/news/uji-coba-perdana-lelang-gula-rafinasi-digelar-besok
Department of Agriculture, Forestry, and Fisheries of South Africa. (2014). Sugarcane Production Guideline. Department of Agriculture, Forestry, and Fisheries of South Africa.
Engle, R. F., & Granger, C. W. J. (1987). Co-integration and Error Correction: Representation, Estimation, and Testing. Econometrica, 55(2), 251–276. http://dx.doi.org/10.2307/1913236
Former Representative of PT. RNI. (2018, April 4). Personal Interview.
GBG. (2016). Agriculture | Indonesia’s Sugar Industry Overview: Still a Long Way from Self-Sufficiency. Retrieved from http://www.gbgindonesia.com/en/agriculture/article/2016/indonesia_s_sugar_industry_overview_still_a_long_way_from_self_sufficiency_11463.php
23
Head of Research, Regulatory Analysis and Advocation Department, KPPU. (2018, May 30). Personal Interview with Head of Research, Regulatory Analysis and Advocation Department, Anti-Monopoly Commission [KPPU].
Idris, M. (2017, September 28). 300.000 Tonne Gula Rafinasi Bocor ke Pasar Tiap Tahun [300,000 tonnes of refined sugar smuggled into the consumer market every year]. Retrieved from https://finance.detik.com/industri/d-3662200/300000-tonne-gula-rafinasi-bocor-ke-pasar-tiap-tahun
The Indian Express. (2012, July 20). CCEA hikes sugarcane price 17%. Retrieved September 1, 2018, from https://indianexpress.com/article/news-archive/web/ccea-hikes-sugarcane-price-17/
Indonesia Investment Coordinating Board [Badan Koordinasi Penanaman Modal/BKPM]. (2015). Prefeasibility Report: Identifikasi Peluang Investasi Pengembangan Industri Gula di Indonesia [Prefeasibility Report on Investment Opportunities on Sugar Industry Development in Indonesia].
Indonesian Refined Sugar Association. (2016). Industri Gula Terkendala Lahan [Land Availability Hinders Sugar Industry]. Retrieved from http://www.kemenperin.go.id/artikel/14128/Industri-Gula-Terkendala-Lahan
Indrawanto, C., Purwono, Siswanto, Syakir, M., & Rumini, W. (2010). Budidaya dan Pasca Panen Tebu [Sugar Cane Cultivation and Post-production Process]. Jakarta: ESKA Media.
International Sugar Organization [ISO]. (2016). Global Sugar Market Outlook.
International Sugar Organization [ISO]. (2018, August 31). Daily Sugar Prices. Retrieved September 17, 2018, from http://www.isosugar.org/prices.php?pricerange=2018-08-01
Investopedia. (2018). Oligopoly. Retrieved from https://www.investopedia.com/terms/o/oligopoly.asp
Issa, A. (2017). Legal Protection of Competition on the Libyan Market (pp. 663–666). Presented at the 21st International Scientific Conference on Economic and Social Development, Belgrade.
Jørgensen, J. G., & Schröder, P. J. H. (2006). Technical Barriers, Import Licenses and Tariffs as Means of Limiting Market Access. Journal of Economic Integration, 21(1), 120–146. https://doi.org/10.11130/jei.2006.21.1.120
Kotyza, P., Svatoš, M., Smutka, L., & Pawlak, K. (2018). Polish Sugar Industry Development. Agris On-Line Papers in Economics and Informatics, 10(1), 71–90. https://doi.org/10.7160/aol.2018.100107
KPPU. (2010). Position Paper Komisi Pengawas Persaingan Usaha Terhadap Kebijakan Dalam Industri Gula.
Lin, B., Lee, Z., & Gibbs, L. G. (2008). Operational restructuring: reviving an ailing business. Management Decision, 46(4), 539–552. https://doi.org/10.1108/00251740810865049
Marks, S. V. (2015). Non-Tariff Trade Regulations in Indonesia: Measurement of their Economic Impact. Australia Indonesia Partnership for Economic Governance.
24
Maulidiya, H., Ihwan, A., & Jumarang, M. I. (2012). Penentuan Kejadian El-Nino dan La-Nina Berdasarkan Nilai Southern Oscilation Indeks [Determining Occurences of El-Nino and La-Nina Based on the Value of Southern Oscilation Index]. POSITRON, II(2), 6–14.
McCulloch, N., & Timmer, C. P. (2008). RICE POLICY IN INDONESIA: A SPECIAL ISSUE. Bulletin of Indonesian Economic Studies, 44(1), 33–44. https://doi.org/10.1080/00074910802001561
Meteorology, Climate, and Geophysics Agency [Badan Meteorologi Klimatologi dan Geofisika/BMKG]. (2018a). Prakiraan Musim Hujan 2018/2019 di Indonesia [2018/2019 Rainy Season Forecast in Indonesia]. BMKG.
Meteorology, Climate, and Geophysics Agency [Badan Meteorologi Klimatologi dan Geofisika/BMKG]. (2018b). Prakiraan Musim Kemarau 2018 di Indonesia [2018 Dry Season Forecast in Indonesia]. BMKG.
Ministry of Agriculture. (2015a). Laporan Analisis Kebijakan Tahun 2015 - Outlook Komoditas Pangan Strategis Tahun 2015-2019 [Analytical Report on Policies 2015 - Strategic Food Items Outlook 2015-2019].
Ministry of Agriculture. (2015). Peraturan Menteri Pertanian No. 53 tahun 2015 tentang Pedoman Budidaya Tebu Giling yang Baik [Regulation of the MInister of Agriculture (MOA) 53/2015 on Good Agricultural Practices/GAP for Sugar Cane].
Ministry of Agriculture. (2016a). Pengelolaan Data Lahan Sawah, Alat dan Mesin Pertanian, dan Jaringan Irigasi [Data Management on Rice Field, Agriculture Equipment and Machinery, and Irrigation Infrastructure]. (Directorate General of Agricultural Infrastructure, Ed.). Solo.
Ministry of Agriculture. (2016b). Statistik Perkebunan Indonesia - Tebu [Tree Crop Estate Statistics of Indonesia - Sugar Cane] 2015-2017. Direktorat Jenderal Perkebunan, Kementerian Pertanian [Directorate General of Estate Crops, Ministry of Agriculture].
Ministry of Industry. (2017). Rencana Kerja 2018 - Kementerian Perindustrian [Ministry of Industry - Work Plan 2018].
Ministry of Trade. (2014). Analisis Outlook Pangan [Food Outlook Analysis] 2015 - 2019. Ministry of Trade.
Ministry of Trade. (2015). Kajian Efektivitas Kebijakan Impor Produk Pangan dalam Rangka Stabilisasi Harga [Study on the Effectiveness of Import Policy to Stabilize Food Prices] (p. 161). Ministry of Trade.
National Oceanic and Atmospheric Administration [NOAA]. (2018, June 25). What are El Niño and La Niña? Retrieved January 9, 2018, from https://oceanservice.noaa.gov/facts/ninonina.html
OECD and UN-FAO. (2018). OECD-FAO Agricultural Outlook 2018 - 2027. Retrieved August 27, 2018, from https://stats.oecd.org/index.aspx?#
OFX.com. (2018). Historical Exchange Rates. Retrieved from https://www.ofx.com/en-au/forex-news/historical-exchange-rates/
25
Ombudsman Indonesia. (2018, April 6). Siaran Pers: Ombudsman Paparkan Temuan Maladministrasi dalam Tata Niaga Gula Kristal Rafinasi [Press Release: Ombudsman Reveals Maladministration in Sugar Trade System]. Retrieved September 17, 2018, from http://www.ombudsman.go.id/news/r/siaran-pers-ombudsman-paparkan-temuan-maladministrasi-dalam-tata-niaga-gula-kristal-rafinasi
Primadhyta, S. (2017, September 28). Kemendag Taksir 300 Ribu Tonne Gula Rafinasi Bocor Setiap Tahun [Ministry of Trade estimates 300,000 tonnes of refined sugar smuggled every year]. Retrieved from https://www.cnnindonesia.com/ekonomi/20170928170412-92-244676/kemendag-taksir-300-ribu-tonne-gula-rafinasi-bocor-setiap-tahun
Pujitiasih, H., Arifin, B., & Situmorang, S. (2014). ANALISIS POSISI DAN TINGKAT KETERGANTUNGAN IMPOR GULA KRISTAL PUTIH DAN GULA KRISTAL RAFINASI INDONESIA DI PASAR INTERNASIONAL. JIIA, 2(1), 34.
Purwono. (2003). PENENTUAN RENDEMEN GULA TEBU SECARA CEPAT [Rapid Method to Accurately Determine Sugar Extraction Rate]. Paper Individu m.k. Pengantar Falsafah Sains [Individual Paper for Science Philosophy Class], 1.
Representative of PT. OI & PT. KTM. (2018, August 31). Personal Interview.
Safutra, I. (2017, September 28). Setiap Tahun 300 Ribu Tonne Gula Rafinasi Bocor ke Pasar dan Toko [300,000 tonnes of refined sugar smuggled into consumer market every year]. Retrieved from https://www.jawapos.com/ekonomi/28/09/2017/setiap-tahun-300-ribu-tonne-gula-rafinasi-bocor-ke-pasar-dan-toko
Statistics Indonesia. (2016). Perkembangan Produk Domestik Bruto dan Produk Domestik Bruto per Kapita Atas Dasar Harga Konstan [Development of Gross Domestic Products and Gross Domestic Products per Capita on Constant Basic Prices], 2010-2016. Retrieved from https://www.bps.go.id/subject/11/produk-domestik-bruto--lapangan-usaha-.html#subjekViewTab3
Statistics Indonesia. (2017a). Laporan Bulanan Data Sosial Ekonomi. Jakarta. https://doi.org/9199017
Statistics Indonesia. (2017b). Luas Tanaman Perkebunan Menurut Propinsi dan Jenis Tanaman [Plantation Area by Province and Crops], Indonesia (000 Ha), 2011-2017*). Retrieved January 9, 2018, from https://www.bps.go.id/dynamictable/2015/09/04/838/luas-tanaman-perkebunan-menurut-propinsi-dan-jenis-tanaman-indonesia-000-ha-2011-2017-.html
Statistics Indonesia. (2017c). Pengeluaran untuk Konsumsi Penduduk Indonesia - Buku 1 - Maret 2017 [Consumption Expenditure of Population of Indonesia - First Book - March 2017].
Statistics Indonesia. (2017d). Statistik Indonesia 2017 [Statistical Yearbook of Indonesia 2017]. Statistics Indonesia.
Statistics Indonesia. (2018). Garis Kemiskinan Menurut Provinsi [Poverty Line by Provinces], 2013 - 2018. Retrieved from https://www.bps.go.id/linkTableDinamis/view/id/1120
Statistics Indonesia. (2018a). Buletin Statistik Perdagangan Luar Negeri - Impor - Februari 2018 [Foreign Trade Statistical Bulletin - Imports - February 2018].
26
Statistics Indonesia. (2018b). Laporan Bulanan Data Sosial Ekonomi [Socio-Economic Data Monthly Report] September 2018.
Sutari, T. (2018, May 6). Mendag Pastikan Lelang Gula Rafinasi Berlanjut dengan Perpres [Minister of Trade Confirms Refined Sugar Auction Continues with Presidential Regulation]. Retrieved September 17, 2018, from https://www.cnnindonesia.com/ekonomi/20180605120403-92-303558/mendag-pastikan-lelang-gula-rafinasi-berlanjut-dengan-perpres
The Economic Times. (2012, July 19). Government approves 17 per cent hike in sugarcane price for 2012-13. Retrieved September 1, 2018, from https://economictimes.indiatimes.com/news/economy/agriculture/government-approves-17-per-cent-hike-in-sugarcane-price-for-2012-13/articleshow/15046742.cms
The World Bank. (2010 - 2018). The World Bank Commodities Price Data (The Pink Sheet).
The World Bank. (2017). World Bank Commodities Price Data (The Pink Sheet).
The World Bank. (2017a). The World Bank Commodities Price Data (The Pink Sheet).
The World Bank. (2017b). The World Bank Data - Population. Retrieved from https://data.worldbank.org/indicator/SP.POP.TOTL
The World Bank. (2018, June 4). World Bank Commodity Price Data (The Pink Sheet) - Annual Prices. Retrieved from pubdocs.worldbank.org/en/226371486076391711/CMO-Historical-Data-Annual.xlsx
U S Department of Agriculture [USDA]. (2008 - 2017). Sugar Annual Report - Indonesia.
US Department of Agriculture [USDA]. (2008 - 2018). Sugar Annual - Philippines.
US Department of Agriculture [USDA]. (2008 - 2017). Sugar Semi-Annual - Thailand.
US Department of Agriculture [USDA]. (2014). Sugar Annual 2014 - Indonesia (p. 8). USDA.
US Department of Agriculture [USDA]. (2015). Sugar Annual 2015 - Indonesia (p. 9). USDA.
US Department of Agriculture [USDA]. (2016). Sugar Annual 2016 - Indonesia (p. 12). USDA.
US Department of Agriculture [USDA]. (2017a). Sugar and Sweeteners Yearbook Tables. Retrieved from https://www.ers.usda.gov/data-products/sugar-and-sweeteners-yearbook-tables.aspx
US Department of Agriculture [USDA]. (2017b). Sugar Annual 2017 - Indonesia (p. 9). USDA.
US Department of Agriculture [USDA]. (2017c). Sugar Semi-Annual 2017 - Thailand.
US Department of Agriculture [USDA]. (2017d). Sugar Semi-Annual 2017 - China.
US Department of Agriculture [USDA]. (2018a). Sugar Annual 2018 - Brazil. USDA.
US Department of Agriculture [USDA]. (2018b). Sugar Annual 2018 - India. USDA.
US Department of Agriculture [USDA]. (2018c). Sugar Annual 2018 - Philippines (p. 12).
27
US Department of Agriculture [USDA]. (2018d). Sugar Glossary. Retrieved September 1, 2018, from https://www.fsa.usda.gov/programs-and-services/economic-and-policy-analysis/dairy-and-sweeteners-analysis/sugar-glossary/index#d
World Meteorological Organization [WMO]. (2018, October 9). WMO Update: 70% chance of El Niño by end of 2018. Retrieved September 14, 2018, from https://public.wmo.int/en/media/press-release/wmo-update-70-chance-of-el-niño-end-of-2018
X-Rates. (2017). X-Rates Converter Exchange Rates. Retrieved February 14, 2017, from http://www.x-rates.com/average/?from=USD&to=IDR&amount=1&year=2010
X-Rates.com. (2018). Currency Calculator. Retrieved January 9, 2018, from http://x-rates.com/
Yuniarta, L., & Winarto, Y. (2018, April 6). LHAP Ombudsman: Lelang gula rafinasi perlu dihidupkan lagi [Ombudsman Investigative Report: Auction system on refined sugar should be revived]. Retrieved September 17, 2018, from https://industri.kontan.co.id/news/ombudsman-serahkan-laporan-akhir-pemeriksaan-perdagangan-gula-rafinasi
Zahniser, S., & Moreno, A. H. (2014). North American Agricultural Trade Policy: Are Super-Regionalism and Deeper Regional Integration the “Next Big Thing” after NAFTA?, 34.
Ziltener, P. (2017). Missing link: The case of free trade between Switzerland and Taiwan, 25.
28
Annex I
Analysis of sugar prices in Indonesia and in the international market, and also sugar prices in Indonesia and Sugar Volume Import
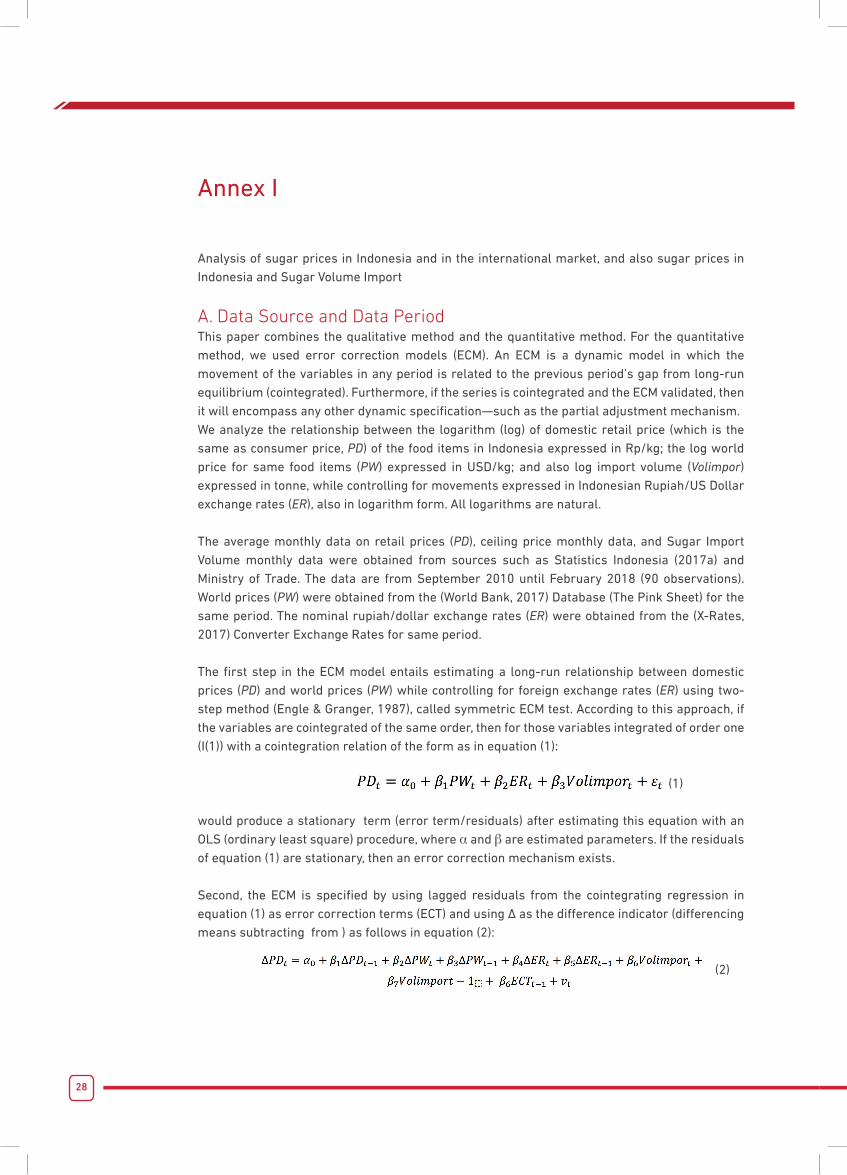
A. Data Source and Data PeriodThis paper combines the qualitative method and the quantitative method. For the quantitative method, we used error correction models (ECM). An ECM is a dynamic model in which the movement of the variables in any period is related to the previous period’s gap from long-run equilibrium (cointegrated). Furthermore, if the series is cointegrated and the ECM validated, then it will encompass any other dynamic specification—such as the partial adjustment mechanism.We analyze the relationship between the logarithm (log) of domestic retail price (which is the same as consumer price, PD) of the food items in Indonesia expressed in Rp/kg; the log world price for same food items (PW) expressed in USD/kg; and also log import volume (Volimpor) expressed in tonne, while controlling for movements expressed in Indonesian Rupiah/US Dollar exchange rates (ER), also in logarithm form. All logarithms are natural.
The average monthly data on retail prices (PD), ceiling price monthly data, and Sugar Import Volume monthly data were obtained from sources such as Statistics Indonesia (2017a) and Ministry of Trade. The data are from September 2010 until February 2018 (90 observations). World prices (PW) were obtained from the (World Bank, 2017) Database (The Pink Sheet) for the same period. The nominal rupiah/dollar exchange rates (ER) were obtained from the (X-Rates, 2017) Converter Exchange Rates for same period.
The first step in the ECM model entails estimating a long-run relationship between domestic prices (PD) and world prices (PW) while controlling for foreign exchange rates (ER) using two-step method (Engle & Granger, 1987), called symmetric ECM test. According to this approach, if the variables are cointegrated of the same order, then for those variables integrated of order one (I(1)) with a cointegration relation of the form as in equation (1):
(1)
would produce a stationary term (error term/residuals) after estimating this equation with an OLS (ordinary least square) procedure, where α and β are estimated parameters. If the residuals of equation (1) are stationary, then an error correction mechanism exists.
Second, the ECM is specified by using lagged residuals from the cointegrating regression in equation (1) as error correction terms (ECT) and using ∆ as the difference indicator (differencing means subtracting from ) as follows in equation (2):
(2)
29
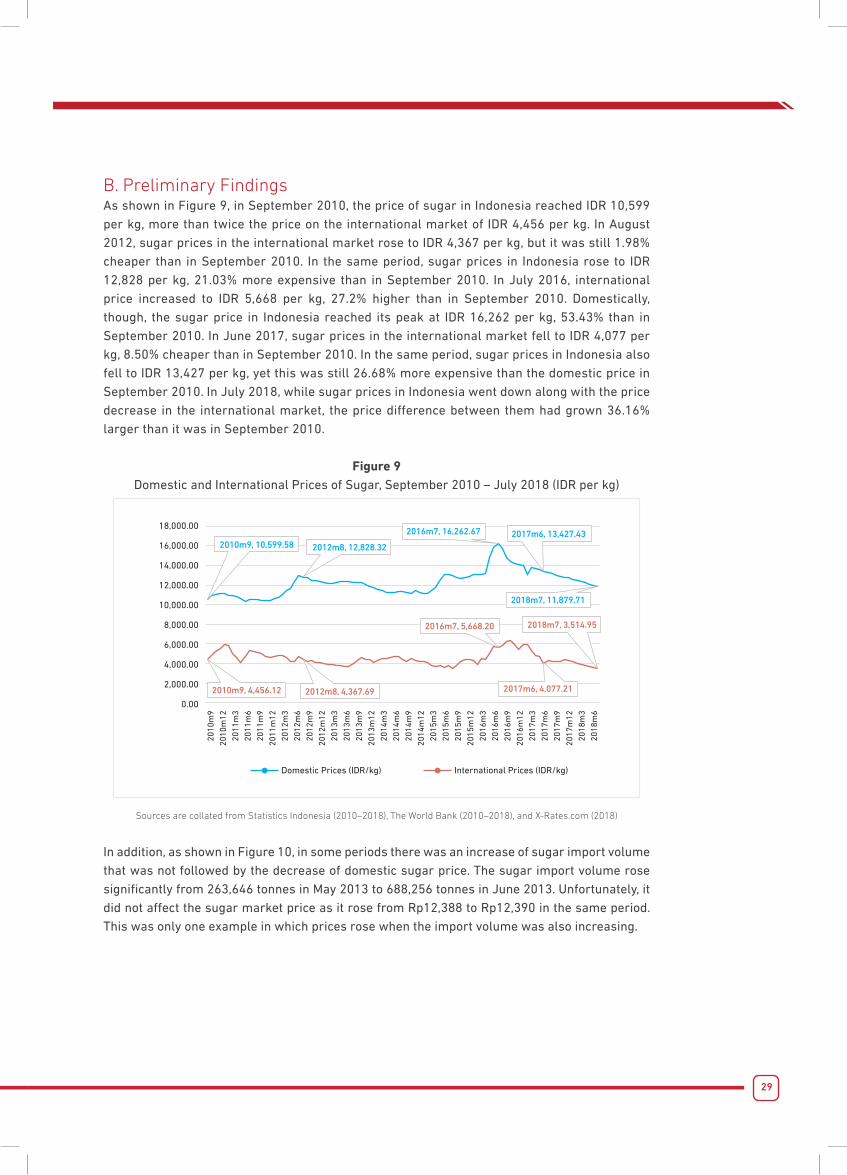
B. Preliminary FindingsAs shown in Figure 9, in September 2010, the price of sugar in Indonesia reached IDR 10,599 per kg, more than twice the price on the international market of IDR 4,456 per kg. In August 2012, sugar prices in the international market rose to IDR 4,367 per kg, but it was still 1.98% cheaper than in September 2010. In the same period, sugar prices in Indonesia rose to IDR 12,828 per kg, 21.03% more expensive than in September 2010. In July 2016, international price increased to IDR 5,668 per kg, 27.2% higher than in September 2010. Domestically, though, the sugar price in Indonesia reached its peak at IDR 16,262 per kg, 53.43% than in September 2010. In June 2017, sugar prices in the international market fell to IDR 4,077 per kg, 8.50% cheaper than in September 2010. In the same period, sugar prices in Indonesia also fell to IDR 13,427 per kg, yet this was still 26.68% more expensive than the domestic price in September 2010. In July 2018, while sugar prices in Indonesia went down along with the price decrease in the international market, the price difference between them had grown 36.16% larger than it was in September 2010.
Figure 9Domestic and International Prices of Sugar, September 2010 – July 2018 (IDR per kg)
18,000.00
16,000.00
14,000.00
12,000.00
10,000.00
8,000.00
6,000.00
4,000.00
2,000.00
0.00
Domestic Prices (IDR/kg) International Prices (IDR/kg)
2010m9, 10,599.58 2012m8, 12,828.32
2016m7, 16,262.67 2017m6, 13,427.43
2018m7, 11,879.71
2010m9, 4,456.12 2012m8, 4,367.69
2016m7, 5,668.20 2018m7, 3,514.95
2017m6, 4,077.21
2010
m9
2010
m12
2011
m3
2011
m6
2011
m9
2011
m12
2012
m3
2012
m6
2012
m9
2012
m12
2013
m3
2013
m6
2013
m9
2013
m12
2014
m3
2014
m6
2014
m9
2014
m12
2015
m3
2015
m6
2015
m9
2015
m12
2016
m3
2016
m6
2016
m9
2016
m12
2017
m3
2017
m6
2017
m9
2017
m12
2018
m3
2018
m6
Sources are collated from Statistics Indonesia (2010–2018), The World Bank (2010–2018), and X-Rates.com (2018)
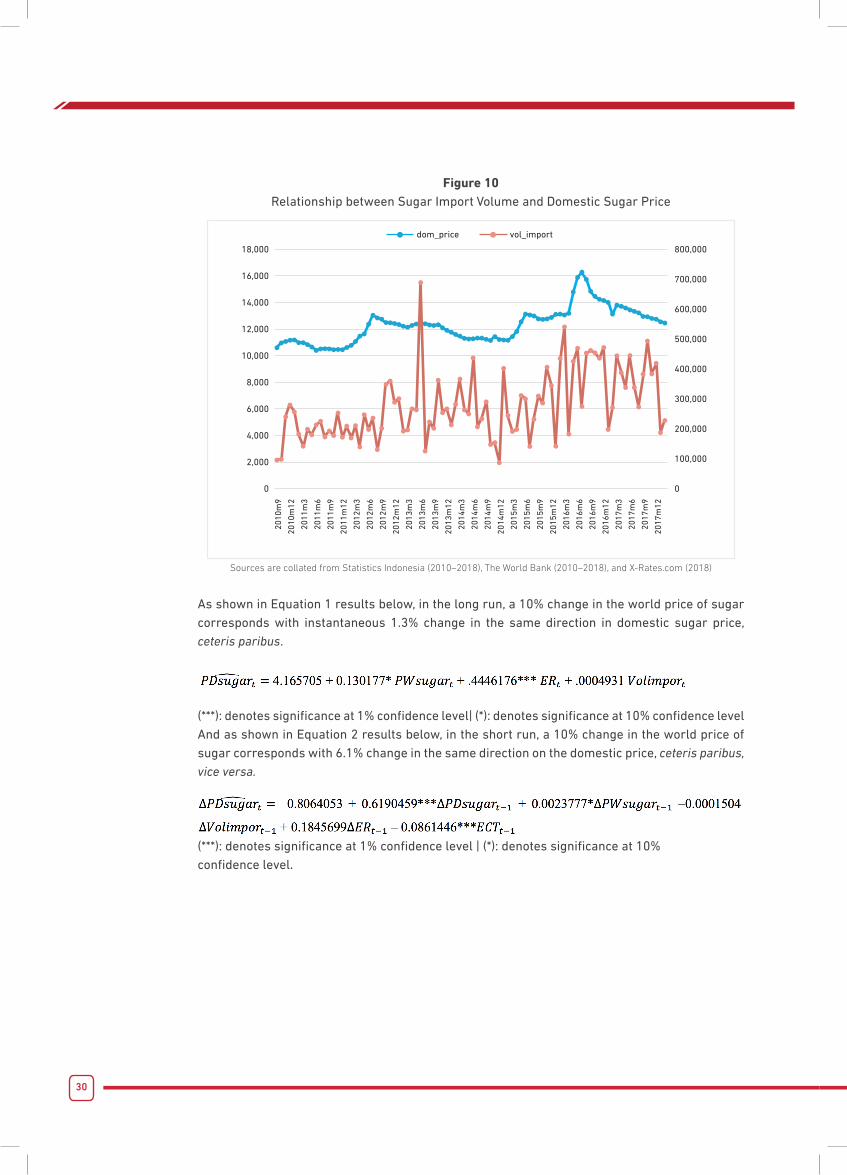
In addition, as shown in Figure 10, in some periods there was an increase of sugar import volume that was not followed by the decrease of domestic sugar price. The sugar import volume rose significantly from 263,646 tonnes in May 2013 to 688,256 tonnes in June 2013. Unfortunately, it did not affect the sugar market price as it rose from Rp12,388 to Rp12,390 in the same period. This was only one example in which prices rose when the import volume was also increasing.
30
Figure 10Relationship between Sugar Import Volume and Domestic Sugar Price
18,000
16,000
14,000
12,000
10,000
8,000
6,000
4,000
2,000
0
dom_price vol_import
2010
m9
2010
m12
2011
m3
2011
m6
2011
m9
2011
m12
2012
m3
2012
m6
2012
m9
2012
m12
2013
m3
2013
m6
2013
m9
2013
m12
2014
m3
2014
m6
2014
m9
2014
m12
2015
m3
2015
m6
2015
m9
2015
m12
2016
m3
2016
m6
2016
m9
2016
m12
2017
m3
2017
m6
2017
m9
2017
m12
800,000
700,000
600,000
500,000
400,000
300,000
200,000
100,000
0
Sources are collated from Statistics Indonesia (2010–2018), The World Bank (2010–2018), and X-Rates.com (2018)
As shown in Equation 1 results below, in the long run, a 10% change in the world price of sugar corresponds with instantaneous 1.3% change in the same direction in domestic sugar price, ceteris paribus.
(***): denotes significance at 1% confidence level| (*): denotes significance at 10% confidence levelAnd as shown in Equation 2 results below, in the short run, a 10% change in the world price of sugar corresponds with 6.1% change in the same direction on the domestic price, ceteris paribus, vice versa.
(***): denotes significance at 1% confidence level | (*): denotes significance at 10%confidence level.
31
Annex II
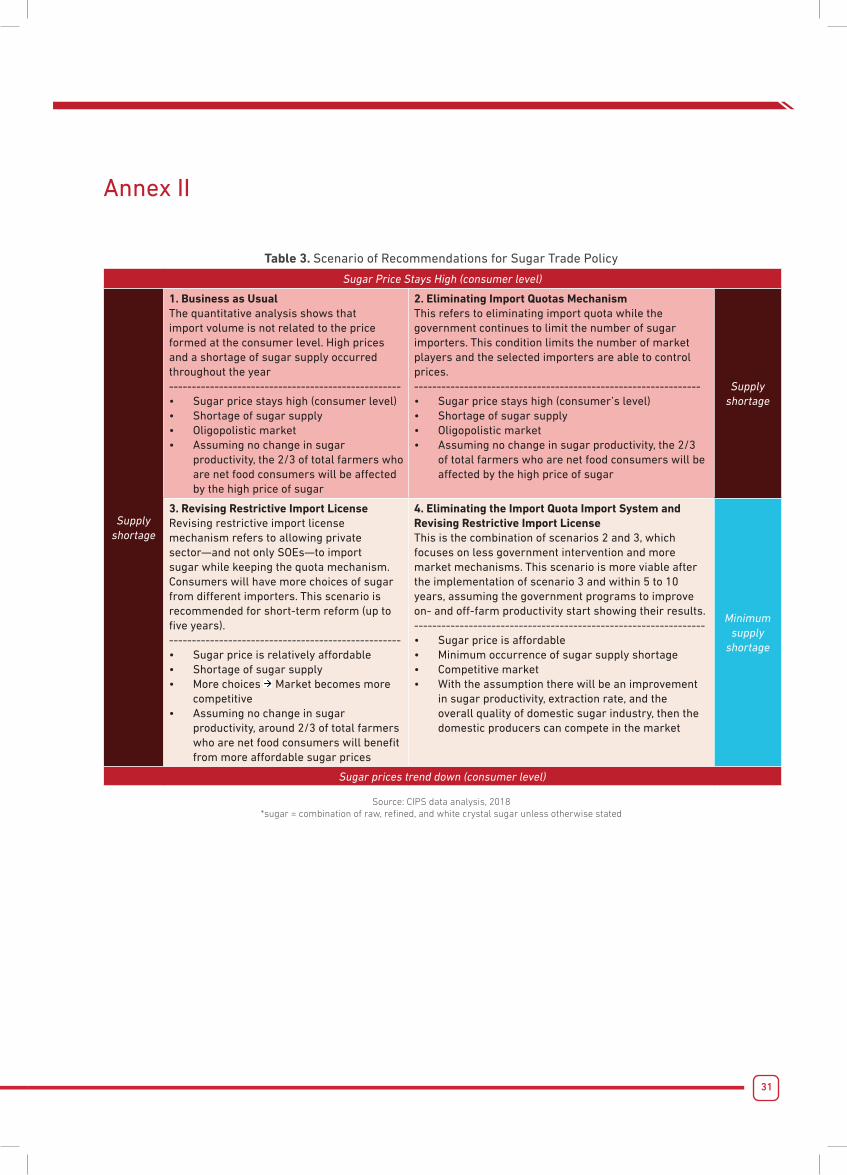
Table 3. Scenario of Recommendations for Sugar Trade Policy
Sugar Price Stays High (consumer level)
Supply shortage
1. Business as Usual The quantitative analysis shows that import volume is not related to the price formed at the consumer level. High prices and a shortage of sugar supply occurred throughout the year ---------------------------------------------------• Sugar price stays high (consumer level) • Shortage of sugar supply• Oligopolistic market• Assuming no change in sugar
productivity, the 2/3 of total farmers who are net food consumers will be affected by the high price of sugar
2. Eliminating Import Quotas Mechanism This refers to eliminating import quota while the government continues to limit the number of sugar importers. This condition limits the number of market players and the selected importers are able to control prices. ---------------------------------------------------------------• Sugar price stays high (consumer’s level) • Shortage of sugar supply• Oligopolistic market• Assuming no change in sugar productivity, the 2/3
of total farmers who are net food consumers will be affected by the high price of sugar
Supply shortage
3. Revising Restrictive Import License Revising restrictive import license mechanism refers to allowing private sector—and not only SOEs—to import sugar while keeping the quota mechanism. Consumers will have more choices of sugar from different importers. This scenario is recommended for short-term reform (up to five years). ---------------------------------------------------• Sugar price is relatively affordable• Shortage of sugar supply• More choices Market becomes more
competitive• Assuming no change in sugar
productivity, around 2/3 of total farmers who are net food consumers will benefit from more affordable sugar prices
4. Eliminating the Import Quota Import System and Revising Restrictive Import License This is the combination of scenarios 2 and 3, which focuses on less government intervention and more market mechanisms. This scenario is more viable after the implementation of scenario 3 and within 5 to 10 years, assuming the government programs to improve on- and off-farm productivity start showing their results. ----------------------------------------------------------------• Sugar price is affordable • Minimum occurrence of sugar supply shortage • Competitive market • With the assumption there will be an improvement
in sugar productivity, extraction rate, and the overall quality of domestic sugar industry, then the domestic producers can compete in the market
Minimum supply
shortage
Sugar prices trend down (consumer level)
Source: CIPS data analysis, 2018*sugar = combination of raw, refined, and white crystal sugar unless otherwise stated
32Copyright © 2018 by Center for Indonesian Policy Studies
ABOUT THE AUTHORHizkia Respatiadi is the Head of Research at the Center for Indonesian Policy Studies (CIPS). The focus area of his research is policy issues in Food Trade and Agriculture. He leads the Affordable Food for the Poor project that aims to lower basic food prices in Indonesia by reducing trade barriers between Indonesia and other countries.
Previously, Hizkia worked as a civil servant at the Indonesian Ministry of Foreign Affairs. His international experience includes a posting period to the Indonesian Embassy in Zimbabwe, and short-term assignments to the United Kingdom and several countries in Asia and Africa.
Novani Karina Saputri is a Junior Researcher at the Center for Indonesian Policy Studies. Her research focuses on policy issues related to trade and livelihood, including entrepreneurship policies and trade policies on agriculture and food commodities. She is part of CIPS’ Ease of Doing Business project and she compiles the BuRT Index’ (Monthly Household Expenses Index). This index measures and tracks how much Indonesian consumers pay for basic food items and compares this with prices found in neighboring countries. This comparison aims to show how much Indonesian families would save on basic food items if food prices in Indonesia were as cheap as other countries.
Previously, Novani worked as a Teaching Assistant University of Indonesia for Research Associate in Lembaga Manajemen UI and Teaching Assistant for Accounting Research Method in FEB UI.
ABOUT THE CENTER FOR INDONESIAN POLICY STUDIESThe Center for Indonesian Policy Studies (CIPS) is a strictly non-partisan and non-profit think tank providing policy analysis and practical policy recommendations to decision-makers within Indonesia’s legislative and executive branches of government.
CIPS promotes social and economic reforms that are based on the belief that only civil, political, and economic freedom allows Indonesia to prosper. We are financially supported by donors and philanthropists who appreciate the independence of our analysis.
KEY FOCUS AREAS:Food Trade Policy: CIPS exposes links between trade restrictions, food prices, and fulfilment of nutrition for the Indonesian consumers, especially those with low-income.
Education: CIPS studies the quantity and quality of low-cost private schools and whether they are more accountable to the demands of the parents than public schools.
Community Livelihood: CIPS researches areas that impact the livelihoods of individuals and families. This research area focuses on secure property rights, public health in relation to alcohol prohibition laws, and international labour migration.
www.cips-indonesia.org
facebook.com/cips.indonesia @cips_id @cips_id
Grand Wijaya Center Blok F-59Jalan Wijaya IIJakarta Selatan 12160