pm2.5 speciation in moves2013 - us epa · pm speciation 2 pm2.5 speciation ... ca,mg,k, na,cl ....
TRANSCRIPT
Darrell Sonntag
FACA MOVES Review Workgroup July 9, 2013
Air Quality & Modeling Center
Assessment and Standards Division U.S. EPA Office of Transportation & Air Quality
PM2.5 Speciation in MOVES2013
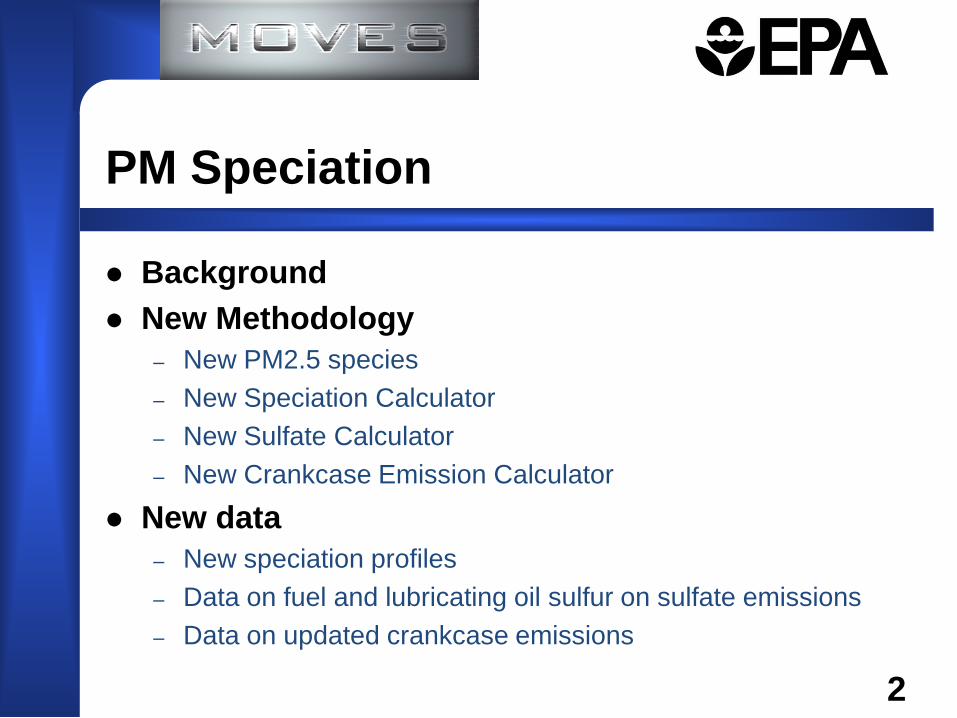
Background New Methodology
– New PM2.5 species – New Speciation Calculator – New Sulfate Calculator – New Crankcase Emission Calculator
New data – New speciation profiles – Data on fuel and lubricating oil sulfur on sulfate emissions – Data on updated crankcase emissions
PM Speciation
2
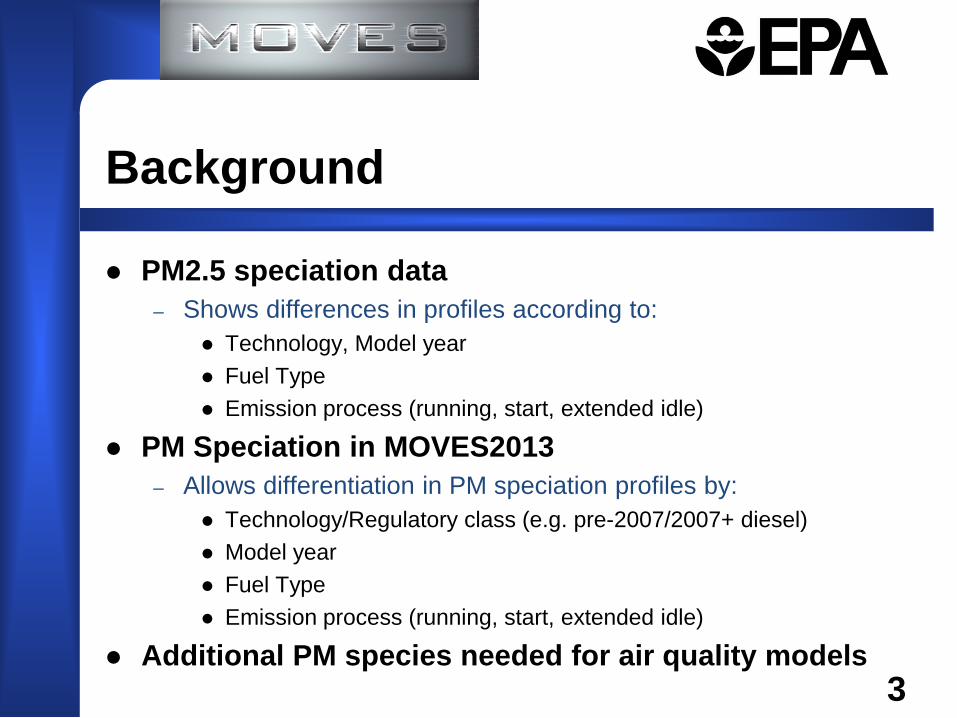
PM2.5 speciation data – Shows differences in profiles according to:
Technology, Model year Fuel Type Emission process (running, start, extended idle)
PM Speciation in MOVES2013 – Allows differentiation in PM speciation profiles by:
Technology/Regulatory class (e.g. pre-2007/2007+ diesel) Model year Fuel Type Emission process (running, start, extended idle)
Additional PM species needed for air quality models
Background
3
4
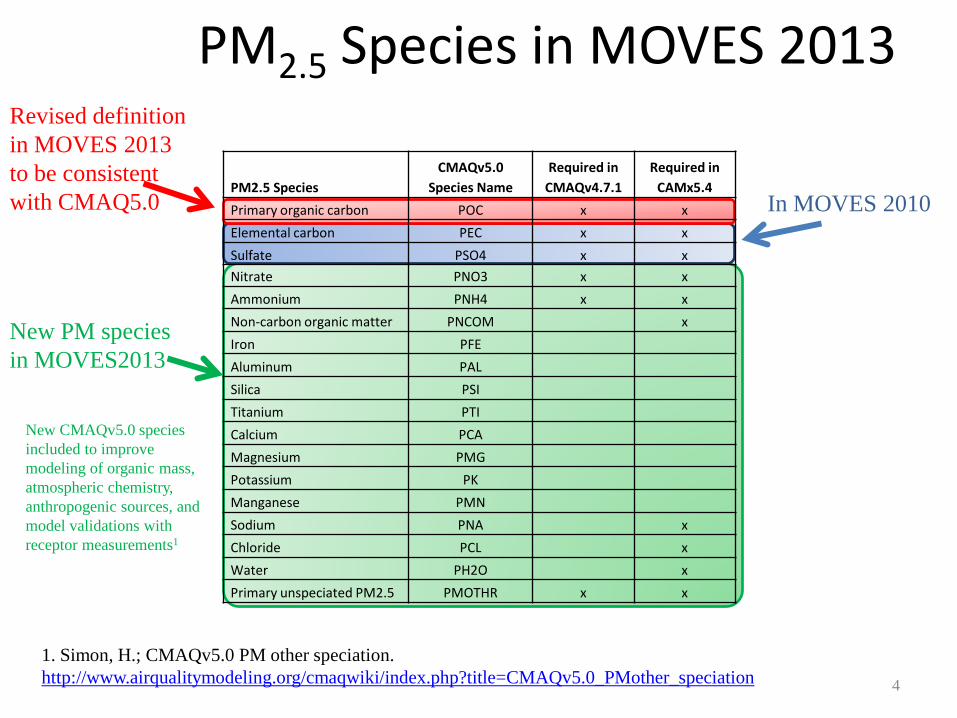
PM2.5 Species in MOVES 2013
PM2.5 Species CMAQv5.0
Species Name Required in
CMAQv4.7.1 Required in
CAMx5.4
Primary organic carbon POC x x
Elemental carbon PEC x x
Sulfate PSO4 x x
Nitrate PNO3 x x
Ammonium PNH4 x x
Non-carbon organic matter PNCOM x
Iron PFE
Aluminum PAL
Silica PSI
Titanium PTI
Calcium PCA
Magnesium PMG
Potassium PK
Manganese PMN
Sodium PNA x
Chloride PCL x
Water PH2O x
Primary unspeciated PM2.5 PMOTHR x x
In MOVES 2010
Revised definition in MOVES 2013 to be consistent with CMAQ5.0
New PM species in MOVES2013
1. Simon, H.; CMAQv5.0 PM other speciation. http://www.airqualitymodeling.org/cmaqwiki/index.php?title=CMAQv5.0_PMother_speciation
New CMAQv5.0 species included to improve modeling of organic mass, atmospheric chemistry, anthropogenic sources, and model validations with receptor measurements1
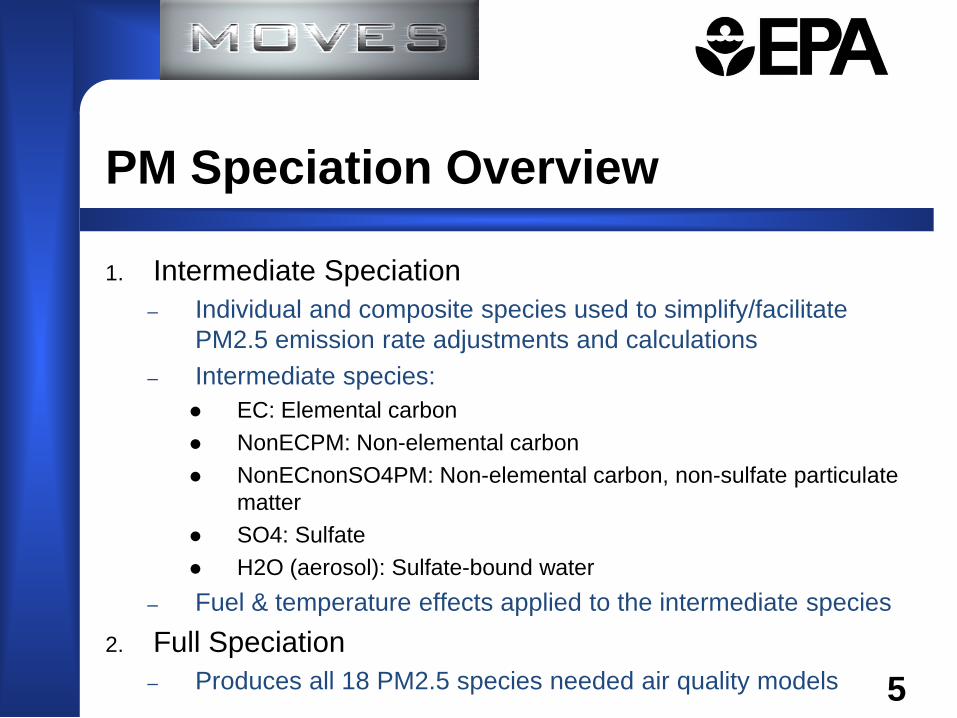
1. Intermediate Speciation – Individual and composite species used to simplify/facilitate
PM2.5 emission rate adjustments and calculations – Intermediate species:
EC: Elemental carbon NonECPM: Non-elemental carbon NonECnonSO4PM: Non-elemental carbon, non-sulfate particulate
matter SO4: Sulfate H2O (aerosol): Sulfate-bound water
– Fuel & temperature effects applied to the intermediate species 2. Full Speciation
– Produces all 18 PM2.5 species needed air quality models
PM Speciation Overview
5

6
EC
Non EC PM
EC, NonECSO4PM, SO4, and H2O exhaust emissions adjusted by fuel and temperature effects. Effects differ by polProcessID SourceType, fuelTypeID, modelYearID
Speciated PM2.5 emissions by ProcessID (start/running/extended idle exhaust and start/running/extended idle crankcase emissions), SourceTypeID, fuelTypeID, modelYearID
EC
OC
SO4
frac
tion
Fe,Al,Si,Ti, Ca,Mg,K,
Na,Cl NO3, NH4
NCOM
PMOther
Basic EC and NonECPM exhaust emission rates produced by MOVES PM calculators. EC is already adjusted for temperature and fuel effects. NonECPM is adjusted for temperature. Structured by polProcessID, SourceTypeID, fuelTypeID, modelYearID
SO4
H20
Tem
pera
ture
Eff
ects
Fuel
Eff
ects
EC
NonECnonSO4
PM
SO4
H20
Total Crankcase
PM2.5
PM10/ PM2.5
PM10 calculated from totalPM2.5. PM10/PM2.5 factors by ProcessID, SourceTypeID, fuelTypeID, modelYearID
EC
NonEC
nonSO4 PM
SO4
H20
EC Exhaust Factor
EC
NonECnonSO4
PM
SO4
H20
Exha
ust
Spec
iatio
n Pr
ofile
Cran
kcas
e Sp
ecia
tion
Prof
ile
EC
NonECnonSO4
PM
SO4
H20
EC
OC
Fe,Al,Si,Ti, Ca,Mg,K,
Na,Cl NO3, NH4
NCOM
PMOther
SO4
H20
SO4/H2O Exhaust Factor
SO4 fraction by polProcessID, SourceType, fuelTypeID, modelYearID
Exhaust and crankcase intermediate PM2.5 species. Individual ratios for EC, NonECnonSO4PM, SO4, and H2O. Ratios differ by polProcessID SourceType, fuelTypeID, modelYearID
Total Exhaust PM2.5
PM10/ PM2.5
EC Crankcase Factor
NonECnonSO4 PM Exhaust
Factor NonECnonSO4 PM Crankcase
Factor
SO4/H2O Crankcase
Factor
Total Exhaust PM10
Total Crankcase
PM10
Sum intermediate PM2.5 species to output TotalPM2.5 .
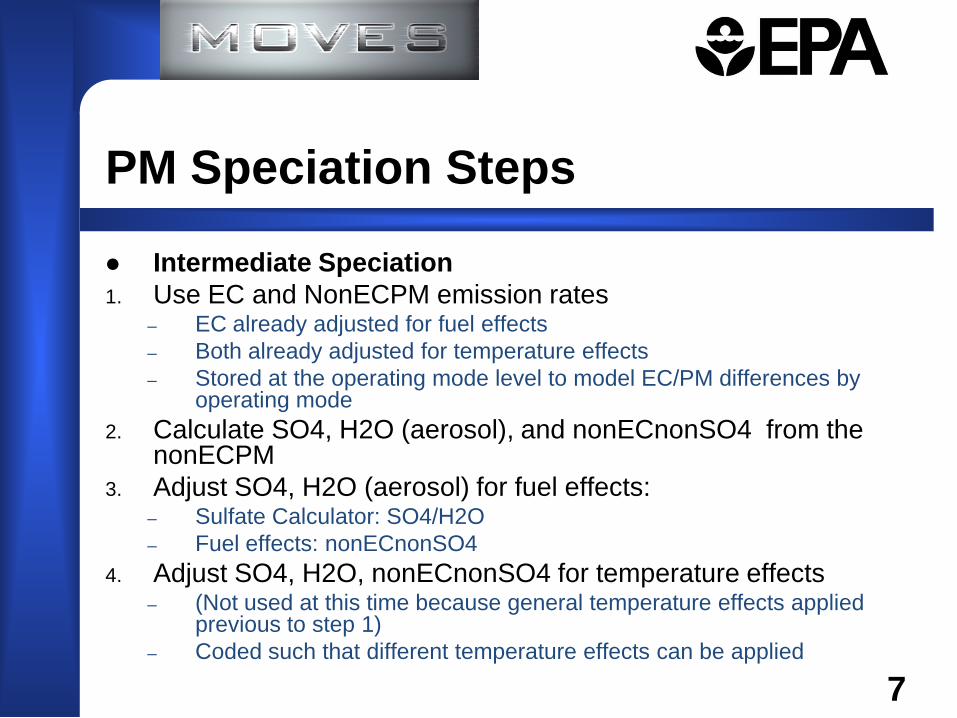
Intermediate Speciation 1. Use EC and NonECPM emission rates
– EC already adjusted for fuel effects – Both already adjusted for temperature effects – Stored at the operating mode level to model EC/PM differences by
operating mode 2. Calculate SO4, H2O (aerosol), and nonECnonSO4 from the
nonECPM 3. Adjust SO4, H2O (aerosol) for fuel effects:
– Sulfate Calculator: SO4/H2O – Fuel effects: nonECnonSO4
4. Adjust SO4, H2O, nonECnonSO4 for temperature effects – (Not used at this time because general temperature effects applied
previous to step 1) – Coded such that different temperature effects can be applied
PM Speciation Steps
7
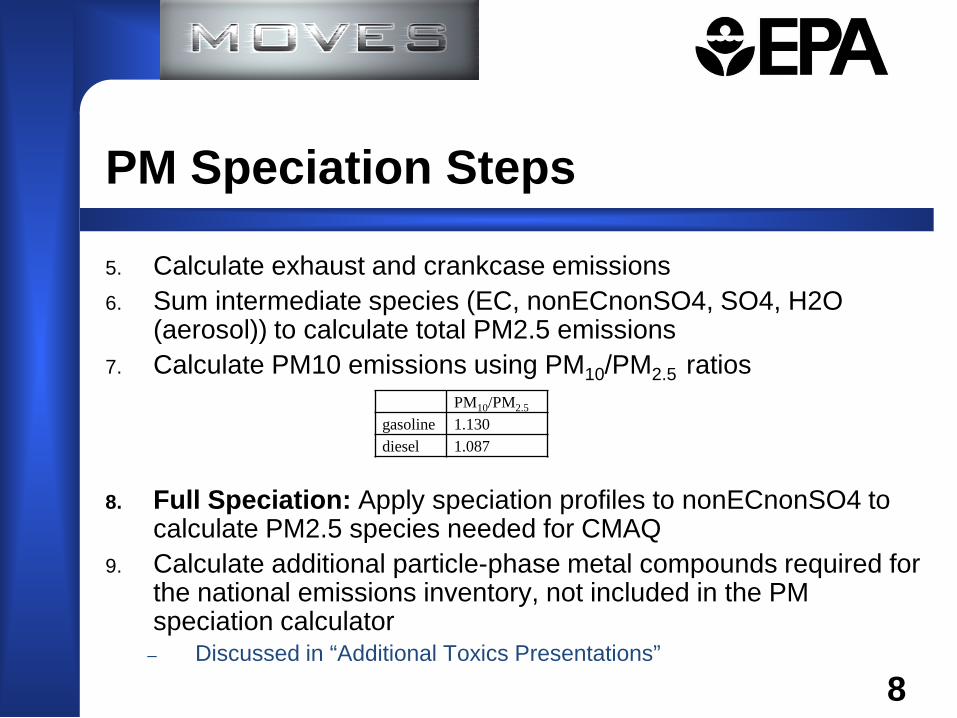
5. Calculate exhaust and crankcase emissions 6. Sum intermediate species (EC, nonECnonSO4, SO4, H2O
(aerosol)) to calculate total PM2.5 emissions 7. Calculate PM10 emissions using PM10/PM2.5 ratios
8. Full Speciation: Apply speciation profiles to nonECnonSO4 to calculate PM2.5 species needed for CMAQ
9. Calculate additional particle-phase metal compounds required for the national emissions inventory, not included in the PM speciation calculator
– Discussed in “Additional Toxics Presentations”
PM Speciation Steps
8
PM10/PM2.5 gasoline 1.130 diesel 1.087
PM2.5 Profiles in MOVES 2013
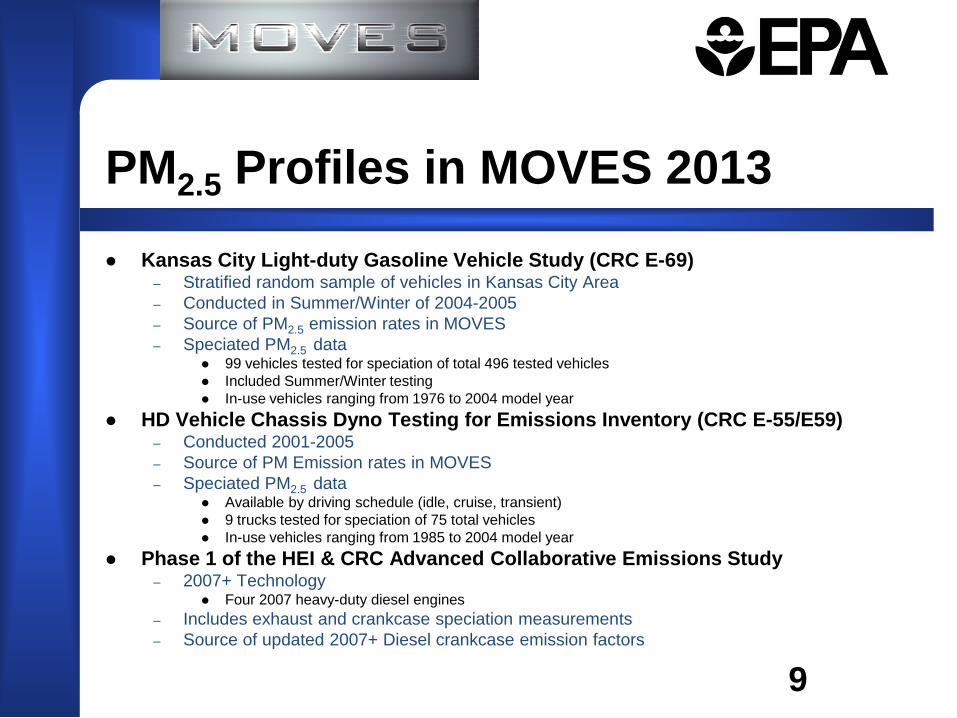
Kansas City Light-duty Gasoline Vehicle Study (CRC E-69) – Stratified random sample of vehicles in Kansas City Area – Conducted in Summer/Winter of 2004-2005 – Source of PM2.5 emission rates in MOVES – Speciated PM2.5 data
99 vehicles tested for speciation of total 496 tested vehicles Included Summer/Winter testing In-use vehicles ranging from 1976 to 2004 model year
HD Vehicle Chassis Dyno Testing for Emissions Inventory (CRC E-55/E59) – Conducted 2001-2005 – Source of PM Emission rates in MOVES – Speciated PM2.5 data
Available by driving schedule (idle, cruise, transient) 9 trucks tested for speciation of 75 total vehicles In-use vehicles ranging from 1985 to 2004 model year
Phase 1 of the HEI & CRC Advanced Collaborative Emissions Study – 2007+ Technology
Four 2007 heavy-duty diesel engines – Includes exhaust and crankcase speciation measurements – Source of updated 2007+ Diesel crankcase emission factors
9
0.0
0.1
0.2
0.3
0.4
0.5
0.6
0.7
0.8
0.9
1.0
start run
PM
2.5
Spe
ciat
ion
Pro
file
Species
CMAQ5.0 unspeciated
CMAQ5.0 elements
NO3
SO4
NH4
NonCarbon OM
Organic Carbon
Elemental Carbon
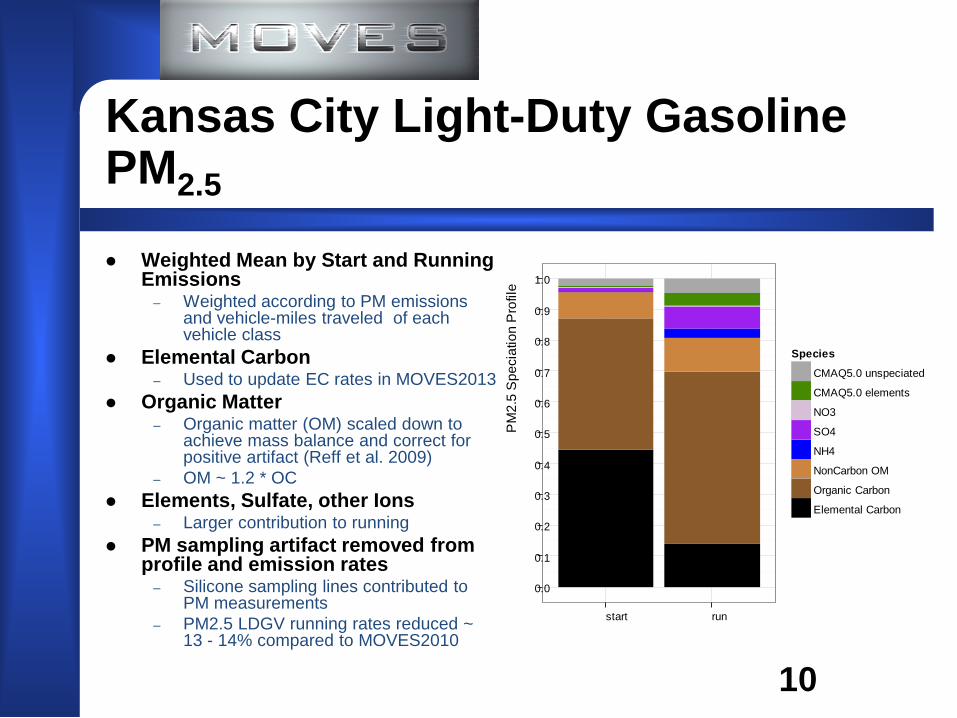
Kansas City Light-Duty Gasoline PM2.5
10
Weighted Mean by Start and Running Emissions
– Weighted according to PM emissions and vehicle-miles traveled of each vehicle class
Elemental Carbon – Used to update EC rates in MOVES2013
Organic Matter – Organic matter (OM) scaled down to
achieve mass balance and correct for positive artifact (Reff et al. 2009)
– OM ~ 1.2 * OC Elements, Sulfate, other Ions
– Larger contribution to running PM sampling artifact removed from
profile and emission rates – Silicone sampling lines contributed to
PM measurements – PM2.5 LDGV running rates reduced ~
13 - 14% compared to MOVES2010
0.0
0.1
0.2
0.3
0.4
0.5
0.6
0.7
0.8
0.9
1.0
Idle Transient
PM
2.5
Spe
ciat
ion
Pro
file
Species
CMAQ5.0 unspeciated
CMAQ5.0 elements
NO3
SO4
NH4
NonCarbon OM
Organic Carbon
Elemental Carbon
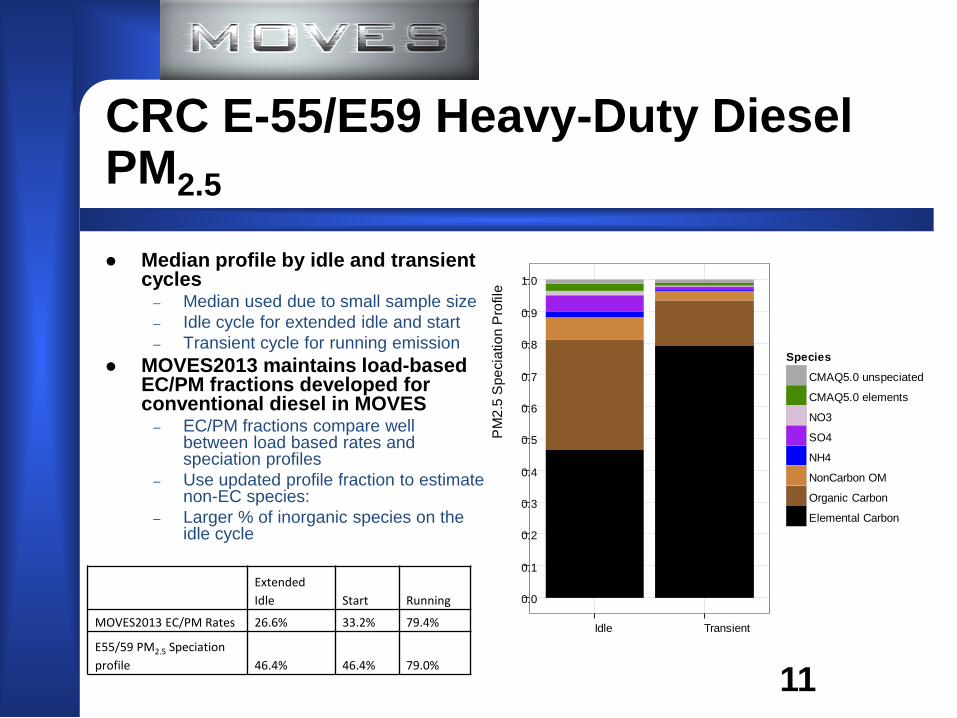
CRC E-55/E59 Heavy-Duty Diesel PM2.5
11
Median profile by idle and transient cycles
– Median used due to small sample size – Idle cycle for extended idle and start – Transient cycle for running emission
MOVES2013 maintains load-based EC/PM fractions developed for conventional diesel in MOVES
– EC/PM fractions compare well between load based rates and speciation profiles
– Use updated profile fraction to estimate non-EC species:
– Larger % of inorganic species on the idle cycle
Extended Idle Start Running
MOVES2013 EC/PM Rates 26.6% 33.2% 79.4%
E55/59 PM2.5 Speciation profile 46.4% 46.4% 79.0%
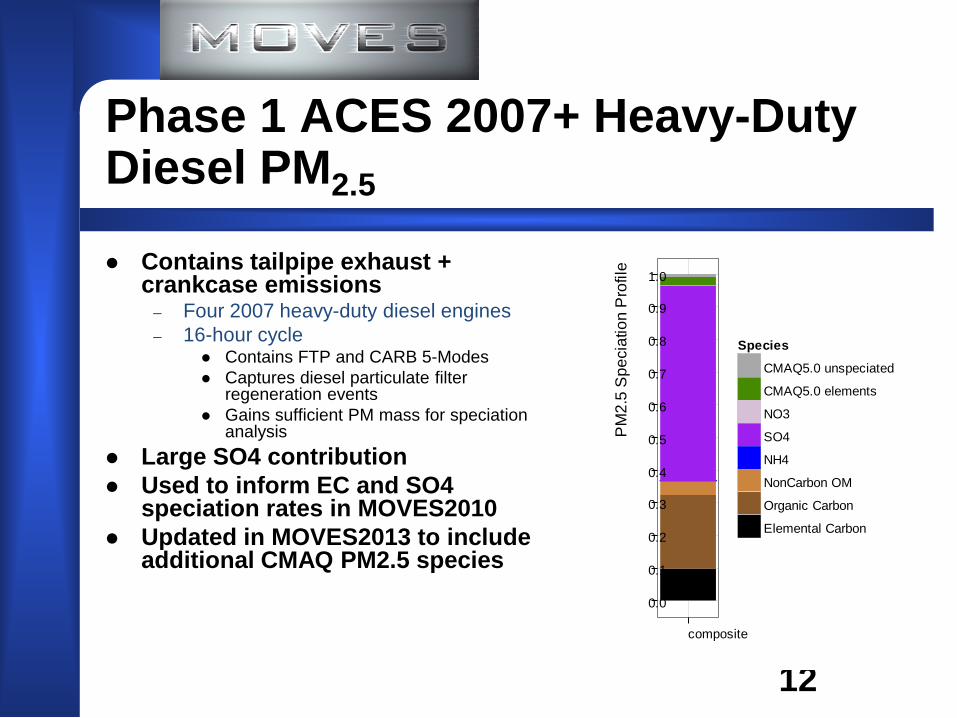
Phase 1 ACES 2007+ Heavy-Duty Diesel PM2.5
12
Contains tailpipe exhaust + crankcase emissions
– Four 2007 heavy-duty diesel engines – 16-hour cycle
Contains FTP and CARB 5-Modes Captures diesel particulate filter
regeneration events Gains sufficient PM mass for speciation
analysis Large SO4 contribution Used to inform EC and SO4
speciation rates in MOVES2010 Updated in MOVES2013 to include
additional CMAQ PM2.5 species
0.0
0.1
0.2
0.3
0.4
0.5
0.6
0.7
0.8
0.9
1.0
compositeP
M2.
5 S
peci
atio
n P
rofil
e
Species
CMAQ5.0 unspeciated
CMAQ5.0 elements
NO3
SO4
NH4
NonCarbon OM
Organic Carbon
Elemental Carbon

1. Sulfate emissions based on PM2.5 speciation profiles
– MOVES can replicate PM profiles measured in exhaust test-programs
– Sulfate contribution to base PM2.5 rates is accounted for – Total PM = Sum of PM species
2. Accounts for fuel and lube oil contributions – Adjusted to the fuel sulfur level – Accounts for contribution from lubricating oil
MOVES2013 Sulfate Calculator
13

0
Lubricating Oil Contribution
Fuel Contribution
SO4, Sulfate emissions
X, Fuel sulfur level (ppm)
SO4B
SO4O
XB
FB = % of Sulfate emissions from Fuel at the Base Case
MOVES2013 Sulfate Calculator
14
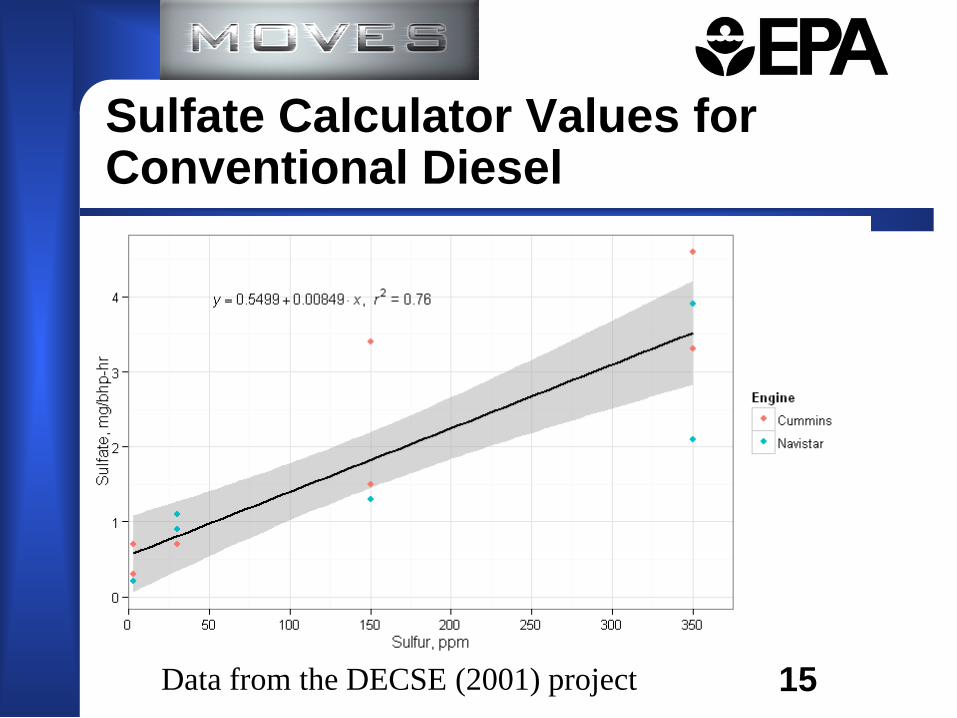
Sulfate Calculator Values for Conventional Diesel
Data from the DECSE (2001) project 15
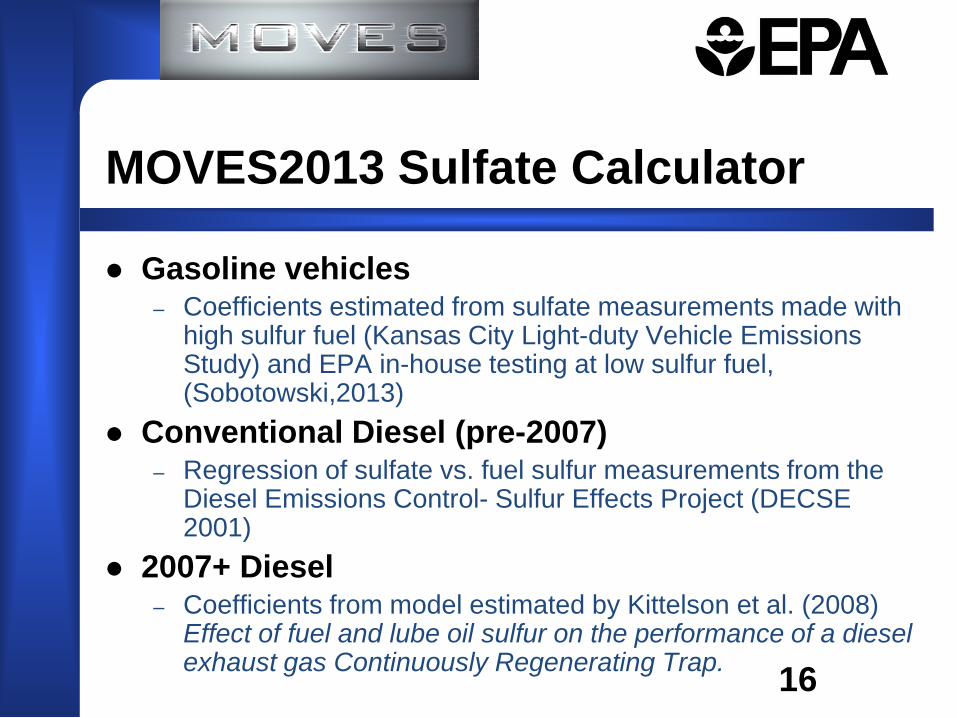
MOVES2013 Sulfate Calculator
Gasoline vehicles – Coefficients estimated from sulfate measurements made with
high sulfur fuel (Kansas City Light-duty Vehicle Emissions Study) and EPA in-house testing at low sulfur fuel, (Sobotowski,2013)
Conventional Diesel (pre-2007) – Regression of sulfate vs. fuel sulfur measurements from the
Diesel Emissions Control- Sulfur Effects Project (DECSE 2001)
2007+ Diesel – Coefficients from model estimated by Kittelson et al. (2008)
Effect of fuel and lube oil sulfur on the performance of a diesel exhaust gas Continuously Regenerating Trap.
16
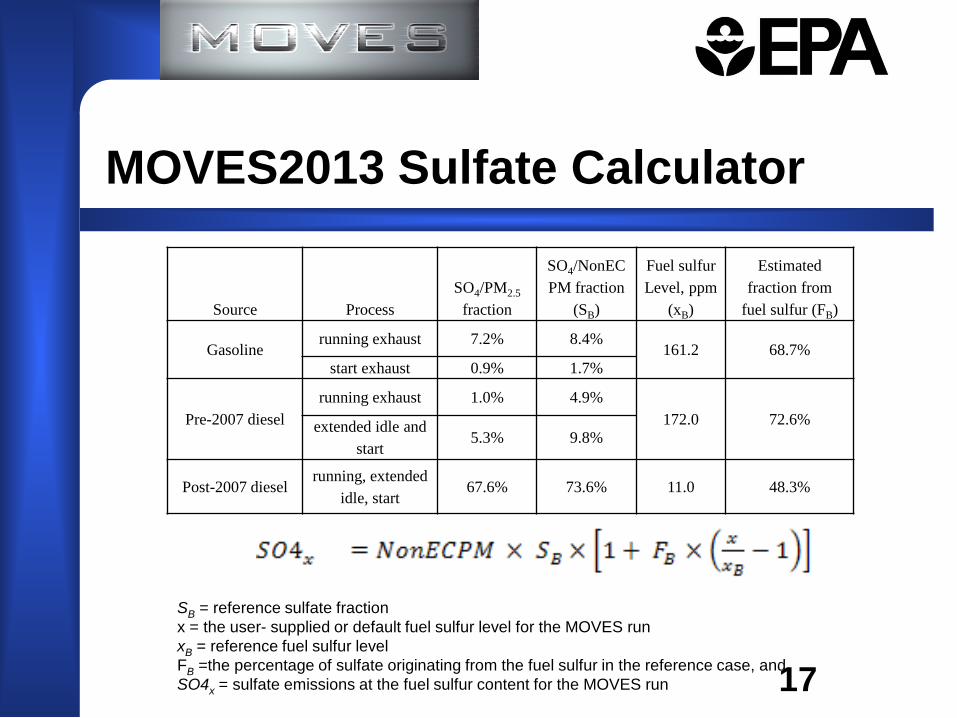
MOVES2013 Sulfate Calculator
Source Process SO4/PM2.5
fraction
SO4/NonECPM fraction
(SB)
Fuel sulfur Level, ppm
(xB)
Estimated fraction from
fuel sulfur (FB)
Gasoline running exhaust 7.2% 8.4%
161.2 68.7% start exhaust 0.9% 1.7%
Pre-2007 diesel running exhaust 1.0% 4.9%
172.0 72.6% extended idle and start
5.3% 9.8%
Post-2007 diesel running, extended
idle, start 67.6% 73.6% 11.0 48.3%
SB = reference sulfate fraction x = the user- supplied or default fuel sulfur level for the MOVES run xB = reference fuel sulfur level FB =the percentage of sulfate originating from the fuel sulfur in the reference case, and SO4x = sulfate emissions at the fuel sulfur content for the MOVES run 17

1. Calculate sulfate emissions from 100 grams of gasoline PM from a passenger car at 5 ppm fuel sulfur content
MOVES2013 Sulfate Calculator: Example
18

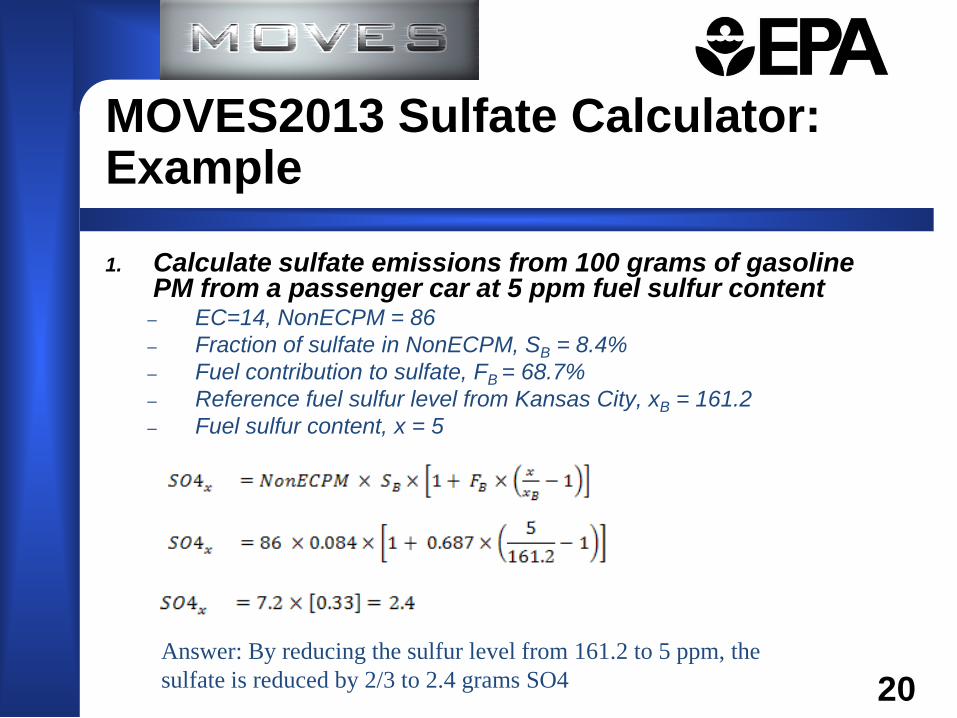
1. Calculate sulfate emissions from 100 grams of gasoline PM from a passenger car at 5 ppm fuel sulfur content
– EC=14, NonECPM = 86 – Fraction of sulfate in NonECPM, SB = 8.4% – Fuel contribution to sulfate, FB = 68.7% – Reference fuel sulfur level from Kansas City, xB = 161.2 – Fuel sulfur content, x = 5
MOVES2013 Sulfate Calculator: Example
19
Source Process SO4/PM2.5
fraction
SO4/NonECPM fraction
(SB)
Fuel sulfur Level, ppm
(xB)
Estimated fraction from
fuel sulfur (FB)
Gasoline running exhaust 7.2% 8.4% 161.2 68.7%
1. Calculate sulfate emissions from 100 grams of gasoline PM from a passenger car at 5 ppm fuel sulfur content
– EC=14, NonECPM = 86 – Fraction of sulfate in NonECPM, SB = 8.4% – Fuel contribution to sulfate, FB = 68.7% – Reference fuel sulfur level from Kansas City, xB = 161.2 – Fuel sulfur content, x = 5
MOVES2013 Sulfate Calculator: Example
20 Answer: By reducing the sulfur level from 161.2 to 5 ppm, the sulfate is reduced by 2/3 to 2.4 grams SO4
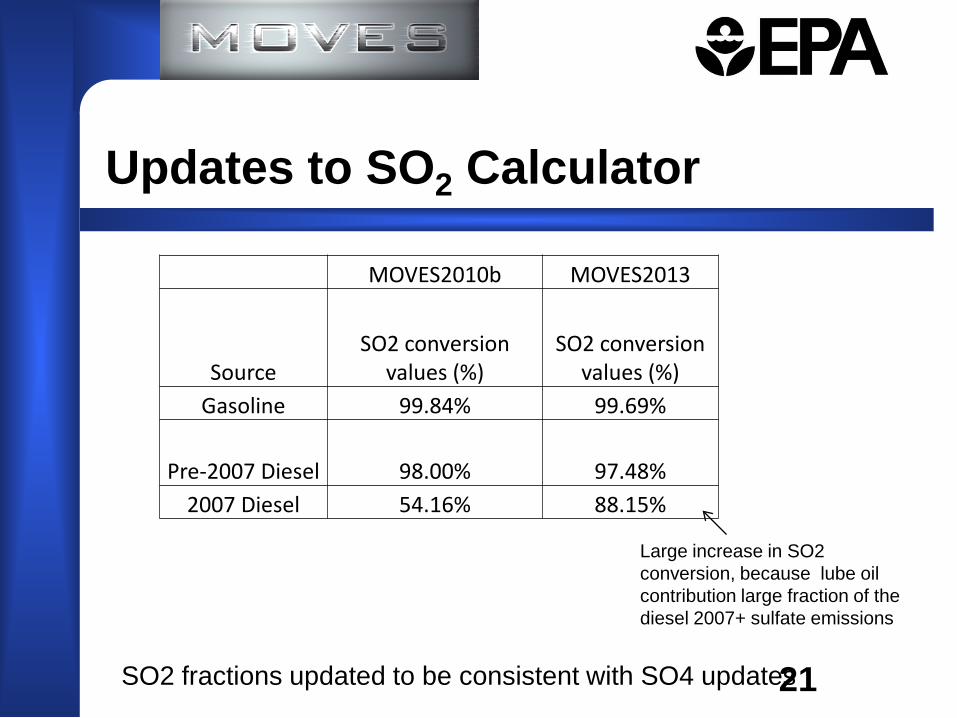
Updates to SO2 Calculator
MOVES2010b MOVES2013
Source SO2 conversion
values (%) SO2 conversion
values (%) Gasoline 99.84% 99.69%
Pre-2007 Diesel 98.00% 97.48% 2007 Diesel 54.16% 88.15%
SO2 fractions updated to be consistent with SO4 updates 21
Large increase in SO2 conversion, because lube oil contribution large fraction of the diesel 2007+ sulfate emissions
MOVES2013 Crankcase Calculator
1. Speciation different between crankcase and exhaust emissions
2. Crankcase emissions for 2007+ diesel engines are included with the exhaust measurements for certification
23
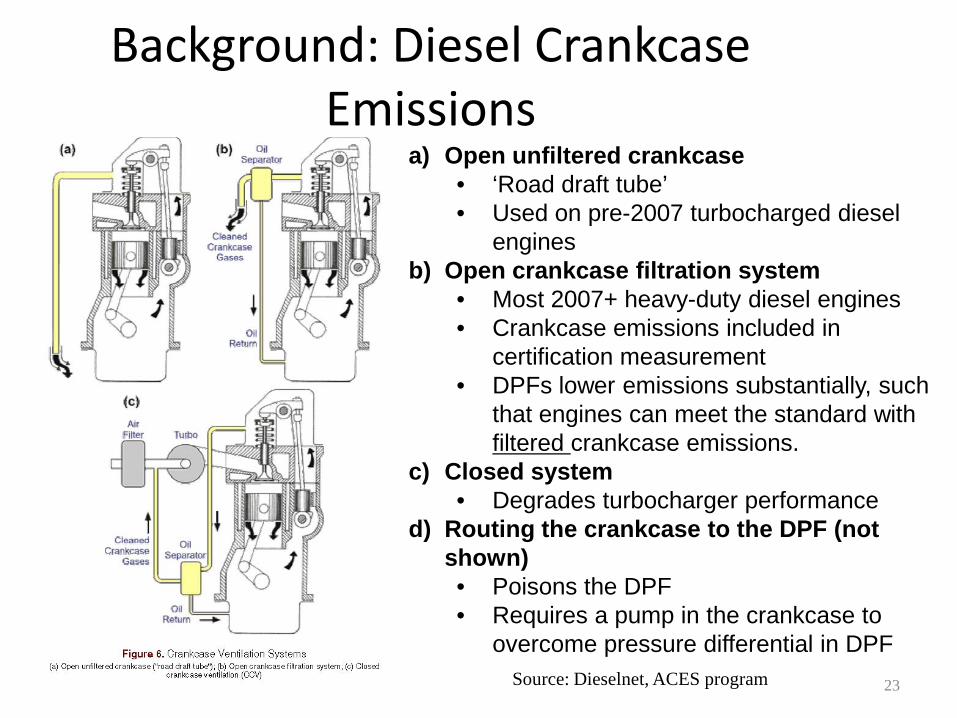
a) Open unfiltered crankcase • ‘Road draft tube’ • Used on pre-2007 turbocharged diesel
engines b) Open crankcase filtration system
• Most 2007+ heavy-duty diesel engines • Crankcase emissions included in
certification measurement • DPFs lower emissions substantially, such
that engines can meet the standard with filtered crankcase emissions.
c) Closed system • Degrades turbocharger performance
d) Routing the crankcase to the DPF (not shown) • Poisons the DPF • Requires a pump in the crankcase to
overcome pressure differential in DPF Source: Dieselnet, ACES program
Background: Diesel Crankcase Emissions
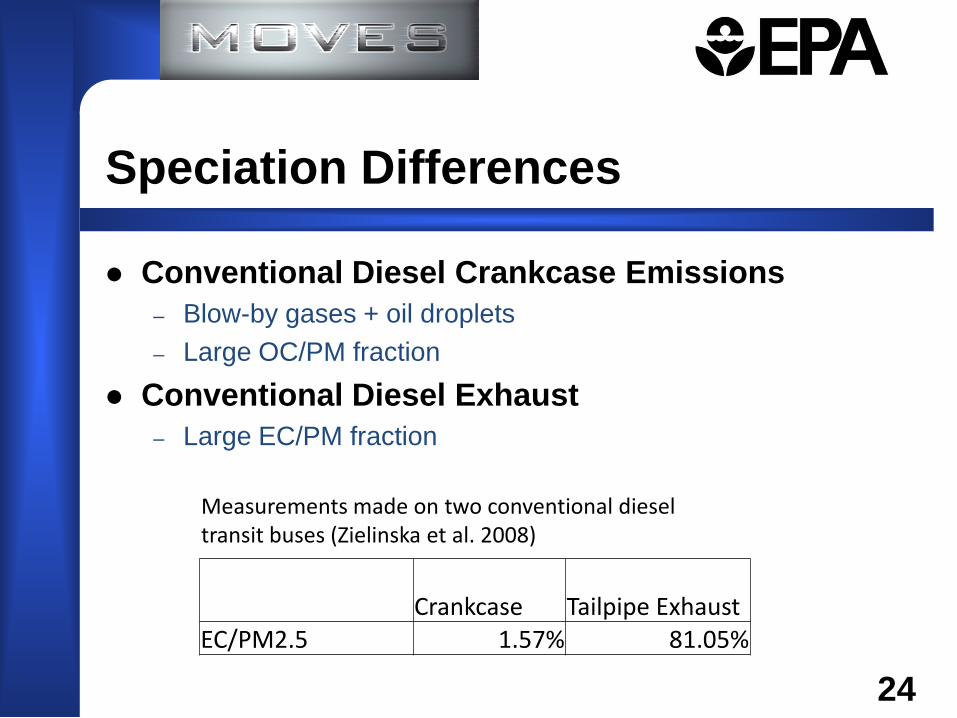
Conventional Diesel Crankcase Emissions – Blow-by gases + oil droplets – Large OC/PM fraction
Conventional Diesel Exhaust – Large EC/PM fraction
Speciation Differences
24
Crankcase Tailpipe Exhaust EC/PM2.5 1.57% 81.05%
Measurements made on two conventional diesel transit buses (Zielinska et al. 2008)

Large Crankcase Contribution
Source: Donaldson Filtration Solutions
Crankcase contributes a larger fraction of the total emissions
Crankcase emissions included in the regulatory measurements of 2007+ diesel engine

26
5
Speciated PM2.5 emissions by ProcessID (start/running/extended idle exhaust and start/running/extended idle crankcase emissions),SourceTypeID, fuelTypeID, modelYearRangeID
EC
OC
Fe,Al,Si,Ti, Ca,Mg,K,
Na,ClNO3, NH4
NCOM
PMOther
SO4
H20
EC
NonECnonSO4
PM
SO4
H20
Total Crankcase
PM2.5
PM10/PM2.5
PM10 calculated from totalPM2.5. PM10/PM2.5 factorsby ProcessID,SourceTypeID, fuelTypeID, modelYearRangeID
EC Exhaust Factor
EC
NonECnonSO4
PM
SO4
H20
Exha
ust
Spec
iati
on
Prof
ile
Cran
kcas
e Sp
ecia
tion
Pr
ofile
EC
NonECnonSO4
PM
SO4
H20
EC
OC
Fe,Al,Si,Ti, Ca,Mg,K,
Na,ClNO3, NH4
NCOM
PMOther
SO4
H20
SO4/H2O ExhaustFactor
Exhaust and crankcase intermediate PM2.5 species. Individual ratios for EC, NonECnonSO4PM, SO4, and H2O. Ratios differ by polProcessID SourceType, fuelTypeID, modelYearRangeID
Total Exhaust PM2.5
PM10/PM2.5
EC Crankcase Factor
NonECnonSO4 PM Exhaust
FactorNonECnonSO4 PM Crankcase
Factor
SO4/H2O Crankcase
Factor
Total Exhaust PM10
Total Crankcase
PM10
Sum intermediate PM2.5 species to output TotalPM2.5 .
Crankcase Calculator

MOVES2013 Crankcase Values for Diesel PM2.5
27
The pre-2007 diesel crankcase emission factors shown are derived such that the crankcase PM2.5 emissions are 20% of the PM2.5 exhaust measurements, and have an EC/PM split of 1.57%.
Pre-2007 Diesel 2007+ Diesel
Pollutant Process Start Running Extended
Idle All
processes EC
Exhaust
1 1 1 0.62
nonECnonSO4PM 1 1 1 0.62 1 1 1 0.62 SO4
H2O 1 1 1 0.62 EC
Crankcase
0.009 0.004 0.012 0.38 nonECnonSO4PM 0.295 0.954 0.268 0.38
SO4 0.295 0.954 0.268 0.38 H2O 0.295 0.954 0.268 0.38
Splits 2007+ diesel emissions into exhaust and crankcase emissions

1. Calculate Crankcase emissions from 100 grams of conventional diesel running PM. What is the EC/PM fraction?
MOVES2013 Crankcase Calculator: Example
28

1. Calculate Crankcase emissions from 100 grams of conventional diesel running PM. What is the EC/PM fraction?
MOVES2013 Crankcase Calculator: Example
29
Running
Emissions EC 79 nonECnonSO4PM 20 SO4 1 H2O 0 Sum = 100 EC/PM = 79.4%
1. Calculate Crankcase emissions from 100 grams of conventional diesel running PM. What is the EC/PM fraction?
MOVES2013 Crankcase Calculator: Example
30
Running
Emissions
Crankcase Emissions
Factor Crankcase Emissions
EC 79 x 0.004 = 0.31 nonECnonSO4PM 20 x 0.954 = 18.72 SO4 1 x 0.954 = 0.96 H2O 0 x 0.954 = 0 Sum = 100 EC/PM = 79.4%

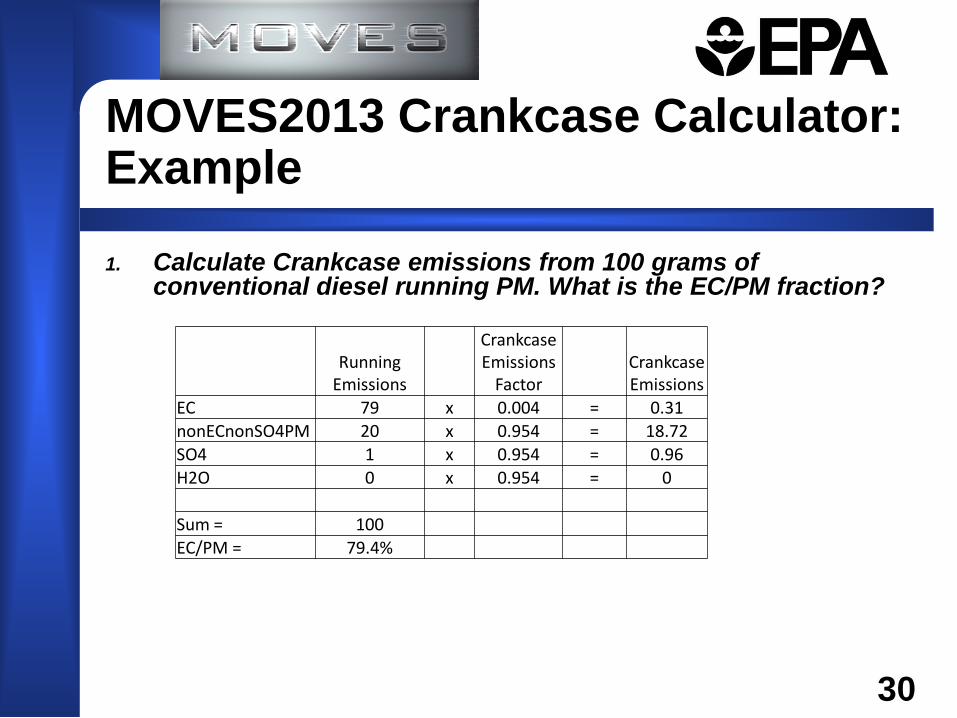
1. Calculate Crankcase emissions from 100 grams of conventional diesel running PM. What is the EC/PM fraction?
MOVES2013 Crankcase Calculator: Example
31
Answer: Crankcase PM2.5 = 20 grams
Running
Emissions
Crankcase Emissions
Factor Crankcase Emissions
EC 79 x 0.004 = 0.31 nonECnonSO4PM 20 x 0.954 = 18.72 SO4 1 x 0.954 = 0.96 H2O 0 x 0.954 = 0 Sum = 100 20 EC/PM = 79.4% 1.6%
EC/PM = 1.6% (same as measured by Zielinska et al. 2008)
MOVES2013 2007+ Diesel Crankcase Emissions
32
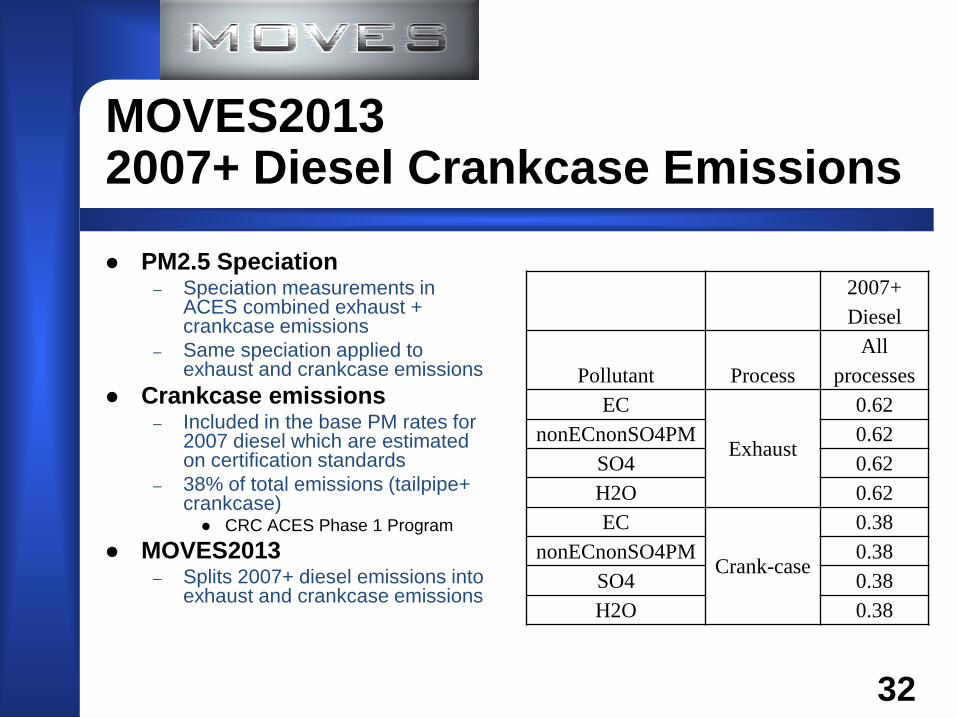
PM2.5 Speciation – Speciation measurements in
ACES combined exhaust + crankcase emissions
– Same speciation applied to exhaust and crankcase emissions
Crankcase emissions – Included in the base PM rates for
2007 diesel which are estimated on certification standards
– 38% of total emissions (tailpipe+ crankcase) CRC ACES Phase 1 Program
MOVES2013 – Splits 2007+ diesel emissions into
exhaust and crankcase emissions
2007+ Diesel
Pollutant Process All
processes EC
Exhaust
0.62 nonECnonSO4PM 0.62
SO4 0.62 H2O 0.62 EC
Crank-case
0.38 nonECnonSO4PM 0.38
SO4 0.38 H2O 0.38
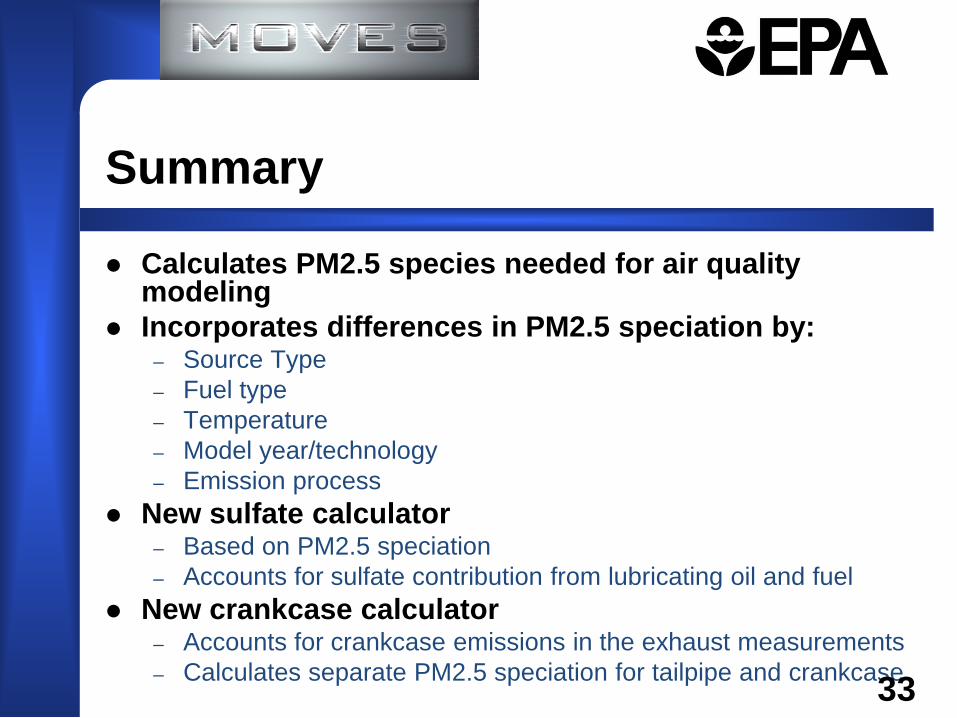
Calculates PM2.5 species needed for air quality modeling
Incorporates differences in PM2.5 speciation by: – Source Type – Fuel type – Temperature – Model year/technology – Emission process
New sulfate calculator – Based on PM2.5 speciation – Accounts for sulfate contribution from lubricating oil and fuel
New crankcase calculator – Accounts for crankcase emissions in the exhaust measurements – Calculates separate PM2.5 speciation for tailpipe and crankcase
Summary
33

1. Simon, H.; CMAQv5.0 PM other speciation. http://www.airqualitymodeling.org/cmaqwiki/index.php?title=CMAQv5.0_PMother_speciation
2. Reff, A.; Bhave, P. V.; Simon, H.; Pace, T. G.; Pouliot, G. A.; Mobley, J. D.; Houyoux, M.; Emissions Inventory of PM2.5 Trace Elements across the United States. Environmental Science & Technology 2009 43 (15), 5790-5796
3. Kansas City PM Characterization Study. Final Report, EPA420-R-08-009. Assessment and Standards Division Office of Transportation and Air Quality U.S. Environmental Protection Agency Ann Arbor, MI, EPA Contract No. GS 10F-0036K, October 27, 2006, Revised April 2008a by EPA staff. http://www.epa.gov/oms/emission-factors-research/420r08009.pdf.
4. Clark, N.N. and Gautam, M. HEAVY-DUTY Vehicle Chassis Dynamometer Testing for Emissions Inventory, Air Quality Modeling, Source Apportionment and Air Toxics Emissions Inventory. August 2007. CRC Report. No. E55/59
5. Khalek, I. A.; Bougher, T. L; Merrit, P. M.; Phase 1 of the Advanced Collaborative Emissions Study. CRC Report: ACES Phase 1, June 2009.
6. Sobotowski, R.; Test Program to establish LDV Full Useful Life PM Performance. EPA Docket # EPA-HQ-OAR-2011-0135. March 2, 2013.
7. Diesel Oxidation Catalysts and Lean-NOx Catalysts. Final Report. Diesel Emission Control –Sulfur Effects (DECSE) Program. June 2001. Sponsored by: The U.S. Department of Energy, Engine Manufacturers Association, Manufacturers of Emission Controls Association.
8. Kittelson, D. B.; Watts, W. F.; Johnson, J. P.; Thorne, C.; Higham, C.; Payne, M.; Goodier, S.; Warrens, C.; Preston, H.; Zink, U.; Pickles, D.; Goersmann, C.; Twigg, M. V.; Walker, A. P.; Boddy, R. Effect of fuel and lube oil sulfur on the performance of a diesel exhaust gas Continuously Regenerating Trap. Environmental Science & Technology. 2008 42 (24), 9276-9282.
9. Jääskeläinen, H. Crankcase Ventilation. DieselNet Technology Guide. www.DieselNet.com. Copyright © Ecopoint Inc. Revision 2012.12.
10. Kalayci, Veli. “Spiracle™ Crankcase Filtration Systems: Technical Article” . Donaldson Company, Inc. January 2011. Available at : www.donaldson.com/en/engine/support/datalibrary/053490.pdf
11. Zielinska, B.; Campbell, D.; Lawson, D. R.; Ireson, R. G.; Weaver, C. S.; Hesterberg, T. W.; Larson, T.; Davey, M.; Liu, L.-J. S. 2008. Detailed characterization and profiles of crankcase and diesel particulate matter exhaust emissions using speciated organics Environ. Sci. Technol. 42(15): 5661-5666.
References:
34
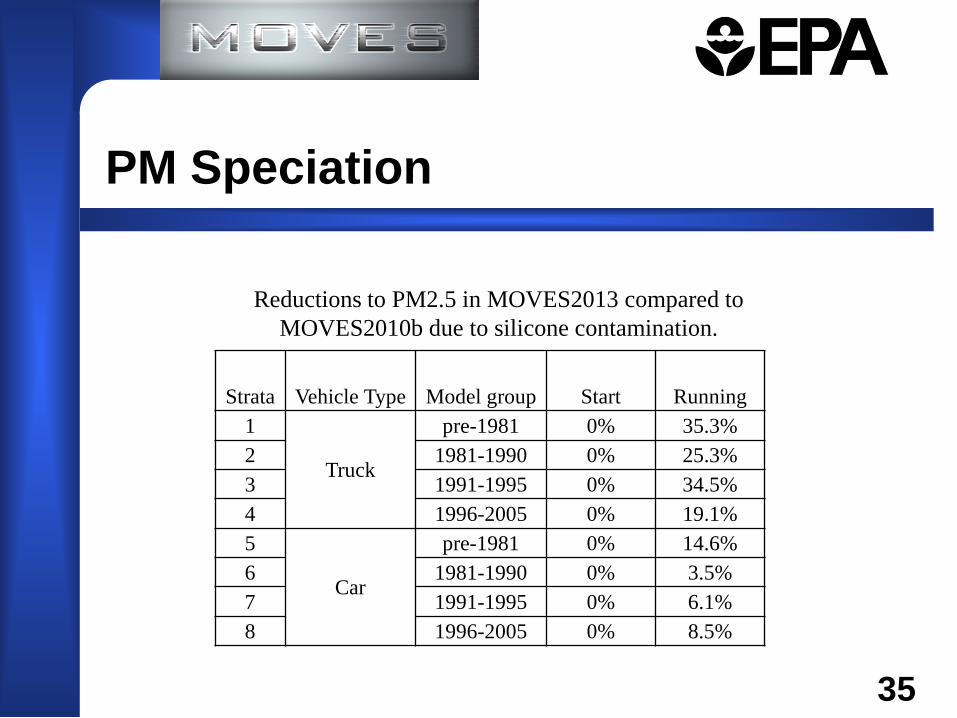
Strata Vehicle Type Model group Start Running 1
Truck
pre-1981 0% 35.3% 2 1981-1990 0% 25.3% 3 1991-1995 0% 34.5% 4 1996-2005 0% 19.1% 5
Car
pre-1981 0% 14.6% 6 1981-1990 0% 3.5% 7 1991-1995 0% 6.1% 8 1996-2005 0% 8.5%
PM Speciation
35
Reductions to PM2.5 in MOVES2013 compared to MOVES2010b due to silicone contamination.

Start EC/PM Running EC/PM Vehicle Type MOVES2010 MOVES2013 MOVES2010 MOVES2013
Car 35.0% 44.4%
18.0% 14.0%
Truck 33.0% 7.0%
Updated Light-duty EC/PM2.5 ratios
36
Updated EC/PM2.5 ratios by start and running in MOVES2013
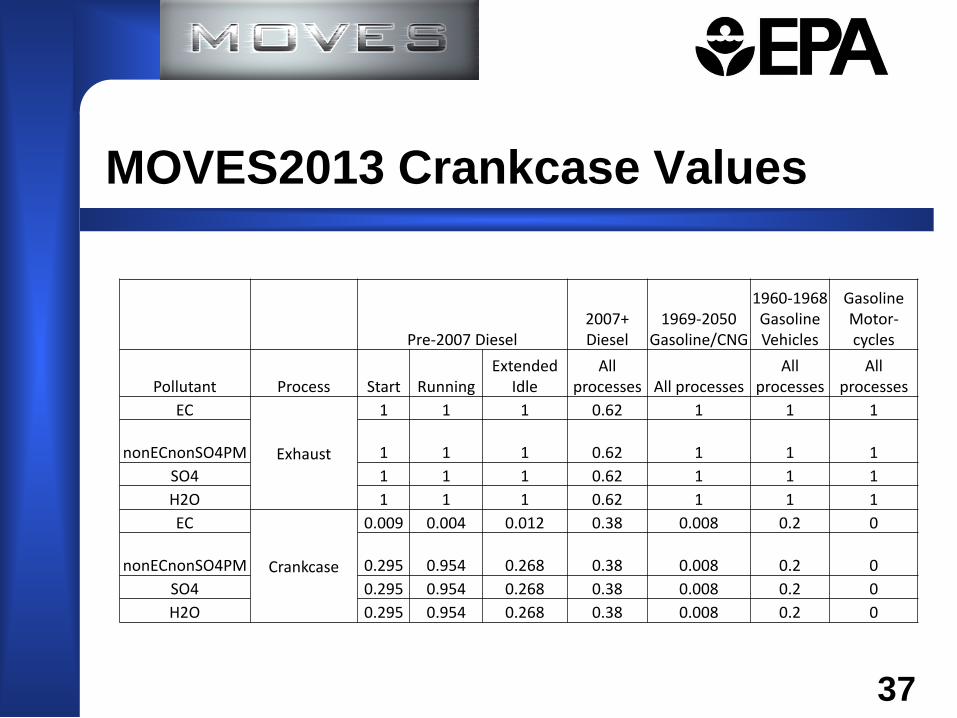
MOVES2013 Crankcase Values
37
Pre-2007 Diesel 2007+ Diesel
1969-2050 Gasoline/CNG
1960-1968 Gasoline Vehicles
Gasoline Motor-cycles
Pollutant Process Start Running Extended
Idle All
processes All processes All
processes All
processes EC
Exhaust
1 1 1 0.62 1 1 1
nonECnonSO4PM 1 1 1 0.62 1 1 1 SO4 1 1 1 0.62 1 1 1 H2O 1 1 1 0.62 1 1 1 EC
Crankcase
0.009 0.004 0.012 0.38 0.008 0.2 0
nonECnonSO4PM 0.295 0.954 0.268 0.38 0.008 0.2 0 SO4 0.295 0.954 0.268 0.38 0.008 0.2 0 H2O 0.295 0.954 0.268 0.38 0.008 0.2 0