plus: snapshot of the financial ... - stern stewart & · pdf filethe stern stewart...
TRANSCRIPT

The Stern Stewart Institute periodical #12 // June 2015 // W
hen Barbarians are at the gate: Managing for disruptive innovation…
#12
J U N E 2 0 1 5
IN THIS ISSUE
Abdullah Saud Al-ThaniGovernor, Qatar Central Bank
Dr. Roland BuschMember of the Managing Board, Siemens AG
Prof. Dr. Steve H. HankeBoard Member, The Stern Stewart Institute, Economist, The Johns Hopkins University
Matthias HartmannCEO, GfK
Carsten KnobelMember of the Management Board and Chief Financial Officer, Henkel AG & Co. KGaA
Dr. Klaus PatzakChief Financial Officer, OSRAM Licht AG
Dr. Till ReuterCEO, KUKA AG
Stephan SchulzCFO, Paul Hartmann AG
PLUS: SNAPSHOT OF THE FINANCIAL INSTITUTION’S MAIN CHALLENGES
…AND INSIGHTS INTO THE STERN STEWART INSTITUTE’S LITERACY PROGRAM IN BURKINA FASO
When Barbarians Are at the Gate:Managing for Disruptive Innovation…


#12

Contents
6 Editorial CommentGerhard Nenning, Director of The Stern Stewart Institute
8 Quantity = Quality? Will Big Data Solve Everything?Matthias Hartmann, CEO, GfK
14 Robots: From Order Takers to Intelligent Colleagues Dr. Till Reuter, CEO, KUKA AG
18 Why Intelligent Infrastructure Is a Smart InvestmentDr. Roland Busch, Member of the Managing Board, Siemens AG
24 Building a Scalable Business Model – Optimizing Processes and Systems to Drive Operational ExcellenceCarsten Knobel, Member of the Management Board and Chief Financial Officer, Henkel AG & Co. KGaA
28 Jumping into the Deep End – Mastering Change as a Standalone CompanyDr. Klaus Patzak, Chief Financial Officer, OSRAM Licht AG

34 Four Challenges of Financial InstitutionsStern Stewart Research
36 Sustainability in Young Talents – Competition Will Be Won with Human Capital in the Future Stephan Schulz, CFO, Paul Hartmann AG
40 The Importance of LiteracyThe Stern Stewart Institute’s Africa Projects
48 Greece – Down and OutProf. Dr. Steve H. Hanke, Board Member, The Stern Stewart Institute, Economist, The Johns Hopkins University
54 Qatar’s Resilience to Falling Oil Prices – A Welcome Support for DiversificationAbdullah Saud Al-Thani, Governor, Qatar Central Bank

T H E S T E R N S T E W A R T I N S T I T U T E P E R I O D I C A L # 1 2 G E R H A R D N E N N I N GE D I T O R I A L C O M M E N T
For a long time, economists have generally presumed that lower oil prices generate positive effects on growth. Even without the political dimension, this time it all seems to be a whole new ball game. The reason for this is a funda-mental change in the industry logic: for some time now, highly leveraged US shale oil has come into the game, leading to an oversupply, leading in turn to Saudi Arabia’s reaction to it. At the same time, oil majors are forced to compensate their huge capex programs of the last ten years, resulting in even more surplus. But with every turn, drilling becomes more complex, and capex therefore more expensive.
As a result, prices are falling and nobody can bear to stop producing – leaving the industry in a paradox: while sup-ply needs a price above $100, demand cannot, and prob-ably will not, afford $100, at least not in the short term.
Almost the same formula of new technology, idle capac-ity, and falling prices will soon apply to many more indus-tries. Depending which side of the fence you are standing on – this disruption may be welcomed or even seen as barbaric.
How should we deal with these threats? The first thing that springs to mind may sound almost too obvious, but nevertheless is of primary concern: be prepared. There may be scores of dire scenarios, but there will be just as many smart decisions to be made – as long as you have a keen eye, not only for current developments, but for the coming ones too.
When Barbarians Are at the Gate…
P A G E6

T H E S T E R N S T E W A R T I N S T I T U T E P E R I O D I C A L # 1 2
G E R H A R D N E N N I N GE D I T O R I A L C O M M E N T
Gerhard Nenning Director of The Stern Stewart Institute
Again, we have gathered some of the smartest decision-makers and most acute thinkers to share examples of how this preparedness can be achieved: we do this directly by referring to the oil crisis, where falling oil prices are a wel-come support in further diversifying the economy, or in-directly, by focusing on the insights provided by big data, the spectacular evolution of robots, intelligent and effi-cient infrastructure, and the importance of human capital.
These topics are vital in many sectors, but we shine a light also on the financial sector in particular, which is in the midst of disruption, and we also bring some facts to the latest developments in the showdown between Greece and its creditors. Last but not least, we give you an insight into the Stern Stewart Institute’s Africa Projects which again underline the importance of human capital for the continent.
No matter how different these essays may seem, all of them deal with vital questions for today’s and tomorrow’s economy, and all of them reinforce one important adage: business will go on – no matter on which side of the fence.
I hope that the twelfth edition of our periodical will be an inspiring read with some new and useful insights.
Yours,
Gerhard Nenning
P A G E7

BIGa game changer
DATAinformationON-THE-MOVEOPPORTUNITY& CHALLENGEBIG DATA IS NOT SMART DATAdata needs to be
allow the voice of the consumer to be heard
ANALYZEDDEEP DA
TAMARKETING is transforming – and so is
market research
T H E S T E R N S T E W A R T I N S T I T U T E P E R I O D I C A L # 1 2M A T T H I A S H A R T M A N N : Q U A N T I T Y = Q U A L I T Y ? W I L L B I G D A T A S O L V E E V E R Y T H I N G ?
P A G E8

Quantity = Quality? Will Big Data Solve Everything?
Big Data is a popular buzzword these days. For some, it’s a threat. For others, it’s the solution to many challenges. For market research, it’s both. And the one thing that is for sure is that it’s a game changer.
So for me and GfK, the market research company I have the privilege of managing, it is an important question – and an exciting one at the same time. Market research can be on the winning side; that is my firm belief. Here’s why:
The playing field for market research is set within a rap-idly changing marketing arena. Today, consumers are al-ways “on”. With mobile devices, they use and create infor-mation on-the-move. Their brand experiences are heavily influenced by digital interaction, as ever more purchases are made online, and mobile purchases grow. This era of digitization creates new touchpoints for brands, products, and services, and public opinion shaped on social media is a significant factor for anyone in the market. Innovation
T H E A U T H O R
Matthias HartmannCEOGfK
Consumer Behavior Is Constantly Evolving
Mobile as a catalyst for change: always on
Rise of digital with growing number
of touchpoints
Accelerating speed
of innovation
Increasingly complex
consumer experiences
P A G E9

T H E S T E R N S T E W A R T I N S T I T U T E P E R I O D I C A L # 1 2M A T T H I A S H A R T M A N N : Q U A N T I T Y = Q U A L I T Y ? W I L L B I G D A T A S O L V E E V E R Y T H I N G ?
cycles are becoming shorter, the variety of products is in-creasing, and speed is a key factor for success. For compa-nies, measuring customer experiences in this dynamic arena is highly complex.
Vast amounts of data come from this marketing arena. Whether it comes from Facebook activities or mobile phone location data, webshop logs or customer satisfac-tion feedback – data is, in most cases, unstructured and not standardized. Yet it offers new potential to understand consumers using a 360-degree view. This is an opportu-nity.
OPPORTUNITY AND CHALLENGE – DIFFERENT SIDES OF THE BIG DATA COIN
So here we are with incredible amounts of data and this opportunity which is available to anyone. And millions of data sets cannot be wrong, can they? They can. Big Data alone doesn’t help. It doesn’t provide context, insight and conclusions. Big Data is, in most cases, not smart data.
Simply increasing the amount of data (making it “big”) from a certain source, or from several sources, will not do the trick. Yes, it will give you a more granular and more complete view. But usually, this view is directed only at a
certain perspective and detail. So, Big Data will usually not be able to give you the full perspective. Let’s take a very simple, real life example: Assume you could collect and review all the data from all of the traffic in a country. You could have data about how many cars are on the road, where they are positioned and where they are going, all at any given time. But, even if you measure all of the traffic in this way, the data would not tell you who is in the car and why they are on the road. Are they visiting friends? Are they on a business trip? And even if you have the greatest computing power at hand, someone still has to be smart enough to ask the right questions that the data have to answer and to define the algorithm for the analysis. No algorithm is smarter than the person defining it. In our example, if the question is about people’s motivation for their trips, all the “big” traffic data won’t help much – apart from easy to detect traffic patterns like commuting – in the first place. But, for questions relating to the actual drivers, like demographic profiles, attitudes or consump-tion-related behavior, additional data needs to be ana-lyzed. And that different data set wouldn’t need to be very big, as the benefit of each additional data set declines greatly after a reasonable sample size has been reached.
When GfK was founded more than 80 years ago, its task was to “allow the voice of the consumer to be heard”. Mar-ket researchers were the ones who went out with pen and
Consequently, the Needs of Market Research Customers Are Changing
Clients want speed and fast results
Clients want insights with impact
Clients want proof of ROI to justify investments
Clients want data from all sources, but need integration
P A G E1 0

T H E S T E R N S T E W A R T I N S T I T U T E P E R I O D I C A L # 1 2M A T T H I A S H A R T M A N N : Q U A N T I T Y = Q U A L I T Y ? W I L L B I G D A T A S O L V E E V E R Y T H I N G ?
paper in hand and helped companies “hear” their custom-ers one by one, and then the results were aggregated. To-day, the once quiet voice of the consumer has swollen to a polyphonic and sometimes rather bizarre chorus.
This complexity won’t decrease at all. With the Internet of Things rapidly approaching, virtually billions of con-nected devices will be creating more data to fill the Big Data pool. But how can companies define their path mov-ing forward? To put it in Ford’s famous words, they often still won’t know which half of their advertising money is wasted. In this marketing arena that I described, compa-nies have four main requirements:
� They need fast results, as close as possible to “real time”
� They need relevant market knowledge tailored to their needs
� They need a clearly quantifiable return on investment (ROI) on their marketing activities
� They must exploit data from all available, pertinent sources, but integrated and interpreted…
…all with a view to making business-relevant decisions and creating winning strategies.
Now, how does market research help make Big Data smart and, thus, really valuable for marketing?
P A G E1 1

T H E S T E R N S T E W A R T I N S T I T U T E P E R I O D I C A L # 1 2M A T T H I A S H A R T M A N N : Q U A N T I T Y = Q U A L I T Y ? W I L L B I G D A T A S O L V E E V E R Y T H I N G ?
WHERE IS THE “TRUE NORTH”?
One of the demands in the jungle of Big Data is a “true North”. Whatever comes out of Big Data needs to be cali-brated and put into the perspective of a framework that as many market players as possible agree upon. Let’s take an example from our daily market research work. Here, the concept of “calibrating data” comes in, and market re-search is predestined to provide it.
In this second example, let’s take a company offering smartphone apps. The company wants to understand cus-tomer behavior and the usage of an app. With this in mind, the company partners with a mobile phone pro-vider and has access to all the provider’s data (even though, going back to my statement above, it doesn’t mat-ter whether they analyze half of the customer data or 75 percent or all of it – bigger doesn’t always make a crucial difference). Now, they could find, for example, that “half of the people are using app XY”. But the data of the mobile phone provider may have a certain bias: Their pricing and marketing strategy may have targeted certain user groups more than others. So maybe their customers are more price-sensitive, or younger, or technically-savvy than those of other mobile phone companies. Regardless of the size of the sample, the data is still not as valid as it could be for giving a perspective across all user groups. The so-
lution here is to calibrate the data with a representative panel where mobile phone use (across all providers) of the panelists is included, together with other important fac-tors like age, income, education, media preferences and so on. And it might turn out that the specific customer group of the mobile phone provider in the example above repre-sents only a small portion of all mobile phone users. So, after such a calibration is made through the panel, the findings can be put into a more valid perspective. This rough example reveals that Big Data alone did not help here; the value came from market research data and the approach that managed to turn it into Smart Data.
P A G E1 2

T H E S T E R N S T E W A R T I N S T I T U T E P E R I O D I C A L # 1 2M A T T H I A S H A R T M A N N : Q U A N T I T Y = Q U A L I T Y ? W I L L B I G D A T A S O L V E E V E R Y T H I N G ?
Taking such steps with one’s data or with a certain busi-ness challenge comes down to a matter of trust. Which data source (and also, which participant in the market) is trusted as being both neutral and relevant? Market re-search has assumed this role and should continue to keep this important position also in the online markets. Deep data in panels is a key here. “Deep” refers, for example, to long-standing panels which continuously measure vari-ous aspects in a representative sample, have profound de-mographic data, work with proven methodologies and ensure high-level quality control. And all of this data is provided to the market from the panel provider’s neutral position.
MARKETING IS TRANSFORMING – AND SO IS MARKET RESEARCH
If done right, entire industries can build their business transactions on the impartial “currency” that such panels create. Take TV advertising, for example, a multi-billion euro business in Germany. When TV stations sell their TV commercial slots to advertisers, they need to put a price tag on them that is based on a jointly agreed method of how to measure reach and audience categorization. There is simply too much marketing money at stake to leave this to bilateral negotiations about what data the pricing is based on. Thus, audience measurement from a neutral provider is key in order to keep this important market running smoothly with a widely accepted “cur-rency”. In Germany, we have provided this currency for some 40 years, and currently we are expanding this audi-ence measurement approach to countries like the King-dom of Saudi Arabia and Brazil (for TV) and Australia (for radio). I forecast that similar currencies will be formed to measure online and mobile channels as well.
Even though TV advertising still gets the lion’s share of the advertising market, the online market is growing in importance. So marketers are asking themselves – and, fortunately, they are also asking market researchers – how they can create buzz on social media or how their adver-tising can really trigger purchases and build brand loyalty. Which communication channel fits which purpose best? And what combination of activities across TV and online, for example, creates an additional boost to generate the best overall effect? Here, the deep data of panels such as GfK’s Crossmedia Link panel of several thousand house-holds provides answers. With data pertaining to TV ad exposure, online activities and real purchases generated from the same people in one single panel, we can truly show cause and effect combined. In addition, with such ROI data, marketers finally get better answers to their (and Ford’s) question.
Marketing is transforming rapidly as a result of consum-ers who are always “on”, and with ever more digital touch-points, greater speed and shorter innovation cycles in the market. Vast amounts of unstructured data are hitting companies from many different sources. And market re-search plays a vital role in making such “Big Data” truly smart and effective. The market research industry and GfK, in particular, are utilizing their competitive advan-tage of having a neutral market position, analytical com-petency and panels with deep data about consumers.
P A G E1 3

betmanCOOPERATION
INDUSTRY
4.0ween
&MACHINEFACTORY OF THEFUTUREROBOT-based SOLUTIONS
WILL BE THEnew normal
T H E S T E R N S T E W A R T I N S T I T U T E P E R I O D I C A L # 1 2D R . T I L L R E U T E R : R O B O T S : F R O M O R D E R T A K E R S T O I N T E L L I G E N T C O L L E A G U E S
P A G E1 4

Robots: From Order Takers to Intelligent Colleagues
Picture the warehouse of a large internet order company: The automated mobile platform glides under a large shelf, lifts it up and drives it to the picking station where there is a team of two employees sorting and shelving freshly packed books, CDs, or movies. One is a real person and the other has seven axes, is painted silver and orange, and is called LBR iiwa. In the midst of all the shelves and pack-ages both people and machine are breathing life into the abstract term of Industry 4.0.
What was still a vision several years ago has become in-dustrial reality today: the cooperation between man and machine. Modern robots even learn from their human colleagues. And this goes for KUKA’s LBR iiwa, the world’s first sensitive, lightweight robot that is capable of working together with people without a safety fence.
This example from e-commerce illustrates how logistics can become increasingly automated. In this area, KUKA and the Swiss subsidiary acquired last fall, Swisslog, are contributing technical expertise and thereby to shaping the development of Industry 4.0. Solutions like the “carry pick” (mobile shelving system) application described
above help realize perfectly organized logistic processes. The ideal addition to this is intelligent robot systems that move on their own on mobile platforms and can organize themselves – KUKA is developing them. In doing so, safety is the top priority. If the robot hits an obstacle like the arm of a human colleague it stops moving instantly.
NEW CHALLENGES FOR INDUSTRY
In recent years the demands made on production have gone up significantly. Product life cycles are getting shorter and the wide variety of products is ever increas-ing, two facts that necessitate a flexible production envi-ronment. The shortage of skilled workers and the demo-graphic trend are presenting companies with new chal-lenges. Workplaces should be designed ergonomically so that employees stay healthy. Increasingly, consumers ex-pect products to be adjusted to their personal needs and wishes but at terms which correspond to those of indus-trial mass production. The automotive industry is a clas-sic example: The future car driver selects the detailed fea-tures he/she wants either online or at the dealer and this
T H E A U T H O R
Dr. Till ReuterCEOKUKA AG
P A G E1 5
T H E S T E R N S T E W A R T I N S T I T U T E P E R I O D I C A L # 1 2D R . T I L L R E U T E R : R O B O T S : F R O M O R D E R T A K E R S T O I N T E L L I G E N T C O L L E A G U E S
“wish list” is then processed in the factory much faster than was previously possible. This offers advantages for producers in that production inventories and, thus, costs are reduced because parts can be ordered more flexibly.
Particular importance is attributed to IT in the fourth in-dustrial revolution. Highly developed systems transmit data to a cloud, which network one or several factories, an entire company or even a group of companies. The infor-mation flows in a seamless exchange between the produc-tion locations and on account of this enormous progress turns them into factories of the future.
Back in the 1990s, KUKA was the first robot manufac-turer to recognize that interfaces based on mainstream IT technologies are indispensable. The goal was to network the digital controls of diverse systems efficiently and as simply as possible. Today, KUKA continues to pursue this basic notion of open communication and simple integra-tion. Our developers are working on networking the pro-duction end-to-end with flexible interfaces and integrat-ing it in cloud or big data technologies.
As a result of these developments, the industry as we know it is on the verge of an enormous upheaval. The digital world and real world are merging more and more. And the robot is the link in this process. Each part of a factory interacts with all the others. The workpiece tells the robot if there are just a few like it left in stock. The robot informs a human colleague or orders more itself. Production processes are being revolutionized by this. Robots also help relieve people from monotonous and energy-sapping work. They carry heavy loads, do work that is complicated from an ergonomic standpoint or sim-ply too dangerous for people and are fast and highly pre-cise. People are and remain cognitively superior, creative, and work as strategists while the robot contributes its re-petitive accuracy and strength to the collaboration.
In the factory of the future, people and machines are net-worked, and they communicate with each other. This co-operation holds great potential for automation such as in the 3C market (computer, communication, and consumer electronics), the aerospace industry, the healthcare sector and in storage logistics.
POLITICS AND BUSINESS WORK TOGETHER ON THE FUTURE
For Germany, Industry 4.0. is a major opportunity be-cause robot-based automation and networking increase productivity and contribute to keeping and creating jobs. In all of this the one thing that remains clear is that the person is the focus of the intelligent factory. In order to go down this path, research and business are dependent upon political support. We still need improved, and at the same time inexpensive, data highways to be able to keep pace with international competition. And with regard to data security there are still many open tasks and ques-tions. The high standards in Germany are a recognized competitive advantage, but they have to be put to the test continually and adapted to the latest challenges.
In order to ensure that the term “Industry 4.0” does not become just a trendy catchword, politics and especially dedicated companies and researchers in Germany and all over Europe have to work together and define common standards. As a worldwide active pioneer for automation solutions, KUKA assumes not only a pivotal role but also responsibility when it comes to designing the factory of the future.
P A G E1 6

T H E S T E R N S T E W A R T I N S T I T U T E P E R I O D I C A L # 1 2D R . T I L L R E U T E R : R O B O T S : F R O M O R D E R T A K E R S T O I N T E L L I G E N T C O L L E A G U E S
A NEW GENERATION IS EMERGING – “ GENERATION R“
A robot used to be a universal machine to increase pro-ductivity, but today we are on the brink of a new era. With their emerging sensitive capabilities robots are progres-sively turning into work colleagues that support people in their work. For “digital natives” that which is already real-
ity in logistics today is perhaps still the new normal. For the “robotic natives” of tomorrow, the robot will probably be a matter of course in the working world. This genera-tion, the so-called “Generation R”, will be assisted by all kinds of robot-based systems and will interact with them as well. For them, dealing with robot-based automation solutions will be as natural as the Internet, smartphones, and tablets are for us today.
©
KUKA
P A G E1 7

CITIESare inglobal
competitionUrbanINFRASTRUCTURE
has not yetbeen transformed
INFORMATION AGEcitywide
automationmanagementinfrastructure optimization
&
by the
T H E S T E R N S T E W A R T I N S T I T U T E P E R I O D I C A L # 1 2D R . R O L A N D B U S C H : W H Y I N T E L L I G E N T I N F R A S T R U C T U R E I S A S M A R T I N V E S T M E N T
P A G E1 8

7000
6000
5000
4000
3000
2000
1000
0
Figure 1: Urban and Rural Population of the World, 1950 – 2050
Source: World Urbanization Prospects – 2014 Revision, UN Department of Economic and Social Affairs
Popu
latio
n (m
illio
ns)
1950
1960
1970
1980
1990
20002010
20202030
20402050
Urban Rural
Why Intelligent Infrastructure Is a Smart Investment
Every second, the world’s cities grow by two people. Every week there is a new Munich or Copenhagen. By 2050, over two-thirds of us will live in cities, up from just one-third in 1950 (see Figure 1). In light of this, it is hard to understate the importance of urban infrastructure. Cities already generate roughly 80 percent of global GDP, and urban infrastructure is the backbone supporting that eco-nomic activity. Infrastructure also supports much of what attracts us to cities, including healthcare, education and culture. So as cities grow, the way we build and manage urban infrastructure has never been more critical to global economic and social development.
Urbanization has already put enormous strain on infra-structure. In emerging markets, in particular, issues such as power outages and inadequate public transport, roads, and ports are a brake on growth and development. The infrastructure cannot be built quick enough to keep pace with economic and urban development. At the same time, infrastructure quality in many advanced economies is de-teriorating, notably in Germany and the US (see Figure 2). Projecting forward to 2030, more than $50 trillion will need to be invested in infrastructure globally to keep up with GDP and population growth. Addressing these is-sues is challenging in the context of slow growth and weaker budgets, something likely high on the agenda at the June G7 summit here in Germany.
CITIES ARE IN GLOBAL COMPETITION
Of course the world is not just urbanizing but globalizing too. Cities no longer simply draw new residents in from rural surroundings. Instead, the world’s cities must com-pete on a global stage to attract increasingly mobile in-vestment, businesses, workers and, above all, talents. And
T H E A U T H O R
Dr. Roland BuschMember of the Managing BoardSiemens AG
P A G E1 9

T H E S T E R N S T E W A R T I N S T I T U T E P E R I O D I C A L # 1 2D R . R O L A N D B U S C H : W H Y I N T E L L I G E N T I N F R A S T R U C T U R E I S A S M A R T I N V E S T M E N T
only a city that offers an appropriate quality of life for its citizens can address all these demands. Mayors often ask us at Siemens what other cities are doing and how their city is measuring up. They understand their success de-pends on building a globally attractive environment for further economic activity.
But unlike so many areas of life and business, our urban infrastructure has not yet been transformed by the infor-mation age. The manufacturing industry, for example, has already spent decades reducing costs and improving effi-ciency with monitoring, automation and integration sys-tems. Yet in most cities today, trains, power systems, buildings, buses and roads have hardly changed over the past 20 to 30 years.
Some digital systems have been incorporated, but we have only just begun to unlock the potential of information-enabled infrastructure. Digitalization is the key to inte-grate fully electrified and automated infrastructures into something greater than the sum of its parts. Making our infrastructures more intelligent will be essential to meet the present and future sustainability challenges of our cit-ies, and thus of our planet.
WHAT IS INTELLIGENT INFRASTRUCTURE?
Intelligent infrastructure is supported by sensors, soft-ware, and control systems that gather and harness rele-vant data to enable more informed decisions and increase automation and real-time responses to events. Ultimately, various infrastructure elements can be integrated to opti-mize responses to patterns and events across the urban environment, allowing for citywide automation, manage-ment, and infrastructure optimization. In this way, intel-ligent infrastructure has the potential to reduce costs, in-crease capacity with incremental investment, lower en-ergy consumption, significantly cut emissions, create new
revenue opportunities, boost productivity, and improve our quality of life. Intelligent infrastructure also makes cities considerably more resilient, allowing for rapid, co-ordinated and optimized responses to shocks, threats and natural disasters.
Take buildings, for example. We equipped the 200 m tall Tornado Tower in Doha with monitoring and manage-ment systems that integrate power, lighting, temperature control, fire safety, and security systems. This allows the building to rapidly detect and respond to danger, while cutting energy consumption by close to 20 percent. A similar system in Taiwan’s Taipei 101 building led to 30 percent lower energy consumption than comparable buildings, saving $700,000 per year and making Taipei 101 the world’s tallest LEED certified building. If you con-sider that buildings consume roughly 40 percent of global energy, it is easy to see how important these technologies are.
Smart grids are another example. Compared to today’s power networks, smart grids enable dynamic manage-ment of electricity supply and demand to boost efficiency while also integrating decentralized renewable sources at 40 percent lower cost than traditional grids. Their poten-tial has been demonstrated on the island of Bornholm, Denmark, as part of EcoGrid EU. In Bornholm, the price of electricity fluctuates with the volume of available wind energy. When power is abundant, prices fall and increased
Figure 2: Overall Quality of Infrastructure in G7 Economies (scale 1 – 7; higher score indicates better infrastructure)
Sources: World Economic Forum, Global Competitiveness Report survey; and IMF staff calculations
France Germany Canada Japan United Kingdom United States Italy
7
6
4
3
2006 2007 2008 2009 2010 2011 2012
P A G E2 0

T H E S T E R N S T E W A R T I N S T I T U T E P E R I O D I C A L # 1 2D R . R O L A N D B U S C H : W H Y I N T E L L I G E N T I N F R A S T R U C T U R E I S A S M A R T I N V E S T M E N T
consumption reduces the burden on the electricity net-work. When power is scarce, prices rise and demand falls, reducing the need to import electricity from neighboring Sweden. Every five minutes, the island’s 28,000 residents receive updated electricity prices. Their homes’ smart control units use this information to adjust heating and hot water systems automatically, based on the owner’s preference. As a result, Bornholm residents save money, the island is more energy efficient and the grid automati-cally integrates available wind energy.
These examples demonstrate the efficiencies that can be achieved by looking at infrastructure areas individually. But imagine the efficiencies we could achieve by network-ing systems together and pooling our resources. The next level of intelligent infrastructure brings together all parts of the infrastructure puzzle. It allows system operators to respond in real-time to incidents and optimize operations across all domains, and it connects the different infra-structures in a city through a digital platform to help cities manage systems as a whole, thereby predicting outcomes and enabling pre-emptive actions.
Integrated mobility platforms can also integrate different transport providers. Cities would enjoy greater control over complete transport networks, transport providers would benefit from increased business potential, and citi-zens would benefit from a better service provision. The result is a free-flowing transport network that maximizes mobility, conserves fuel and reduces greenhouse gas emissions. Cities like Berlin, Munich, or Singapore are on the way to realizing this vision. Its Traffic Information Center integrates all the transport modes and operators, so that travelers can optimally plan their trips using real-time information, reducing both congestion and emis-sions.
THE ECONOMIC COST OF TRANSPORT
The potential of intelligent transport infrastructure is even more exciting when you consider the powerful eco-nomic effects of investment in traditional infrastructure generally. For example, last year, Siemens conducted a de-tailed study into the urban mass transit systems of 35 ma-
Sour
ces:
1) A
rthur
D. L
ittle
Urb
an M
obili
ty In
dex
2.0,
201
4. 2
) IEA
, Wor
ld E
nerg
y Ou
tlook
201
3. 3
) Sie
men
s es
timat
e.In
fogr
aphi
c ©
Sie
men
s
P A G E2 1

T H E S T E R N S T E W A R T I N S T I T U T E P E R I O D I C A L # 1 2D R . R O L A N D B U S C H : W H Y I N T E L L I G E N T I N F R A S T R U C T U R E I S A S M A R T I N V E S T M E N T
jor cities, which sought to quantify the economic effects of urban transport networks. It did this by calculating the true cost of commuting – incorporating variables such as trip time, fares, crowding levels, ease of use, service relia-bility and user functionality – to arrive at an economic cost of transport.
The results indicate the economic cost of transport ranges from 9 percent of GDP per capita in Copenhagen, to 28 percent in Lagos. A high cost hurts productivity, stifles new economic activity and reduces a city’s competitive-ness. For many cities, this cost will increase by 2030, meaning transport will consume an increasingly large portion of economic output. In New York, for example, the cost is forecast to increase from 15 percent to 18 per-cent of GDP per capita.
Some cities have plans in place that will see the cost of transport fall. Paris will invest $36 billion in 200 km of new metro line and this will cut its cost by roughly one percentage point of GDP per capita. This in turn will gen-erate economic benefits of $2.7 billion per year, meaning the metro line pays for itself in 13 years and generates a further $46 billion over the 30-year life of the project. Overall, the study revealed that if all cities with popula-tions greater than 750,000 built transport systems to match the best city in their class, the economic benefits
would be worth roughly $800 billion annually by 2030 (see Figure 3). This would add to the significant social and environmental benefits.1
IS NOW THE RIGHT TIME FOR INFRASTRUCTURE INVESTMENT?
These are exciting results, but does infrastructure invest-ment make sense right now, given current fiscal chal-lenges? The answer for many countries is an unequivocal yes. Recent IMF research suggests that now could be an ideal time to invest in infrastructure. Their study analyzed the macroeconomic effects of infrastructure investment globally and found both short-term and long-term bene-fits.2 Some of their findings are especially relevant:
� The economic benefits of infrastructure investment are substantially greater when interest rates are low and economic slack is high, conditions that are pre-sent today in many advanced economies.3
� Public infrastructure investment financed by issuing debt increases output by more than finance from spending cuts or raising taxes. This increase was gen-erally large enough to offset the rise in debt, so the economy grows without affecting the public-debt-to-GDP ratio.
� The extent of economic benefits and impact on public debt ratios depends on infrastructure investment ef-ficiency, i.e. high-return projects are selected and spending is not wasted.
1 Cities were split into three classes: well-established cities, high density compact centers and emerging cities. The leading cities across the classes were Copenhagen, Singapore, and Santiago, respectively.
2 The study found that a 1 percentage point of GDP increase in invest-ment spending raises output by 0.4 percent in the same year (from in-creased demand) and 1.5 percent four years later (from increased pro-ductive capacity), based on a sample of advanced economies.
3 Economic slack is the measure of unused labor and capital in an econ-omy i.e. the difference in the productive capacity and the actual level of economic output.
$786 bn
Source: “The mobility opportunity: Improving public transport to drive economic growth”, Siemens and Credo Business Consulting, June 2014
Figure 3: Economic Opportunity through Investment in Transport
$1000 bn
$800 bn
$600 bn
$400 bn
$200 bn
$0 bnCurrent 2030
$119 bn
$238 bn$362 bn
■ Cities in study■ Global opportunity
P A G E2 2

T H E S T E R N S T E W A R T I N S T I T U T E P E R I O D I C A L # 1 2D R . R O L A N D B U S C H : W H Y I N T E L L I G E N T I N F R A S T R U C T U R E I S A S M A R T I N V E S T M E N T
This suggests that many cities should act now to maxi-mize their returns from infrastructure investment, par-ticularly those in advanced economies that have ample economic slack and high public investment efficiency. Of course, few emerging economies have similar qualities in place right now; however, economic growth in many emerging economies is often stifled by key infrastructure bottlenecks. Projects that specifically remove these bot-tlenecks could deliver transformative social and economic benefits in spite of headwinds – something that has to be carefully weighed against the potential negative fiscal consequences.
Additionally, lower oil prices will provide many net im-porters with a demand boost, relief from inflation pres-sure and savings from energy price subsidies. These fac-tors further support the case for infrastructure investment in many economies.
INTELLIGENT INFRASTRUCTURE DELIVERS ADDITIONAL ECONOMIC BENEFITS
What is clear is that infrastructure investment should be seen as a massive opportunity for cities. What makes the opportunity even more compelling is that both the IMF and mobility research draw on evidence from past invest-ments and existing infrastructure. Most of this is what we call ‘brick and steel’ infrastructure, deriving no benefit from the intelligent use of data and modern technology. At Siemens, we have shown how intelligent infrastructure can significantly outperform brick and steel infrastruc-ture – e.g. by speeding up traffic by 20 percent, increasing train capacity by 30 percent, cutting power consumption in buildings by 30 percent or saving up to 40 percent on power grid expansion. In short, choosing intelligent infra-structure adds far more value. Factoring this in, intelligent infrastructure could prove pivotal to meeting economic, social, environmental, and competitive future needs –
helping ensure that cities grow better and cleaner as they inevitably grow bigger.
Here, in Germany, we must not be complacent. We cur-rently have some of the most impressive infrastructure and most competitive cities in the world. However, this is changing as our infrastructure grows older and other cit-ies around the world develop. The world’s fastest growing cities are in Africa and Asia. By 2030, there will be 41 megacities (those with over 10 million inhabitants) com-pared to 28 today. Of those 13 new megacities, eight will be in Asia, three in Africa and two in Latin America. Asia, in particular, will be a global hotspot for infrastructure development, which will see the development of highly competitive cities.
In Germany, we need to make sure we continue to build world-leading infrastructure, particularly by pioneering the use of intelligent technologies. Doing this will not only help to drive GDP, reduce emissions and improve quality of life but will also support the development of in-novative companies that can share in infrastructure-building opportunities around the world.
P A G E2 3

S P E E D I N G UP
DECISIONSconsolidatingIT SYSTEMS
I M P R O V EC O S T E F F I C I E N C Y&
processeswith standartized
FLEXIBILITY
T H E S T E R N S T E W A R T I N S T I T U T E P E R I O D I C A L # 1 2C A R S T E N K N O B E L : B U I L D I N G A S C A L A B L E B U S I N E S S M O D E L
P A G E2 4
Building a Scalable Business Model – Optimizing Processes and Systems to Drive Operational Excellence
Ongoing geopolitical tensions, high fluctuations in finan-cial markets and strong competitive pressures in product markets are creating an uncertain external environment for globally operating companies. Moreover, contempo-rary global mega trends are having a major impact on manufacturing companies like Henkel. Digitization, de-mographic change, urbanization, and individualization permanently demand for product innovations and varia-tions, thus leading to fragmented distribution channels and globally distributed supply chains. In an effort to mitigate the impact of external circumstances on business performance, to leverage growth potentials and in course of ongoing globalization, companies are continuously ex-panding their global footprint. The first phase of entering new markets is already completed. Having reached phase two, companies are now focusing on empowering under-developed regions to enter ‘White Spots’ with huge busi-ness potentials but also significant ventures. Ever-chang-ing external environments, changes in consumer prefer-ences and global mega trends necessitate high organizational speed and the ability to adapt internal structures to the markets instantly. A scalable business model is the prerequisite to fully exploit business poten-
tials and assures real-time adaptability of operations. This is why companies are focusing even more on driving their operational excellence by optimizing internal processes and systems.
WELCOME TO THE WORLD OF VOLATILITIES
Businesses today operate in a world of accelerating change and rising volatility. This new reality implies that global companies must enhance their processes, improve cost ef-ficiency and increase decision-making speed in order to grow and be innovative and competitive. That is why Henkel has set “Simplify” (alongside with “Outperform”, “Globalize” and “Inspire”) as one of its four strategic pri-orities to reach its ambitious financial targets by 2016 of €20 billion in total sales with €10 billion sales coming from emerging markets and 10 percent average annual growth in adjusted earnings per share. As part of our stra-tegic priority “Simplify,” we aim to drive operational ex-cellence and continuously improve our competitiveness by standardizing, digitizing, and accelerating processes,
T H E A U T H O R
Carsten KnobelMember of the Management Board and Chief Financial OfficerHenkel AG & Co. KGaA
P A G E2 5

T H E S T E R N S T E W A R T I N S T I T U T E P E R I O D I C A L # 1 2C A R S T E N K N O B E L : B U I L D I N G A S C A L A B L E B U S I N E S S M O D E L
focusing on end-to-end optimization and increasing cost efficiency. Major levers in this respect consist of setting up best-in-class processes, strongly focusing on IT and im-plementing leading sourcing to build a scalable business model that significantly boosts productivity across all three business units (Laundry & Home Care, Beauty Care and Adhesive Technologies) and functions (Corporate, Finance and Human Resources). The main idea behind establishing a scalable business model is to further grow our business without growing the cost base.
SPEEDING UP DECISIONS
A scalable business model that drives operational excel-lence requires having standardized and harmonized pro-cesses. That is why Henkel has been continuously expand-ing its global shared services, which have been working in close cooperation with global IT over the years as part of the company’s Integrated Business Solutions (IBS) organi-zation. In 2014, Henkel opened two new Shared Service Centers, one in Cairo to serve the Africa/Middle East re-gion and one in Shanghai for Greater China in addition to its Shared Service Centers located in Bratislava, Manila, Mexico City and Bangalore. Henkel’s global Shared Ser-vice Organization currently employs 2,600 people who manage standardized, simplified end-to-end processes
across all businesses and functions. By 2016, Henkel plans to increase its number of employees in Shared Service Centers to more than 3,000. The integration of technol-ogy and process competence into the IBS organization has already improved the quality and transparency of Henkel’s operations i.e. by way of time-independent quality deliv-ery around the globe for instance, and has helped imple-menting innovative solutions across the entire process chain. Despite a highly volatile business environment
which is impacted most notably by geo-political tensions in major growth regions, intensified competitive price pressures and volatility on foreign exchange markets, the speed of decision-making at Henkel has increased signifi-cantly. Time-independent and place-independent ser-vices and proper internal data processes in global Shared Service Centers have remarkably enhanced Henkel’s or-ganizational agility. The company’s financial results for
Henkel Strategy 2016
Henkel Employees in Shared Service Centers
2008 2012 2013 2014
> 300
> 1 ,500
> 2 ,000
> 2 ,600
Mexico City2011
Bratislava2006
Shanghai2014
Cairo2014
Bangalore2012
Manila2003
Henkel Global Shared Service Centers
P A G E2 6
T H E S T E R N S T E W A R T I N S T I T U T E P E R I O D I C A L # 1 2C A R S T E N K N O B E L : B U I L D I N G A S C A L A B L E B U S I N E S S M O D E L
2014 showed that the strategy paid off after Henkel im-proved its adjusted return on sales to 15.8 percent last year compared to 15.4 percent the year before, a figure which was an all-time high of over 10.5 percent in 2008.
HORIZON PLATFORM AS A KEY ENABLER
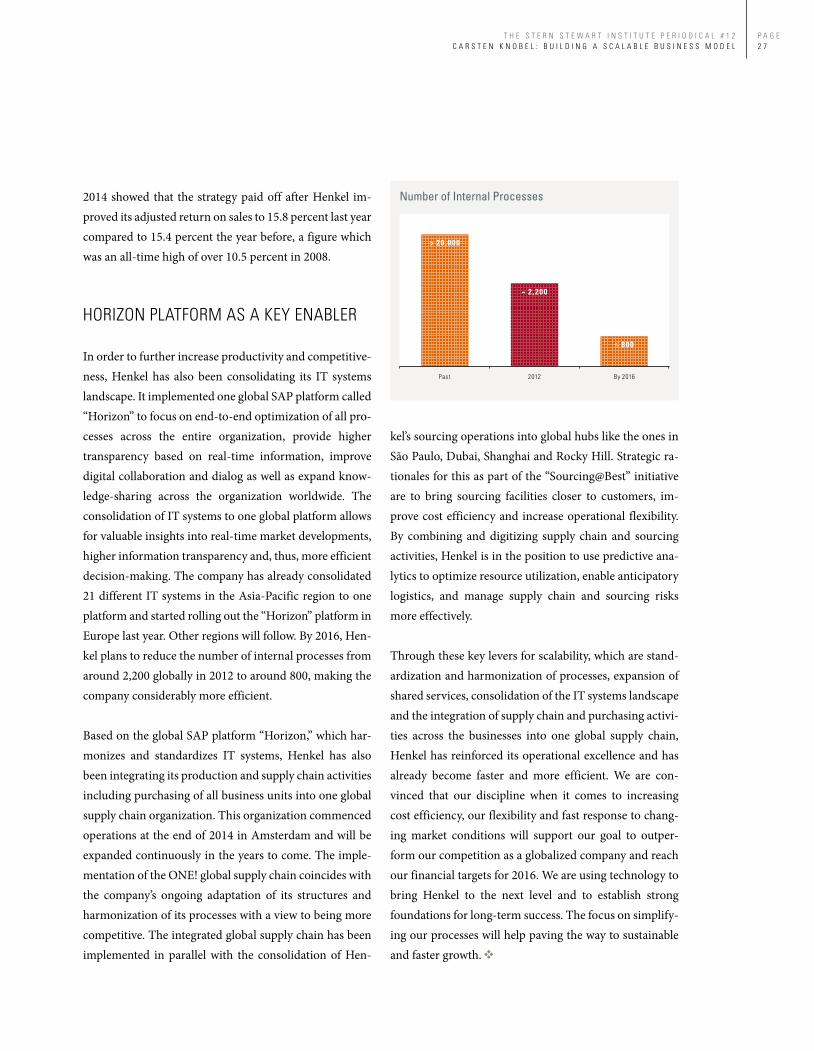
In order to further increase productivity and competitive-ness, Henkel has also been consolidating its IT systems landscape. It implemented one global SAP platform called “Horizon” to focus on end-to-end optimization of all pro-cesses across the entire organization, provide higher transparency based on real-time information, improve digital collaboration and dialog as well as expand know-ledge-sharing across the organization worldwide. The consolidation of IT systems to one global platform allows for valuable insights into real-time market developments, higher information transparency and, thus, more efficient decision-making. The company has already consolidated 21 different IT systems in the Asia-Pacific region to one platform and started rolling out the “Horizon” platform in Europe last year. Other regions will follow. By 2016, Hen-kel plans to reduce the number of internal processes from around 2,200 globally in 2012 to around 800, making the company considerably more efficient.
Based on the global SAP platform “Horizon,” which har-monizes and standardizes IT systems, Henkel has also been integrating its production and supply chain activities including purchasing of all business units into one global supply chain organization. This organization commenced operations at the end of 2014 in Amsterdam and will be expanded continuously in the years to come. The imple-mentation of the ONE! global supply chain coincides with the company’s ongoing adaptation of its structures and harmonization of its processes with a view to being more competitive. The integrated global supply chain has been implemented in parallel with the consolidation of Hen-
kel’s sourcing operations into global hubs like the ones in São Paulo, Dubai, Shanghai and Rocky Hill. Strategic ra-tionales for this as part of the “Sourcing@Best” initiative are to bring sourcing facilities closer to customers, im-prove cost efficiency and increase operational flexibility. By combining and digitizing supply chain and sourcing activities, Henkel is in the position to use predictive ana-lytics to optimize resource utilization, enable anticipatory logistics, and manage supply chain and sourcing risks more effectively.
Through these key levers for scalability, which are stand-ardization and harmonization of processes, expansion of shared services, consolidation of the IT systems landscape and the integration of supply chain and purchasing activi-ties across the businesses into one global supply chain, Henkel has reinforced its operational excellence and has already become faster and more efficient. We are con-vinced that our discipline when it comes to increasing cost efficiency, our flexibility and fast response to chang-ing market conditions will support our goal to outper-form our competition as a globalized company and reach our financial targets for 2016. We are using technology to bring Henkel to the next level and to establish strong foundations for long-term success. The focus on simplify-ing our processes will help paving the way to sustainable and faster growth.
Past 2012 By 2016
≤ 800
~ 2 ,200
> 20 ,000
Number of Internal Processes
P A G E2 7

CHANGE
FAST
competitiveWORLDWIDE MARKETEMANCIPATIONas a standalone COM- PANY
TO STAYENOUGH
in ADVANTAGE a
EN-SURE
T H E S T E R N S T E W A R T I N S T I T U T E P E R I O D I C A L # 1 2D R . K L A U S P A T Z A K : J U M P I N G I N T O T H E D E E P E N D
P A G E2 8

Jumping into the Deep End – Mastering Change as a Standalone Company
OSRAM is one of those brands almost everyone more or less consciously encounters over and over be it at home, in the workplace, on retail shelves, or when doing car main-tenance. Around the globe it has been associated for dec-ades with one item: the light bulb. Few industries enjoy a stable environment rivaling or even surpassing the 20th century lighting arena, with an oligopoly of few players dominating an unvaried marketplace in terms of technol-ogy and competitiveness.
The other side of the coin becomes painfully obvious when a necessity for drastic action suddenly ends this “Sleeping Beauty” slumber. For OSRAM, the age of mi-crochips and digitalization coincided with various other challenges to the traditional business model such as regu-latory change, ecological concerns, and more sophisti-cated customer demands. The appearance of radically dif-ferent substitutes – semiconductor-based LED products – came with a sharp extension of product lifespan, thereby impacting the constant replacement business. Change had happened in the industry before, but while the intro-duction of compact fluorescent (energy saving) lamps had been an evolution, LED proved to be a revolution. New
T H E A U T H O R
Dr. Klaus PatzakChief Financial OfficerOSRAM Licht AG
©
Osra
m
P A G E2 9

T H E S T E R N S T E W A R T I N S T I T U T E P E R I O D I C A L # 1 2D R . K L A U S P A T Z A K : J U M P I N G I N T O T H E D E E P E N D
entrants with cheap and scalable LED production capa-bilities started to enter the general illumination space. LED chips for general lighting can be sourced more or less freely, while the assembly of LED products is less de-manding than the production of many traditional ones. How to maintain a unique range of products?
In addition, the steady demise of incandescent bulbs was helped by rising concerns over the technology’s low effi-cacy. Following the Kyoto Protocol of 1997 virtually all developed economies banned traditional bulbs; a halogen ban is expected to follow toward the end of this decade.
Should this be seen as a hindrance or as an opportunity? Can a traditional lighting giant change fast enough to not only survive, but benefit from this transition?
Extremely short product cycles require continuous R&D efforts, fast investment decisions, and time to market, as well as quick phase in/phase out capabilities. With the above mentioned commoditization in the general illumi-nation space, the sourcing of finished products is becom-ing more important while merchandising capabilities must be strengthened. A strong brand, with access to trade and retail channels built over decades, is a true asset
©
Osra
m
P A G E3 0

T H E S T E R N S T E W A R T I N S T I T U T E P E R I O D I C A L # 1 2D R . K L A U S P A T Z A K : J U M P I N G I N T O T H E D E E P E N D
in the battle for shelf space. Parallel to mastering the chal-lenges in general illumination, OSRAM’s profitable niches, such as in automotive and industrial lighting ap-plications, do need to be constantly defended through cost leadership, application know-how, and permanent innovation.
OSRAM FREED-UP TO GO IT ALONE
Amidst this transformation, and in light of an industry being turned inside out, iconic electronics conglomerate Siemens decided in early 2011 that it was the right time to carve out its lighting subsidiary and let OSRAM spread its own wings. Due to the highly volatile markets, a spin-off model was chosen and eventually executed in mid-2013. The separation proved to be a classic win-win scenario: Siemens shareholders benefited from the spin-off, as Sie-mens shares gained value parallel to market sentiment despite a value creation of circa €2.5 billion from the newly listed stock. On the other hand, OSRAM gained di-rect access to the capital market as well as the flexibility to make quick decisions in light of a massive technological change.
However, after many years as part of a gigantic conglom-erate, how do you run a standalone, listed company? What is needed to ensure undisturbed business opera-tions while creating the structures needed to swim with-out a mother ship?
OSRAM had obviously received a “life raft” from Siemens including a sound capital structure, assistance with legal changes, support during the listing process as well as management resources. Nonetheless, essential depart-ments had to be established where the organizational chart had previously been unoccupied, such as investor relations, communications, taxes, or treasury. All newly formed departments were benchmarked against compa-
nies equal in size and regulatory environment, the goal being an adequate set-up with regard to flexibility and costs. Day-one readiness had to be ensured with regard to many critical legal processes and regulations. Topics such as pensions, IT or accounting had to be fail-safe right from the start. There was a great spirit of anticipation and excitement about our very own Big Bang.
PUSH PROGRAM ENSURES COMPETITIVENESS
Besides these regulatory and cultural adaptations, an ex-tensive transformation program was unavoidable. First, negotiations had immediately started in late 2011 in order to ensure that OSRAM stays competitive as a standalone company. The resulting organization-wide program was dubbed OSRAM Push and soon became the backbone of the company’s change efforts, comprising mostly foot-print reduction measures in the traditional general light-ing segment and costing around €600 million. Further-more, the Push methodology included an increased aspi-
©
Osra
m
P A G E3 1

T H E S T E R N S T E W A R T I N S T I T U T E P E R I O D I C A L # 1 2D R . K L A U S P A T Z A K : J U M P I N G I N T O T H E D E E P E N D
ration to operational productivity as well as cultural aspects. It was hoped that these steps would make the or-ganization weather-proof for the storms to come.
As of July 2013, investors did not have to buy a pig in a poke anymore, but were able to make two independent investment decisions. OSRAM indeed started off per-forming admirably: The spin-off was a great success, with the share price doubling until early 2014. This was all the more remarkable as certain index funds were forced to withdraw from the share following their investment crite-ria, thereby putting it under pressure from the start. In order to compensate, extensive road shows were con-ducted that illustrated the equity story as well as the long-term prospects of the started transformation program. By segmenting investors and addressing the capital market more specifically, we made sure to put our limited mar-keting resources to good use. Today, the share continues to outperform the German DAX and MDAX indices, beating both by around 40 percentage points since the listing.
However, OSRAM experienced trying times when a sharper-than-expected decline in conventional lighting made it clear that a much more radical change was ines-capable. Leveraging the already existing platform of our Push program, we initiated Push Phase II, focusing again on the traditional general illumination business, but com-plemented by a strong commitment to improve adminis-trative functions. The aim was to create a leaner adminis-tration and to adjust our processes following strict cost-bene fit deliberations. Verticalization was enforced, including a clear definition of roles and responsibilities of business units, regional headquarters, sales channels, and global functions.
ROADMAPS, COUNTLESS MEASURES, AND A DEDICATED TEAM
First, the cornerstones, such as the organizational separa-tion of the conventional and LED lamps businesses, were communicated on Capital Market Day in April 2014 – only a few months after the faster decline of traditional lamp revenues had become apparent. By early August, we had a solid road map on how to proceed, and were able to communicate the program and the aspects to tackle. The reorganization of indirect functions was split into three sub work streams: Sales Streamlining, Lean Headquarters, and Global Shared Services. The goal of significant, dou-ble-digit savings within our sales and administrative workforce was, however, not only a reaction to the decline in traditional lamps, it was also meant to unburden the fast-growing but still unprofitable businesses and make their backpack as light as possible. In late 2014, the re-spective cornerstones were agreed with the workers’ council, ensuring a swift execution also in Germany. The Push program has meanwhile left project status and is be-coming a more ongoing productivity system with more than 11,000 individual measures, steered by a dedicated team.
Productivity and restructuring gains are necessary but not sufficient ingredients for long-term success. Financial flexibility has been achieved for the foreseeable future through generous credit lines as well as a comfortable equi ty cushion. This begs the next question: Are we doing the right things, and not just the things right? How can we maintain a meaningful selection in a massively changing industry, and become even more relevant for our custom-ers?
Competitors have recently announced drastic moves. While the future of some conglomerates’ lighting opera-tions remain unclear, others are set to be spun off, split up, or are slated for trade sales. This undoubtedly raises ques-
P A G E3 2

T H E S T E R N S T E W A R T I N S T I T U T E P E R I O D I C A L # 1 2D R . K L A U S P A T Z A K : J U M P I N G I N T O T H E D E E P E N D
tions as to our portfolio structure. Which value-adding depth ensures a competitive advantage in a worldwide market where barriers to entry are diminishing? Are syn-ergies along the lighting value chain realistic? Are they key?
It would be unsound to suggest that there is a quick and easy answer. The lighting industry will undergo a hefty transformation in the years to come. OSRAM, however, now has the flexibility and strength to consider all strate-gic options. With the separation from Siemens and our emancipation as a standalone, pure-play lighting com-pany we are already ahead of the curve.
©
Osra
m
©
Osra
m
P A G E3 3

Four challenges of financial Institutions
Stern Stewart Research
Investment in FinTech vs. bank’s investment in SMAC1
Figures in $bn
20
10
020102008 2012 2014
2015
8.0
Banks FinTech
Figures in €bn
TimeUBS (1862)
PayPal
(1998)
75.349.6
Commerzbank (1870)
Lendin
g Club (2006)
15.6 7.0Deutsche Bank (1870)
Square (2009)
39.7
6.0
Current market capitalization FinTech vs. banks
Cost/income ratio 2013
Deutsche Bank 89%
Postbank 84%
Commerzbank 73%
HypoVereinsbank 63%
Big banks 78%
Commercial banks 73%
Savings banks 67%
Credit cooperatives 65%
VW Fin. services 58%
Direct banks 52%
– 37%
Factor cost benchmarking for financial & IT services
In € ⁄day500400300200100
0Germany Spain Poland India
– 60.0% – 70.0% – 80.0%
Trends in global insurance penetration (2000 – 2013)
10
8
6
4
2
020102000 2011 2012 2013
Potentially overinsured Stabilize market / innovate
Potentially underinsured Tap market potential
Insurance penetration (Insurance premium as % of GDP)
OECD average (1.5% GDP CAGR 2000 – 2013)
World average (2.5% GDP CAGR 2000 – 2013)
BIC average (7.9% GDP CAGR 2000 – 2013)
2 HIGHER GROWTH
AND LOWER COSTS IN DIRECT BANKING
How to adjust the business model
to the new equilibrium in retail banking?
4 COST MANAGEMENT
To what extent can European banks further benefit from lower factor costs through nearshoring & offshoring?
1 ATTACK OF THE FINTECHS
How to deal with the “New Economy” in banking and the attack of aggressively
financed FinTechs?
3 CHALLENGES & CHANCES IN INSURANCE MARKETS
How to tap underinsured emerging markets on the one
hand, and how to stabilize shrinking developed markets
on the other?
FOUR CHALLENGES FOR FINANCIAL INSTITUTIONS
© S
tern
Ste
war
t Res
earc
h
1) Social, Mobile, Analytics, Cloud

IN THE
INVEST FUTURE
OFFER interestingprojects
& PERMANENT
CHANGE
EM-PLOYEES
ARE THE MOST IMPORTANT CAPITAL
ATTRACTIVE
companiesTO MAKE THEMSELVES
NEED
ENCOURAGE
CREATIVITY
—
T H E S T E R N S T E W A R T I N S T I T U T E P E R I O D I C A L # 1 2S T E P H A N S C H U L Z : S U S T A I N A B I L I T Y I N Y O U N G T A L E N T S
P A G E3 6

Sustainability in Young Talents – Competition Will Be Won with Human Capital in the Future
An old and timeless business motto says that employees are the most important source in a company for innova-tion, creativity, stable customer relations, efficiency and vigor and, ultimately, for growth and success. In their ca-pacity as the most important “capital”, employees will con-tinue to gain traction for companies. Imagine if compa-nies and operations were no longer able to recruit enough young talents and qualified personnel. From an entrepre-neurial standpoint it would be catastrophic if this source of success gradually dried up. Yet the demographic devel-opment and the job market in Germany have been sound-ing the alarm for some time. Within the next ten years, many German companies stand to lose up to 50 percent of their employees for age-related reasons, while at the same time the supply of qualified young talents is going to de-cline for demographic reasons. The first indications of this are already very noticeable because not all training positions and vacant positions can be filled anymore. This is why the competition of the future will be determined on the HR side, and companies are well advised to start giving some serious thought today as to how they intend to make themselves attractive in the future for their most important potential – people.
CHANGING VALUES
The young Millennial Generation, also called Generation Y, is well educated often at the technical college or univer-sity level. Compared to earlier generations, this one usu-ally displays a different attitude toward work and employ-ers. Whereas the work and salary were still crucial factors for the choice of employer in 2004, other values have meanwhile become pivotal. Today, employers have to be “cool” and offer interesting projects and career options while ensuring advanced training and international flair as well as operating as sustainably as possible. Especially important to employees of this generation is a work-life balance whereby work does not come before everything else in life.
A higher degree of freedom, meaning the possibility for personal fulfillment and more time for family and leisure activities are key demands of Generation Y. With regard to work, variety, creativity, and intellectual inspiration are in demand. There is a preference to work in teams and in networks rather than in entrenched hierarchies. Instead of status and prestige, work enjoyment and the search for
T H E A U T H O R
Stephan SchulzCFOPaul Hartmann AG
P A G E3 7

T H E S T E R N S T E W A R T I N S T I T U T E P E R I O D I C A L # 1 2S T E P H A N S C H U L Z : S U S T A I N A B I L I T Y I N Y O U N G T A L E N T S
meaning are taking center stage. For Generation Y, fun does not start after work hours. Instead, Millennials would also like to be happy during work hours at a job that has meaning. Yet, everyday life often presents differ-ently, and the patience to wait until things might develop favorably is often limited. As a result, early fluctuation rates among new entrants are rising. Hence enthusiasm is the name of the game right from the start. How can com-panies now meet these high demands and retain employ-ees over the long term?
CREATING ENTHUSIASM
Most people want to work in successful and growing com-panies; this environment creates career prospects, a sense of team spirit (because success unites) and offers interest-ing projects and, last but not least, security. If a company finds itself initially in a downward economic spiral, it will have a hard time positioning itself as an attractive em-ployer in the face of even stiffer competition. This is why it is all the more important today for companies to be suc-cessful. This also means as the case may be taking greater entrepreneurial risks and investing even more in the fu-ture, in new products and technologies (and their market-ing), in improved working conditions, in more training, and in the employer brand. Investments in management development programs, talent management, open office concepts, and occupational health management all have a longer-term return on investment that is difficult to grasp in hard figures because it is based on estimates. This means a company has to shift its thinking to long-term corporate commitments as part of a corporate manage-ment strategy that is sustainably oriented. Moreover, in the process, hierarchies have to be done away with and communication in networks has to be promoted because hierarchy and authority as management tools are less and less effective in the following generation. For companies, this means focusing on advancing specific skills and abili-ties of their managers. Millenials want to feel vigor and permanent change; standstill is poison for them.
CREATIVITY AS A SUCCESS FACTOR
Creativity is the foundation for new ideas and innovation in all areas of the company. Creative people want to meet other creative people and to inspire each other. Therefore, in the future, even more creativity will be in demand within the company to strengthen one’s own competitive-ness. This applies in even greater measure when reaching
Changing Employee Values
2004 2014
1 . WORK 1 . WORK CLIMATE
2 . SALARY 2 . FLEXIBILITY
3 . WORK CLIMATE 3 . CAREER PROSPECTS
4 . JOB SECURITY 4 . SKILL DEVELOPMENT
5 . CAREER PROSPECTS 5 . WORK-LIFE BALANCE
6 . ADVANCED TRAINING 6 . FLAT HIERARCHY
7 . CORPORATE VALUES 7 . SUSTAINABILITY
8 . FLAT HIERARCHY 8 . HOME OFFICE
9 . FLEXIBLE WORKING HOURS 9 . CRS
10 . WORK-LIFE BALANCE 10 . SALARY
Source: Research by Prof. Dr. Tim Weitzel, Otto-Friedrich-University Bamberg
P A G E3 8

T H E S T E R N S T E W A R T I N S T I T U T E P E R I O D I C A L # 1 2S T E P H A N S C H U L Z : S U S T A I N A B I L I T Y I N Y O U N G T A L E N T S
out to applicants. Job markets are undergoing massive change. This is where both demographic change and changes in the recruiting channels are already clearly no-ticeable. Traditional job postings only draw few responses nowadays. Instead, social media’s various platforms are taking center stage and, increasingly, so is recruiting via networks. The more top performers a company has, the easier recruiting is because good people attract good peo-ple. The same goes at the international level; the higher the percentage of international employees in a company, the more attractive the company is for high potentials on international job markets, and the easier they are to inte-grate into the team. As part of the long-term development of potential in the recruiting process, reaching out early on to schools and maintaining a presence at universities (in courses, case studies, and job fairs) are two factors that are playing an increasingly important role when making first contact. By way of creative hiring events, which make the company come alive with its targets, ambitions and purpose, companies can win over candidates at the emo-tion level after making first contact.
FROM HR ADMINISTRATION TO HR MANAGEMENT
Given all of these aspects, HR management has long since become a truly strategic corporate function. While major companies have already made tremendous advances in HR management in recent years, the HR practice often falls short, notably in mid-sized companies where it is more or less “administered”. The process of turning HR management at HARTMANN into a strategic corpo-rate function got underway five years ago with the rea-lignment of the entire HR department. Creating programs requires lots of creativity, strategic thinking, business acu-men, tremendous commitment, staying power and enthu-siasm since developing strategic HR management neces-sitates a systematic approach that is geared to the long
term. In recent years, HARTMANN has sustainably strengthened its brand as an attractive employer. We have increased the training rate, launched a junior start-up company called Young Talents and intensified coopera-tion with the Baden-Württemberg Cooperative State Uni-versity in the area of health sciences, as an example. More-over, we developed a program for work and family as well as for the care of relatives. We introduced corporate health management, bolstered our presence as an employer brand in social media, and are actively marketing our-selves at schools and universities. The positive effects on the HARTMANN brand can be measured directly on rat-ing platforms and by the number of unsolicited applica-tions and these effects are reflected in a consistently low fluctuation rate. Another focus of HARTMANN’s HR management is the Right People in the Right Place program. Starting with key positions in the company, all managers are going to be systematically evaluated for po-tential and performance. This evaluation is the basis for individual development programs to close any identified gaps and to use discovered talent even better for the com-pany. At the moment, we are working on a company-wide Management Development Program and on a HART-MANN Talent Management program. The L.A.C.E. pro-gram stands for leadership, accountability, commitment, and execution and captures our expectations of managers and employers with regard to initiative, leadership, and binding implementation. In order to use human capital more efficiently around the globe, we are developing pro-grams to allow employees and managers to rotate more readily internationally. This promotes the development of skills and abilities and international cooperation in the company as the basis for further global expansion of our company.
P A G E3 9

T H E S T E R N S T E W A R T I N S T I T U T E P E R I O D I C A L # 1 2T S S I I N S I G H T S : T H E I M P O R T A N C E O F L I T E R A C Y
P A G E4 0

The Importance of Literacy
Being illiterate means more than just being unable to read a book. While people who are functionally illiterate might be able to read and write simple words, they cannot read a medicine label, balance a checkbook, or fill out a job ap-plication. People who are completely illiterate cannot read, write or use numerical skills. In general, illiteracy affects many aspects of life ranging from the inability to vote to general conditions of poverty, poor health right up to a failure to integrate into society.
Illiteracy can even have a direct impact on the chance of survival when, for example, patients have difficulties reading prescriptions. A study done by the Archives of In-ternal Medicine revealed that “those patients are 50 per-cent more likely to die from disease than literate patients.” (ABC News, 2008). Thus, the term illiteracy has evolved from the original meaning of the inability to read and write to now include a general lack of knowledge and edu-cation.
LITERACY IMPROVES LIFE
What illiteracy means and what its consequences are ap-pear straightforward, but how can we value literacy in qualitative and quantitative terms?
From a qualitative and individual perspective moving from illiteracy to literacy improves an individual’s life in four ways (Martínez & Fernández, 2010), which are very similar in developing and developed countries:
1. Literacy is the prerequisite for economic prosperity since the chances of employment and higher salaries increase dramatically for literate persons.
2. The ability to absorb knowledge about personal care, hygiene, nutrition, and sexual behavior indisputably improves health.
3. Educational aspirations and expectations of oneself and family to prioritize and improve personal capaci-ties.
4. Social integration and cohesion measured by the level of self-esteem, autonomy and critical thinking and crime rate. A core level of literacy is important to hold society together. If everyone were taught and had and understood basic knowledge, society would be more equal and less divided by classes.
Fighting illiteracy is an investment instead of a charitable undertaking. Literacy rates are a crucial measure of the value of a region’s human capital. In quantitative terms, a cost-benefit analysis of adult literacy training easily re-veals that there are economic gains for individuals, the
T S S I I N S I G H T S
The Stern Stewart Institute’s Africa Projects
P A G E4 1

T H E S T E R N S T E W A R T I N S T I T U T E P E R I O D I C A L # 1 2T S S I I N S I G H T S : T H E I M P O R T A N C E O F L I T E R A C Y
companies they work for, as well as for the economy and the country as a whole, as measured, for example, in an increased GDP.
Measured by earnings, the impact of illiteracy on personal income is not surprising. Illiterate people earn 30 percent to 42 percent less than their literate counterparts and do not have the literacy skills required for further vocational education or training to improve their earning capacity. The income of a person with poor literacy skills stays about the same throughout their working life. However, individuals with good literacy and numeracy skills can expect their incomes to increase at least two to three times that of what they were earning at the beginning of their careers.
GLOBAL LITERACY RATES
In recent decades, the global population has grown so much that the planet’s population in the 21st century is
about six times higher than it was in the 1920s. While population growth in Europe and North America has been declining, fertility rates are still very high in less de-veloped areas of the world.
Overall, global illiteracy rates are decreasing. However, as the level of development and the rate of illiteracy are pos-itively correlated (see Figure 1), population growth in less developed countries still leads to an increase in the total number of illiterates in low-income regions. The area most heavily affected by this is Sub-Saharan Africa which has seen an increase of nearly 50 million illiterates be-tween 1990 and 2011. During the same time period, the number of illiterate people in the world decreased from 880 million to 770 million.
The level of illiteracy is intrinsically linked with the edu-cation level in a given country. The net enrollment rate is a figure that measures access to education and people’s willingness to actually enroll in educational programs. While net enrollment rates have been increasing even in
100
80
60
40
20
0
1,000 1,00010,000 10,000100,000 100,000
Figure 1: Correlation Between National Wealth and Literacy Rate
GDP per capita and adult literacy rate GDP per capita and youth literacy rate
GDP per capita, PPP ($)
Lite
racy
rate
(%)
South and West Asia
Sub-Saharan Africa
Arab States
Central and Eastern Europe
Central Asia
North America & Western Europe
East Asia and the Pacific
Latin America and the Caribbean
P A G E4 2

T H E S T E R N S T E W A R T I N S T I T U T E P E R I O D I C A L # 1 2T S S I I N S I G H T S : T H E I M P O R T A N C E O F L I T E R A C Y
low-income countries, the difference to enrollment rates in high-income countries is still substantial. The gap be-tween enrollment rates of high-income countries and low-income countries widens even more dramatically when considering secondary education.
One of the most prevalent causes for low net enrollment rates in low-income countries is that parents of school-aged children prefer that their children start working in-stead. Even though the immediate path to uneducated employment provides the family with more household income in the short term, it decreases the likelihood that future generations within this family will receive an edu-cation. Therefore, it is crucial to break this spiral given that an individual is likely to become literate if the parents are literate.
FIGHTING ILLITERACY
When access to primary education is very limited, other approaches are needed to combat illiteracy and thus pov-erty.
A home environment that supports literacy is one of the most effective approaches to helping young children de-velop literacy skills. Instructional environments have a powerful impact on children’s reading skills. While class-room environments naturally foster learning, researchers believe that the same effects may also be found in sup-portive home environments. Children who see their par-ents reading and writing do better than those who do not have such models.
P A G E4 3

T H E S T E R N S T E W A R T I N S T I T U T E P E R I O D I C A L # 1 2T S S I I N S I G H T S : T H E I M P O R T A N C E O F L I T E R A C Y
The problem in the affected Sub-Saharan region is seri-ous. When the two factors of limited access to primary education and illiterate parents, especially women, mix, it is almost impossible for a child to learn to read and write, meaning that illiteracy is passed on from generation to generation.
Many literacy programs around the world focus on women. Whereas developing countries need strong sup-
port for education initiatives, industrialized countries with high net enrolment rates run literacy programs par-allel to the main language literacy programs for children with special learning needs or who are from socially dis-advantaged families.
Programs that have dramatic results for economies and societies are naturally those in countries with a low net enrolment rate and high illiteracy rates. Poverty inevitably leads to poor education systems making it hard to build a prosperous future. Literacy programs are an important component to improving basic requirements for eco-nomic and social well-being.
FUNCTIONAL LITERACY IN 40 HOURS – A PROGRAM OF THE STERN STEWART INSTITUTE
The Stern Stewart Institute has been involved in literacy programs in Burkina Faso since 2010. From the very be-ginning, the goal was to make literacy lessons more effi-cient and to teach as many people as possible. Our vision is to erase illiteracy in Burkina Faso as far as possible, and, in doing so, we are focusing on women.
Ranking 170th in the world with a GDP per capita (PPP) of ca. $1,500, Burkina Faso is undoubtedly one of the poorest countries in the world. The country has recently experienced one of the most important political reforma-tions in its recent history. Former President Blaise Com-paoré had been ruling the country since gaining power in 1987 through a coup d’état.
He was forced to resign when a series of protests culmi-nated in a military coup on October 31, 2014. Compaoré had been planning to amend the constitution in order to extend his 27-year rule and as a result was confronted with increasing opposition and resistance from the popu-
Female
40
30
20
10
0
Figure 2: Despite an Increasing Literacy Rate…(Adult literacy rate Burkina Faso by gender)
…Illiterate Population Is Still Growing(Adult illiterate population, total in million)
1975 1980 1985 1990 1995 2000 2005 2010
Male
1990 2000 2010 2015
5 .81 6 .755 .62
projection
4 .33
P A G E4 4

T H E S T E R N S T E W A R T I N S T I T U T E P E R I O D I C A L # 1 2T S S I I N S I G H T S : T H E I M P O R T A N C E O F L I T E R A C Y
lation. Former minister of foreign affairs, Michael Kaf-ando, took office as interim president until the planned general election takes place on October 11, 2015.
LITERACY RATE INCREASES
It is unclear whether the recent political turmoil will help in improving the country’s economic and societal prob-lems. As evident in Figure 3, one of the largest problems in Burkina Faso is the level of literacy. Given that the abil-ity to read and write is essential for an education and therefore, economic development, Burkina Faso’s low lit-eracy rate of 28 percent is one reason for the country’s
weak economy and dire poverty. Although Burkina Faso has recently seen a tentative increase in the literacy rate, the enormous population growth is the reason for an in-creasingly illiterate population in absolute numbers (see Figure 2).
By teaching more and more people how to read and write, the TSSI program not only provides people with the abil-ity to access further education and economic prosperity, but also offers a life-changing experience for every single person.
Source: UNESCO Institute for Statistics, May 2012.Note: 2010 data refer to the period 2005 – 2010.
Figure 3: Adult Literacy Rate, by Country and Gender, 2010
Total
ChinaMexico
IndonesiaBrazil
IranIraq
CambodiaEgypt
SudanRwanda
EritreaDR Congo
MadagascarYemen
IndiaNigeria
Papua New GuineaNepal
Timor-LesteMauritania
TogoBangladesh
MozambiqueMorocco
Central African RepublicPakistan
Guinea-BissauGambiaSenegal
HaitiBenin
Sierra LeoneGuinea
EthiopiaChadMali
Burkina FasoNiger
0 20 40 60 80 100
P A G E4 5

T H E S T E R N S T E W A R T I N S T I T U T E P E R I O D I C A L # 1 2T S S I I N S I G H T S : T H E I M P O R T A N C E O F L I T E R A C Y
The newly acquired reading skill makes everyday life eas-ier in ways which are hard to imagine for the industrial-ized world. Simple things like being able to read newspa-pers and road signs, use mobile phones and other means of communication and fill out job forms are dramatically enhancing opportunities for a better social and economic life. Furthermore, there is an increased understanding of the importance of children’s education and, for the first time, parents have the ability to assist their children with schoolwork. In addition, our focus on women, who are typically responsible for education in Burkina Faso, helps facilitate the appreciation of literacy across family genera-tions. In an effort to make literacy lessons more efficient and to achieve a breakthrough in the alphabetization of the Burkinabé, TSSI is using the innovative Computer-Based Functional Literacy (CBFL) method. This method consists of a computer-based multimedia learning system that teaches an illiterate person how to read in a record time of only 40 hours. The secret to the CBFL program is that it focuses on learning words rather than letters. Cur-rently, the program is based on Mooré, which, besides French (as the official language) and several less common dialects, is the dominant local language in Burkina Faso.
POSITIVE FEEDBACK FOR CBFL
At this time, TSSI is operating 42 CBFL centers all over the country. In 2011, when the program was initiated, we had 383 participants. Since then, the number of partici-pants has more than tripled to approximately 1,200 and increases annually by 400 participants. This substantial increase in participants who are given the chance to learn how to read and write is only possible by frequently open-ing new classrooms and training new teachers. In order to reach the ambitious growth targets of our program, we plan to intensify our cooperation with the government and strengthen our ties with other partners. By following that cooperation strategy, TSSI is close to achieving the
next big milestone of implementing the next generation of CBFL together with Tata Consultancy Services (TCS) and the Burkinabé Directorate of Research and Innovations in Literacy & Non-Formal Education (DRINA).
Since the implementation of the CBFL, the feedback from both government and non-government sectors has been very positive and encouraging. However, recently we have been requested by the Directorate of Research and Inno-vations in Literacy & Non-Formal Education (DRINA) to create a language solution that conforms to the new cur-riculum agreed upon by the government and its develop-ment partners. Only if the next generation of CBFL con-tent meets with governmental requirements will it be ac-cepted as a language solution thereby making it possible for the program to receive the needed resources to run additional CBFL centers.
P A G E4 6

T H E S T E R N S T E W A R T I N S T I T U T E P E R I O D I C A L # 1 2T S S I I N S I G H T S : T H E I M P O R T A N C E O F L I T E R A C Y
MAKING A DIFFERENCE
Currently, an international team consisting of TSSI and TCS in Burkina Faso, Germany, and India is working on the next generation of the Computer Based Functional Literacy software. TSSI is providing the updated language scripts (incl. necessary voice-overs) and is coordinating government approvals, while TCS is coding the new CBFL. Once CBFL has been updated to meet the latest governmental requirements, the project will have access to public funds to open more CBFL centers.
In light of last year’s political turmoil, it is evident that Burkina Faso is still working on its sustainable political stability. As we believe that one of the crucial aspects for a stable democracy is the continuous development of the Burkinabé society, we are confident that the TSSI literacy program provides a highly valuable contribution for Bur-kina Faso’s future advancement.
THE STERN STEWART INSTITUTEOuagadougou Government negotiations, voice-overs & operations
TATA CONSULTANCY SERVICESMumbai CBFL programming
THE STERN STEWART INSTITUTEMunich Project lead & coordination
P A G E4 7

100 %EMUMONEY
FISCAL
ECONOMIC DRAMATEXAS RATIOS
GREECE
PHANTOM ASSETSWORTHLESS CREDITS
TIME BOMB
CONTRACTEDEXCEEDED
BANK FAILURES
MEASURE
T H E S T E R N S T E W A R T I N S T I T U T E P E R I O D I C A L # 1 2P R O F . D R . S T E V E H . H A N K E : G R E E C E – D O W N A N D O U T
P A G E4 8

Greece – Down and Out
Led by the charismatic Alexis Tsipras, the Syriza party took office in Athens on January 26. The most prominent member of the new Prime Minister’s cabinet is Yanis Varoufakis, the Finance Minister. He is an economics pro-fessor, with a complete repertoire of anti-capitalist rheto-ric. And with government spending amounting to 58.5 percent of Greek GDP, Varoufakis’ hot anti-austerity harangues have turned the meaning of the word “auster-ity” on its head.
After three months in office, the Syriza coalition has ac-complished virtually nothing. There have been no com-mitments – credible or not – to do anything.
As Greece’s economic drama (read: crisis) moves toward its final stage, people are anxious to see how it will end. “I looked up the answers in the history books,” writes John Dizard in the Financial Times, “it works better than try-ing to get inside information from the cabinet, since there is no information on the inside.”
T H E A U T H O R
Prof. Dr. Steve H. HankeBoard MemberThe Stern Stewart Institute
EconomistThe Johns Hopkins University
P A G E4 9

T H E S T E R N S T E W A R T I N S T I T U T E P E R I O D I C A L # 1 2P R O F . D R . S T E V E H . H A N K E : G R E E C E – D O W N A N D O U T
It turns out that this is not the first time Greece has been in financial hot water. Indeed, that Balkan country has been a serial deadbeat. Following its recognition as a state in 1832, Greece spent most of the remainder of the 19th century under the control of creditors. The pattern started with a default in 1832. In consequence, Greece’s finances were put under French administration. Following Greece’s defeat at the hands of Turkey in 1897, Greece’s fiscal house was entrusted to a Control Commission. During the 20th century, the drachma was one of the world’s worst curren-cies. It recorded the world’s sixth highest hyperinflation. In October 1944, Greece’s monthly inflation rate hit 13,800 percent.
Fast forward, and we observe Greece’s entry into the Euro pean Monetary Union (EMU) on January 1, 2001, two years after the eleven original members established the EMU. Greece’s entry was under a cloud because most either knew or suspected that it came with some account-ing trickery. Still, the Greeks were enthusiastic new mem-bers of the “club.” If Greece could enter without following the rules and free ride – the other members of the “club” would have to pay the bill. That was the thinking in
Athens. But, Greece got into trouble when others stopped picking up the tab. This is a classic recipe for a fiscal time bomb, and time is running out.
The International Monetary Fund (IMF), as well as the European Union (EU) and other creditors have supplied plenty of fissionable material for the bomb. As for the IMF, it has never before extended credit to any country on such a scale. Under normal conditions, the IMF is sup-posed to be limited to lending up to 200 percent of a country’s quota in a single year and 600 percent in cumu-lative total. Under the IMF’s “exceptional access” policy, however, there are virtually no limits on lending. Greece has talked its way into IMF credits worth an astounding 1,860 percent of its quota. In consequence, Greece owes the IMF about $30 billion, with big chunks of the debt due relatively soon.
The creditors have a Greek problem. In the words of for-mer President George W. Bush: “this sucker is going down.”
To understand why, one needs a theory of national in-come determination. Unfortunately, most of what is writ-ten about Greece fails to offer much by way of such a theory. Indeed, the financial musings about the Greek crisis adhere to my “95 percent Rule”: 95 percent of what appears in the financial press is either wrong or irrelevant.
300
250
200
150
100
50
0
Figure 1: Greece Money Supply (M3)
Sources: ECB and calculations by Prof. Steve H. Hanke, The Johns Hopkins University.
Note: The trend line for the money supply is calculated over the period from Jan. 2003 to Feb. 2015. Instead of a linear line, which presents constant incremental changes over time in nominal terms, this chart includes an exponential trend line, which has a constant growth rate over time in percentage terms.
Billi
ons
of E
uro
20032004
20052006
20072008
20092010
20112012
20132014
2015
State Money (MB) Total Money
Supply (MS) Bank Money
(MS-MB) Money Supply-
Exponential Trend
The exponential trend line grows at a constant annual rate of 2.42 %
State Money is
15.74 % of M3.
From Jan. 2003 to Sep. 2008 the exponential
annual trend growth rate for M3 was 9.99 %
Since Oct. 2008, the exponential annual trend growth rate for M3 is – 6.04 %
Figure 2: Total Assets For the Largest Greek Banks
Sources: Bloomberg. Calculations by Prof. Steve H. Hanke, The Johns Hopkins University.Note: Values in millions of euros. End of year data, 2014.
Bank Assets (in millions of euros)
National Bank of Greece 113,311
Piraeus Bank 86,419
Eurobank Ergasias 74,264
Alpha Bank 72,420
Banking System Total 397,800
P A G E5 0

T H E S T E R N S T E W A R T I N S T I T U T E P E R I O D I C A L # 1 2P R O F . D R . S T E V E H . H A N K E : G R E E C E – D O W N A N D O U T
The monetary approach fills this void. It posits that changes in the money supply, broadly determined, cause changes in nominal national income and the price level. Sure enough, the growth of broad money and nominal GDP are closely linked.
Greece is in a depression. During the 2008 – 2013 period, GDP has dropped by almost 30 percent. Last year, GDP managed to stabilize, with growth of less than 1 percent. However, this year looks very grim. A review of Figure 1 explains these dismal data. The broad money measure for Greece (M3) has contracted dramatically since the onset of the 2009 financial panic. Indeed, it’s been contracting at a 6.04 percent annual rate. In consequence, the monetary approach to national income would predict a serious con-traction in GDP – just what has occurred in Greece. We can expect further contraction of the Greek economy. It’s already baked in the cake. Broad money (M3) growth has been in negative territory since December 2014, and it’s currently contracting at a 9.77 percent rate.
The total money supply can be broken down into its state money and bank money components. State money is the high-powered money (the so-called monetary base) that is produced by central banks. Bank money is produced by commercial banks through deposit creation. Contrary to what most people think, bank money is much more im-portant than state money. In Greece, for example, bank money makes up 84.26 percent of the total money supply.
Therefore, let’s take a look at Greek banks – the all-impor-tant producers of money. To do that, we analyze the state of Greece’s four largest banks which account for 87 per-cent of the total bank assets in Greece (see Figure 2).
We use a little known, but very useful formula to deter-mine the health of the Big Four. It is called the Texas Ratio. It was used during the US. Savings and Loan Crisis, which was centered in Texas. The Texas Ratio is the book value
of all non-performing assets divided by equity capital plus loan loss reserves. Only tangible equity capital is included in the denominator. Intangible capital – like goodwill – is excluded.
The ratio measures the likelihood of failure by comparing a bank’s bad assets to its available provisions for bad loans plus its capital. When the ratio exceeds 100 percent, a bank does not have the capacity to absorb its losses from troubled assets. In consequence, it will either require a fresh capital injection, or it will fail.
At the close of business last year, the Texas Ratios ex-ceeded 100 percent for the Piraeus Bank, Alpha Bank, and the Eurobank Ergasias (see Figure 3). And the national
Figure 3: Texas Ratios for the Largest Greek Banks
Source: Bloomberg. Calculations by Prof. Steve H. Hanke. The Johns Hopkins University.
Texas ratio formula:
(Bank non-performing assets and loans)(Total equity + Reserve for loan losses)
Note: Reserve for loan losses unavailable for Eurobank Ergasias, 2010.
Bank Year Texas Ratio
National Bank of Greece 2010 49.40 %
2012 424.00 %
2013 130.10 %
2014 98.70 %
Piraeus Bank 2010 55.90 %
2012 719.10 %
2013 163.90 %
2014 195.10 %
Alpha Bank 2010 67.20 %
2012 224.30 %
2013 134.10 %
2014 129.40 %
Eurobank Ergasias 2011 145.70 %
2012 273.60 %
2013 132.50 %
2014 124.70 %
P A G E5 1
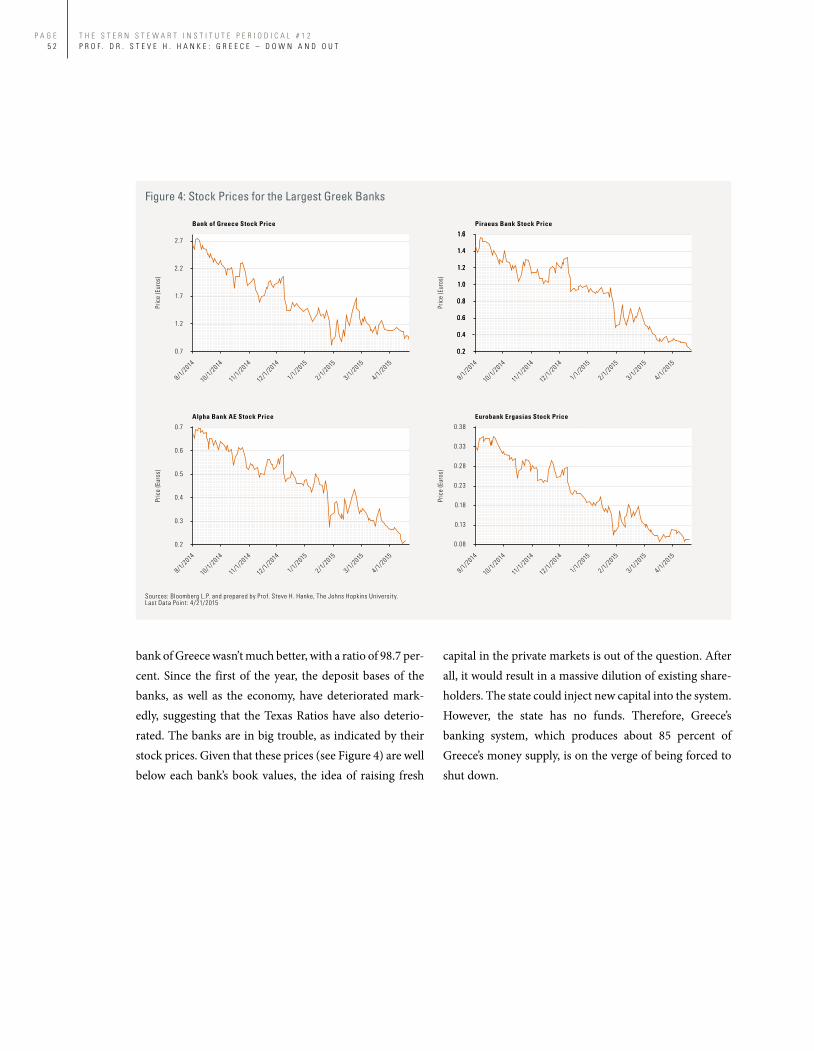
T H E S T E R N S T E W A R T I N S T I T U T E P E R I O D I C A L # 1 2P R O F . D R . S T E V E H . H A N K E : G R E E C E – D O W N A N D O U T
bank of Greece wasn’t much better, with a ratio of 98.7 per-cent. Since the first of the year, the deposit bases of the banks, as well as the economy, have deteriorated mark-edly, suggesting that the Texas Ratios have also deterio-rated. The banks are in big trouble, as indicated by their stock prices. Given that these prices (see Figure 4) are well below each bank’s book values, the idea of raising fresh
capital in the private markets is out of the question. After all, it would result in a massive dilution of existing share-holders. The state could inject new capital into the system. However, the state has no funds. Therefore, Greece’s banking system, which produces about 85 percent of Greece’s money supply, is on the verge of being forced to shut down.
Figure 4: Stock Prices for the Largest Greek Banks
0.7
0.6
0.5
0.4
0.3
0.2
0.38
0.33
0.28
0.23
0.18
0.13
0.08
1.6
1.4
1.2
1.0
0.8
0.6
0.4
0.2
1.6
1.4
1.2
1.0
0.8
0.6
0.4
0.2
1.6
1.4
1.2
1.0
0.8
0.6
0.4
0.2
Pric
e (E
uros
)Pr
ice
(Eur
os)
Pric
e (E
uros
)
2.7
2.2
1.7
1.2
0.7
Pric
e (E
uros
)
Bank of Greece Stock Price Piraeus Bank Stock Price
Eurobank Ergasias Stock PriceAlpha Bank AE Stock Price
Sources: Bloomberg L.P. and prepared by Prof. Steve H. Hanke, The Johns Hopkins University.Last Data Point: 4/21/2015
9/1/2
014
10/1
/2014
11/1
/2014
12/1
/2014
1/1/
2015
2/1/2
015
3/1/2
015
4/1/2
015
9/1/2
014
10/1
/2014
11/1
/2014
12/1
/2014
1/1/
2015
2/1/2
015
3/1/2
015
4/1/2
015
9/1/2
014
10/1
/2014
11/1
/2014
12/1
/2014
1/1/
2015
2/1/2
015
3/1/2
015
4/1/2
015
9/1/2
014
10/1
/2014
11/1
/2014
12/1
/2014
1/1/
2015
2/1/2
015
3/1/2
015
4/1/2
015
P A G E5 2

T H E S T E R N S T E W A R T I N S T I T U T E P E R I O D I C A L # 1 2P R O F . D R . S T E V E H . H A N K E : G R E E C E – D O W N A N D O U T
YET ANOTHER GREEK SECRET
When banks are in distress, it is important to assess how easily the bank’s capital cushion can absorb potential losses from troubled assets. To do this, I performed an analysis using Texas Ratios for Greece’s four largest banks, which control 88 percent of total assets in the banking system.
Despite the already worrisome numbers, the actual situa-tion is far worse than even I had initially deduced. A deeper analysis of the numbers reveals that Greece’s larg-est banks include deferred tax assets as part of total equity in their financial statements. Deferred tax assets are cre-ated when banks are allowed to declare their losses at a later time, thereby reducing tax liabilities. This is prob-lematic because these deferred tax assets are really just “phantom assets” in the sense that these credits cannot be used (read: worthless) if the Greek banks continue to op-erate at a pretax loss.
Similar to its neighbors – Portugal, Spain, and Italy –Greece provides significant state support to its banks by offering credit for loss deductions for taxable future prof-its. For the four largest banks, this type of support made up 38 – 61 percent of total equity (see Figure 5).
Adjusting the Texas Ratio to account for the phantom as-sets yields much higher ratios. These indicate significantly higher risk of bank failures, barring a capital injection (see Figure 6).
Another Greek debt default is just around the corner. And given that money dominates, the specter of an economic collapse is not out of the question.
Figure 5: Deferred Income Tax Assets as a Percentage of Total Equity
Source: Bloomberg. Calculations by Prof. Steve H. Hanke. The Johns Hopkins University.Note: Deferred income tax assets are reported in the accumulated other comprehensive income component of capital equity.
Bank Year Percentage
National Bank of Greece 2014 38.40 %
Piraeus Bank 2014 54.90 %
Alpha Bank 2014 47.90 %
Eurobank Ergasias 2014 61.80 %
Figure 6: Adjusted Texas Ratios for the Largest Greek Banks
Source: Bloomberg. Calculations by Prof. Steve H. Hanke. The Johns Hopkins University.
Texas ratio formula:
(Bank non-performing assets and loans)(Total equity + Reserve for loan losses)
Adjusted Texas ratio formula:(Bank non-performing assets and loans)
((Total equity – Deferred income tax assets) + Reserve for loan losses)
Bank Year Texas Ratio Adjusted Texas Ratio
National Bank of Greece 2014 98.70 % 122.00 %
Piraeus Bank 2014 195.10 % 265.50 %
Alpha Bank 2014 129.40 % 166.60 %
Eurobank Ergasias 2014 124.70 % 164.70 %
P A G E5 3

RESILIENCEoil pricesFALLING
diversificationoil sector facing more difficult
REFINANCING CONDITIONSSOLID EXPANSIONin nonhydro-carbon a c t i v i t i e s
STRONG GDP
RISKSMANAGING
SUSTAIN GROWTHDIVERSIFIED, COMPETITIVE INCLUSIVE
ECONOMY&
T H E S T E R N S T E W A R T I N S T I T U T E P E R I O D I C A L # 1 2A B D U L L A H S A U D A L - T H A N I : Q A T A R ’ S R E S I L I E N C E T O F A L L I N G O I L P R I C E S
P A G E5 4

Qatar’s Resilience to Falling Oil Prices – A Welcome Support for Diversification
The sharp fall in crude oil prices and slower-than-pro-jected global growth have substantially altered the eco-nomic context for countries in the Middle East and North Africa. While lower oil prices have weakened the external and fiscal balances of oil exporters, including members of the Gulf Co-operation Council, it provides much needed breathing space for oil importers in terms of reduced oil import bills and lower energy subsidy bills.
Against this backdrop, stock markets in GCC countries declined sharply in late 2014. Energy-related firms and banks with large exposure to the oil sector are facing more difficult refinancing conditions. Capital flows to the GCC have slowed, though they remain broadly in line with trends for other emerging markets.
Consequently, most GCC countries have revised their near-term economic growth downward. However, large buffers in the form of foreign assets and available financ-ing should allow most GCC oil exporters to avoid sharp cuts in government spending, limiting the impact on near-term growth and financial stability.
STRONG GDP
Despite a fall of over 55 percent in global crude oil prices between June 2014 and January 2015, reflecting weak de-mand and ample supply, Qatar has maintained strong GDP growth at about 6 percent over the past two years, driven by double-digit growth in the non-hydrocarbon sector. The large public investment spending to diversify
T H E A U T H O R
Abdullah Saud Al-ThaniGovernorQatar Central Bank
KUWAIT
BAHRAINQATAR
UAE OMAN
SAUDI ARABIA
Gulf Co-operation CouncilEstablished in 1981, Six Member States
P A G E5 5

T H E S T E R N S T E W A R T I N S T I T U T E P E R I O D I C A L # 1 2A B D U L L A H S A U D A L - T H A N I : Q A T A R ’ S R E S I L I E N C E T O F A L L I N G O I L P R I C E S
the economy and prepare for the FIFA World Cup 2022 has resulted in a significant inflow of the expatriate popu-lation, adding to aggregate demand and supporting growth. Falling global commodity prices have helped contain inflation.
The budget continues to post surpluses and growth is ex-pected to accelerate in 2015 reflecting solid expansion in nonhydrocarbon activities propelled by investment spending, expansionary fiscal policy and population growth.
Despite its reliance on hydrocarbon exports, Qatar may not be affected as severely as expected by the oil price fall, given the dominance of liquefied natural gas in hydrocar-bon exports and relatively lower decline in global LNG prices, which were down only by 10 – 35 percent in the June-January period. LNG prices in the Asian market, which is the most relevant for Qatar given its dominant share in exports, fell only 14 percent over the same period. Qatar’s LNG exports are expected to increase somewhat when production from the Barzan gas plant comes on stream in 2015. Moreover, global crude oil prices are pro-jected to recover in 2015 and stabilize, which should have a steadying impact on gas prices.
P A G E5 6

T H E S T E R N S T E W A R T I N S T I T U T E P E R I O D I C A L # 1 2A B D U L L A H S A U D A L - T H A N I : Q A T A R ’ S R E S I L I E N C E T O F A L L I N G O I L P R I C E S
MANAGING RISKS
How this works depends on the links between the world economy and oil demand, subject to multiple risks. An-other risk lies in falling investment spending by oil com-panies, which could begin to have an impact on produc-tion by 2016 – 2017, adding upward pressure to prices as the supply glut is cleared.
Mindful of the risks associated with falling oil prices, in-cluding related financial sector vulnerabilities, the Qatari authorities have taken steps to prioritize public invest-ment while raising efficiency.
The Qatar Central Bank for its part is actively managing systemic liquidity, closely monitoring emerging risks to the financial system, and implementing macroprudential measures to sustain growth while maintaining price and financial stability.
So far, the banking sector continues to be resilient despite the fall in global oil prices and associated uncertainties. This reflects strong macroeconomic performance as well as sound policies. The total assets of the banking system continue to grow robustly, driven by credit to the private sector and a rise in Islamic finance.
As of December 2014, credit quality improved, with Tier I capital ratio well above the regulatory minimum required under the Basel III framework and the non-performing loan ratio falling below 2 percent. Profitability levels re-mained high with return on assets above 2 percent.
If lower oil prices persist for a prolonged period, most GCC countries may need to reassess medium-term spending plans. Some countries that do not have signifi-cant buffers or borrowing capacity will need to adjust more quickly, with adverse consequences for growth. In all oil-exporting countries, deepening reforms aimed at
diversifying economies away from oil, and encouraging growth and job creation, would help mitigate any adverse effects of fiscal consolidation on growth. In reference to my previous OMFIF Bulletin article in November 2013, “Wide range of Gulf influence: A region that looks be-yond oil and gas”, I can only repeat that lower oil prices emphasize the need for GCC countries to speed up their structural reforms. The objective must be to propel pri-vate sector activity and foster a diversified, competitive and inclusive economy.
DIVERSIFIED ECONOMY
In the case of Qatar’s economy, nonhydrocarbons sector growth is significant. This led to GDP growth in 2014. The development of a diversified and more resilient econ-omy is at the core of the QCB’s Strategic Plan for Financial Sector Regulation 2013 – 2016.
As envisaged in the strategic plan and conforming to in-ternational standards, QCB has been moving to risk-based regulation, expanding macroprudential oversight, enhancing transparency, strengthening market infra-structure, and improving consumer and investor protec-tion.
Progress achieved under the QCB’s regulatory agenda has opened up the financial market as part of steps to develop the financial industry and to provide a stable environ-ment to a broad range of businesses.
Other supportive influences include Qatar’s upgrading to emerging market status by leading rating agencies, an in-crease in foreign investors’ activity, and more recently the establishment of Qatar as the region’s first renminbi clear-ing centre.
The full article is published in the OMFIF Bulletin. www.omfif.org
P A G E5 7

About this publicationThe Stern Stewart Institute’s Periodical
12th Edition, June 2015Published half-yearly
Board of The Stern Stewart InstituteMarkus Pertl Gerhard Nenning
Chief EditorGerhard Nenning
Editorial ProductionAnja Deucker
Design Production and ArtworkKW NEUN Grafikagentur
PrintingIndustrie-Druck Haas
The opinions, beliefs, and viewpoints expressed by the various authors in this publication do not necessarily reflect the opinions, beliefs, and viewpoints of the editorial staff or of The Stern Stewart Institute. The publisher accepts no responsibility for errors, omissions, or the consequences thereof.
The Stern Stewart Institute e.V.
1330 Avenue of the AmericasSuite 23New York, NY 10019United StatesT +1 212 653 0636F +1 212 653 0635 E [email protected]
Salvatorplatz 480333 MunichGermanyT +49 89 242071 0F +49 89 242071 11E [email protected]
sternstewartinstitute.comtssi.org


The Stern Stewart Institute periodical #12 // June 2015 // W
hen Barbarians are at the gate: Managing for disruptive innovation…
#12
J U N E 2 0 1 5
IN THIS ISSUE
Abdullah Saud Al-ThaniGovernor, Qatar Central Bank
Dr. Roland BuschMember of the Managing Board, Siemens AG
Prof. Dr. Steve H. HankeBoard Member, The Stern Stewart Institute, Economist, The Johns Hopkins University
Matthias HartmannCEO, GfK
Carsten KnobelMember of the Management Board and Chief Financial Officer, Henkel AG & Co. KGaA
Dr. Klaus PatzakChief Financial Officer, OSRAM Licht AG
Dr. Till ReuterCEO, KUKA AG
Stephan SchulzCFO, Paul Hartmann AG
PLUS: SNAPSHOT OF THE FINANCIAL INSTITUTION’S MAIN CHALLENGES
…AND INSIGHTS INTO THE STERN STEWART INSTITUTE’S LITERACY PROGRAM IN BURKINA FASO
When Barbarians Are at the Gate:Managing for Disruptive Innovation…