platinum group metals | waterberg pgm project...
TRANSCRIPT
PLG: NYSE AMERICAN | PTM: TSX
PLATINUM GROUP METALS | WATERBERG PGM PROJECT
WATERBERGPGM PROJECTCorporate Presentation
May 17, 2018
Drilling at Waterberg PGM Discovery
PLG: NYSE AMERICAN | PTM: TSX
PLG: NYSE AMERICAN | PTM: TSX
PLATINUM GROUP METALS | WATERBERG PGM PROJECT
DISCLOSURE
1
TECHNICAL AND SCIENTIFIC INFORMATIONThis presentation has been prepared by PlatinumGroup Metals Ltd. (“Platinum Group” or the“Company”). Information included in thispresentation regarding the Company’s mineralproperties has been compiled by R. Michael Jones,P.Eng, the President and Chief Executive Officer ofthe Company, and a non-independent QualifiedPerson for purposes of National Instrument 43-101- Standards of Disclosure for Mineral Projects (“NI43-101”), based on independent technical reports,and other information filed by the Company withthe Canadian securities regulators and the U.S.Securities and Exchange Commission (“SEC”). R.Michael Jones, the QP who has compiled thetechnical info for the presentation, has approvedthe written disclosure regarding technical andscientific information in this presentation. Formore detailed information regarding the Companyand its mineral properties, you should refer to theCompany’s independent technical reports andother filings with the Canadian securitiesregulators and the SEC, which are available atwww.sedar.com and www.sec.gov, respectively.Scientific and technical information containedherein is derived from the Company’s technicalreports. Scientific or technical informationcontained herein related to the Waterberg Projectcan be found in the October 19, 2016 technicalreport titled “Independent Technical Report on theWaterberg Project Including Mineral ResourceUpdate and Pre-Feasibility Study” and filed onwww.sedar.com and www.sec.gov. Reference is
made to such reports for more detailedinformation with respect to the Company’sproperties, including details of quality and grade ofeach mineral reserve and mineral resourceestimate, details of the key assumptions, methodsand parameters used in the mineral reserve andmineral resource estimates and a generaldiscussion of the extent to which the mineralreserve and mineral resource estimates and theother estimates and projections included in thereports may be materially affected by any knownenvironmental, permitting, legal, taxation, socio-political, marketing, or other relevant issues.CAUTIONARY NOTE TO UNITED STATESINVESTORSEstimates of mineralization and other technicalinformation included or referenced in thispresentation have been prepared in accordancewith NI 43-101. The definitions of proven andprobable reserves used in NI 43-101 differ from thedefinitions in SEC Industry Guide 7. Under SECIndustry Guide 7 standards, a "final" or "bankable"feasibility study is required to report reserves, thethree-year historical average price is used in anyreserve or cash-flow analysis to designate reservesand the primary environmental analysis or thereport must be filed with the appropriategovernmental authority. As a result, the reservesreported by the Company in accordance with NI43-101 may not qualify as "reserves" under SECstandards. In addition, the terms "mineralresource", "measured mineral resource","indicated mineral resource" and "inferred mineral
resource" are defined in and required to bedisclosed by NI 43-101; however, these terms arenot defined terms under SEC Industry Guide 7 andnormally are not permitted to be used in reportsand registration statements filed with the SEC.Mineral resources that are not mineral reserves donot have demonstrated economic viability.Investors are cautioned not to assume that anypart or all of the mineral deposits in thesecategories will ever be converted into reserves;"inferred mineral resources" have a great amountof uncertainty as to their existence, and greatuncertainty as to their economic and legalfeasibility. It cannot be assumed that all or any partof an inferred mineral resource will ever beupgraded to a higher category. Under Canadiansecurities laws, estimates of inferred mineralresources may not form the basis of feasibility orpre-feasibility studies, except in rare cases.Additionally, disclosure of "contained ounces" in aresource is permitted disclosure under Canadiansecurities laws; however, the SEC normally onlypermits issuers to report mineralization that doesnot constitute "reserves" by SEC standards as inplace tonnage and grade without reference to unitmeasurements. Accordingly, informationcontained or referenced in this presentationcontaining descriptions of the Company's mineraldeposits may not be comparable to similarinformation made public by U.S. companiessubject to the reporting and disclosurerequirements of United States federal securitieslaws and the rules and regulations thereunder.

PLG: NYSE AMERICAN | PTM: TSX
PLATINUM GROUP METALS | WATERBERG PGM PROJECT
FORWARD LOOKING STATEMENTS
2
This presentation contains forward-lookinginformation within the meaning of Canadiansecurities laws and forward-looking statementswithin the meaning of U.S. securities laws(collectively “forward-looking statements”).Forward-looking statements are typically identifiedby words such as: believe, expect, anticipate,intend, estimate, plans, postulate and similarexpressions, or are those, which, by their nature,refer to future events. All statements that are notstatements of historical fact are forward-lookingstatements. Forward-looking statements in thispresentation include, without limitation,statements regarding Step 2 of the Maseve SaleTransaction and the value of the consideration tobe received; potential funding sources; futuredemand for metals and other products; thepotential exercise of Implats’ earn in with respectto the Waterberg Project; potential settlement orrestructure of the Company’s secured debts;potential sales of assets, debt or equity; theCompany’s ability to obtain further funding;corporate and asset level strategic alternatives; thepotential economics of the Waterberg Project, ifdeveloped; the Waterberg Project’s concentratebeing amenable to existing smelters; theCompany’s key objectives; market projections forthe Company’s products; including without
limitation the growth in demand in connectionwith China 6 emissions regulations; the completionof the definitive feasibility study for the WaterbergProject by early 2019 and commencement ofconstruction thereafter; and the Company’s plansand estimates regarding exploration, studies,development, construction, production, cash flowsand other activities and developments. Statementsof mineral resources and mineral reserves alsoconstitute forward looking statements to theextent they represent estimates of mineralizationthat will be encountered on a property and/orestimates regarding future costs, revenues andother matters. Although the Company believes theforward-looking statements in this presentationare reasonable, it can give no assurance that theexpectations and assumptions in such statementswill prove to be correct. The Company cautionsinvestors that any forward-looking statements bythe Company are not guarantees of future resultsor performance and that actual results may differmaterially from those in forward-lookingstatements as a result of various factors, includingrisks related to indebtedness; risks related to thenature of the Implats Transaction agreements; theCompany’s capital requirements may exceed itscurrent expectations; the uncertainty of cost,operational and economic projections; the ability
of the Company to negotiate and complete futurefunding transactions and settlement or restructureof debt; variations in market conditions; thenature, quality and quantity of any mineraldeposits that may be located; metal prices; otherprices and costs; currency exchange rates; theCompany’s ability to obtain any necessary permits,consents or authorizations required for itsactivities and to effect the Implats Transaction; theCompany’s ability to produce minerals from itsproperties successfully or profitably, to continueits projected growth, or to be fully able toimplement its business strategies; risks related tocontractor performance and labor disruptions; andother risk factors described in the Company’s Form20-F annual report, annual information form andother filings with the Securities and ExchangeCommission and Canadian securities regulators,which may be viewed at www.sec.gov andwww.sedar.com, respectively. Proposed changes inthe mineral law in South Africa if implemented asproposed would have a material adverse effect onthe Company business and potential interest inprojects.

PLG: NYSE AMERICAN | PTM: TSX
PLATINUM GROUP METALS | WATERBERG PGM PROJECT
A PGM Exploration and Development Company Focused on Low-Cost Bulk Mechanized Mining
OVERVIEWOF PLATINUM GROUP METALS LTD.
3
• Waterberg Project - large scale palladium and platinum
reserves in South Africa.
• Waterberg 2016 pre-feasibility study confirms potential for
a large, low cash cost per ounce PGM mine.
• Impala Platinum Ltd. (IMP:JSE) purchased 15% of
Waterberg PGM Project for US$30M including a right
of first refusal for concentrate offtake.
• Implats acquired an option to increase its stake to a
50.01% controlling interest through additional
payments totaling US$166M with an agreement to
confirm project finance plan.
• Hosken Consolidated Investments Ltd. (HCI:JSE)
recently acquired a 14% equity stake in PTM.
• Palladium market in fundamental deficit with strong
demand and limited mine supply growth – Waterberg
highly geared to palladium price.
• Sale of Maseve Mine to Royal Bafokeng Platinum Ltd.
completed.
PLG: NYSE MKT | PTM: TSX
PLATINUM GROUP METALS | WATERBERG PGM PROJECT
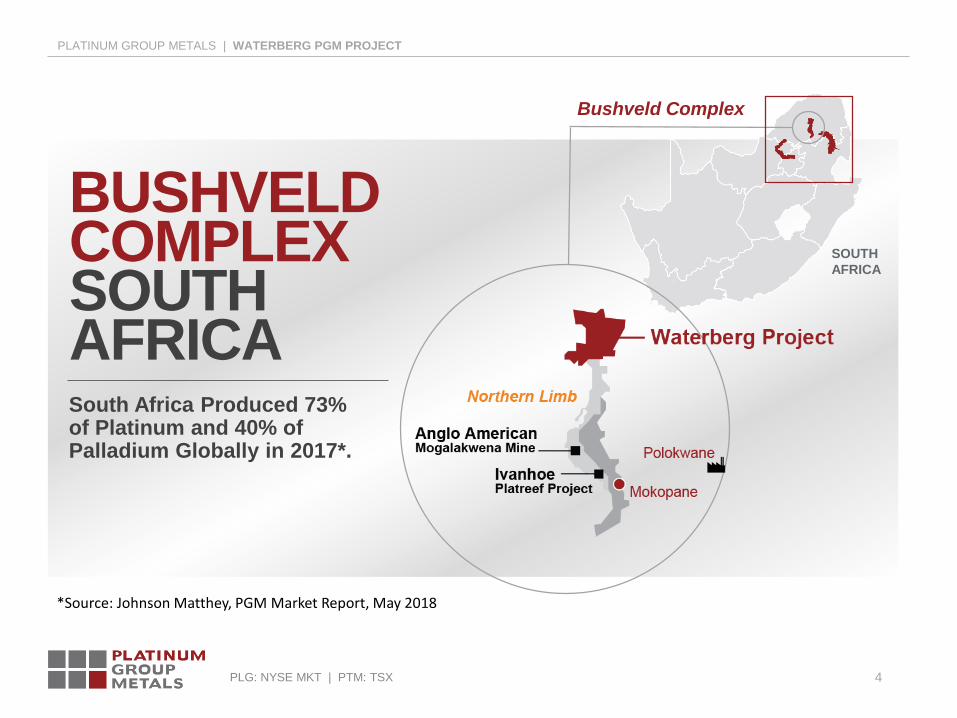
BUSHVELD COMPLEXSOUTH AFRICASouth Africa Produced 73% of Platinum and 40% of Palladium Globally in 2017*.
Bushveld Complex
SOUTH
AFRICA
4
*Source: Johnson Matthey, PGM Market Report, May 2018
PLG: NYSE AMERICAN | PTM: TSX
PLATINUM GROUP METALS | WATERBERG PGM PROJECT
5
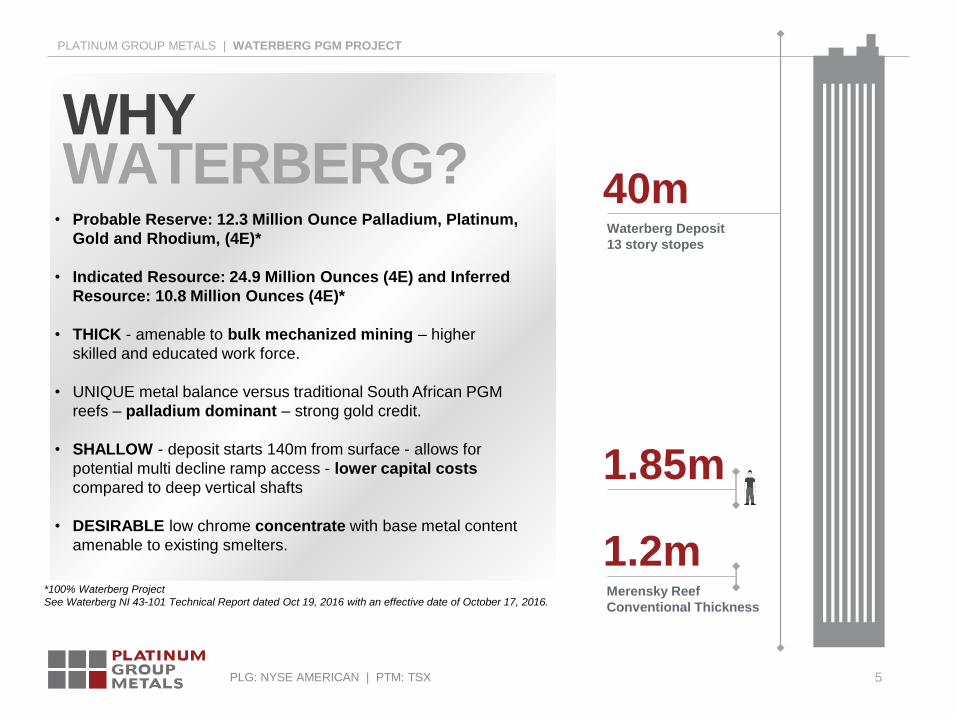
WHYWATERBERG?
• Probable Reserve: 12.3 Million Ounce Palladium, Platinum,
Gold and Rhodium, (4E)*
• Indicated Resource: 24.9 Million Ounces (4E) and Inferred
Resource: 10.8 Million Ounces (4E)*
• THICK - amenable to bulk mechanized mining – higher
skilled and educated work force.
• UNIQUE metal balance versus traditional South African PGM
reefs – palladium dominant – strong gold credit.
• SHALLOW - deposit starts 140m from surface - allows for
potential multi decline ramp access - lower capital costs
compared to deep vertical shafts
• DESIRABLE low chrome concentrate with base metal content
amenable to existing smelters.
Waterberg Deposit
13 story stopes
40m
1.85m
Merensky Reef
Conventional Thickness
1.2m*100% Waterberg Project
See Waterberg NI 43-101 Technical Report dated Oct 19, 2016 with an effective date of October 17, 2016.
PLG: NYSE AMERICAN | PTM: TSX
PLATINUM GROUP METALS | WATERBERG PGM PROJECT
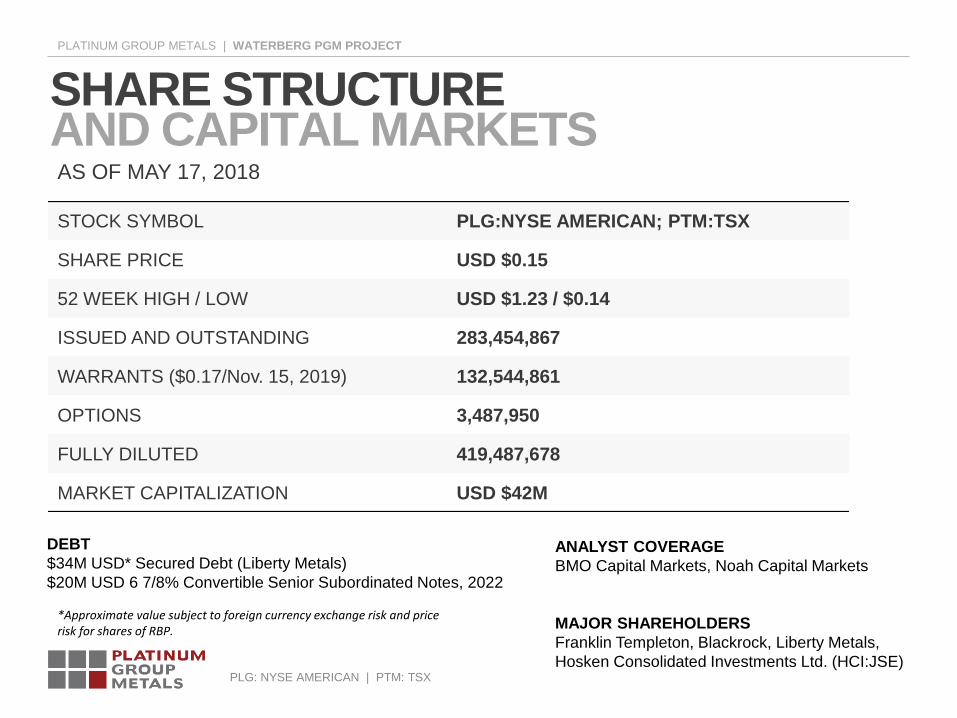
SHARE STRUCTUREAND CAPITAL MARKETS
DEBT
$34M USD* Secured Debt (Liberty Metals)
$20M USD 6 7/8% Convertible Senior Subordinated Notes, 2022
STOCK SYMBOL PLG:NYSE AMERICAN; PTM:TSX
SHARE PRICE USD $0.15
52 WEEK HIGH / LOW USD $1.23 / $0.14
ISSUED AND OUTSTANDING 283,454,867
WARRANTS ($0.17/Nov. 15, 2019) 132,544,861
OPTIONS 3,487,950
FULLY DILUTED 419,487,678
MARKET CAPITALIZATION USD $42M
ANALYST COVERAGE
BMO Capital Markets, Noah Capital Markets
MAJOR SHAREHOLDERS
Franklin Templeton, Blackrock, Liberty Metals,
Hosken Consolidated Investments Ltd. (HCI:JSE)
AS OF MAY 17, 2018
*Approximate value subject to foreign currency exchange risk and price risk for shares of RBP.
PLG: NYSE AMERICAN | PTM: TSX
PLATINUM GROUP METALS | WATERBERG PGM PROJECT
7
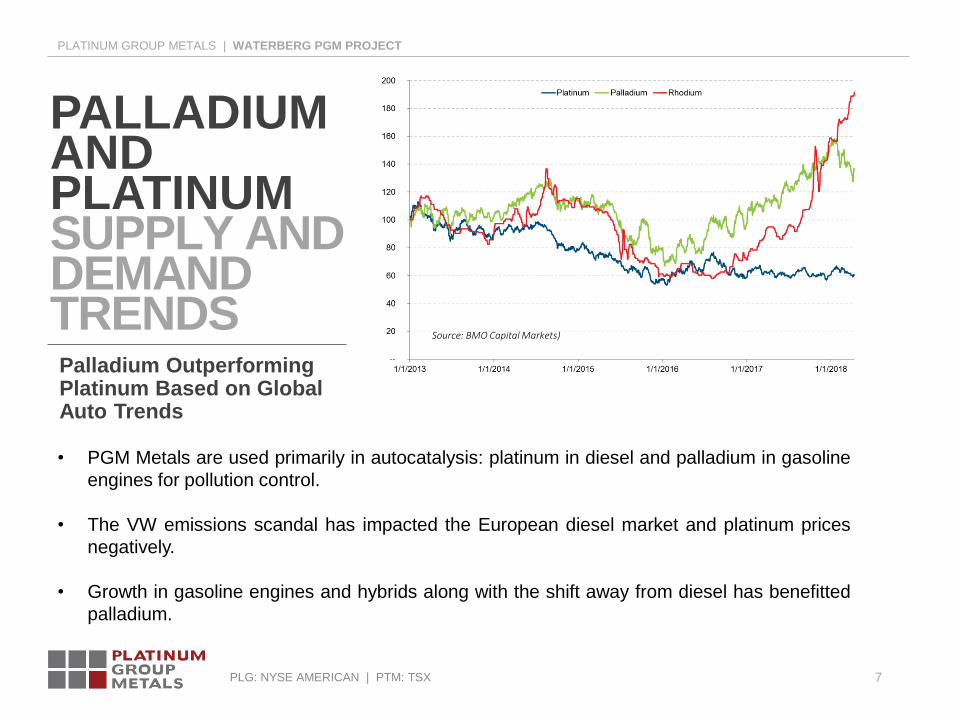
PALLADIUM AND PLATINUMSUPPLY ANDDEMAND TRENDSPalladium Outperforming Platinum Based on Global Auto Trends
• PGM Metals are used primarily in autocatalysis: platinum in diesel and palladium in gasoline
engines for pollution control.
• The VW emissions scandal has impacted the European diesel market and platinum prices
negatively.
• Growth in gasoline engines and hybrids along with the shift away from diesel has benefitted
palladium.
Source: BMO Capital Markets)
PLG: NYSE MKT | PTM: TSX
PLATINUM GROUP METALS | WATERBERG PGM PROJECT
8
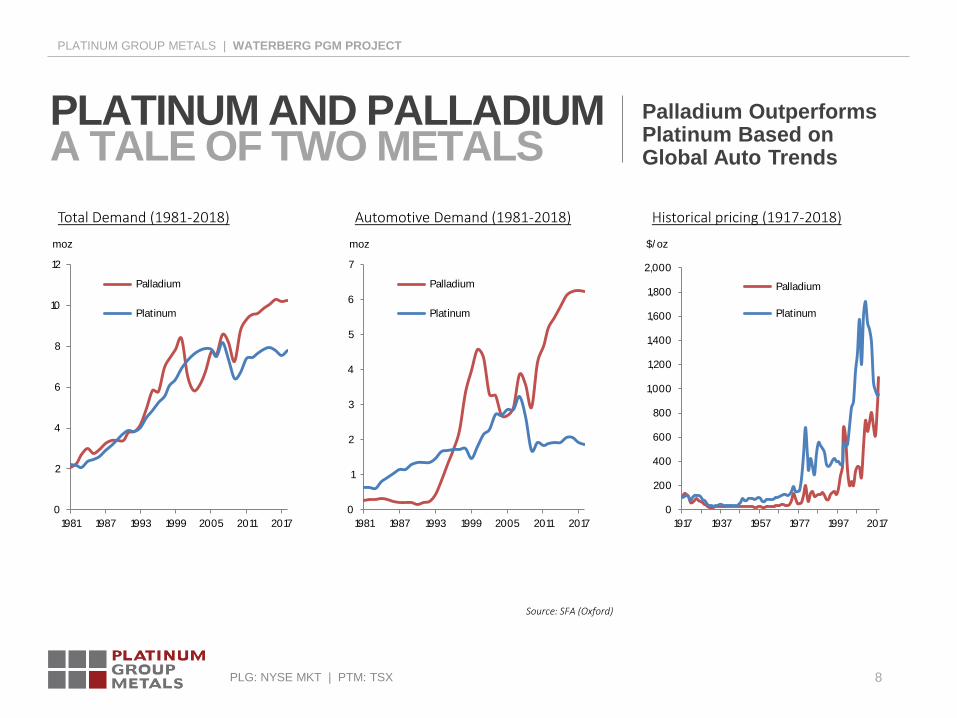
PLATINUM AND PALLADIUMA TALE OF TWO METALS
Palladium Outperforms Platinum Based on Global Auto Trends
0
2
4
6
8
10
12
1981 1987 1993 1999 2005 2011 2017
moz
Palladium
Platinum
Total Demand (1981-2018)
0
1
2
3
4
5
6
7
1981 1987 1993 1999 2005 2011 2017
moz
Palladium
Platinum
Automotive Demand (1981-2018)
0
200
400
600
800
1,000
1,200
1,400
1,600
1,800
2,000
1917 1937 1957 1977 1997 2017
$/ oz
Palladium
Platinum
Historical pricing (1917-2018)
Source: SFA (Oxford)

PLG: NYSE MKT | PTM: TSX
PLATINUM GROUP METALS | WATERBERG PGM PROJECT
9
PALLADIUMSUPPLY AND DEMAND SUMMARY

PLG: NYSE AMERICAN | PTM: TSX
PLATINUM GROUP METALS | WATERBERG PGM PROJECT
CHINA 6 EMISSIONS LEGISLATION - 2020GROWTH IN PALLADIUM DEMAND
10
China 6 emissions legislation is expected to create an additional 1M+ ounces of palladium demand annually starting in 2020.
Source: BASF
PLG: NYSE AMERICAN | PTM: TSX
PLATINUM GROUP METALS | WATERBERG PGM PROJECT
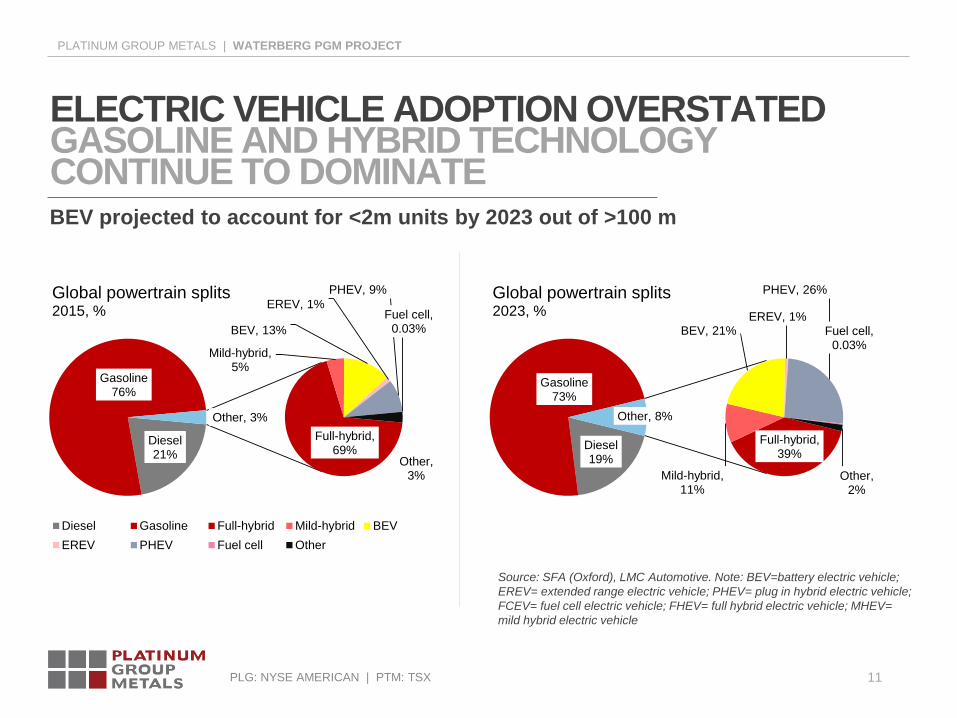
ELECTRIC VEHICLE ADOPTION OVERSTATEDGASOLINE AND HYBRID TECHNOLOGY CONTINUE TO DOMINATE
11
Diesel21%
Gasoline76%
Full-hybrid, 69%
Mild-hybrid, 5%
BEV, 13%
EREV, 1%
PHEV, 9%
Fuel cell, 0.03%
Other, 3%
Other, 3%
Global powertrain splits 2015, %
Diesel Gasoline Full-hybrid Mild-hybrid BEV
EREV PHEV Fuel cell Other
Diesel19%
Gasoline73%
Full-hybrid, 39%
Mild-hybrid, 11%
BEV, 21%EREV, 1%
PHEV, 26%
Fuel cell, 0.03%
Other, 2%
Other, 8%
Global powertrain splits2023, %
BEV projected to account for <2m units by 2023 out of >100 m
Source: SFA (Oxford), LMC Automotive. Note: BEV=battery electric vehicle;
EREV= extended range electric vehicle; PHEV= plug in hybrid electric vehicle;
FCEV= fuel cell electric vehicle; FHEV= full hybrid electric vehicle; MHEV=
mild hybrid electric vehicle

PLG: NYSE AMERICAN | PTM: TSX
PLATINUM GROUP METALS | WATERBERG PGM PROJECT
12
IMPALASTRATEGIC INVESTMENT
Implats Investment Provides Mine to Market Roadmap for the Waterberg Project
• Implats purchased 15% of Waterberg for US$30M in cash. Acquires right of first refusal for concentrate offtake.
• Implats acquired option to make Acquisition and Development Commitment for an additional US$166M earning a
50.01% controlling interest after DFS completion. Impala to confirm project finance terms post Development
Commitment.
• Leverages operating expertise. Impala is the world’s second largest producer of platinum with decades of
operating experience, community development and government relations.
• Low-risk development approach. Impala’s operating expertise and funding capabilities will provide efficient
capital options for the development of the Waterberg project.
• Downstream solution. Impala is an integrated producer with smelting, refining and marketing capabilities
providing a mine to market roadmap.
PLG: NYSE AMERICAN | PTM: TSX
PLATINUM GROUP METALS | WATERBERG PGM PROJECT
13
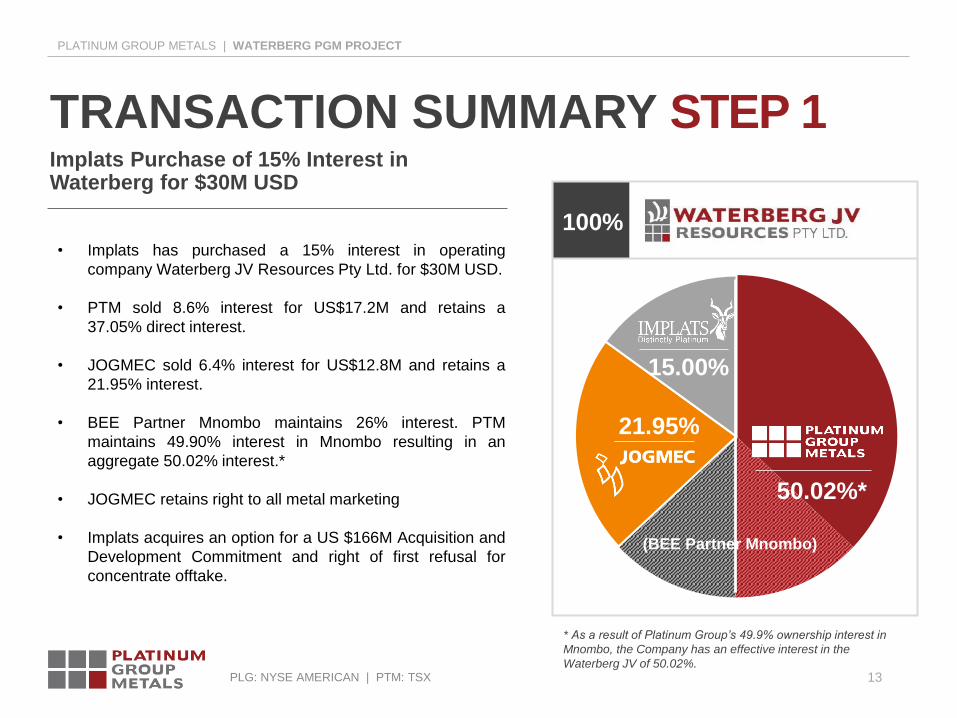
TRANSACTION SUMMARY STEP 1
• Implats has purchased a 15% interest in operating
company Waterberg JV Resources Pty Ltd. for $30M USD.
• PTM sold 8.6% interest for US$17.2M and retains a
37.05% direct interest.
• JOGMEC sold 6.4% interest for US$12.8M and retains a
21.95% interest.
• BEE Partner Mnombo maintains 26% interest. PTM
maintains 49.90% interest in Mnombo resulting in an
aggregate 50.02% interest.*
• JOGMEC retains right to all metal marketing
• Implats acquires an option for a US $166M Acquisition and
Development Commitment and right of first refusal for
concentrate offtake.
* As a result of Platinum Group’s 49.9% ownership interest in
Mnombo, the Company has an effective interest in the
Waterberg JV of 50.02%.
Sales
50.02%*
21.95%
15.00%
100%
(BEE Partner Mnombo)
Implats Purchase of 15% Interest in Waterberg for $30M USD

PLG: NYSE AMERICAN | PTM: TSX
PLATINUM GROUP METALS | WATERBERG PGM PROJECT
14
TRANSACTION SUMMARY STEP 2
• Upon completion of DFS Impala has an option to increase
ownership to 50.01% with a firm funded Acquisition and
Development Commitment.
• Purchase an additional 12.195% from JOGMEC for
US$34.8M.
• Acquire an additional 22.815% (4.755 from JOGMEC and
18.06% from PTM) by spending US$130M on project
development.
• BEE Partner Mnombo would maintain a 26% interest.
PTM holds a 49.90% interest in Mnombo resulting in an
aggregate 31.96% interest.*
• Broad Based Empowerment planned for fair value at
completion of Development Commitment.
• Implats to confirm specific terms of project financing upon
completion of Development Commitment.
Upon DFS Completion Implats Can Increase Stake to 50.01% for US$166M
*As a result of Platinum Group’s 49.9% ownership interest in
Mnombo the Company would have an effective interest in the
Waterberg JV of 31.96%
Sales
31.96%*
50.01%
100%
(BEE Partner
Mnombo)
5%

PLG: NYSE AMERICAN | PTM: TSX
PLATINUM GROUP METALS | WATERBERG PGM PROJECT
15
SCALE WITHGROWTH POTENTIAL
3D Contour Model: Five Defined Initial Mining Areas Thick and Shallow

PLG: NYSE MKT | PTM: TSX
PLATINUM GROUP METALS | WATERBERG PGM PROJECT
16
SCALE WITHGROWTH POTENTIAL
• Existing known deposit extends for 13km and is
open along strike going North and at depth.
• Current drilling targeting open, up dip “Super F”
zones and thickening “T” Zone in the south.
• Focus on areas 30m+ in thickness at depths less
than 200m from surface.
• Thick, shallow “Super F” zones will have
important mine plan implications.
• Potential for “Super T” zones in the southern
portion of the ore body.
Extensive Land Package with Potential 30km+ Strike Length
50.02%*
21.95%
15.00%
100%
PLG: NYSE MKT | PTM: TSX
PLATINUM GROUP METALS | WATERBERG PGM PROJECT
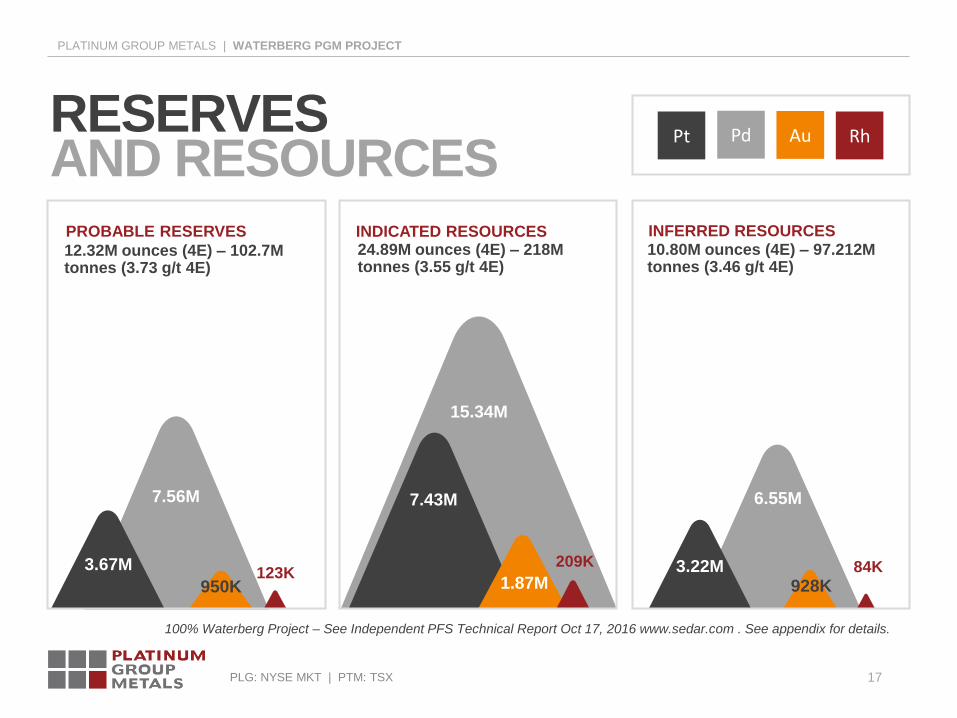
3.22M
6.55M
928K84K
7.43M
15.34M
1.87M
209K
17
12.32M ounces (4E) – 102.7M tonnes (3.73 g/t 4E)
RESERVESAND RESOURCES
3.67M
7.56M
950K123K
PROBABLE RESERVES INDICATED RESOURCES24.89M ounces (4E) – 218M tonnes (3.55 g/t 4E)
INFERRED RESOURCES10.80M ounces (4E) – 97.212M tonnes (3.46 g/t 4E)
RhPt Pd Au
100% Waterberg Project – See Independent PFS Technical Report Oct 17, 2016 www.sedar.com . See appendix for details.

PLG: NYSE AMERICAN | PTM: TSX
PLATINUM GROUP METALS | WATERBERG PGM PROJECT
18
2016 PRE-FEASIBILITY STUDY HIGHLIGHTS
PROBABLE RESERVES 12.3M OZS 4E (103Mt @3.73 g/t 4E)
INDICATED RESOURCES 24.9M OZS 4E (218Mt @ 3.55 g/t 4E)
INFERRED RESOURCES 10.80M OZS 4E (97Mt @ 3.46 g/t 4E)
BASE METALS Cu: 181 Mlb @ 0.08%, Ni: 333 Mlb @ 0.15%
STEADY STATE PRODUCTION 744K Ounces/Year 4E + 23 Mlb Cu/Ni
METAL SPLIT Pd 61%, Pt 30%, Au 8%, Rh 1%
TOTAL CASH COST $481 USD/4E Ounce
NPV 8% POST TAX $507M USD
IRR POST TAX 16.30%
PEAK FUNDING $914M USD
MINE LIFE 19 YEARS
IRR and NPV Based on Investment Bank Consensus USD Prices: Pd $800, Pt $1,213, Au $1,300, Rh $1,000, 15ZAR/USD
Reserves and Resources Based on Three Year Trailing USD Prices: Pd $710, Pt $1,212, Au $1,229, Rh $984, 15ZAR/USD
100% Waterberg Project. See Waterberg NI 43-101 Technical Report dated Oct 19, 2016 with an effective date of October 17, 2016.
DFS in progress which will update timing and results. Total cash costs presented net of copper and nickel by-product credits
Mineral resources that are not mineral reserves do not have demonstrated viability.

PLG: NYSE AMERICAN | PTM: TSX
PLATINUM GROUP METALS | WATERBERG PGM PROJECT
METAL PRICE SENSITIVITY
The Waterberg PGM Project is Highly Geared to the Price of Palladium.
• The Waterberg basket price has been up as much as 20% at times since the 2016 PFS from $904 to
$1093 driven by a 50% increase in the price of palladium from $710 to $1,100. Palladium has been
volatile.
• At a 20% increase in the basket price results in a post tax IRR increase from 13.5% to 20% and the
NPV8 increases from $320M to $790M. (Independent Technical Report PFS)
Parameter Change in
Parameter Change in
Parameter Change in
Parameter Change in
Parameter Change in
Parameter
Metal Prices IRR (post-tax)
NPV (8% Discount) (R000) NPV (8% Discount) ($000)
-20% 5%
-2,467 -164
-10% 10%
1,211 67
0% 13.5%
4,805 320
10% 17%
8,344 556
20% 20%
11,854 790
Head Grade IRR (post-tax) NPV (8% Discount) (R000)
NPV (8% Discount) ($000)
-20% 6%
-1,513
-101
-10% 10%
1,562
104
0% 13.5% 4,805
320
10% 16%
7,562
504
20% 19%
10,505
700
Capex
IRR (post-tax) NPV (8% Discount) (R000) NPV (8% Discount) ($000)
-20%
17% 8,161
544
-10%
15% 6,484
432
0%
13.5% 4,805
320
10%
12% 3,109
207
20%
10% 1,395
93
Opex IRR (post-tax)
NPV (8% Discount) (R000) NPV (8% Discount) ($000)
-20% 18%
7,435 496
-10% 16%
6,121 408
0% 13.5%
4,805 320
10% 12%
3,246 216
20% 10%
2,124 14
IRR and NPV Based on 3-Year Trailing Average USD Prices (July 31, 2016): Pd $710, Pt $1,212, Au $1,229, Rh $984, 15ZAR/USD
100% Waterberg Project. DFS in progress which will update results.
See Waterberg NI 43-101 Technical Report dated Oct 19, 2016 with an effective date of October 17, 2016.
Mineral resources that are not mineral reserves do not have demonstrated economic viability.

PLG: NYSE AMERICAN | PTM: TSX
PLATINUM GROUP METALS | WATERBERG PGM PROJECT
20
Source: SFA (Oxford). Data for Waterberg is based on Platinum Group
projections and is not representative of SFA's view.
PGM INDUSTRYCOST CURVE
Shallow, Bulk Mining Translates to Low Cost

PLG: NYSE AMERICAN | PTM: TSX
PLATINUM GROUP METALS | WATERBERG PGM PROJECT
21
LABOURPRODUCTIVITY
Bulk Mining Methods Increase Productivity
100% Waterberg Project – See Independent PFS Technical Report Oct 17, 2016 www.sedar.com. See appendix for details.

PLG: NYSE MKT | PTM: TSX
PLATINUM GROUP METALS | WATERBERG PGM PROJECT
22
STILLWATERCOMPARISON
Waterberg Scale and Margin Rivals Stillwater Palladium Production
STILLWATER EAST BOULDER WATERBERG
2016 2016 PFS
OPERATING V PFS
ORE MILLED tonnes/day 1,954 1,755 20,000
PLANT HEAD GRADE oz/t 0.49 0.37 0.12
RECOVERIES 93% 90% 82%
ANNUAL PRODUCTION 000oz 327 218 744
CURRENT SPOT BASKET PRICE US$/oz 976 976 1,009
FINANCIAL RESULTS
TOTAL CASH COSTS $/PGM oz mined 437 441 481
GROSS MARGIN US$/oz 539 535 528
RESERVES
TONNES Mt 18.33 27.34 102.7
PGM OUNCES 2E v 4E (M) 10.47 10.73 12.3
See Independent PFS Technical Report Oct 17, 2016 www.sedar.com. See appendix for details.
Source: Company Reports

PLG: NYSE AMERICAN | PTM: TSX
PLATINUM GROUP METALS | WATERBERG PGM PROJECT
23
BASE METALCONTENTProjected Concentrate Amenable to Existing South African Smelters. Similar To Merensky Reef
0
0.05
0.1
0.15
0.2
0.25
0.3
0.35
MERENSKYREEF
UG2 REEF WATERBERGT REEF
WATERBERGF REEF
WATERBERGCOMBINED
PLATREEF
Ni% Cu%
.22
.12.1
.01
.08
.16 .16
.07
.15
.08
.32
.16
See Independent PFS Technical Report Oct 17, 2016 www.sedar.com. See appendix for details.

PLG: NYSE AMERICAN | PTM: TSX
PLATINUM GROUP METALS | WATERBERG PGM PROJECT
24
DEFINITIVEFEASIBILITYSTUDYImplats and Platinum Group Metals as the Operator Have Agreed the DFS Scope
• A joint owners team has been selected for the DFS
with two options being considered.
• Option 1: 600ktpm mining complex – the same size
as the current PFS. The PFS mining rate is 744,000
ounces 4E per year.
• Option 2: A 250ktpm – 350ktpm mining complex will
also be studied either as a standalone DFS or as an
alternative option within the 600ktpm DFS.
• The DFS will be completed in accordance with both
SAMREC (South Africa) and 43-101 (Canada)
standards.
• The DFS is expected to be completed by early 2019.
• Stantec Consulting International LLC and DRA
Projects SA (Proprietary) Limited have been selected
as the lead independent project engineers.
PLG: NYSE AMERICAN | PTM: TSX
PLATINUM GROUP METALS | WATERBERG PGM PROJECT
25
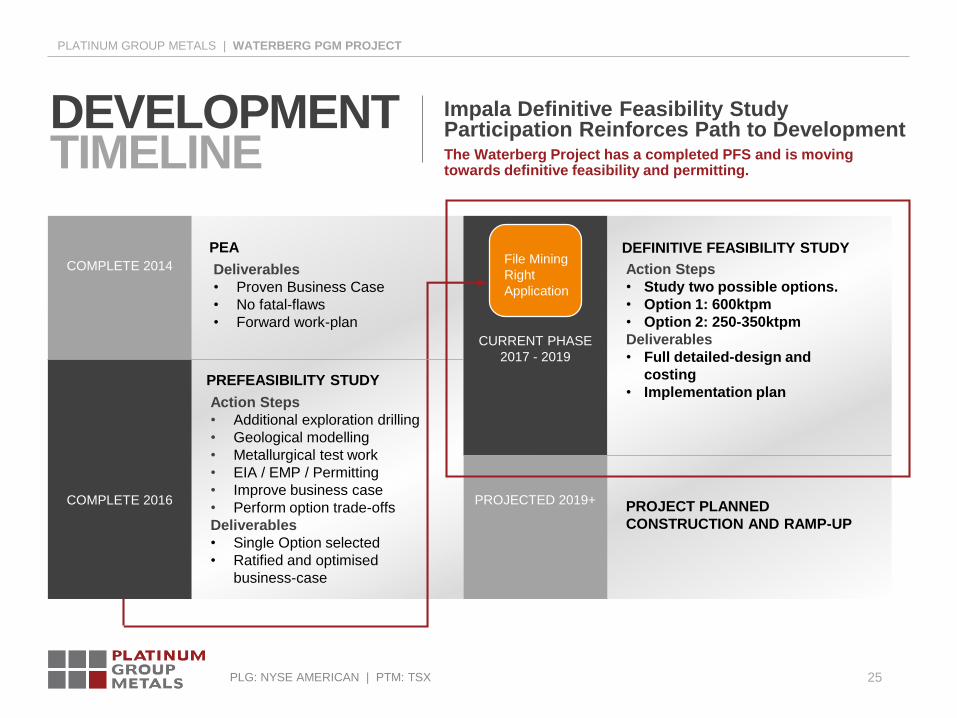
DEVELOPMENTTIMELINE
Impala Definitive Feasibility Study Participation Reinforces Path to Development
PEA
Deliverables
• Proven Business Case
• No fatal-flaws
• Forward work-plan
PREFEASIBILITY STUDY
Action Steps
• Additional exploration drilling
• Geological modelling
• Metallurgical test work
• EIA / EMP / Permitting
• Improve business case
• Perform option trade-offs
Deliverables
• Single Option selected
• Ratified and optimised
business-case
COMPLETE 2014
COMPLETE 2016
CURRENT PHASE
2017 - 2019
PROJECTED 2019+
DEFINITIVE FEASIBILITY STUDY
Action Steps
• Study two possible options.
• Option 1: 600ktpm
• Option 2: 250-350ktpm
Deliverables
• Full detailed-design and
costing
• Implementation plan
PROJECT PLANNED
CONSTRUCTION AND RAMP-UP
The Waterberg Project has a completed PFS and is moving towards definitive feasibility and permitting.
File Mining
Right
Application
PLG: NYSE AMERICAN | PTM: TSX
PLATINUM GROUP METALS | WATERBERG PGM PROJECT
26
HOSKEN CONSOLIDATED INVESTMENTS LTD. (HCI)
HCI is a South African black empowerment investment holding company listed on the JSE with a $1B+ USD market capitalization.
• HCI is involved in a diverse group of investments
including hotel and leisure; interactive gaming; media
and broadcasting; transport; mining; clothing; and
properties.
• HCI acquired a 14% stake in PTM following a
concurrent private placement and public offering in
May 2018.
• HCI became entitled to nominate one person to be
appointed to the board of directors of the Company
and has a right to participate in future equity
financings of the Company to maintain its pro-rata
interest.
• HCI’s nominee to the Company’s board of directors
is Mr. John Anthony Copelyn, B.A. [Hons] B.Proc.,
Chief Executive Officer of HCI.

PLG: NYSE AMERICAN | PTM: TSX
PLATINUM GROUP METALS | WATERBERG PGM PROJECT
27
Waterberg PGM Project – USD $30M investment
from Implats – the world’s second largest producer
of platinum.
CONCLUSIONSImplats Investment in Waterberg Provides Mine to Market Roadmap
Palladium Mine at an Important Time for the Commodity
01
Implats investment establishes a mine to market
roadmap with a potential US$196M investment,
offtake and project finance package for 50.01% stake.
Palladium outperformance reflects structural deficit
and highlights importance of Waterberg. China 6
emissions legislation a game changer.
Waterberg has the potential to be a large, low cost,
bulk mine near the bottom of the cost curve.
Definitive feasibility study underway.
02
03
04

PLG: NYSE MKT | PTM: TSX
PLATINUM GROUP METALS | WATERBERG PGM PROJECT
Reserves and Resources 2016 PFS Details
28
APPENDIX

PLG: NYSE MKT | PTM: TSX
PLATINUM GROUP METALS | WATERBERG PGM PROJECT
29
WATERBERG PROJECTRESERVES
Mineral Reserve Estimate October 17, 2016
PROBABLE MINERAL RESERVE AT 2.5 g/t 4E Cut-off – TONNAGE AND GRADES
ZONE MtCUT-OFF
GRADE (g/t)
Pt
(g/t)Pd (g/t) Au (g/t) Rh (g/t) 4E (g/t) Cu (%) Ni (%)
T-ZONE 16.5 2.5 1.14 1.93 0.83 0.04 3.94 0.16 0.08
F-ZONE 86.2 2.5 1.11 2.36 0.18 0.04 3.69 0.07 0.16
TOTAL 102.7 2.5 1.11 2.29 0.29 0.04 3.73 0.08 0.15
PROBABLE MINERAL RESERVE AT 2.5 g/t Cut-off – CONTAINED METAL
ZONE Mt Pt (Moz) Pd (Moz) Au (Moz) Rh (Moz) 4E (Moz)4E
CONTENT (kg)Cu (Mlb) Ni (Mlb)
T-ZONE 16.5 0.61 1.03 0.44 0.02 2.09 65,097 58.2129.10
F-ZONE 86.2 3.07 6.54 0.51 0.10 10.22 318,007 132.97 303.94
TOTAL 102.7 3.67 7.57 0.95 0.12 12.32 383,103 191.18 333.04
*100% Waterberg Project – See Independent PFS Technical Report Oct 17, 2016 www.sedar.com

PLG: NYSE MKT | PTM: TSX
PLATINUM GROUP METALS | WATERBERG PGM PROJECT
30
WATERBERG PGM PROJECTRESOURCES T-Zone and F-Zone Mineral Resource Estimate - October 17, 2016
T-ZONE 2.5 g/t CUT-OFF
RESOURCE CATEGORY
CUT-OFFTonnage
GRADE METAL
4E Pt Pd Au Rh 4E Cu Ni 4E
g/t Mt g/t g/t g/t g/t g/t % % Kg Moz
INDICATED 2.5 31.540 1.13 1.90 0.81 0.04 3.88 0.16 0.08 122,375 3.934
INFERRED 2.5 19.917 1.10 1.86 0.80 0.03 3.79 0.16 0.08 75,485 2.427
F-ZONE 2.5 g/t CUT-OFF
RESOURCE CATEGORY
CUT-OFFTONNAGE
GRADE METAL
4E Pt Pd Au Rh 4E Cu Ni 4E
g/t Mt g/t g/t g/t g/t g/t % % Kg Moz
INDICATED 2.5 186.725 1.05 2.23 0.17 0.04 3.49 0.07 0.16 651,670 20.952
INFERRED 2.5 77.295 1.01 2.16 0.17 0.03 3.37 0.04 0.12 260,484 8.375
*100% Waterberg Project – See Independent PFS Technical Report Oct 17, 2016 www.sedar.com

PLG: NYSE MKT | PTM: TSX
PLATINUM GROUP METALS | WATERBERG PGM PROJECT
31
WATERBERG PGM PROJECTRESOURCES Total Mineral Resource Estimate – October 17, 2016
WATERBERG TOTAL 2.5 g/t CUT-OFF
RESOURCE
CATEGORY
CUT-OFFTONNAGE
GRADE METAL
Pt Pd Au Rh 4E Cu Ni 4E4E
g/t Mt g/t g/t g/t g/t g/t % % Kg Moz
INDICATED 2.5 218.265 1.06 2.18 0.26 0.04 3.55 0.08 0.15 774,045 24.886
INFERRED 2.5 97.212 1.03 2.10 0.30 0.03 3.46 0.06 0.11 335,969 10.802
4E = Platinum Group Elements (Pt+Pd+Rh+Au). The cut-offs for mineral resources have been established by a
qualified person after a review of potential operating costs and other factors. The mineral resources stated above are
shown on a 100% basis, that is, for the Waterberg Project as a whole entity. Conversion Factor used – kg to oz =
32.15076. Numbers may not add due to rounding. Resources do not have demonstrated economic viability. A 5%
and 7% geological loss has been applied to the Indicated and Inferred categories respectively. Effective Date Oct 17,
2016. Metal prices used in the reserve estimate are as follows based on a 3-year trailing average (as at July
31/2016) in accordance with U.S. Securities and Exchange Commission ("SEC") guidance for the assessment of
resources; US$1,212/oz Pt, US$710/oz Pd, US$1229/oz Au, US$984/oz Rh, US$6.10/lb Ni, US$2.56/lb Cu,
US$/ZAR15.
Total aggregate mineral resources at Waterberg on a 100% project basis have increased slightly since those reported
in April 2016. Inferred category resources have decreased to an estimated 10.8 million 4E ounces from 11.71 million
ounces 4E Inferred in April, 2016. Indicated category resources have increased to an estimated 24.9 million 4E
ounces, from 23.9 million 4E ounces Indicated in April 2016:
1. The mineral resources are classified in accordance with the SAMREC standards. There are certain differences
with the "CIM Standards on Mineral Resources and Reserves"; however, in this case the QP believes the
differences are not material and the standards may be considered the same. Mineral resources that are not
mineral reserves do not have demonstrated economic viability and Inferred resources have a high degree of
uncertainty.
2. The mineral resources are provided on a 100% project basis and Inferred and Indicated categories are separate
and the estimates have an effective date of 17 October 2016.
3. A cut-off grade of 2.5 g/t 4E for both the T and the F-Zones is applied to the selected base case mineral
resources.
4. Cut off for the T and the F-Zones considered costs, smelter discounts, concentrator recoveries from previous
engineering work completed on the property by the Company. The resource model was cut-off at an arbitrary
depth of 1,250 meters, although intercepts of the deposit do occur below this depth.
5. Mineral resources were completed by Mr. CJ Muller of CJM Consulting.
6. Mineral resources were estimated using kriging methods for geological domains created in Datamine from 303
original holes and 483 deflections. A process of geological modelling and creation of grade shells using
indicating kriging was completed in the estimation process.
7. The estimation of mineral resources has taken into account environmental, permitting and legal, title, and
taxation, socio-economic, marketing and political factors.
8. The mineral resources may be materially affected by metals prices, exchange rates, labor costs, electricity supply
issues or many other factors detailed in the Company's Annual Information Form.
9. The data that formed the basis of the estimate are the drill holes drilled by Platinum Group, which consist of
geological logs, the drill hole collars surveys, the downhole surveys and the assay data. The area where each
layer was present was delineated after examination of the intersections in the various drill holes.
10. There is no guarantee that all or any part of the mineral resource not included in the current reserves will be
upgraded and converted to a mineral reserve.
11. Reserves are a subset of resources.
See Waterberg NI 43-101 Technical Report dated Oct 19, 2016 with an effective date of October 17, 2016.

PLG: NYSE MKT | PTM: TSX
PLATINUM GROUP METALS | WATERBERG PGM PROJECT
32
ITEMLIFE OF MINE
AVERAGE
5 YEAR AVERAGE:
2022-2026
10 YEAR AVERAGE:
2022-2031
MINE SITE CASH COST 389 390 374
NICKEL CREDITS 98 97 98
COPPER CREDITS 42 40 40
TOTAL MINE CASH COSTS AFTER CREDITS 248 253 236
REALISATION COST (SMELTER ‘COST’, TRANSPORT) 232 224 231
TOTAL CASH COSTS AFTER CREDITS 481 477 467
PROJECTEDCOSTS
Projected 4E Cash CostsBefore and After Credits and Costs
US$/OZ 4E IN CONCENTRATE
*100% Waterberg Project. See Waterberg NI 43-101 Technical Report dated Oct 19, 2016 with an effective date of October 17, 2016.
Mineral resources that are not mineral reserves do not have demonstrated viability.

PLG: NYSE MKT | PTM: TSX
PLATINUM GROUP METALS | WATERBERG PGM PROJECT
33
PARAMETER UNIT3 YEAR TRAILING AVERAGE
(JULY 31, 2016)
INVESTMENT BANK
CONSENSUS PRICE
(SEP 16, 2016)
PLATINUM USD /OZ 1,212 1,213
PALLADIUM USD /OZ 710 800
GOLD USD /OZ 1,229 1,300
RHODIUM USD /OZ 984 1,000
T AND F COMBINED BASKET (4E) USD /OZ 899 960
NICKEL USD /LB 6.10 7.50
COPPER USD /LB 2.56 2.90
PGM PAYABILITY % GROSS SALES PAY 85%
COPPER PAYABILITY % GROSS SALES PAY 73%
NICKEL PAYABILITY % GROSS SALES PAY 68%
ECONOMICASSUMPTIONS
Three Year Trailing and Investment Bank Consensus Prices – October 2016 PFS
*100% Waterberg Project. See Waterberg NI 43-101 Technical Report dated Oct 19, 2016 with an effective date of October 17, 2016.
Mineral resources that are not mineral reserves do not have demonstrated viability.

PLG: NYSE MKT | PTM: TSX
PLATINUM GROUP METALS | WATERBERG PGM PROJECT
34
ITEM DISCOUNT RATEZAR MILLIONS
(BEFORE TAX)
ZAR MILLIONS
(AFTER TAX)
USD MILLIONS
(BEFORE TAX)
USD
MILLIONS
(AFTER TAX)
NET PRESENT VALUE
UNDISCOUNTED 36,096 25,042 2,406 1,669
4.0% 18,213 11,883 1,214 792
6.0% 12,666 7,808 844 520
8.0% 8,565 4,805 571 320
10.0% 5,519 2,584 368 172
12.0% 3,249 939 217 62
14.0% 1,555 -278 104 -19
INTERNAL RATE OF RETURN
PROJECT PAYBACK PERIOD (YEARS) FROM 2017
16.6% 13.5% 16.6% 13.5%
10 10 10 10
PROJECTEDFINANCIAL RETURNS
Three Year Trailing Average Price Deck 15R/USD 20 yearsOctober 2016 PFS
*100% Waterberg Project. See Waterberg NI 43-101 Technical Report dated Oct 19, 2016 with an effective date of October 17, 2016.
Mineral resources that are not mineral reserves do not have demonstrated viability.
PLG: NYSE MKT | PTM: TSX
PLATINUM GROUP METALS | WATERBERG PGM PROJECT
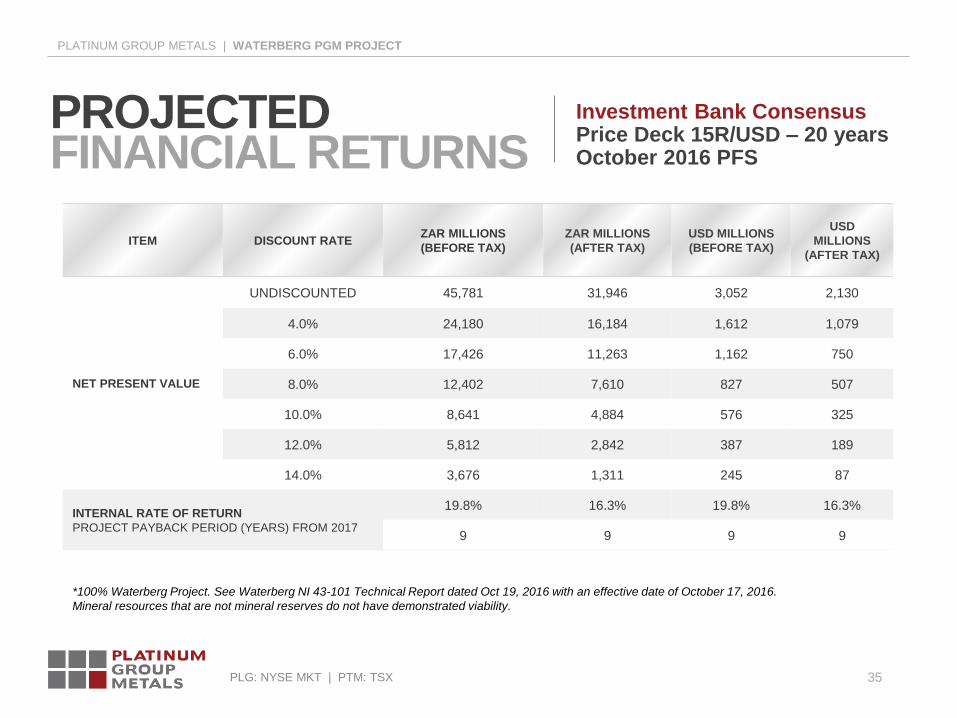
35
ITEM DISCOUNT RATEZAR MILLIONS
(BEFORE TAX)
ZAR MILLIONS
(AFTER TAX)
USD MILLIONS
(BEFORE TAX)
USD
MILLIONS
(AFTER TAX)
NET PRESENT VALUE
UNDISCOUNTED 45,781 31,946 3,052 2,130
4.0% 24,180 16,184 1,612 1,079
6.0% 17,426 11,263 1,162 750
8.0% 12,402 7,610 827 507
10.0% 8,641 4,884 576 325
12.0% 5,812 2,842 387 189
14.0% 3,676 1,311 245 87
INTERNAL RATE OF RETURN
PROJECT PAYBACK PERIOD (YEARS) FROM 2017
19.8% 16.3% 19.8% 16.3%
9 9 9 9
PROJECTEDFINANCIAL RETURNS
Investment Bank Consensus Price Deck 15R/USD – 20 yearsOctober 2016 PFS
*100% Waterberg Project. See Waterberg NI 43-101 Technical Report dated Oct 19, 2016 with an effective date of October 17, 2016.
Mineral resources that are not mineral reserves do not have demonstrated viability.

PLG: NYSE AMERICAN | PTM: TSX
PLATINUM GROUP METALS | WATERBERG PGM PROJECT
Suite 788 – 550 Burrard Street
Vancouver, BC V6C 2V5 Canada
+1 604-899-5450
www.platinumgroupmetals.net
_____________________________
Platinum Group Metals RSA (Pty) Ltd.
1st Floor, Platinum House
24 Sturdee Avenue
Rosebank, Johannesburg 2196 SA