plastic rivers - earthwatch.org.uk · than bottles, eg laundry powder, dishwasher salt • buy...
TRANSCRIPT
PLASTIC RIVERS reducing the plastic pollution on our doorstep
in association with
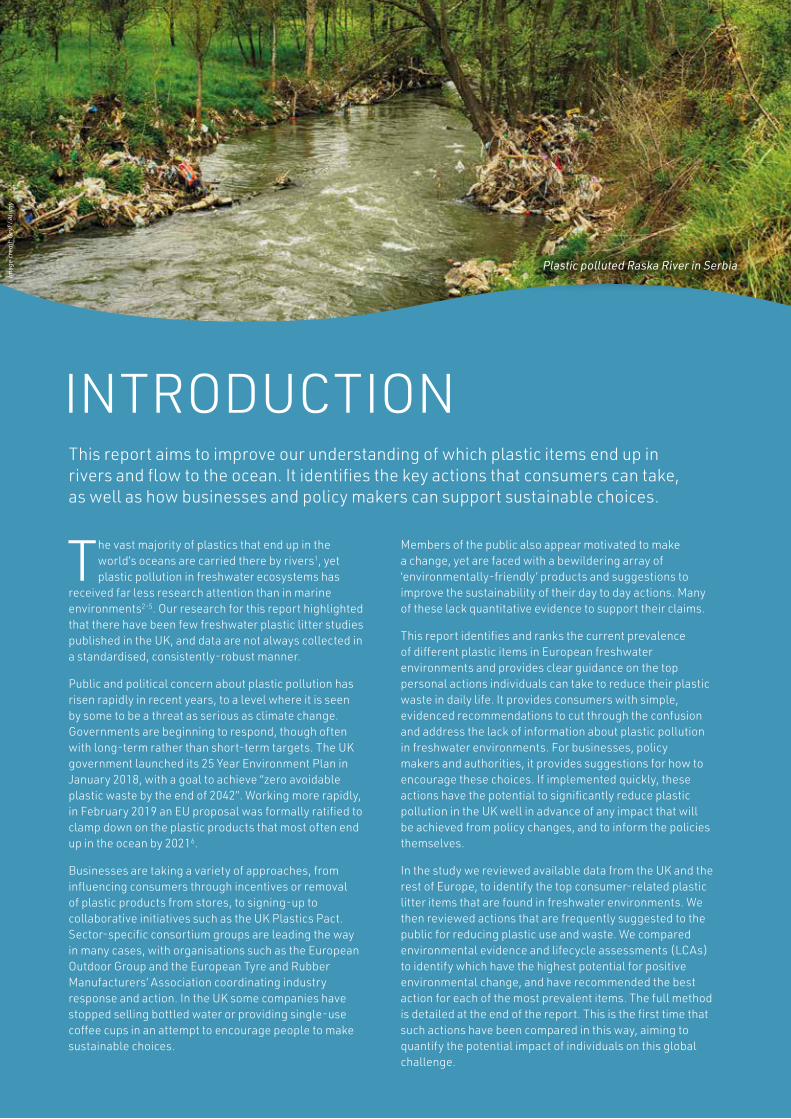
This report aims to improve our understanding of which plastic items end up in rivers and flow to the ocean. It identifies the key actions that consumers can take, as well as how businesses and policy makers can support sustainable choices.
Imag
e cr
edit:
Gry
f / A
lam
y
The vast majority of plastics that end up in the world’s oceans are carried there by rivers1, yet plastic pollution in freshwater ecosystems has
received far less research attention than in marine environments2-5. Our research for this report highlighted that there have been few freshwater plastic litter studies published in the UK, and data are not always collected in a standardised, consistently-robust manner.
Public and political concern about plastic pollution has risen rapidly in recent years, to a level where it is seen by some to be a threat as serious as climate change. Governments are beginning to respond, though often with long-term rather than short-term targets. The UK government launched its 25 Year Environment Plan in January 2018, with a goal to achieve “zero avoidable plastic waste by the end of 2042”. Working more rapidly, in February 2019 an EU proposal was formally ratified to clamp down on the plastic products that most often end up in the ocean by 20216.
Businesses are taking a variety of approaches, from influencing consumers through incentives or removal of plastic products from stores, to signing-up to collaborative initiatives such as the UK Plastics Pact. Sector-specific consortium groups are leading the way in many cases, with organisations such as the European Outdoor Group and the European Tyre and Rubber Manufacturers’ Association coordinating industry response and action. In the UK some companies have stopped selling bottled water or providing single-use coffee cups in an attempt to encourage people to make sustainable choices.
Members of the public also appear motivated to make a change, yet are faced with a bewildering array of ‘environmentally-friendly’ products and suggestions to improve the sustainability of their day to day actions. Many of these lack quantitative evidence to support their claims.
This report identifies and ranks the current prevalence of different plastic items in European freshwater environments and provides clear guidance on the top personal actions individuals can take to reduce their plastic waste in daily life. It provides consumers with simple, evidenced recommendations to cut through the confusion and address the lack of information about plastic pollution in freshwater environments. For businesses, policy makers and authorities, it provides suggestions for how to encourage these choices. If implemented quickly, these actions have the potential to significantly reduce plastic pollution in the UK well in advance of any impact that will be achieved from policy changes, and to inform the policies themselves.
In the study we reviewed available data from the UK and the rest of Europe, to identify the top consumer-related plastic litter items that are found in freshwater environments. We then reviewed actions that are frequently suggested to the public for reducing plastic use and waste. We compared environmental evidence and lifecycle assessments (LCAs) to identify which have the highest potential for positive environmental change, and have recommended the best action for each of the most prevalent items. The full method is detailed at the end of the report. This is the first time that such actions have been compared in this way, aiming to quantify the potential impact of individuals on this global challenge.
Plastic polluted Raska River in Serbia
INTRODUCTION
OUR FINDINGS AND RECOMMENDATIONSOf the 193,238 items counted across the nine studies we reviewed, 37.5% were consumer-related plastic items frequently encountered in daily life. The rest were generally non-plastic items, unidentified plastic pieces, or industrial, agricultural or fishing related. The top ten most prevalent consumer-related plastic items (or in some cases, categories) are shown in Table 1 (overleaf). These ten make up 28.2% of all the litter items counted. Five of the top ten are food related, two are sanitary/cosmetic, two are smoking related and the last is bags.
Reducing plastic use is the biggest thing everyone can do to prevent further waste and pollution. But plastic is so present in our modern-day lives that it is often
inescapable for consumers. We therefore reviewed a total of 40 consumer actions, considered as possible ’next best’ options to reducing use. Actions to reduce use were not scored, but in many cases refusal or reducing would precede the top action listed, eg for sanitary items, food wrappers and cigarette butts.
Due to a lack of sufficient data, only 27 of the 40 researched actions could go through full analysis. The 13 excluded actions were either relatively new ones, for which sustainability has not yet been rigorously tested, or whose potential to reduce plastic waste has yet to be quantified. The diversity of products being offered as alternatives to single-use plastics is rapidly increasing, with little data to assess their eco-credentials.
As a result of the analysis, actions were scored and ranked, and the top action for each item or category was identified (see Table 1). Our final recommendations for the public can be summarised into three key points.
1. Consider whether you need the item in the first place – it is always better to reduce use of items that are unnecessary, rather than switching everything to an alternative.
2. The best alternative – many reusable or disposable alternatives which are easily recycled or naturally biodegradable are available. Considering sustainability with regards to water, carbon and land use footprints, we recommend which alternatives have the least environmental impact (where there is reliable data).
3. Recycling and proper disposal – replacing with an alternative is not easy for some things, and the plastics used are often hard to recycle, eg food wrappers, cigarette butts. Therefore the best action is to dispose of them properly, in appropriately located bins, or recycling where possible.
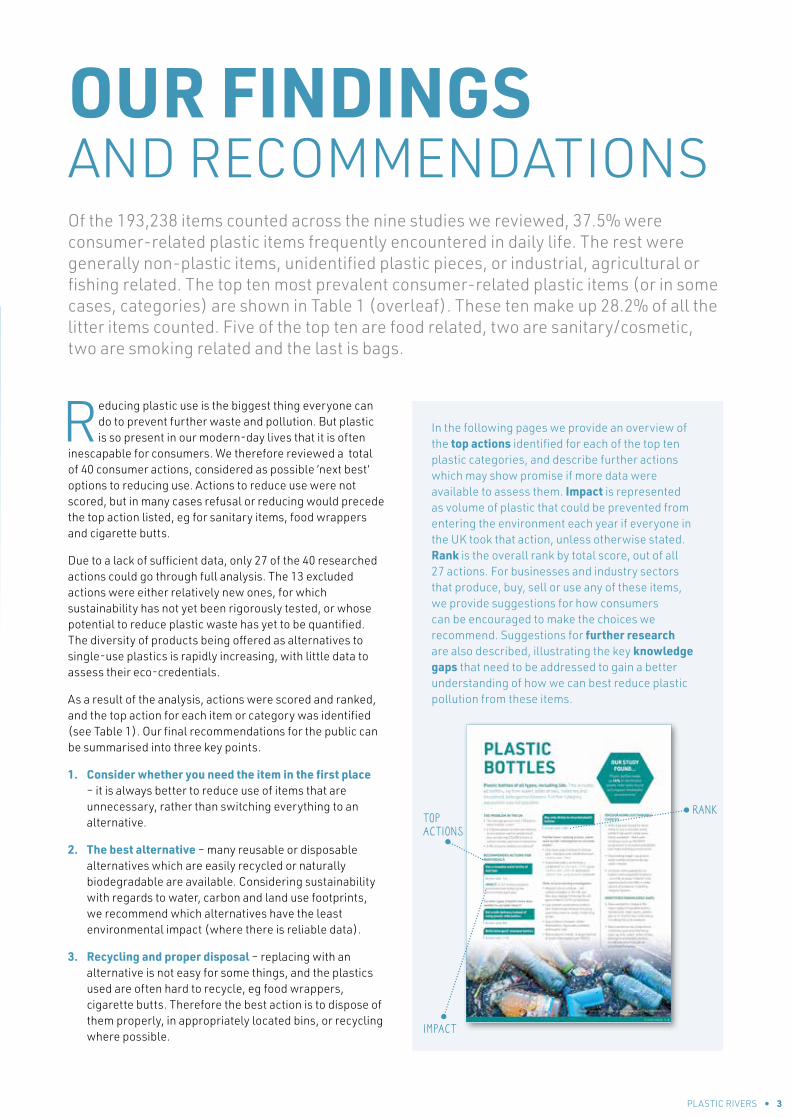
In the following pages we provide an overview of the top actions identified for each of the top ten plastic categories, and describe further actions which may show promise if more data were available to assess them. Impact is represented as volume of plastic that could be prevented from entering the environment each year if everyone in the UK took that action, unless otherwise stated. Rank is the overall rank by total score, out of all 27 actions. For businesses and industry sectors that produce, buy, sell or use any of these items, we provide suggestions for how consumers can be encouraged to make the choices we recommend. Suggestions for further research are also described, illustrating the key knowledge gaps that need to be addressed to gain a better understanding of how we can best reduce plastic pollution from these items.
RANK
IMPACT
TOP ACTIONS
PLASTIC RIVERS • 3
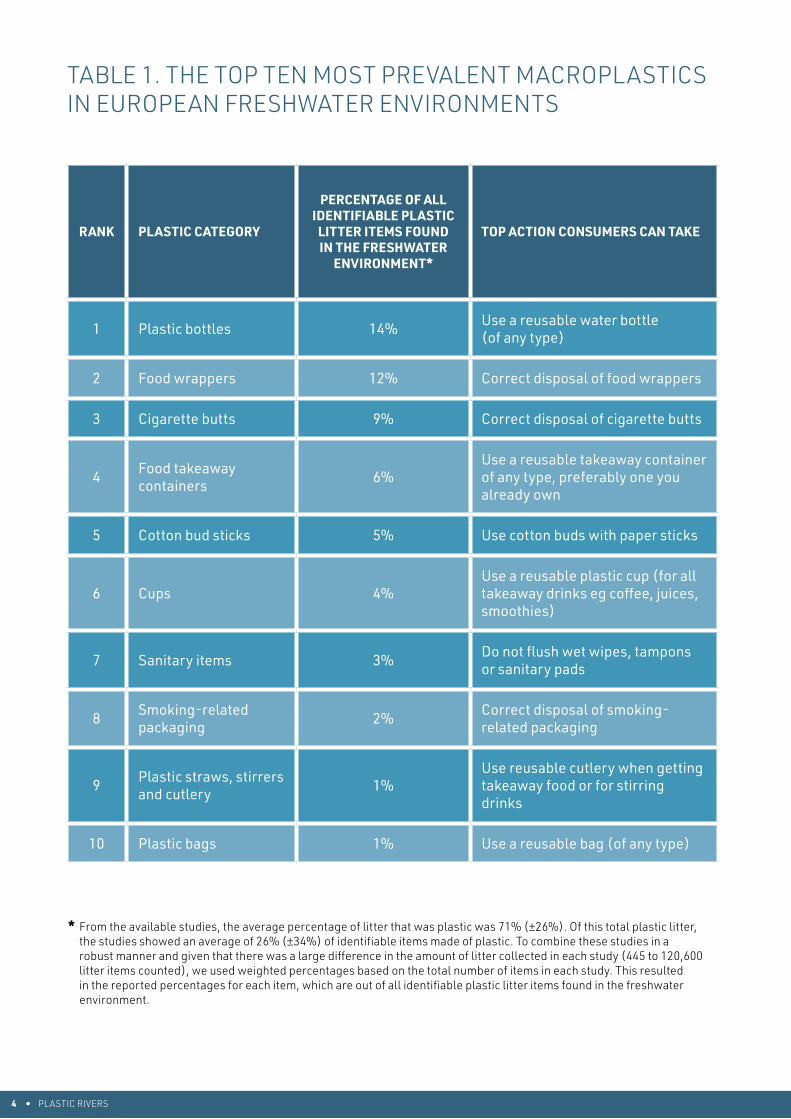
RANK PLASTIC CATEGORY
PERCENTAGE OF ALL IDENTIFIABLE PLASTIC
LITTER ITEMS FOUND IN THE FRESHWATER
ENVIRONMENT*
TOP ACTION CONSUMERS CAN TAKE
1 Plastic bottles 14% Use a reusable water bottle (of any type)
2 Food wrappers 12% Correct disposal of food wrappers
3 Cigarette butts 9% Correct disposal of cigarette butts
4 Food takeaway containers 6%
Use a reusable takeaway container of any type, preferably one you already own
5 Cotton bud sticks 5% Use cotton buds with paper sticks
6 Cups 4%Use a reusable plastic cup (for all takeaway drinks eg coffee, juices, smoothies)
7 Sanitary items 3% Do not flush wet wipes, tampons or sanitary pads
8 Smoking-related packaging 2% Correct disposal of smoking-
related packaging
9 Plastic straws, stirrers and cutlery 1%
Use reusable cutlery when getting takeaway food or for stirring drinks
10 Plastic bags 1% Use a reusable bag (of any type)
* From the available studies, the average percentage of litter that was plastic was 71% (±26%). Of this total plastic litter, the studies showed an average of 26% (±34%) of identifiable items made of plastic. To combine these studies in a robust manner and given that there was a large difference in the amount of litter collected in each study (445 to 120,600 litter items counted), we used weighted percentages based on the total number of items in each study. This resulted in the reported percentages for each item, which are out of all identifiable plastic litter items found in the freshwater environment.
4 • PLASTIC RIVERS
TABLE 1. THE TOP TEN MOST PREVALENT MACROPLASTICS IN EUROPEAN FRESHWATER ENVIRONMENTS
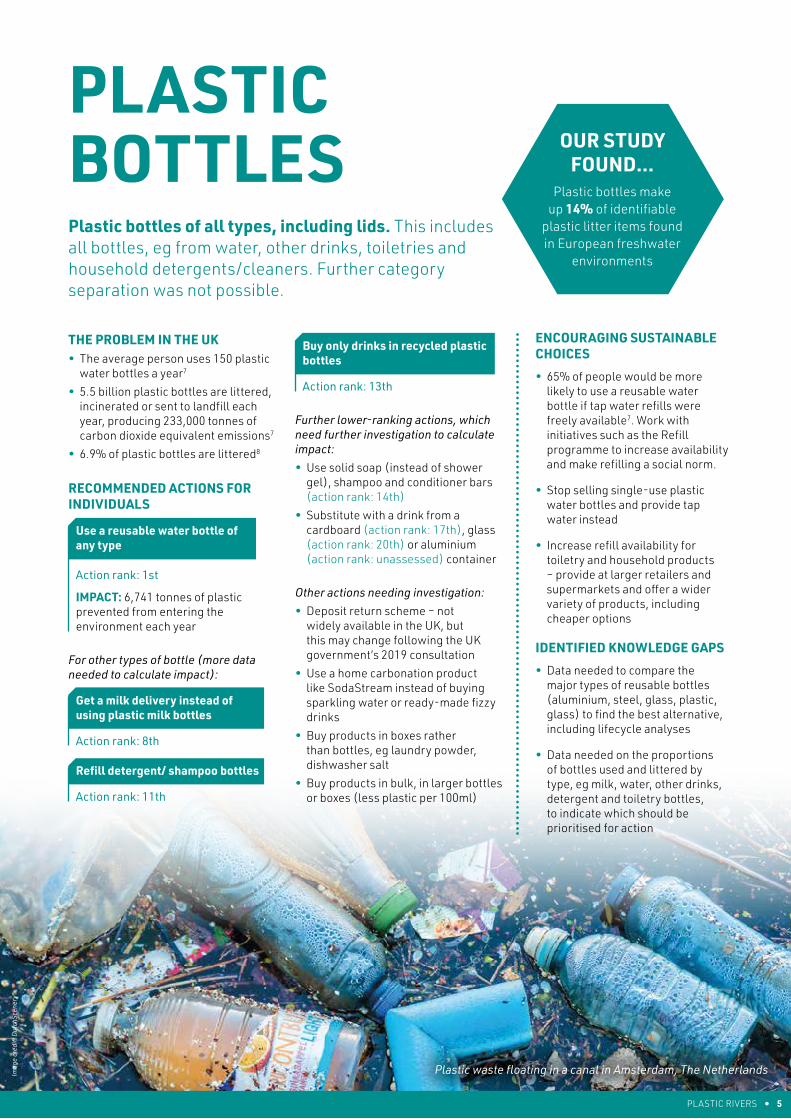
Plastic waste floating in a canal in Amsterdam, The Netherlands
THE PROBLEM IN THE UK• The average person uses 150 plastic
water bottles a year7
• 5.5 billion plastic bottles are littered, incinerated or sent to landfill each year, producing 233,000 tonnes of carbon dioxide equivalent emissions7
• 6.9% of plastic bottles are littered8
RECOMMENDED ACTIONS FOR INDIVIDUALS
Use a reusable water bottle of any type
Action rank: 1st
IMPACT: 6,741 tonnes of plastic prevented from entering the environment each year
For other types of bottle (more data needed to calculate impact):
Get a milk delivery instead of using plastic milk bottles
Action rank: 8th
Refill detergent/ shampoo bottles
Action rank: 11th
PLASTIC BOTTLES Plastic bottles of all types, including lids. This includes all bottles, eg from water, other drinks, toiletries and household detergents/cleaners. Further category separation was not possible.
ENCOURAGING SUSTAINABLE CHOICES
• 65% of people would be more likely to use a reusable water bottle if tap water refills were freely available7. Work with initiatives such as the Refill programme to increase availability and make refilling a social norm.
• Stop selling single-use plastic water bottles and provide tap water instead
• Increase refill availability for toiletry and household products – provide at larger retailers and supermarkets and offer a wider variety of products, including cheaper options
IDENTIFIED KNOWLEDGE GAPS
• Data needed to compare the major types of reusable bottles (aluminium, steel, glass, plastic, glass) to find the best alternative, including lifecycle analyses
• Data needed on the proportions of bottles used and littered by type, eg milk, water, other drinks, detergent and toiletry bottles, to indicate which should be prioritised for action
OUR STUDY FOUND…
Plastic bottles make up 14% of identifiable
plastic litter items found in European freshwater
environments
PLASTIC RIVERS • 5
Buy only drinks in recycled plastic bottles
Action rank: 13th
Further lower-ranking actions, which need further investigation to calculate impact:• Use solid soap (instead of shower
gel), shampoo and conditioner bars (action rank: 14th)
• Substitute with a drink from a cardboard (action rank: 17th), glass (action rank: 20th) or aluminium (action rank: unassessed) container
Other actions needing investigation:• Deposit return scheme – not
widely available in the UK, but this may change following the UK government’s 2019 consultation
• Use a home carbonation product like SodaStream instead of buying sparkling water or ready-made fizzy drinks
• Buy products in boxes rather than bottles, eg laundry powder, dishwasher salt
• Buy products in bulk, in larger bottles or boxes (less plastic per 100ml)
Imag
e cr
edit:
Dut
chSc
ener
y
FOOD WRAPPERS
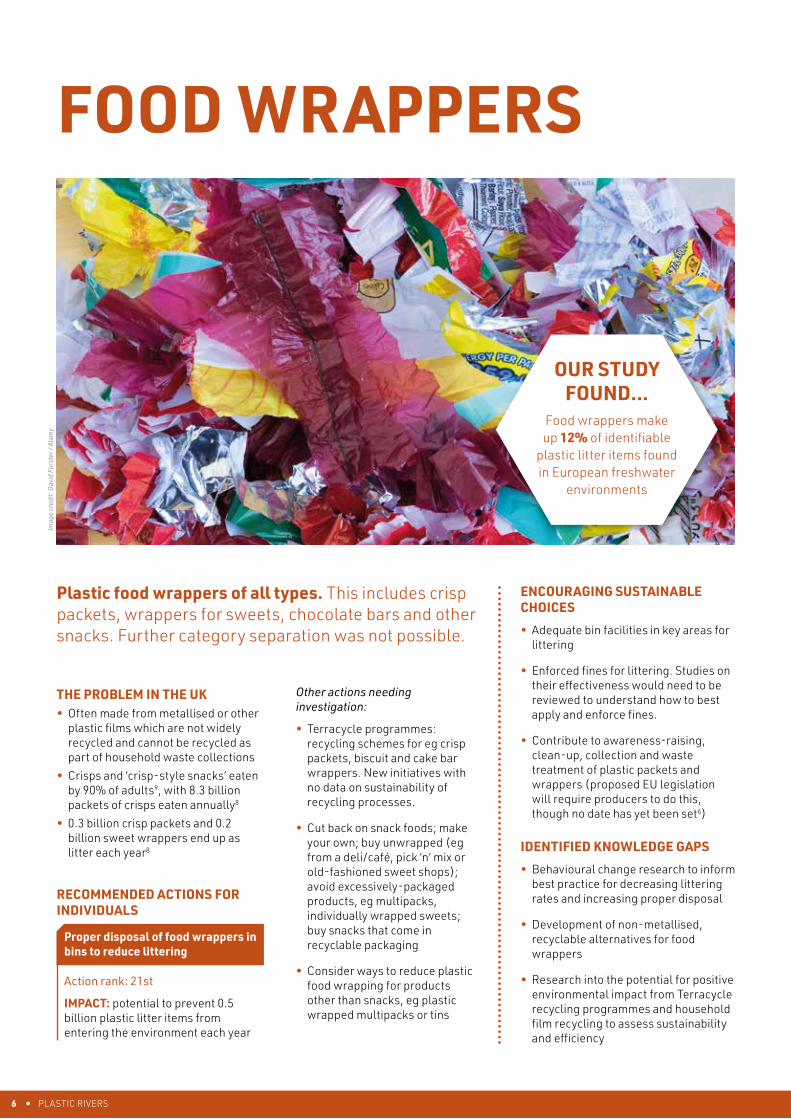
Plastic food wrappers of all types. This includes crisp packets, wrappers for sweets, chocolate bars and other snacks. Further category separation was not possible.
THE PROBLEM IN THE UK• Often made from metallised or other
plastic films which are not widely recycled and cannot be recycled as part of household waste collections
• Crisps and ‘crisp-style snacks’ eaten by 90% of adults9, with 8.3 billion packets of crisps eaten annually8
• 0.3 billion crisp packets and 0.2 billion sweet wrappers end up as litter each year8
RECOMMENDED ACTIONS FOR INDIVIDUALS
Proper disposal of food wrappers in bins to reduce littering
Action rank: 21st
IMPACT: potential to prevent 0.5 billion plastic litter items from entering the environment each year
Other actions needing investigation:
• Terracycle programmes: recycling schemes for eg crisp packets, biscuit and cake bar wrappers. New initiatives with no data on sustainability of recycling processes.
• Cut back on snack foods; make your own; buy unwrapped (eg from a deli/café, pick ‘n’ mix or old-fashioned sweet shops); avoid excessively-packaged products, eg multipacks, individually wrapped sweets; buy snacks that come in recyclable packaging
• Consider ways to reduce plastic food wrapping for products other than snacks, eg plastic wrapped multipacks or tins
ENCOURAGING SUSTAINABLE CHOICES
• Adequate bin facilities in key areas for littering
• Enforced fines for littering. Studies on their effectiveness would need to be reviewed to understand how to best apply and enforce fines.
• Contribute to awareness-raising, clean-up, collection and waste treatment of plastic packets and wrappers (proposed EU legislation will require producers to do this, though no date has yet been set6)
IDENTIFIED KNOWLEDGE GAPS
• Behavioural change research to inform best practice for decreasing littering rates and increasing proper disposal
• Development of non-metallised, recyclable alternatives for food wrappers
• Research into the potential for positive environmental impact from Terracycle recycling programmes and household film recycling to assess sustainability and efficiency
OUR STUDY FOUND…
Food wrappers make up 12% of identifiable
plastic litter items found in European freshwater
environments
6 • PLASTIC RIVERS
Imag
e cr
edit:
Dav
id F
orst
er /
Alam
y

OUR STUDY FOUND…
Cigarette butts make up 9% of identifiable
plastic litter items found in European freshwater
environments
CIGARETTE BUTTS Discarded ends of
smoked cigarettes
PLASTIC RIVERS • 7
ENCOURAGING SUSTAINABLE CHOICES
• Widely-available cigarette butt disposal. Trial innovations such as ballot bins which engage smokers by encouraging them to cast votes with their cigarette butts. Cigarette butt litter fell by 46% after a 12-week trial of 21 ballot bins in Southend on Sea, Essex13.
• Fines for littering cigarette butts – review studies on effectiveness to understand how to best implement and enforce schemes
• Extended producer responsibility to deal with all types of cigarette litter and engage in development and funding of schemes and campaigns aimed at litter prevention14 (proposed EU legislation will require producers to do this, though no date has yet been set6)
• Reduce the plastic content of cigarettes and promote these cigarettes over others
IDENTIFIED KNOWLEDGE GAPS
• Cigarette butts were most prevalent in the Switzerland study15
(20.7%) but <1% in UK studies16-19. Data needed to ascertain the reason for this, eg is it due to a lack of or out-of-date data; are UK smoking rates lower than other countries; are butts more successfully captured before reaching the river in the UK?
• Plant-derived filters have been developed, but consumer acceptability and environmental sustainability remains unclear14
• Research into the potential for positive environmental impact from Terracycle recycling programme to assess sustainability and efficiency
THE PROBLEM IN THE UK• 95% of cigarette filters contain cellulose acetate, a
plastic slow to degrade10
• Cigarette litter is present on 79% of England’s streets11. 14.6 billion butts are littered each year in the UK 8.
• 52% of UK smokers think putting a cigarette butt down the drain is acceptable, 39% admit to throwing a butt down a drain in the last month, and 11% do not consider them as litter12
RECOMMENDED ACTIONS FOR INDIVIDUALS
Do not throw cigarette butts on the ground, dispose of them correctly
Action rank: 25th
IMPACT: potential to prevent 2,482 tonnes of plastic from entering the environment each year
Other actions needing investigation:
• Carry a personal cigarette butt receptacle to store used butts until proper disposal available
• Terracycle Cigarette Waste Recycling Programme – scalability and impact (number of butts that could be processed) unclear
• Replace plastic cigarette filters with plant-derived filters
Imag
e cr
edit:
Luk
asse
k / S
hutt
erst
ock
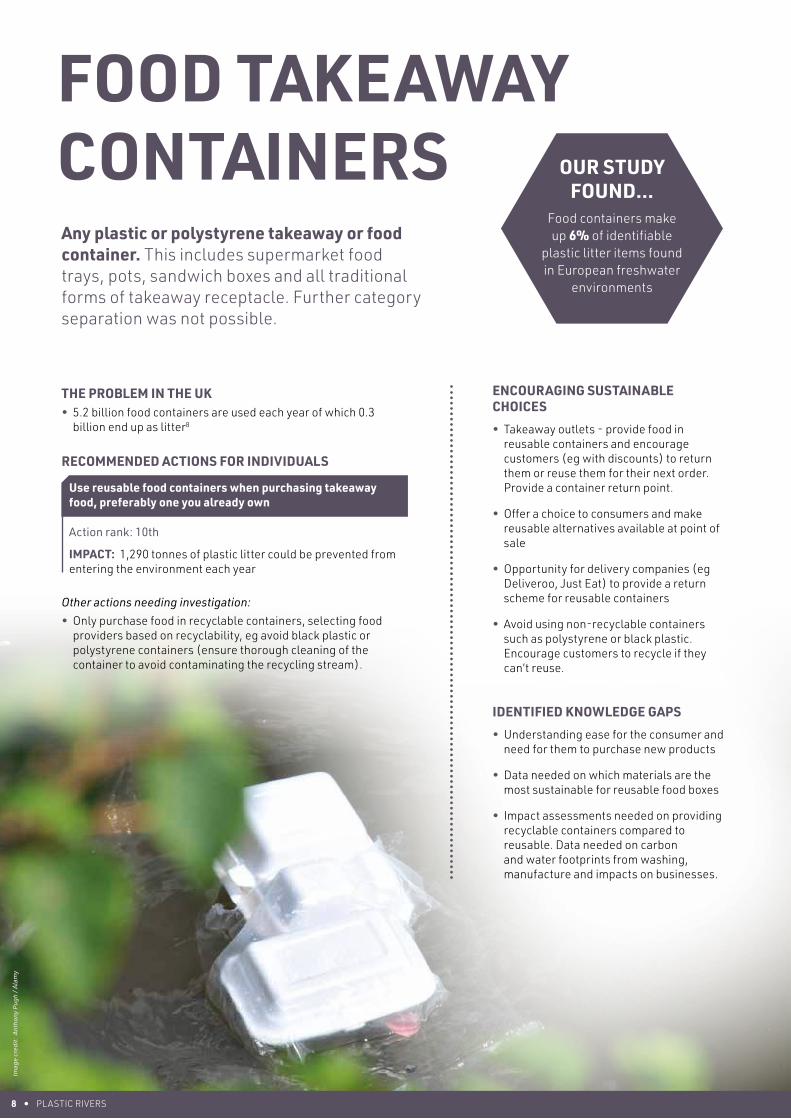
FOOD TAKEAWAY CONTAINERS Any plastic or polystyrene takeaway or food container. This includes supermarket food trays, pots, sandwich boxes and all traditional forms of takeaway receptacle. Further category separation was not possible.
OUR STUDY FOUND…
Food containers make up 6% of identifiable
plastic litter items found in European freshwater
environments
8 • PLASTIC RIVERS
Imag
e cr
edit
: A
ntho
ny P
ugh
/ Ala
my
ENCOURAGING SUSTAINABLE CHOICES
• Takeaway outlets - provide food in reusable containers and encourage customers (eg with discounts) to return them or reuse them for their next order. Provide a container return point.
• Offer a choice to consumers and make reusable alternatives available at point of sale
• Opportunity for delivery companies (eg Deliveroo, Just Eat) to provide a return scheme for reusable containers
• Avoid using non-recyclable containers such as polystyrene or black plastic. Encourage customers to recycle if they can’t reuse.
IDENTIFIED KNOWLEDGE GAPS
• Understanding ease for the consumer and need for them to purchase new products
• Data needed on which materials are the most sustainable for reusable food boxes
• Impact assessments needed on providing recyclable containers compared to reusable. Data needed on carbon and water footprints from washing, manufacture and impacts on businesses.
THE PROBLEM IN THE UK• 5.2 billion food containers are used each year of which 0.3
billion end up as litter8
RECOMMENDED ACTIONS FOR INDIVIDUALS
Use reusable food containers when purchasing takeaway food, preferably one you already own
Action rank: 10th
IMPACT: 1,290 tonnes of plastic litter could be prevented from entering the environment each year
Other actions needing investigation:• Only purchase food in recyclable containers, selecting food
providers based on recyclability, eg avoid black plastic or polystyrene containers (ensure thorough cleaning of the container to avoid contaminating the recycling stream).
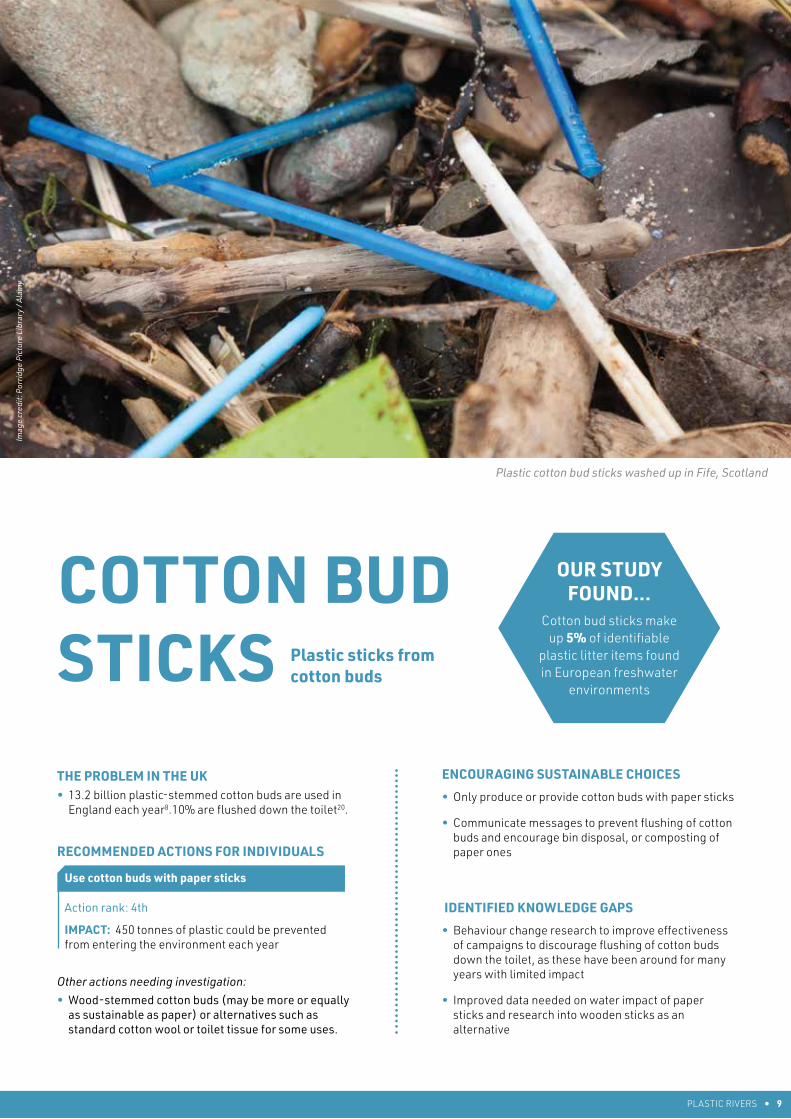
COTTON BUD STICKS Plastic sticks from
cotton buds
PLASTIC RIVERS • 9
Imag
e cr
edit:
Por
ridg
e Pi
ctur
e Li
brar
y / A
lam
y
ENCOURAGING SUSTAINABLE CHOICES
• Only produce or provide cotton buds with paper sticks
• Communicate messages to prevent flushing of cotton buds and encourage bin disposal, or composting of paper ones
IDENTIFIED KNOWLEDGE GAPS
• Behaviour change research to improve effectiveness of campaigns to discourage flushing of cotton buds down the toilet, as these have been around for many years with limited impact
• Improved data needed on water impact of paper sticks and research into wooden sticks as an alternative
THE PROBLEM IN THE UK• 13.2 billion plastic-stemmed cotton buds are used in
England each year8.10% are flushed down the toilet20.
RECOMMENDED ACTIONS FOR INDIVIDUALS
Use cotton buds with paper sticks
Action rank: 4th
IMPACT: 450 tonnes of plastic could be prevented from entering the environment each year
Other actions needing investigation:• Wood-stemmed cotton buds (may be more or equally
as sustainable as paper) or alternatives such as standard cotton wool or toilet tissue for some uses.
OUR STUDY FOUND…
Cotton bud sticks make up 5% of identifiable
plastic litter items found in European freshwater
environments
Plastic cotton bud sticks washed up in Fife, Scotland
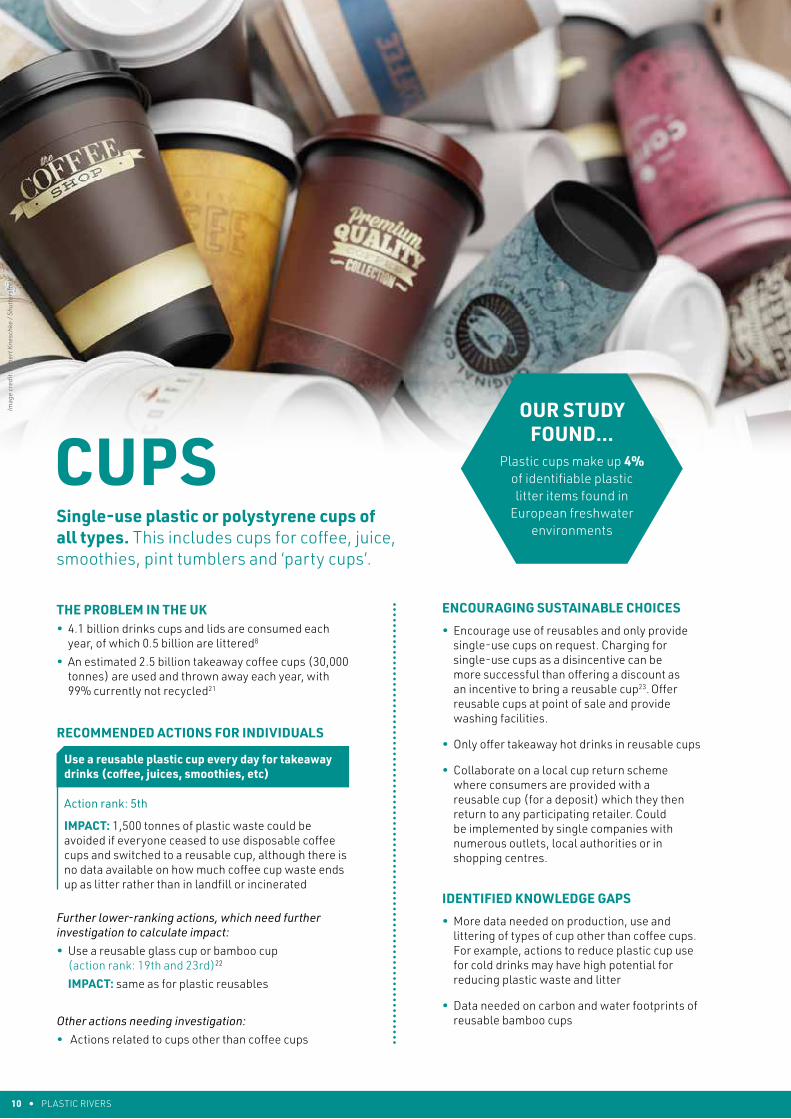
CUPS Single-use plastic or polystyrene cups of all types. This includes cups for coffee, juice, smoothies, pint tumblers and ‘party cups’.
OUR STUDY FOUND…
Plastic cups make up 4% of identifiable plastic litter items found in
European freshwater environments
THE PROBLEM IN THE UK• 4.1 billion drinks cups and lids are consumed each
year, of which 0.5 billion are littered8
• An estimated 2.5 billion takeaway coffee cups (30,000 tonnes) are used and thrown away each year, with 99% currently not recycled21
RECOMMENDED ACTIONS FOR INDIVIDUALS
Use a reusable plastic cup every day for takeaway drinks (coffee, juices, smoothies, etc)
Action rank: 5th
IMPACT: 1,500 tonnes of plastic waste could be avoided if everyone ceased to use disposable coffee cups and switched to a reusable cup, although there is no data available on how much coffee cup waste ends up as litter rather than in landfill or incinerated
Further lower-ranking actions, which need further investigation to calculate impact:• Use a reusable glass cup or bamboo cup
(action rank: 19th and 23rd)22 IMPACT: same as for plastic reusables
Other actions needing investigation:• Actions related to cups other than coffee cups
ENCOURAGING SUSTAINABLE CHOICES
• Encourage use of reusables and only provide single-use cups on request. Charging for single-use cups as a disincentive can be more successful than offering a discount as an incentive to bring a reusable cup23. Offer reusable cups at point of sale and provide washing facilities.
• Only offer takeaway hot drinks in reusable cups
• Collaborate on a local cup return scheme where consumers are provided with a reusable cup (for a deposit) which they then return to any participating retailer. Could be implemented by single companies with numerous outlets, local authorities or in shopping centres.
IDENTIFIED KNOWLEDGE GAPS
• More data needed on production, use and littering of types of cup other than coffee cups. For example, actions to reduce plastic cup use for cold drinks may have high potential for reducing plastic waste and litter
• Data needed on carbon and water footprints of reusable bamboo cups
10 • PLASTIC RIVERS
Imag
e cr
edit:
Rob
ert K
nesc
hke
/ Shu
tter
stoc
k
SANITARY PRODUCTS
Do not flush sanitary items
Action rank: unassessed due to lack of data beyond wet wipes
IMPACT: we are certain that, despite lack of data, this would further reduce plastic waste entering the environment through sewage
For other sanitary products:
Use disposable organic cotton sanitary towels
Action rank: 15th
IMPACT: prevent 4,599 tonnes of plastic from entering the environment each year
Use reusable nappies
Action rank: 16th
IMPACT: no data on flushing rates so not possible to calculate plastic prevented from entering the environment. Would prevent 28,950-50,643 tonnes of plastic waste each year.
Further lower-ranking actions, which need further investigation to calculate impact:
• Use menstrual cups instead of tampons (action rank: 18th)
IMPACT: more data needed
• Use reusable or biodegradable wet wipes (action rank: 22nd and 24th)
IMPACT: prevent 3,400 tonnes of plastic from entering the environment each year
Other actions needing investigation:• Reusable sanitary towels; organic
cotton tampons; switching to applicator-free tampons; biodegradable nappies; nappy recycling; water spray replacing wet wipes; reusable tampon applicators
ENCOURAGING SUSTAINABLE CHOICES• Do not market products as
‘flushable’. Provide information on plastic content to inform consumer choice. Clear messaging on the damage caused by flushing products.
• Campaigns encouraging only flushing the ‘three Ps’
• Bans and fines to prevent flushing, by water companies or local authorities on residents, or by government on companies labelling products ‘flushable’
• Encourage ‘plastic-free periods’, and include in PHSE sessions in schools
• Promote alternatives to wipes for cleaning, washing and make-up removal
IDENTIFIED KNOWLEDGE GAPS• Behaviour change research to
increase effectiveness of ‘do not flush’ campaigns
• Sanitary protection: life cycle analyses to evaluate sustainability of ‘environmentally-friendly’ and reusable alternatives
• Wet wipes: research on degradation rates for single-use wipes to set regulations on labelling as flushable. LCA of reusable and biodegradable alternatives.
• Nappies: renewal of LCA comparing reusable and disposables as most recent study is 10 years old.28 Both have developed significantly during that time, as have washing machines and practices. Different brands or types of reusable were not compared. Further research needed into sustainability of biodegradable options and nappy recycling/energy from waste schemes, and data on littering rates.
OUR STUDY FOUND…
Sanitary items make up 3% of identifiable
plastic litter items found in European freshwater
environmentsFemale sanitary protection, nappies and wet wipes. Wet wipes include face wipes, wet toilet tissue wipes, cleaning wipes, baby wipes. Further category separation was not possible.
PLASTIC RIVERS • 11
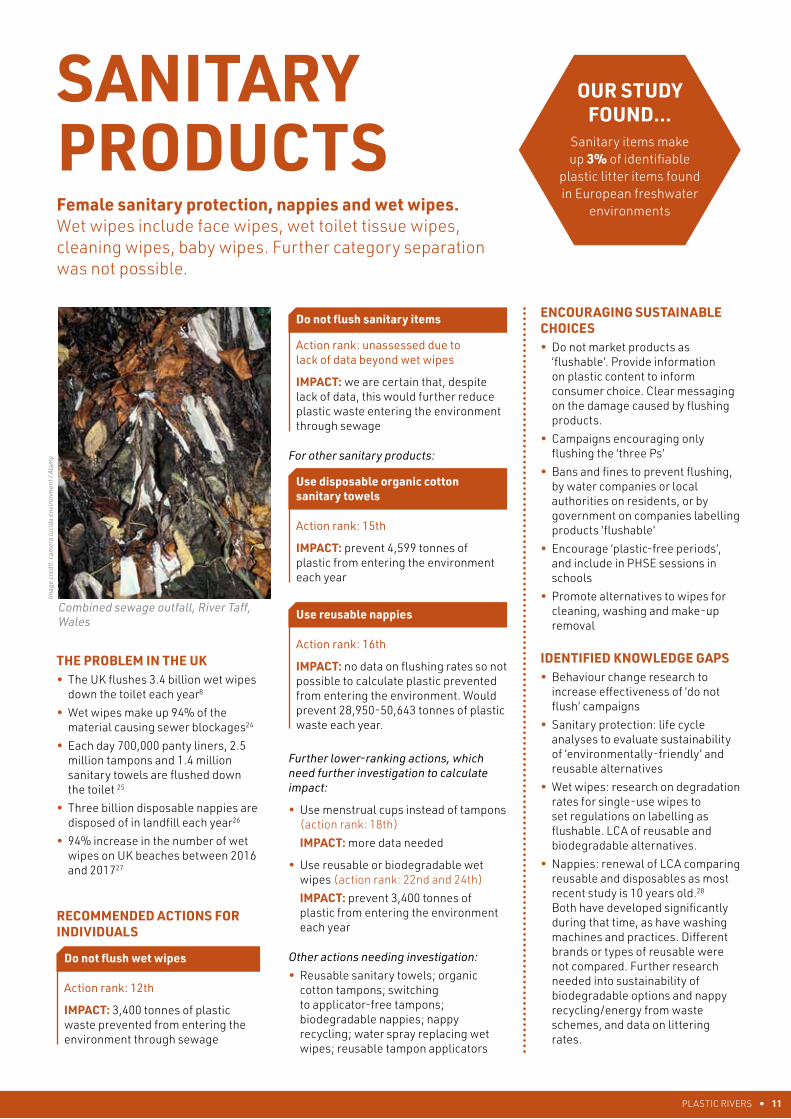
THE PROBLEM IN THE UK• The UK flushes 3.4 billion wet wipes
down the toilet each year8
• Wet wipes make up 94% of the material causing sewer blockages24
• Each day 700,000 panty liners, 2.5 million tampons and 1.4 million sanitary towels are flushed down the toilet 25
• Three billion disposable nappies are disposed of in landfill each year26
• 94% increase in the number of wet wipes on UK beaches between 2016 and 201727
RECOMMENDED ACTIONS FOR INDIVIDUALS
Do not flush wet wipes
Action rank: 12th
IMPACT: 3,400 tonnes of plastic waste prevented from entering the environment through sewage
Combined sewage outfall, River Taff, Wales
Imag
e cr
edit:
cam
era
luci
da e
nvir
onm
ent /
Ala
my
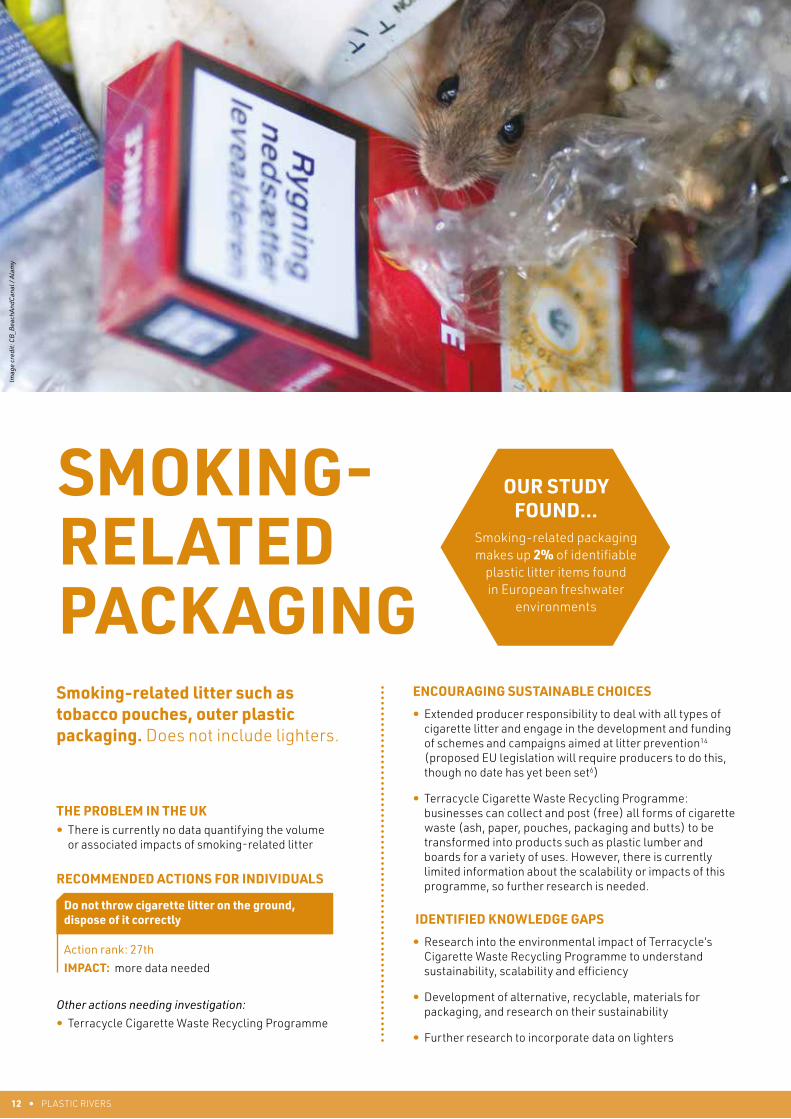
OUR STUDY FOUND…
Smoking-related packaging makes up 2% of identifiable
plastic litter items found in European freshwater
environments
Smoking-related litter such as tobacco pouches, outer plastic packaging. Does not include lighters.
THE PROBLEM IN THE UK• There is currently no data quantifying the volume
or associated impacts of smoking-related litter
RECOMMENDED ACTIONS FOR INDIVIDUALS
Do not throw cigarette litter on the ground, dispose of it correctly
Action rank: 27th IMPACT: more data needed
Other actions needing investigation:• Terracycle Cigarette Waste Recycling Programme
ENCOURAGING SUSTAINABLE CHOICES
• Extended producer responsibility to deal with all types of cigarette litter and engage in the development and funding of schemes and campaigns aimed at litter prevention14
(proposed EU legislation will require producers to do this, though no date has yet been set6)
• Terracycle Cigarette Waste Recycling Programme: businesses can collect and post (free) all forms of cigarette waste (ash, paper, pouches, packaging and butts) to be transformed into products such as plastic lumber and boards for a variety of uses. However, there is currently limited information about the scalability or impacts of this programme, so further research is needed.
IDENTIFIED KNOWLEDGE GAPS
• Research into the environmental impact of Terracycle’s Cigarette Waste Recycling Programme to understand sustainability, scalability and efficiency
• Development of alternative, recyclable, materials for packaging, and research on their sustainability
• Further research to incorporate data on lighters
12 • PLASTIC RIVERS
SMOKING-RELATED PACKAGING
Imag
e cr
edit:
CB
_Bea
chAn
dCan
al /
Alam
y
PLASTIC RIVERS • 13
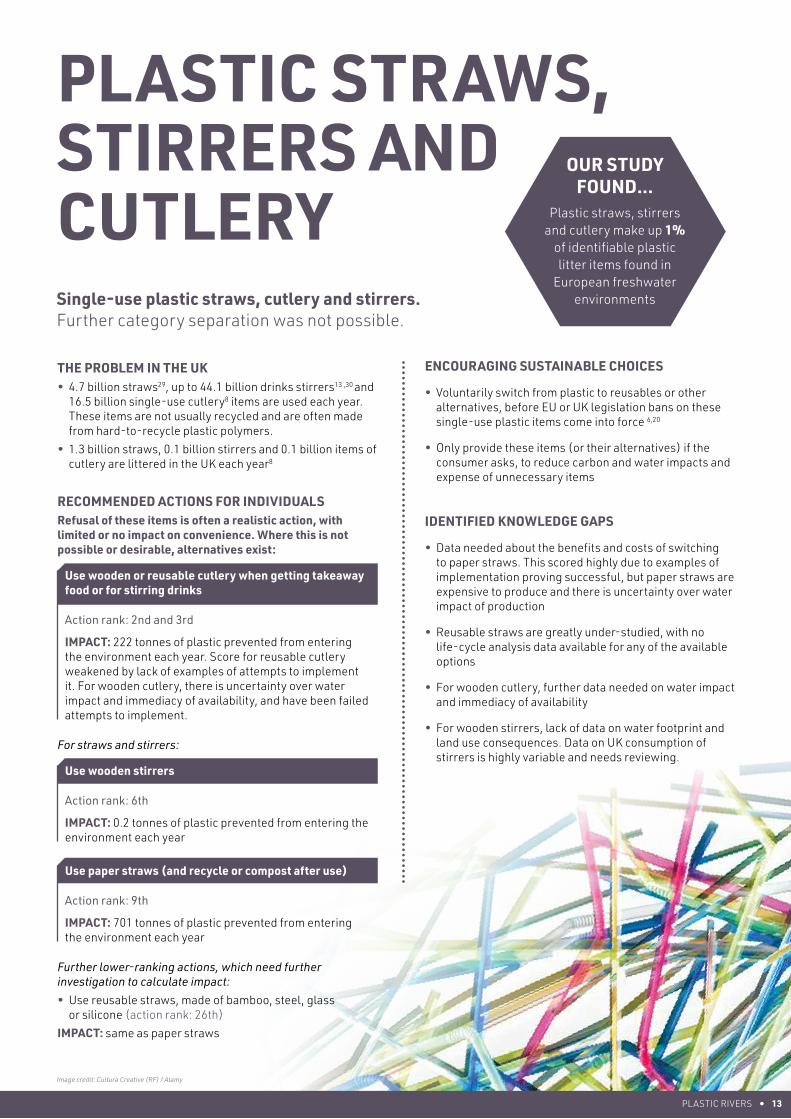
PLASTIC STRAWS, STIRRERS AND CUTLERY Single-use plastic straws, cutlery and stirrers. Further category separation was not possible.
OUR STUDY FOUND…
Plastic straws, stirrers and cutlery make up 1%
of identifiable plastic litter items found in
European freshwater environments
THE PROBLEM IN THE UK• 4.7 billion straws29, up to 44.1 billion drinks stirrers13 ,30 and
16.5 billion single-use cutlery8 items are used each year. These items are not usually recycled and are often made from hard-to-recycle plastic polymers.
• 1.3 billion straws, 0.1 billion stirrers and 0.1 billion items of cutlery are littered in the UK each year8
RECOMMENDED ACTIONS FOR INDIVIDUALSRefusal of these items is often a realistic action, with limited or no impact on convenience. Where this is not possible or desirable, alternatives exist:
Use wooden or reusable cutlery when getting takeaway food or for stirring drinks
Action rank: 2nd and 3rd
IMPACT: 222 tonnes of plastic prevented from entering the environment each year. Score for reusable cutlery weakened by lack of examples of attempts to implement it. For wooden cutlery, there is uncertainty over water impact and immediacy of availability, and have been failed attempts to implement.
For straws and stirrers:
Use wooden stirrers
Action rank: 6th
IMPACT: 0.2 tonnes of plastic prevented from entering the environment each year
Use paper straws (and recycle or compost after use)
Action rank: 9th
IMPACT: 701 tonnes of plastic prevented from entering the environment each year
Further lower-ranking actions, which need further investigation to calculate impact:• Use reusable straws, made of bamboo, steel, glass
or silicone (action rank: 26th) IMPACT: same as paper straws
ENCOURAGING SUSTAINABLE CHOICES
• Voluntarily switch from plastic to reusables or other alternatives, before EU or UK legislation bans on these single-use plastic items come into force 6,20
• Only provide these items (or their alternatives) if the consumer asks, to reduce carbon and water impacts and expense of unnecessary items
IDENTIFIED KNOWLEDGE GAPS
• Data needed about the benefits and costs of switching to paper straws. This scored highly due to examples of implementation proving successful, but paper straws are expensive to produce and there is uncertainty over water impact of production
• Reusable straws are greatly under-studied, with no life-cycle analysis data available for any of the available options
• For wooden cutlery, further data needed on water impact and immediacy of availability
• For wooden stirrers, lack of data on water footprint and land use consequences. Data on UK consumption of stirrers is highly variable and needs reviewing.
Image credit: Cultura Creative (RF) / Alamy
14 • PLASTIC RIVERS
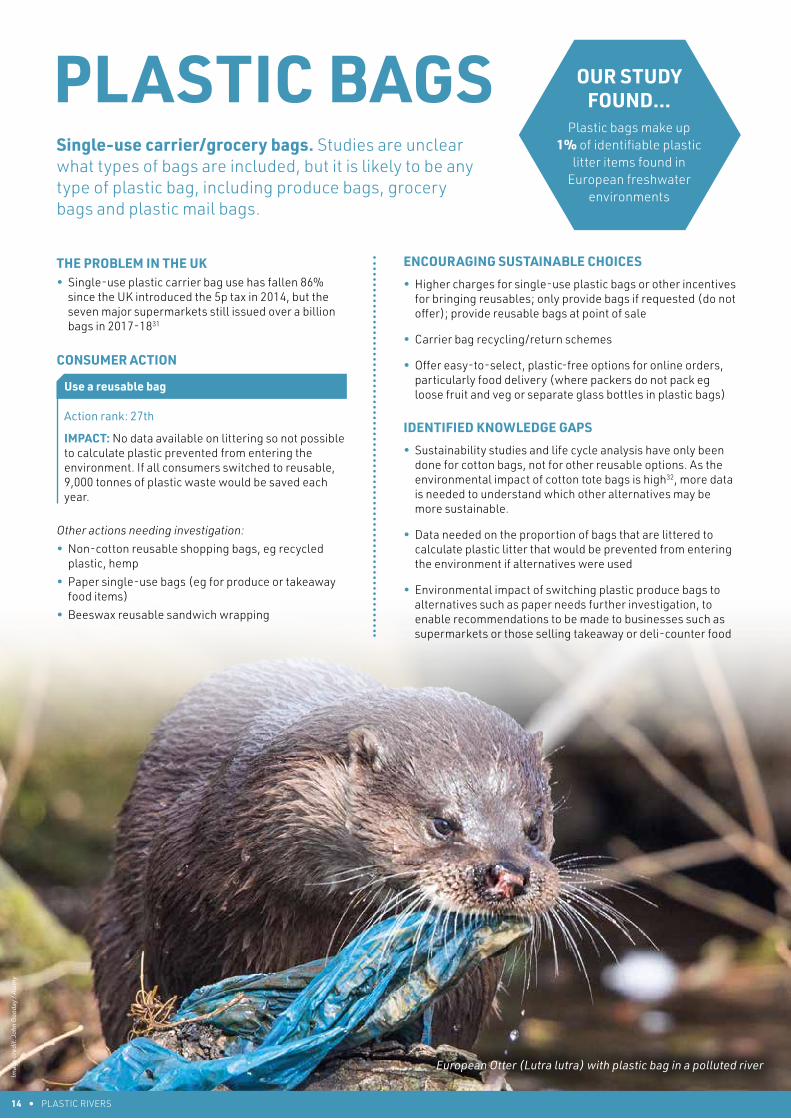
PLASTIC BAGS Single-use carrier/grocery bags. Studies are unclear what types of bags are included, but it is likely to be any type of plastic bag, including produce bags, grocery bags and plastic mail bags.
OUR STUDY FOUND…
Plastic bags make up 1% of identifiable plastic
litter items found in European freshwater
environments
THE PROBLEM IN THE UK• Single-use plastic carrier bag use has fallen 86%
since the UK introduced the 5p tax in 2014, but the seven major supermarkets still issued over a billion bags in 2017-1831
CONSUMER ACTION
Use a reusable bag
Action rank: 27th
IMPACT: No data available on littering so not possible to calculate plastic prevented from entering the environment. If all consumers switched to reusable, 9,000 tonnes of plastic waste would be saved each year.
Other actions needing investigation:• Non-cotton reusable shopping bags, eg recycled
plastic, hemp• Paper single-use bags (eg for produce or takeaway
food items)• Beeswax reusable sandwich wrapping
ENCOURAGING SUSTAINABLE CHOICES
• Higher charges for single-use plastic bags or other incentives for bringing reusables; only provide bags if requested (do not offer); provide reusable bags at point of sale
• Carrier bag recycling/return schemes
• Offer easy-to-select, plastic-free options for online orders, particularly food delivery (where packers do not pack eg loose fruit and veg or separate glass bottles in plastic bags)
IDENTIFIED KNOWLEDGE GAPS
• Sustainability studies and life cycle analysis have only been done for cotton bags, not for other reusable options. As the environmental impact of cotton tote bags is high32, more data is needed to understand which other alternatives may be more sustainable.
• Data needed on the proportion of bags that are littered to calculate plastic litter that would be prevented from entering the environment if alternatives were used
• Environmental impact of switching plastic produce bags to alternatives such as paper needs further investigation, to enable recommendations to be made to businesses such as supermarkets or those selling takeaway or deli-counter food
European Otter (Lutra lutra) with plastic bag in a polluted river
Imag
e cr
edit:
Joh
n G
ooda
y / A
lam
y
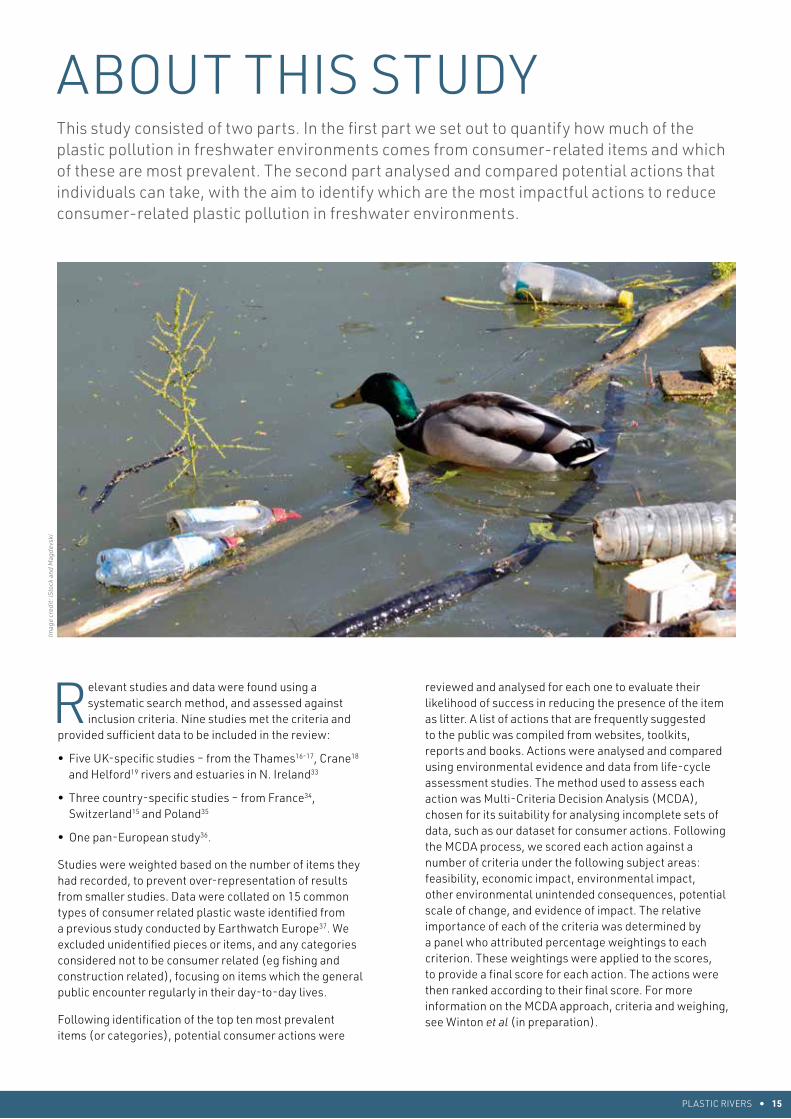
ABOUT THIS STUDYThis study consisted of two parts. In the first part we set out to quantify how much of the plastic pollution in freshwater environments comes from consumer-related items and which of these are most prevalent. The second part analysed and compared potential actions that individuals can take, with the aim to identify which are the most impactful actions to reduce consumer-related plastic pollution in freshwater environments.
PLASTIC RIVERS • 15
Relevant studies and data were found using a systematic search method, and assessed against inclusion criteria. Nine studies met the criteria and
provided sufficient data to be included in the review:
• Five UK-specific studies – from the Thames16-17, Crane18 and Helford19 rivers and estuaries in N. Ireland33
• Three country-specific studies – from France34, Switzerland15 and Poland35
• One pan-European study36.
Studies were weighted based on the number of items they had recorded, to prevent over-representation of results from smaller studies. Data were collated on 15 common types of consumer related plastic waste identified from a previous study conducted by Earthwatch Europe37. We excluded unidentified pieces or items, and any categories considered not to be consumer related (eg fishing and construction related), focusing on items which the general public encounter regularly in their day-to-day lives.
Following identification of the top ten most prevalent items (or categories), potential consumer actions were
reviewed and analysed for each one to evaluate their likelihood of success in reducing the presence of the item as litter. A list of actions that are frequently suggested to the public was compiled from websites, toolkits, reports and books. Actions were analysed and compared using environmental evidence and data from life-cycle assessment studies. The method used to assess each action was Multi-Criteria Decision Analysis (MCDA), chosen for its suitability for analysing incomplete sets of data, such as our dataset for consumer actions. Following the MCDA process, we scored each action against a number of criteria under the following subject areas: feasibility, economic impact, environmental impact, other environmental unintended consequences, potential scale of change, and evidence of impact. The relative importance of each of the criteria was determined by a panel who attributed percentage weightings to each criterion. These weightings were applied to the scores, to provide a final score for each action. The actions were then ranked according to their final score. For more information on the MCDA approach, criteria and weighing, see Winton et al (in preparation).
Imag
e cr
edit:
iSto
ck a
nd M
agde
vski
This study has identified a number of knowledge gaps that need to be addressed to improve our understanding of consumer-related plastic litter and the most impactful
actions consumers can take. These include:
• The varying methods used by the nine studies restricted us to using broad categories for some plastic items for the sake of comparability. In each case we had to “round-up” to the broadest category used. For example, some studies differentiated between the various sanitary items, while others listed them under one category. Another key example is that of plastic cups. Due to usage rates, it is often assumed that the majority of cups littered will likely be coffee cups. However, anecdotal evidence suggests that coffee cups are rarely found on litter surveys in the River Thames. For bottles, there is strong evidence that the majority littered are water bottles, followed by drinks bottles, but there is little information on prevalence of bottle types such as milk, household cleaner or toiletry bottles
• Lack of data on plastic litter in the deeper water column/just above the riverbed leaves us with an underestimate of the volume of plastic present in rivers. Data from the one study that sampled the riverbed demonstrated large differences in plastic levels and composition compared to studies looking at the water surface or river/lake bank/shore. Sanitary items were most prevalent in the riverbed study (21.5%) compared to other studies (max 2.3%), and there were notably higher proportions of food wrappers, cigarette packaging and cups, but fewer plastic bottles and plastic bags17.
• Social science research on consumer behaviour around the purchasing and use of alternative products, including likelihood and ease of uptake, is lacking. Knowledge on behaviours around how and why plastic ends up in rivers would be valuable. Varying combinations of social dynamics, moral norms, identity, awareness of consequences,
KNOWLEDGE GAPS HIGHLIGHTED BY THIS STUDY
ascription of responsibility, perceived and actual behavioural control, knowledge and specific attitudes have complex effects on behaviour change38.
• Impact data are lacking to estimate the potential success and overall environmental impact of most of the actions that are frequently recommended to the public for reducing plastic use and pollution. Example studies of implementation success were available for some, but most scored low for this criterion. Actions for sanitary items and bottles other than bottled water were particularly poorly tested.
• Weight of plastic within an item is not always proportional to its impact, but this was the only parameter for which data were available to use as a proxy to compare impact. For example, wet wipes are one of the lightest products (dry weight), yet cause significant damage to UK wastewater systems, and are a growing threat to the environment. Factors such as the number and size of items, and behaviour and durability in the environment would ideally be incorporated, but there is currently not enough data available to do so.
• Currently, the likelihood of a plastic item becoming pollution, and the impact that it has on the environment, is not included in most life cycle analyses. This can falsely discriminate against reusable items over single-use plastic when comparing LCAs.
Action and reaction to the plastic pollution issue, particularly with regard to legislation, recycling improvements and product innovation, has been growing rapidly. To respond to this and keep an up-to-date ranked actions list, there is a need to continually review the actions available to consumers and score them accordingly. Existing scores for actions that have already been ranked should also be reviewed as more data become available.
The literature search undertaken for this study highlighted the low number of relevant studies that have been conducted to date in the UK and the rest of Europe (or at least, for which data are available), as well as their use of highly-variable methodologies. There were not enough data available to compare different habitats, countries, or to limit our analysis to UK data only. There are numerous litter collection schemes in riverine environments across the UK with the potential to collect data on litter pollution, but there is no single method, database or coordinating institution. Collaboration to merge these data sources has the potential to provide more detailed understanding of riverine plastic litter.
16 • PLASTIC RIVERS
PLASTIC RIVERS • 17
References
1. Schmidt, C., Krauth, T. & Wagner, S. Export of Plastic Debris by Rivers into the Sea. Environ. Sci. Technol. acs.est.7b02368 (2017). doi:10.1021/acs.est.7b02368
2. Blettler, M. C. M., Abrial, E., Khan, F. R., Sivri, N. & Espinola, L. A. Freshwater plastic pollution: Recognizing research biases and identifying knowledge gaps. Water Res. 143, 416–424 (2018).
3. Eerkes-Medrano, D., Thompson, R. C. & Aldridge, D. C. Microplastics in freshwater systems: A review of the emerging threats, identification of knowledge gaps and prioritisation of research needs. Water Res. 75, 63–82 (2015).
4. Lebreton, L. C. M. et al. River plastic emissions to the world’s oceans. Nat. Commun. 8, 15611 (2017).
5. Li, X. et al. A Conceptual Framework for Classification Management of Contaminated Sites in Guangzhou, China. Sustainability 9, 362 (2017).
6. European Parliament. Plastic Oceans: MEPs back EU ban on throwaway plastics by 2021. (2018). Available at: http://www.europarl.europa.eu/news/en/press-room/20181018IPR16524/plastic-oceans-meps-back-eu-ban-on-throwaway-plastics-by-2021 .
7. House of Commons Environmental Audit Committee. Plastic bottles: Turning Back the Plastic Tide. (2017).
8. Elliott, T. & Elliott, L. A Plastic future: Plastic consumption and waste management. (2018).
9. Mintel. UK Consumer Snacking Market Report. (2018).
10. Bonanomi, G., Incerti, G., Cesarano, G., Gaglione, S. A. & Lanzotti, V. Cigarette butt decomposition and associated chemical changes assessed by13C cpmas NMR. PLoS One 10, 1–16 (2015).
11. Tidy, K. B. Litter in England: The local environmental quality survey of England 2017/18. (2018).
12. Keep Britain Tidy. Keep Britain Tidy - Bin the Butt. (2018). Available at: https://www.keepbritaintidy.org/local-authorities/reduce-litter/smoking-related-litter/binthebutt.
13. Hubbub. Neat Streets in Tooting: Impact Report. (2018).
14. Bourguignon, D. Reducing Marine Litter: action on single use plastics and fishing gear. (2018). doi:10.1017/CBO9781107415324.004
15. Hammerdirt Association. In(beach-litter-density): A comparison of marine and freshwater litter densities. (2016).
16. Thames21. Thames River Watch Litter Monitoring results. Thames21 (2017). Available at: http://www.thames21.org.uk/thames-river-watch/litter-monitoring-results.
17. Morritt, D., Stefanoudis, P. V., Pearce, D., Crimmen, O. A. & Clark, P. F. Plastic in the Thames: A river runs through it. Mar. Pollut. Bull. 78, 196–200 (2014).
18. Friends of the River Crane. Floating Plastic Litter Report for the River Crane. (2017).
19. Hirons, J. Helford Estuary Kayak Clean Litter Report. (2013).
20. Resource Futures. A preliminary assessment of the economic, environmental and social impacts of a potential ban on plastic straws, plastic stem cotton buds and plastics drinks stirrers. (2018).
21. House of Commons Environmental Audit Committee. Disposable Packaging: Coffee Cups. (2018).
22. Edge Environment. Reusable coffee cups life cycle assessment and benchmark - a Report for Keep Cup. (2018). doi:10.13140/RG.2.2.35083.13607
23. Poortinga, W. Results of a field experiment to reduce coffee cup waste Summary report to Bewley’s Tea & Coffee UK Ltd. (2017).
24. Drinkwater, A. & Moy, F. Wipes in Sewer Blockage Study. 21st Century Drainage Programme (2017).
25. Gouda, H. Urban Water Security: LCA and Sanitary Waste Management. Environ. Sci. - Water Secur. 23, 18–23 (2014)..
26. WRAP. Real nappies – Overview. (2015). Available at: http://www.wrap.org.uk/content/real-nappies-overview.
27. Marine Conservation Society. Great British Beach Clean Report 2017. 5 (2017).
28. Aumônier, S., Collins, M., Garrett, P. & Killeen, S. Science Report – An updated lifecycle assessment study for disposable and reusable nappies. (2008).
18 • PLASTIC RIVERS
29. Defra. Consultation Stage Impact Assessment on the proposal to ban the distribution and/or sale and of plastic drinking straws in England. (2018).
30. Defra. Consultation Stage Impact Assessment on the proposal to ban the distribution and/or sale and of plastic drink stirrers in England. (2018). doi:10.1016/j.forpol.2009.07.008
31. Defra. Single-use plastic carrier bags charge: data in England for 2017 to 2018. (2018). Available at: https://www.gov.uk/government/publications/carrier-bag-charge-summary-of-data-in-england/single-use-plastic-carrier-bags-charge-data-in-england-for-2017-to-2018.
32. Bisinella, V., Albizzati, P. F., Astrup, T. F. & Damgaard, A. Life Cycle Assessment of grocery carrier bags. Downloaded from orbit.dtu.dk on (2018).
33. Williams, A. T., Randerson, P., Allen, C. & Cooper, J. A. G. Beach litter sourcing: A trawl along the Northern Ireland coastline. 122, 47–64 (2017).
34. Bruge, A. et al. Monitoring Litter Inputs from the Adour River (Southwest France) to the Marine Environment. J. Mar. Sci. Eng. 6, 24 (2018).
35. Czarkowski, T. K., Kapusta, A., Kupren, K., Bogacka-Kapusta, E. & Kozlowski, K. Composition and seasonal changes of litter along the shorelines of selected water bodies in Warmia and Mazury region (north-eastern Poland). Polish J. Nat. Sci. 31, 123–135 (2016).
36. Joint Research Centre (European Commission). Floating Macro Litter in European Rivers - Top Items. Publ. Off. Eur. Union EUR 29383, (2018).
37. Winton, D. J. Scoping Review - Identification of Top Ten Contributors to Plastic Pollution in Freshwater Environments. (2018).
38. Pahl, S. & Wyles, K. J. The human dimension: How social and behavioural research methods can help address microplastics in the environment. Anal. Methods 9, 1404–1411 (2017).
EARTHWATCH BROCHURE NAME HERE • 19
AcknowledgementsThis report was produced by Earthwatch Europe’s plastics research programme team (Gitte Kragh, Debbie Winton, Steven Loiselle and Toos van Noordwijk). We would like to thank Lucy Anderson and Steve Rocliffe for their research work that contributed to this report, and our external peer reviewers who commented on the full study report.
This report and its associated materials were produced in association with Plastic OceansUK (plasticoceans.uk).
Cover illustrations: Macrovector / Walnut Bird / Reenya / Shutterstock
in association with
Working togetherThe Earthwatch Europe plastics research programme aims to provide a detailed picture of where plastic pollution originates, how it ends up in our waterways and oceans, and how we can solve the problem in partnership with business, researchers, other NGOs, policy makers and the general public. It will generate practical, evidence-based steps to tackle plastic pollution, so that everyone can be part of the solution.
The complexity, scale and urgency of this challenge means that it is something we must all work together to solve. If you are interested in exploring opportunities to collaborate, please contact our plastics team at [email protected].
www.earthwatch.org.uk/plastics
in association with