plasma concentrations of estradiol and testosterone ... · plasma concentrations of estradiol and...
TRANSCRIPT

Aquatic Toxicology 72 (2005) 383–396
Plasma concentrations of estradiol and testosterone, gonadalaromatase activity and ultrastructure of the testis inXenopus laevisexposed to estradiol or atrazine
Markus Heckera,∗, Wan Jong Kimb, June-Woo Parka, Margaret B. Murphya,Daniel Villeneuvea, Katherine K. Coadya, Paul D. Jonesa, Keith R. Solomonc,
Glen Van Der Kraakd, James A. Carre, Ernest E. Smithf, Louis du Preezg,Ronald J. Kendallf , John P. Giesya,h
a Department of Zoology, Aquatic Toxicology Laboratory, 218C National Food Safety and Toxicology Center,Center for Integrative Toxicology, Michigan State University, East Lansing, MI 48824, USA
b Department of Biology, Soonchunhyang University College of Natural Sciences, 336-745 Asan-si,Chungcheongnam-do, South Korea
c Centre for Toxicology and Department of Environmental Biology, University of Guelph, Guelph, Ont., Canada N1G 2W1d Department of Zoology, University of Guelph, Ont., Canada NIG 2W1
e Department of Biological Sciences, Texas Tech University, Lubbock, TX 79409, USAf Department of Environmental Toxicology, Texas Tech University, Lubbock, TX 79416, USA
g Potchefstroom University for Christian Higher Education, Potchefstroom 2520, South Africah Department of Biology and Chemistry, City University of Hong Kong, Kowloon, Hong Kong, SAR, China
Received 11 June 2004; received in revised form 14 January 2005; accepted 21 January 2005
ndactivity andsub-cellularf germr plasma T
sults mayplasmall develop-
ect testicular
Abstract
The ultrastructure of testicular cells of adult male African clawed frogs (Xenopus laevis) exposed to either estradiol (0.1�g/L)or 2-chloro-4-ethylamino-6-isopropyl-amino-s-triazine (atrazine; 10 or 100�g/L) was examined by electron microscopy acompared to plasma concentrations of the steroid hormones, testosterone (T) and estradiol (E2), testicular aromatasegonad growth expressed as the gonado-somatic index (GSI). Exposure to E2 caused significant changes both at theand biochemical levels. Exposure to E2 resulted in significantly fewer sperm cells, inhibition of meiotic division ocells, more lipid droplets that are storage compartments for the sex steroid hormone precursor cholesterol, and lesseconcentrations. Although not statistically significant, frogs exposed to E2 had slightly smaller GSI values. These rebe indicative of an inhibition of gonad growth and disrupted germ cell development by E2. Concentrations of E2 inwere greater in frogs exposed to E2 in water. Exposure to neither concentration of atrazine caused effects on germ cement, testicular aromatase activity or plasma hormone concentrations. These results suggest that atrazine does not aff
∗ Corresponding author. Tel.: +1 517 712 6258; fax: +1 517 432 2310.E-mail address:[email protected] (M. Hecker).
0166-445X/$ – see front matter © 2005 Elsevier B.V. All rights reserved.doi:10.1016/j.aquatox.2005.01.008

384 M. Hecker et al. / Aquatic Toxicology 72 (2005) 383–396
function. In contrast, exposure of maleX. laevisto E2 led to sub-cellular events that are indicative of disruption of testiculardevelopment, and demasculinization processes (decrease of androgen hormone titers). These results indicate that atrazine doesnot cause responses that are similar to those caused by exposure to E2.© 2005 Elsevier B.V. All rights reserved.
Keywords:Amphibians; Electron microscopy; Sex steroids; Aromatase; Testis; Ultrastructure
1. Introduction
There is concern about natural and syntheticsubstances that have the potential to interfere withthe “synthesis, secretion, transport, binding, action,or elimination of natural hormones in the body thatare responsible for maintenance of homeostasis,reproduction, development, and/or behavior” (Ankleyet al., 1998). It has been hypothesized that suchcompounds may elicit a variety of adverse effects inboth humans and wildlife, including promotion ofhormone-dependent cancers, reproductive tract disor-ders, and reduction in reproductive fitness (Gray et al.,1997). Substances that can mimic estrogen througheither a direct (hormone receptor-mediated) or indirectmechanism have been of particular concern (Kavlocket al., 1996). 2-Chloro-4-ethylamino-6-isopropyl-amino-s-triazine (atrazine) is a herbicide used inmany areas of the world (Hopenhayn-Rich et al.,2002). Although atrazine was not found to bind to theestrogen receptor (ER), relatively great concentrations
reported to cause both gonadal abnormalities (e.g. oc-currence of oocytes in testes) and demasculinization ofthe larynx, as indicated by reduced size of the laryngealdilator muscle, in male African clawed frogs (Xenopuslaevis) exposed from hatching through completion ofmetamorphosis (Hayes et al., 2002). However, otherstudies with juvenileX. laevishave not found effects onthe size of the laryngeal dilator muscle, gonadal devel-opment, plasma sex steroid concentrations or gonadalaromatase activities at such low (0.1–1�g/L) atrazineconcentrations (Carr et al., 2003; Coady et al., 2004,in press). Based on experiments with adult maleX.laevis that showed reduced plasma T concentrationsafter treatment with atrazine it was hypothesized byHayes et al. (2002)that the above demasculinizationeffects were caused through the same mechanism, up-regulation of gonadal aromatase activity, as describedearlier for a mammalian cell system (Sanderson et al.,2000). In contrast, under field conditions no such ef-fects of atrazine on plasma T as well as on plasmaE2 and gonadal aromatase activity could be observed
setiong.tleti-to
of atrazine (71�g/L) resulted in up-regulation of the invitro activity of aromatase in a human carcinoma cellsystem (H295R) (Sanderson et al., 2000). However, ina rat Leydig cell carcinoma cell line (R2C) atrazine didnot induce aromatase activity (Heneweer et al., 2003).Since aromatase converts testosterone (T) to estradiol(E2), it has been speculated that up-regulation of this
(Hecker et al., 2004). This study was conducted tofurther elucidate the potential of atrazine to decreaplasma T and increase plasma E2 through up-regulaof aromatase activity in the male African clawed froIn addition, the potential of atrazine to cause subultrastructural changes in testicular cells was invesgated. Furthermore, an objective of the study was
enzyme could result in increased estrogen productionl
a ellera de-f ;Bb dingt centy tedt . Fore n
demonstrate whether these changes, if present, werei tioni ularo Sinceti asedp alsoc werec ed asa ereh n tes-t fish
eading to a net estrogenic response.Reports of amphibian population declines (Carey
nd Bryant, 1995; Stebbins and Cohen, 1995; Wnd Green, 1997) and an increased incidence of
ormities in some frog populations (Kaiser, 1997urkhart et al., 1998; Gardiner and Hoppe, 1999) haveeen attributed to a number of possible causes inclu
he effects of endocrine disrupting compounds in reears (Kavlock, 1998). Some authors have attempo link these responses with exposure to atrazinexample, concentrations as low as 0.1�g/L have bee
ndicative of histological changes, such as reducn the size of the larynx and occurrence of testicocytes that have been reported by some authors.
he proposed mechanism of feminization ofX. laeviss through increased production of E2 and decrelasma T the results of exposures to atrazine wereompared to effects on these same endpoints thataused by aqueous exposure to E2. E2 was usmodel compound for estrogenic effects. While thave been numerous studies on the effects of E2 o
icular ultrastructure in a series of species including

M. Hecker et al. / Aquatic Toxicology 72 (2005) 383–396 385
and mammals (Islinger et al., 2003; Kizilay and Uygun,2003), nothing is known about effects in amphibians.Therefore, in addition to the above goal – identify pos-sible effects of atrazine on testicular ultrastructure inX. laevis– this study aimed to establish typical effectsof exposure to E2 on testicular ultrastructure in adultX. laevisas a sub-cellular marker for estrogen exposurein amphibians.
While standard light microscopy provides some in-formation on histology at the tissue level, electronmicroscopy has the advantage of elucidating subtlechanges in function related structures in cell compart-ments that can be more directly related to physiologicalprocesses. Thus, ultrastructural examination was usedto address these issues.
2. Materials and methods
2.1. Test materials and animals
Atrazine (CAS number 1912-24-9; 97.1% pure) wasprovided by Syngenta Crop Protection Inc. (Greens-boro, NC, USA). 17�-estradiol (E2) (CAS number 50-28-2; 98% pure) was purchased from Sigma ChemicalCo. (St. Louis, MO, USA). Ethanol (EtOH) (CAS num-ber 64-17-5, 100% USP grade) was purchased fromAAPER Alcohol (Shelbyville, KY, USA). Atrazinestock solutions (12 mg/L) were made up in UV-treatedlaboratory water before each water renewal, diluted ap-p thed rriers ionsw pri-a Thefi upsw OHs ign.A mX po-s ks atM o-r 0 Lfi atert 2-h ttle( eka
2.2. Experimental design
Animals were exposed in 600 L fiberglass tanksfilled with 120 L of the appropriate test solution. Expo-sure was conducted under static renewal conditions,with 50% test solution renewal every 3 d. Feedingregimen, temperature, and photoperiod during the ex-posures were consistent with acclimation conditions.Average frog wet wt (±1 standard deviation (S.D.))was 42± 6.6 g. Initial loading was 14 frogs per tankwith three replicate tanks per treatment (approximately4.9 g frog/L test solution). Mortalities were one indi-vidual in one E2 treatment tank over the entire courseof the experiment. Except for one control treatmenttank, from which eight animals were collected, sevenfrogs were sampled on exposure day 49 from all othertanks, and anesthetized by immersion in 250 mg/L MS-222 (tricaine methanesulfonate). The remaining sevenfrogs were used in a different experiment the results ofwhich will be reported elsewhere. Immediately there-after, blood was collected from all animals by cardiacpuncture into heparinized syringes, and plasma wasseparated by centrifugation at 10,000×g for 10 min.In some cases not enough blood could be drawn whichresulted in slightly lower overall sample sizes for thehormone data (CTR:n= 19; ATZ-10:n= 19; ATZ-100:n= 18; E2:n= 19). Wet weight and snout-vent lengthwere measured, and the gonado-somatic index (GSI)was calculated (Eq.(1)).
G
ent),t aters hreer be-f hirdd bil-i nks.P xter-n ab-s edb ache dultm
twon 00;1 ol
ropriately in 5 gallon carboys and then added toifferent treatment tanks. EtOH was used as a caolvent to deliver the E2 treatment. E2 stock solutere diluted in laboratory freshwater at the approte concentration directly in the exposure tanks.nal EtOH concentration in the E2 treatment groas 0.005%. Due to logistical constraints, an Etolvent control was not included in the study desdult maleX. laevis, 30–50 g, were purchased froenopus Express (Plant City, FL, USA). Prior to exure, all animals were acclimated for several weeichigan State University’s Aquatic Toxicology Lab
atory. During acclimation, animals were held in 60berglass tanks under flow-through conditions. Wemperature was 18.5–23.5◦C. Photoperiod was 1light/12-h dark. Animals were fed Nasco frog bri
Nasco, Fort Atkinson, WI, USA) three times per wed libitum.
SI (%)= gonad weight
body weight× 100 (1)
From a subset of these animals (two per treatmestes were saved for ultrastructural analyses. Wamples (15 mL) were collected from each of the teplicate tanks for each treatment both immediatelyore and shortly after each solution renewal (every tay). This made it possible to characterize varia
ty in atrazine concentrations among replicate tahenotypic sex was determined by size and by eal sexually dimorphic characteristics, such as theence of cloacal folds. Sex was definitively confirmy inspection of the gonads at the termination of exposure. All animals used for the study were aales.The treatments tested in this study included
ominal concentrations of atrazine (ATZ-10, ATZ-10 and 100�g/L in laboratory freshwater), contr
386 M. Hecker et al. / Aquatic Toxicology 72 (2005) 383–396
(CTR; laboratory freshwater), and E2 (E2; 0.1�g/Lin laboratory freshwater) with three replicate tanks pertreatment.
2.3. Exposure verification
Atrazine concentrations in the aqueous sampleswere quantified using Envirogard® Triazine 96-wellPlate Kits (Strategic Diagnostics, Newark, DE, USA).The method detection limit (MDL) and limit of quan-tification (LOQ) for the plate kits were determinedbased on guidance presented elsewhere (Eaton et al.,1995). The manufacturer’s estimated lower limit of de-tection (LLD) was 0.02�g/L (Strategic Diagnosticskit #72110). The standard deviation of replicate mea-sures (n= 16) of water spiked with 0.1�g/L atrazine(approximately, 5× LLD) was determined. The re-sulting S.D. was multiplied by a Student’st-valuefor p= 0.01, 15 degrees of freedom to estimate theMDL (0.074�g/L). The LOQ was defined as 3× theMDL which resulted in a reportable concentration of0.22�g/L.
2.4. Tissue preparation for ultra structuralanalyses
Testes from specimens for electron microscopyanalysis were removed immediately after anesthetiza-tion, and fixed in Karnovsky’s fixative (2% glutaralde-h hatep in1 nd ande nedw ertS int ubles la an-d EMt urala pers vel-o ughr n ana t am
2.5. Steroid hormone analyses
Plasma samples were extracted twice with diethylether, and concentrations of E2 and T were measuredby competitive enzyme-linked immunosorbent assay(ELISA) as described byCuisset et al. (1994)withmodifications (Hecker et al., 2002). In this competitiveELISA, plasma steroid competes with acetylcholine-sterase labeled steroid for the binding site on thepolyclonal rabbit anti-steroid antibody. Antiserum toT was obtained from Dr. D.E. Kime (Sheffield, UK),and cross-reacted with 5-dihydrotestosterone (46%),5-dihydrotestosterone (19%), 5-androstane-3,17-diol(3.7%), 11-hydroxytestosterone (3.3%), 5-androstane-3,17-diol (2.7%), 5-androstane-3,17-diol (2.5%), 11-ketotestosterone (0.85%), estradiol (0.54%), 4-andro-stenedione (0.47%), 4-androstenetrione (0.31%), and17,20P (0.18%) at the 50% displacement level (Nashet al., 2000). The antiserum to E2 (Cayman Chemical,Ann Arbor, MI, USA) was reported to cross-reactwith estradiol-3-glucoronide (17%), estrone (4%),estriol (0.57%), T (0.1%) and 5�-dihydrotestosterone(0.1%). For all other steroids cross-reactivities werereported as less than 0.1%. The steroid ELISAswere performed using COSTAR high binding plates(COSTAR, Bucks, UK). The working ranges ofthese assays were determined as follows: testosterone(0.78–800 pg/well); 17�-estradiol (0.78–800 pg/well).Validation of this test method for use with plasma fromX. laeviswas reported elsewhere (Hecker et al., 2004).
2
thepm s ho-mK pH7 nM3 no.3 ear,N te( a,cT ex-t onc fmolo ram
yde and 2.5% para-formaldehyde in 0.1 M phospuffer, pH 7.2) for 4 h and followed by post-fixation% osmium tetroxide for 1 h at 4◦C. Samples were theehydrated in ethanol, rinsed in propylene oxidembedded in Araldite mixture. Blocks were sectioith diamond knives on an ultra microtome (Reichupernova, Leica Co.). Ultra-thin sections (70 nm
hickness) were mounted on copper grids and dotained with uranyl acetate and lead citrate (Stampand Ward, 1964). Sections from each group were romly selected, viewed and photographed in a J
ransmission electron microscope for ultra structnalysis. Multiple sections were randomly pickedample for observation (approximately 5–10). Deping germ and Leydig cells were assessed throandom selection on the fluorescent screen withirea of 5�m× 7�m. Observations were made aagnification of 10,000×.
.6. Aromatase activity
Aromatase activity was measured followingrotocol ofLephart and Simpson (1991)with minorodifications. Less than 0.5 g of gonadal tissue waogenized in 600�L of ice-cold gonad buffer (50 mMPO4, 1 mM EDTA, 10 mM glucose-6-phosphate,.4). The homogenate was incubated with 21.33H-androst-4-ene-3,17-dione (25.9 Ci/nmol; lot467-067; cat. no. NET-926; New England Nuclewton, MA, USA), 0.5 IU/mL glucose-6-phospha
Sigma cat. no. G6378), and 1 mM NADP (Sigmat. no. N-0505) at 37◦C and 5% CO2 for 120 min.ritiated water released from each sample was
racted and activity determined by liquid scintillatiounting. Aromatase activity was expressed asf androstenedione converted per hour per millig
M. Hecker et al. / Aquatic Toxicology 72 (2005) 383–396 387
protein. The specificity of the reaction for the substratewas determined by use of a competitive test withnon-labeled androstenedione. Addition of 7.5�l of5.6× 102 �M 4-androsten-4-ol-3,17-dione reducedtritiated water formation to the levels found in the tis-sue blanks, which demonstrated that the activity beingmeasured was specific for aromatase. The within- andamong-day CVs for the assay were determined to be3.8 and 11.3%, respectively (Hecker et al., 2004).
2.7. Statistical analyses
Statistical analyses were performed on log-transformed atrazine, E2 and T data. GSI data was nottransformed. Kolmogorov–Smirnov’s one sample testwas used to assess whether data sets were normally dis-tributed. A combination of Cochran’sC-test, Bartlett’stest, and Levene’s test were used to test for homo-geneity of variance across data sets being compared.When data (or log-transformed data) were normallydistributed and variance was homogenous, analysis ofvariance (ANOVA) and thet-test were used to detectsignificant differences among tank means or geometricmeans. When data violated parametric assumptions,the non-parametric Kruskal–Wallis test was used to de-tect differences among treatment groups. If a significantdifference was indicated, the Mann–WhitneyU-testwas used to determine differences between treatments.The power (based onto a non-centralt-distribution)to detect significant differences between the differente icalp ects,w tion( . Tot wala non-p testt eenl wala fors
3
3
-10a tely
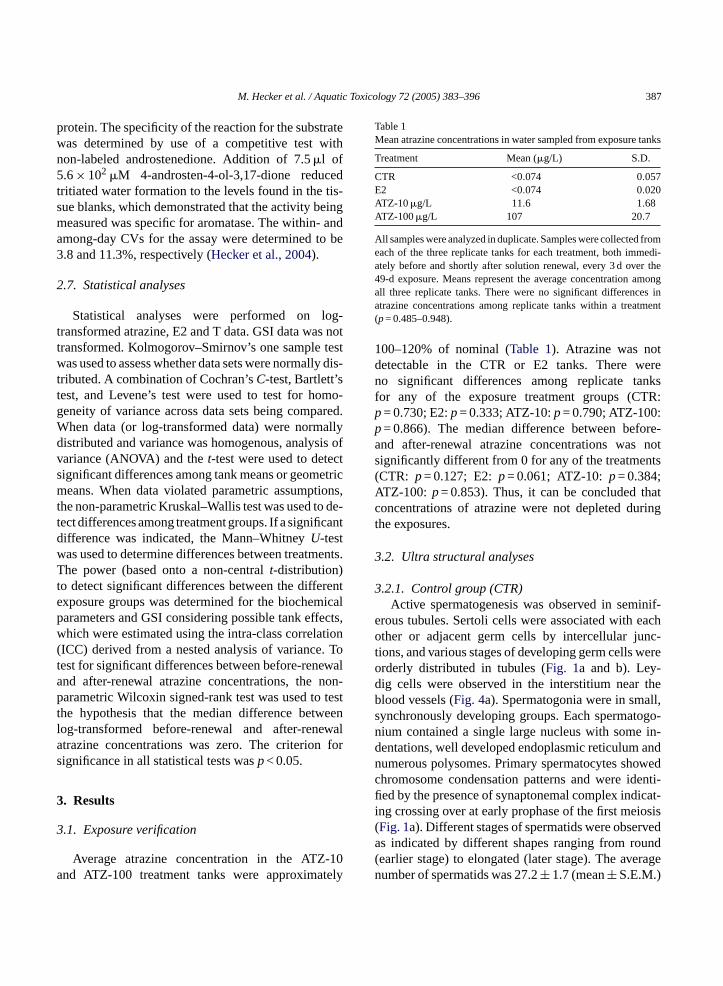
Table 1Mean atrazine concentrations in water sampled from exposure tanks
Treatment Mean (�g/L) S.D.
CTR <0.074 0.057E2 <0.074 0.020ATZ-10�g/L 11.6 1.68ATZ-100�g/L 107 20.7
All samples were analyzed in duplicate. Samples were collected fromeach of the three replicate tanks for each treatment, both immedi-ately before and shortly after solution renewal, every 3 d over the49-d exposure. Means represent the average concentration amongall three replicate tanks. There were no significant differences inatrazine concentrations among replicate tanks within a treatment(p= 0.485–0.948).
100–120% of nominal (Table 1). Atrazine was notdetectable in the CTR or E2 tanks. There wereno significant differences among replicate tanksfor any of the exposure treatment groups (CTR:p= 0.730; E2:p= 0.333; ATZ-10:p= 0.790; ATZ-100:p= 0.866). The median difference between before-and after-renewal atrazine concentrations was notsignificantly different from 0 for any of the treatments(CTR: p= 0.127; E2:p= 0.061; ATZ-10:p= 0.384;ATZ-100: p= 0.853). Thus, it can be concluded thatconcentrations of atrazine were not depleted duringthe exposures.
3.2. Ultra structural analyses
3.2.1. Control group (CTR)Active spermatogenesis was observed in seminif-
erous tubules. Sertoli cells were associated with eachother or adjacent germ cells by intercellular junc-tions, and various stages of developing germ cells wereorderly distributed in tubules (Fig. 1a and b). Ley-dig cells were observed in the interstitium near theblood vessels (Fig. 4a). Spermatogonia were in small,synchronously developing groups. Each spermatogo-nium contained a single large nucleus with some in-dentations, well developed endoplasmic reticulum andnumerous polysomes. Primary spermatocytes showedchromosome condensation patterns and were identi-fied by the presence of synaptonemal complex indicat-ing crossing over at early prophase of the first meiosis( rveda und( ragen
xposure groups was determined for the biochemarameters and GSI considering possible tank effhich were estimated using the intra-class correla
ICC) derived from a nested analysis of varianceest for significant differences between before-renend after-renewal atrazine concentrations, thearametric Wilcoxin signed-rank test was used to
he hypothesis that the median difference betwog-transformed before-renewal and after-renetrazine concentrations was zero. The criterionignificance in all statistical tests wasp< 0.05.
. Results
.1. Exposure verification
Average atrazine concentration in the ATZnd ATZ-100 treatment tanks were approxima
Fig. 1a). Different stages of spermatids were obses indicated by different shapes ranging from roearlier stage) to elongated (later stage). The aveumber of spermatids was 27.2± 1.7 (mean± S.E.M.)

388 M. Hecker et al. / Aquatic Toxicology 72 (2005) 383–396
Fig. 1. Electron photomicrographs ofX. laevisspermatocytes. Each scale bar on the figures represents 1�m. N: nucleus; Nu: nucleolus; Mi:mitochondria. (a) CTR: primary spermatocyte within Sertoli cell (SC) shown in early prophase in terms of condensing chromatin. Gap junctionscan be seen between the two cells. (b) CTR: intercellular junctions (arrows) among primary spermatocytes and the synaptonemal complexes(Syn) of chromosomes. (c) E2: primary spermatocytes with evenly distributed chromatin and the prominent nucleolus (Nu) within the nucleus(N). (d) ATZ: spermatogonium with large nucleus (N) and prominent nucleolus (Nu) and organelles such as mitochondria (Mi) and ribosomesare present. (e) ATZ: dividing primary spermatocytes at prophase of the first meiosis. Nuclear envelope is already disintegrated with highlycondensed chromosomes (Chr) clearly present.
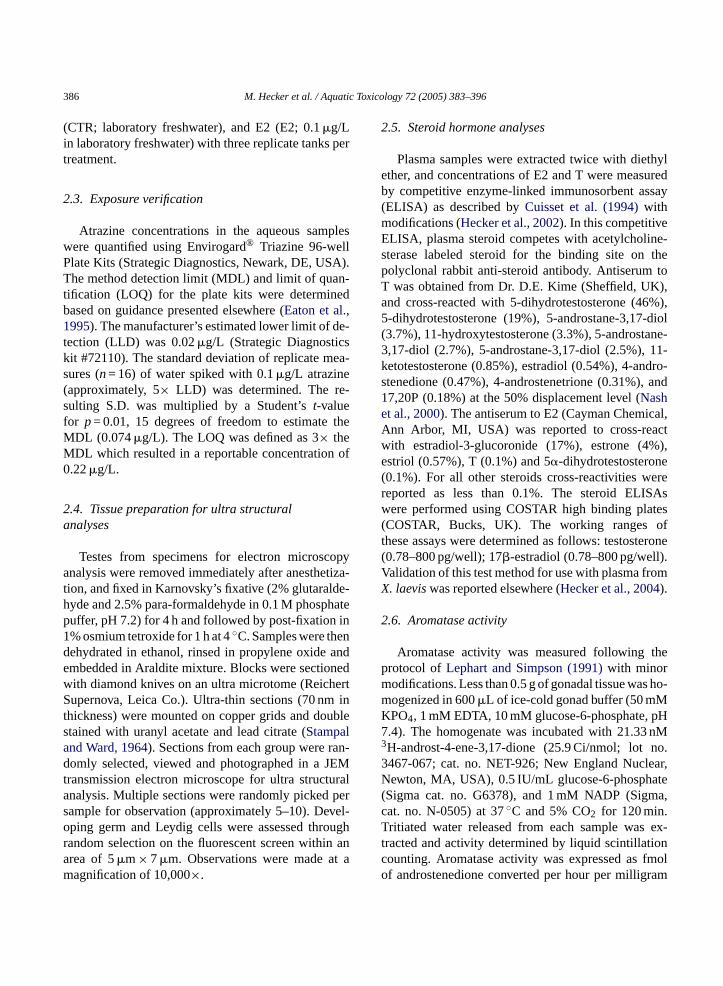
cells within an area of 5�m× 7�m (observed at amagnification of 10,000-fold) (Fig. 2). The heads oflate spermatids were very electron dense. The nuclearmaterial of sperm was condensed to its greatest extent,and the axoneme of the tail showed the typical 9 + 2arrangement of microtubules (Fig. 3a). There wereevenly distributed ribosomes, and Golgi apparati nearthe rounded nuclei, which were electron dense in a ho-mogeneous manner. Mitochondria were elongated. Theorganelles of Leydig cells, which are involved in T pro-duction stood out in the interstitial tissue. Leydig cellscontained oval nuclei with moderate heterochromatin
formation, tubular mitochondria and well-developedsmooth endoplasmic reticulum (Fig. 4a).
3.2.2. Estradiol treatment group (E2)A variety of ultrastructural changes were observed
in the testes of E2-treatedX. laevisrelative to those ofthe controls. Prominent nucleoli and no chromosomecondensation (chromatin evenly distributed throughoutnucleus) could be observed in primary spermatocytes(Fig. 1c). Significantly fewer dividing germ cells, par-ticularly spermatids and sperm, were observed (Fig. 2).In the E2-treated frogs the average number (22.3± 1.5)

M. Hecker et al. / Aquatic Toxicology 72 (2005) 383–396 389
Fig. 2. Average number of sperm per area of 5�m× 7�m (ob-served at a magnification of 10,000-fold) in the control (CTR), estra-diol (E2), and atrazine (ATZ-10, ATZ-100) treatment groups inX.laevis. Number of observations = 12–17 per treatment group. Errorbars = standard error. Letters (a, b) signify tests for statistically sig-nificant differences atp< 0.05 between treatments.
of sperm heads within an area of 5�m× 7�m (ob-served at a magnification of 10,000-fold) was 18%less than that in the control group (27.3± 1.7) (t-test:p= 0.033). Condensation of sperm nuclei of this groupwas incomplete, and vacuoles and inclusion bodies inspermatid and sperm head were increased (Fig. 3b andc). Furthermore, Leydig cells were less differentiatedwhen compared to CTR frogs. There were swellingsand irregularities of the nuclear envelope, and less de-veloped smooth endoplasmic reticulum (Fig. 4b). Also,an increased number of vacuoles and lipid dropletscould be observed in the cytoplasm of Leydig cells(Fig. 4b and c).
3.2.3. Atrazine treatment groups (ATZ-10 andATZ-100)
There were no ultrastructural differences betweencontrol and atrazine-treated frogs. The distribution ofdeveloping germ cells exhibited a pattern similar to thatof the control group. Primary spermatocytes containingcondensed chromosomes with a well-developed synap-tonemal complex were present (Fig. 1d and e). As inthe controls, sperm had a spiral slender nucleus with ahigh electron density (Fig. 3d).
Other cell organelles and constituents of develop-ing germ cells and sperm were also similar to thoseof the CTR group. Leydig cells of the ATZ-10 andATZ-100 treatment groups showed oval nuclei, well de-
veloped smooth endoplasmic reticulum and secretoryvesicles (Fig. 4d). Numbers of sperm heads (ATZ-10:25.4± 1.1; ATZ-100: 24.7± 1.4) were neither signif-icantly different from the controls (t-test:p= 0.38 and0.28, respectively) nor from the E2 treatment group(t-test:p= 0.1 and 0.26, respectively) (Fig. 2).
3.3. Plasma T and E2 concentrations
Exposure to either concentration of atrazine did notsignificantly affected plasma T or E2 concentrationscompared to the controls. Exposure to E2 resultedin significantly lesser concentrations of plasma T(Mann–WhitneyU-test: p< 0.001), and significantlygreater concentrations of plasma E2 (Mann–WhitneyU-test: p< 0.001) when compared to the controls(Fig. 5). The variation in the plasma E2 and Tconcentrations detected among individuals, along withmoderate tank effects, limited statistical power for theavailable sample sizes and increased the magnitude ofdifference between treatments that could be resolvedstatistically. Intra-class correlations associated with thetank effects detected for T and E2 were estimated to beapproximately 0.3. Assuming tank effects and an ICCof 0.3, a power analysis was conducted to determinethe minimum ratio of geometric means that could bedetected with 80% power given the sample sizes usedand variation observed in this study (Table 2).
3.4. Aromatase activity
2 af-f de-t thaty m)t cifica inb fort to be0 -t tiest nks.T el ofdt( tasei oft ana-
Waterborne exposure to neither atrazine nor Eected testicular aromatase activity. Samples withectable aromatase activity were defined as thoseielded activities (in disintegrations per minute; dphat were at least 2-fold greater than the non-spectivity (in dpm) detected for bovine serum albumlanks. Thus, the method detection limit (MDL)
he tritiated water release assay was calculated.22± 0.1 fmol/h/mg protein (mean± S.D.). No tes
icular homogenates from CTR frogs yielded activihat were greater than twice that detected in the blahis suggested that there was no background levetectable aromatase activity in theX. laevistesticular
issue. Exposure to neither 10 nor 100�g atrazine/Lnominal) resulted in detectable activities of aroman adultX. laevistesticular tissue. The performancehe tritiated water release assay was validated by
390 M. Hecker et al. / Aquatic Toxicology 72 (2005) 383–396
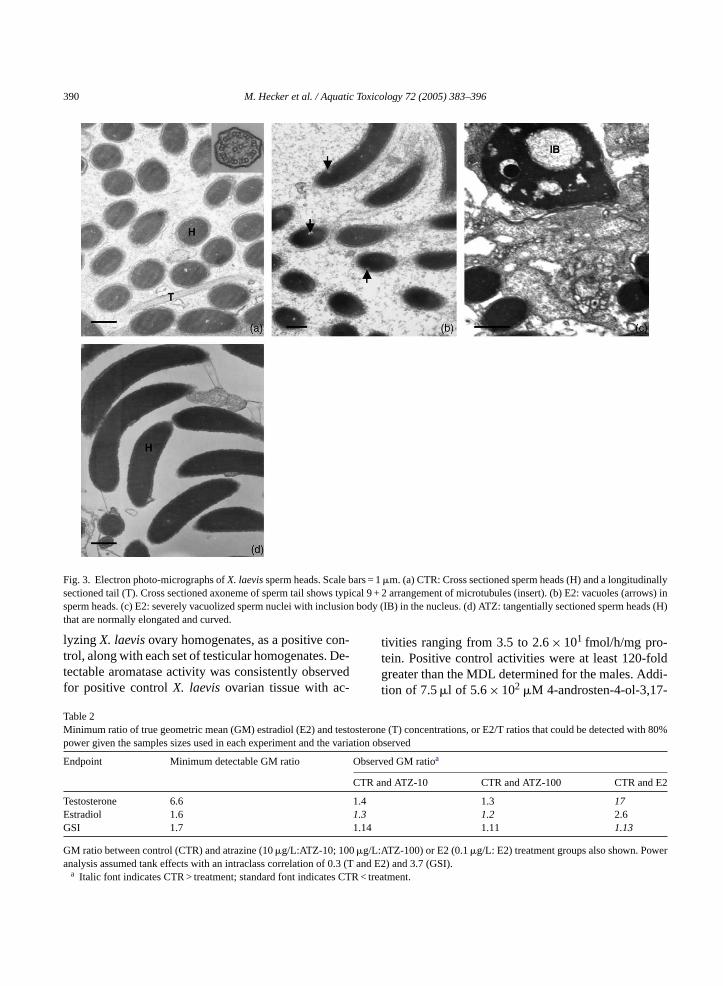
Fig. 3. Electron photo-micrographs ofX. laevissperm heads. Scale bars = 1�m. (a) CTR: Cross sectioned sperm heads (H) and a longitudinallysectioned tail (T). Cross sectioned axoneme of sperm tail shows typical 9 + 2 arrangement of microtubules (insert). (b) E2: vacuoles (arrows) insperm heads. (c) E2: severely vacuolized sperm nuclei with inclusion body (IB) in the nucleus. (d) ATZ: tangentially sectioned sperm heads (H)that are normally elongated and curved.
lyzingX. laevisovary homogenates, as a positive con-trol, along with each set of testicular homogenates. De-tectable aromatase activity was consistently observedfor positive controlX. laevisovarian tissue with ac-
tivities ranging from 3.5 to 2.6× 101 fmol/h/mg pro-tein. Positive control activities were at least 120-foldgreater than the MDL determined for the males. Addi-tion of 7.5�l of 5.6× 10² �M 4-androsten-4-ol-3,17-
Table 2Minimum ratio of true geometric mean (GM) estradiol (E2) and testosterone (T) concentrations, or E2/T ratios that could be detected with 80%power given the samples sizes used in each experiment and the variation observed
Endpoint Minimum detectable GM ratio Observed GM ratioa
CTR and ATZ-10 CTR and ATZ-100 CTR and E2
Testosterone 6.6 1.4 1.3 17Estradiol 1.6 1.3 1.2 2.6GSI 1.7 1.14 1.11 1.13
GM ratio between control (CTR) and atrazine (10�g/L:ATZ-10; 100�g/L:ATZ-100) or E2 (0.1�g/L: E2) treatment groups also shown. Poweranalysis assumed tank effects with an intraclass correlation of 0.3 (T and E2) and 3.7 (GSI).
a Italic font indicates CTR > treatment; standard font indicates CTR < treatment.

M. Hecker et al. / Aquatic Toxicology 72 (2005) 383–396 391
Fig. 4. Electron photo-micrographs of leydig cells ofX. laevis. Each scale bar on the figures represents 1�m. Li: lipid droplets; Mi: mitochandria;N: nucleus (a) CTR: normal Leydig cell. Leydig cell containing the nucleus (N) with moderate heterochromatin, mitochondria with tubularchristae (Mi), lipid droplets (Li) and smooth endoplasmatic reticulum (arrows) in the cytoplasm. (b) E2: part of a Leydig cell. Nuclear (N) outlineis irregular and swollen. Free ribosomes are evenly distributed with few vacuoles (Va) in the cytoplasm. (c) E2: part of a Leydig cell that showsaccumulation of lipid droplets (Li). (d) ATZ: Leydig cells with oval nuclei containing moderate amounts of heterochromatin in the cytoplasm.
dione, a specific, competitive inhibitor of aromatase,reduced the activity to 3.9–7.7% of that observed forhomogenates without inhibitor added. Thus, the assaywas determined to be functional and specific for aro-matase activity.
3.5. GSI
There were some treatment related differences inGSI among tanks. Frogs from both ATZ treatmentgroups had GSIs that were significantly greater thanthat observed for E2-treated frogs (t-test: ATZ-10:p= 0.003; ATZ-100:p= 0.007;Fig. 6). Median GSIs ofE2-treated frogs were slightly less (0.25%) than those
in the controls (0.28%) although this difference wasnot statistically significant (t-test: p= 0.145;Fig. 6).No statistically significant differences between theGSIs of ATZ-100 treated (0.29%) and CTR (0.27%)X.laeviswere observed (t-test:p= 0.195;Fig. 6). How-ever, the mean GSI ofX. laevistreated with 10�g/Latrazine were significantly greater than the mean GSIof controls (t-test:p= 0.046;Fig. 6). Here, the differ-ence between upper (90th) and lower (10th) centileranged from 3.1-fold (E2) to 1.8-fold (CTR, ATZ-10).Intra-class correlations associated with the tank effectsdetected for GSI were estimated to be approximately0.37 indicating that moderate tank effects haveoccurred.

392 M. Hecker et al. / Aquatic Toxicology 72 (2005) 383–396
Fig. 5. Geometric mean plasma testosterone (T) (top) and estradiol(E2) (bottom) concentrations detected in adult maleX. laevisexposedto control water (CTR), 10 or 100�g/L atrazine (ATZ-10, ATZ-100),or 0.1�g/L estradiol (E2).n= 6–8 frogs per tank, 18–19 frogs pertreatment. Error bars = standard error. Letters (a, b) signify tests forstatistically significant differences atp< 0.05 between treatments.
The ratio of geometric means that would be con-sistently detectable with 80% power given the samplesizes used and variation observed in this study was 1.7(Table 2).
4. Discussion
In the current study environmentally relevant con-centrations of atrazine did not alter the ultra structureof testicular cells, plasma concentrations of T or E2,or testicular aromatase activity in adult maleX. laevis.There was a slight increase in gonad growth as ex-pressed by the GSI, in atrazine-exposed frogs. In con-
Fig. 6. Mean gonadal somatic index (GSI) for adult maleX. laevisex-posed to 10 or 100�g/L atrazine (ATZ-10, ATZ-100), control water(CTR), or 0.1�g/L estradiol (E2).n= 20–21. Error bars = standarderror. Letters (a–c) signify tests for statistically significant differencesatp< 0.05 between treatments.
trast, exposure to E2, used as a positive control, resultedin significant changes at the sub-cellular, biochemical,and tissue level inX. laevis.
Ultra structural characteristics of control grouptestes were similar to those reported for amphibians(summarized inManochantr et al., 2003) and otherlower vertebrates such as spotted ray (Prisco et al.,2002). The presence of various stages of male germcells and the association of Sertoli cells with each otheror adjacent germ cells indicate that the animals wereundergoing active spermatogenesis (Manochantr et al.,2003). Interstitial Leydig cells exhibited the typicalorganization of steroid-secreting cells containing eu-chromatin in the nucleus, tubular mitochondria and awell-developed smooth endoplasmic reticulum indicat-ing active T production (Prisco et al., 2002).
The lesser development of spermatids and spermcells in the E2-exposed group indicates that E2 delaysor inhibits maturation of male germ cells inX. laevis.It has been reported for different species of laboratoryrodents that E2 inhibited the function of Leydig cell(Jones et al., 1978) and spermatogenesis (Toyama etal., 2001), or induced the formation of Leydig cell tu-mors (Yasuda et al., 1986; Maeda et al., 2002). Sincethe primary function of Leydig cells is the productionof T to regulate spermatogenesis, the less condensednuclei of sperm, less differentiated Leydig cells, andmore lipid droplets that were observed in the E2 groupsuggest abnormalities in spermatogenesis that may be

M. Hecker et al. / Aquatic Toxicology 72 (2005) 383–396 393
due to inhibition of T production (Blanco et al., 2001;Islinger et al., 2003). Leydig cells generally containlipid droplets as a storage site of cholesterol, which isthe precursor of T. These droplets normally disappearwhen production of T increases during the reproduc-tive cycle (Prisco et al., 2002). Increases in the numberand size of lipid droplets, therefore, indicate either anincrease in cholesterol production or, more likely, a de-crease in steroidogenic activity resulting in a decreaseof the end products such as T. This was confirmed by thesignificantly lesser plasma T concentrations observedin the same frogs when they were exposed to exogenousE2.
One possible explanation for the reciprocal rela-tionship between plasma T and E2 titers would bean induction of aromatase activity, the enzyme thattransforms T to E2. It has been reported previously thatexposure to E2 can induce gene expression of testiculararomatase activity in fish in a dose-response dependentmanner (Halm et al., 2002). However, measures ofaromatase activity conducted in our study did notreveal any significant alterations in the enzyme activityin the testis, indicating that there was no increasedendogenous formation of E2. Although it cannot beexcluded that changes in testicular aromatase activityless than the method detection limit have occurred, it isvery unlikely that such minute activities, which weremore than 120-fold lower than those reported for fe-males, would have any biological relevance or result inthe increase of endogenous E2 observed in this study.T con-c 2t s E2p ac-c ,1
yteswe malc be-t mei-o ivi-s no sedg er-m nif-i rtedi ac-
uoles in sperm heads is considered an indicator of thefailure of the concentration of chromatin. Vacuolatedsperm heads and incomplete chromosome condensa-tion were previously associated with apoptotic pro-cesses in mammals (Gandini et al., 2000), offering anadditional explanation for decreased sperm head num-bers in the E2-treated animals. A different study onzebrafish (Danio rerio) that were exposed to the syn-thetic estrogen 17�-ethinylestradiol (25 ng/L) foundincreased phagocytosis of sperm cells by Sertoli cellsin the testes as a result of this exposure (Islinger etal., 2003). Although no direct observations of phagocy-totic activities of Sertoli cells were made in our study,sub-cellular indicators of autolytic activities such asvacuoled sperm heads and incomplete chromosomecondensation were observed. These effects on germ celldevelopment were also reflected by the slightly lowerGSI in the E2-treated frogs compared to all other treat-ments, although this was not statistically significant forthe controls. This lack of significance might be due tothe exposure time of the experiment that was designedto capture effects on the sub-cellular structural and bio-chemical level, and was likely to be too short to captureeffects on growth and/or development. An additionalreason for the lack of significance may be the relativelylow power to determine a true ratio of geometric meansthat would be close to that observed in our study.
For logistical reasons, no ethanol control groupwas tested in this experiment, and therefore, potentialeffects of the solvent cannot be totally excluded forE andci ates( coer izede thiss
rolsw iouss atinga xhib-i risticfc emalc thati gea l for
hus, we conclude that the increase of plasma E2entrations observed in maleX. laevisexposed to Ereatment is not a function of increased endogenouroduction but is likely due to other factors such asumulation of E2 from the test solution (Kramer et al.998).
Synaptonemal complexes of primary spermatocere less frequently observed in testes ofX. laevisxposed to E2 than in the control. The synaptoneomplex is the formation of a proteinaceous ribbonween homologous chromosomes during the firsttic division that is essential for successful cell dion (Von Wettstein, 1984). Therefore, the observatiof fewer synaptonemal complexes in the E2-exporoup is indicative of poor division of primary spatocytes, which subsequently resulted in the sig
cant decrease of the number of sperm cells repon this study. Also, the occurrence of nuclear v
2-exposed animals. However, the physiologicalellular responses of the E2-treatedX. laevisare sim-lar to those reported in studies with other vertebre.g. Crain et al., 1997; Kramer et al., 1998; Blant al., 2001; Islinger et al., 2003), indicating that E2epresents a valid positive control for the hypothesstrogenic effects of atrazine that were tested intudy.
No changes in ultra structure relative to the contere observed in frogs exposed to atrazine. Vartages of developing germ cells were present indicctive spermatogenesis. Primary spermatocytes e
ted a chromosome condensation pattern characteor early meiotic stages (Reed and Stanley, 1972) andould be identified by the presence of the synaptonomplex that was present at a frequency similar ton the controls. This complex is indicative of the linkand crossing over during first meiosis, and is typica

394 M. Hecker et al. / Aquatic Toxicology 72 (2005) 383–396
normal developing germ cells (Von Wettstein, 1984).The primary function of Leydig cells is the productionof androgens such as T to regulate spermatogenesis.As in the controls, a smaller size and/or lower numbersof lipid droplets were observed as compared to the E2-treated frogs in both atrazine-treatment groups duringthe process of spermatogenesis, indicating active pro-duction of T. This was confirmed by similar plasma Tconcentrations in both ATZ treatments and the CTRgroup. Based on the relatively low power to determinesignificant differences between plasma hormone con-centrations in atrazine treated and control frogs it can-not be ruled out entirely that there have been someminor influences of atrazine treatment on plasma E2or T. However, given the similarities in terms of av-erage hormone concentrations and within group vari-abilities it is unlikely that these – if present – would beof any biological relevance. Also, there was no nega-tive effect on gonad growth in frogs exposed to either10 or 100�g atrazine/L. This indicates normal devel-opment of the testis when compared to the E2-treatedfrogs. Exposure to 10�g/L atrazine resulted in a statis-tically significant greater GSI compared to CTR frogs.Similarly, Hecker et al. (2004)observed greater GSIvalues inX. laeviscaught from an area with elevatedaqueous atrazine concentrations. The authors hypoth-esized that the increase in relative gonad mass mighthave been due to better food availability in nutrient-richfarm ponds. However, in the study on which we reporthere there was no difference in the feeding regime oft note onf
5
e toE thet inleo thisso tionr asei Ther s. If
there were any effects of atrazine on the testis they wereweak and not related to changes in plasma sex steroidtiters or aromatase activity. The greatest concentrationtested (100�g atrazine/L) in this study was greater thanmost concentrations of atrazine that are observed in theenvironment, even directly after its application whenatrazine levels are the greatest (Giddings et al., 2000).Therefore, we conclude that it is unlikely that atrazineexposure leads to alterations of the endocrine systemin adult maleX. laevisthat are comparable to thoseevoked by exposure to estrogen.
Acknowledgements
We thank A. Hosmer for many helpful commentson experimental design. We also thank C. Bens, R.Bruce, S. Williamson, and K. Harris. This researchwas facilitated by the Atrazine Endocrine EcologicalRisk Assessment Panel, Ecorisk Inc., Ferndale, WAand sponsored by Syngenta Crop Protection Inc.
References
Ankley, G., Mihaich, E., Stahl, R., Tillitt, D., Colborn, T., McMaster,S., Miller, R., Bantle, J., Dickerson, R., Fry, M., Giesy, J.P., Gray,L.E., Guiney, P., Hutchinson, T., Kramer, V., Leblanc, G., Mayes,M., Nimrod, A., Peterson, R., Purdy, R., Ringer, R., Thomas, P.,Vander Kraak, G., Zacharewski, T., 1998. Overview of a work-shop on screening methods for detecting potential (anti-) estro-
m.
B rde,ydigi. 71,
B , D.,G.,sities.
C viron-am-
l. 4),
C .J.,K.R.,
al and5.
C es,, G.,
he frogs from the different treatments, but we canxclude possible effects of low ATZ concentrationsood availability.
. Conclusions
The results of this study showed that exposur2, but not atrazine, affected the ultra structure of
estes as well as plasma hormone concentrationsX.aevis. It was hypothesized in a previous study (Hayest al., 2002) that atrazine at a concentration (25�g/mL,nly single dose tested) similar to those tested intudy affect the endocrine system ofX. laevis(exposedver 46 days) via an estrogen-like mechanism of acesulting in a depletion of plasma T, and an incren plasma E2 due to up-regulation of aromatase.esults of our study do not support this hypothesi
genic/androgenic chemicals in wildlife. Environ. Toxicol. Che17, 68–87.
lanco, A., Aguera, E., Flores, R., Artacho-Perula, E., MonteJ.G., 2001. Morphological and quantitative study of the Lecells of pigs fed anabolic doses of clenbuterol. Res. Vet. Sc85–91.
urkhart, J.G., Helgen, J.C., Fort, D.J., Gallagher, K., BowersPropst, T.L., Gernes, M., Magner, J., Shelby, M.D., Lucier,1998. Induction of mortality and malformation inXenopus laeviembryos by water sources associated with field frog deformEnviron. Health Perspect. 106, 841–848.
arey, C., Bryant, C.J., 1995. Possible interactions among enmental toxicants, amphibian development, and decline ofphibian populations. Environ. Health Perspect. 103 (Supp13–17.
arr, J.A., Gentles, A., Smith, E.E., Goleman, W.L., Urquidi, LTheutt, K., Kendall, R.J., Giesy, J.P., Gross, T.S., Solomon,Van Der Kraak, G., 2003. Response of larvalXenopus laevistoatrazine: assessment of growth, metamorphosis, and gonadlaryngeal morphology. Environ. Toxicol. Chem. 22, 396–40
oady, K.K., Murphy, M.B., Villeneuve, D.L., Hecker, M., JonP.D., Carr, J.A., Solomon, K.R., Smith, E.E., Van Der Kraak
M. Hecker et al. / Aquatic Toxicology 72 (2005) 383–396 395
Kendall, R.J., Giesy, J.P., 2004. Effects of atrazine on metamor-phosis, growth, and gonadal development in the green frog (RanaClamitans). J. Toxicol. Environ. Health Part A 67, 941–957.
Coady, K.K., Murphy, M.B., Villeneuve, D.L., Hecker, M., Carr,J.A., Solomon, K.R., Van der Kraak, G., Smith, E.E., Kendall,R.J., Giesy, J.P., in press. Effects of atrazine on metamorphosis,growth, laryngeal and gonadal development, aromatase activity,and sex steroid concentrations inXenopus laevis. Ecotoxiol. En-viron. Saf.
Crain, D.A., Guillette Jr., L.J., Rooney, A.A., Pickford, D.B., 1997.Alterations in steroidogenesis in alligators (Alligator mississip-piensis) exposed naturally and experimentally to environmentalcontaminants. Environ. Health Perspect. 105, 528–533.
Cuisset, B., Pradelles, P., Kime, D.E., Kuehn, E.R., Babin, P.,Davail, S., Le Menn, F., 1994. Enzyme immunoassay for 11-ketotestosterone using acetylcholinesterase as label: applicationto the measurement of 11-ketotestosterone in plasma of Siberiansturgeon. Comp. Biochem. Physiol., C: Pharmacol. Toxicol. En-docrinol. 108, 229–241.
Eaton, A.D., Clesceri, L.S., Greenberg, A.E. (Eds.), 1995. StandardMethods for the Examination of Water and Wastewater, 19thed. American Public Health Association, Washington, DC, USA(Section 1030 Data Quality).
Gandini, L., Lombardo, F., Paoli, D., Caponecchia, L., Familiari, G.,Verlengia, C., Dondero, F., Lenzi, A., 2000. Study of apoptoticDNA fragmentation in human spermatozoa. Hum. Reprod. 15,830–839.
Gardiner, D.M., Hoppe, D.M., 1999. Environmentally induced limbmalformations in mink frogs (Ranaseptentrionalis). J. Exp. Zool.284, 802–804.
Gray, L.E., Klece, W.R., Wiese, T., Tyl, R., Gaido, K., Cook, J.,Klinefelder, G., Desaulniers, D., Wilson, E., Zacharewski, T.,Waller, C., Foster, P., Lasky, J., Reel, J., Giesy, J.P., Laws, S.,McLachlan, J., Breslin, W., Cooper, R., DiGiulio, R., Johnson, R.,Purdy, R., Mihaich, E., Safe, S., Sonnenschein, C., Weshons, W.,
ning
G .J.,aticc ap--00.
H , J.P.,17rain
H tu-ogsrel-
H 02.od-
36,
H J.A.,.J.,
du Preez, L., 2004. Plasma sex steroid concentrations and go-nadal aromatase activities in cfrican clawed frogs (Xenopus lae-vis) from the corn-growing region of South Africa. Environ. Tox-icol. Chem. 23.
Heneweer, M.M., Van den Berg, M., Sanderson, J.T., 2003. A com-parison of human H295R and rat R2C cell lines as in vitro screen-ing tools for effects on aromatase. Toxicol. Lett. 146, 183–194.
Hopenhayn-Rich, C., Stump, M.L., Browning, S.R., 2002. Regionalassessment of atrazine exposure and incidence of breast and ovar-ian cancers in Kentucky. Arch. Environ. Contam. Toxicol. 42,127–136.
Islinger, M., Willinski, D., Volkl, A., Braunbeck, T., 2003. Effectsof 17�-ethinylestradiol on the expression of three estrogen-responsive genes and cellular ultrastructure of liver and testesin male zebrafish. Aquat. Toxicol. 62, 85–103.
Jones, T.M., Fang, V.S., Landau, R.L., Rosenfield, R., 1978. Directinhibition of Leydig cell function by estradiol. Clin. Endocrionol.Metab. 47, 1368–1373.
Kaiser, J., 1997. Deformed frogs leap into spotlight at health work-shop. Science 284, 802–804.
Kavlock, R.J., Daston, G.P., DeRosa, C., Fenner-Crisp, P., Gray, L.E.,Kaattari, S., Lucier, G., Luster, M., Mac, M.J., Maczka, C., Miller,R., Moore, J., Rolland, R., Scott, G., Sheehan, D.M., Sinks, T.,Tilson, H.A., 1996. Research needs for the risk assessment ofhealth and environmental effects of endocrine disruptors: a reportof the USEPA-sponsored workshop. Environ. Health Perspect.104, 715–740.
Kavlock, R.J., 1998. What’s happening to our frogs. Environ. HealthPerspect. 106, 773–774.
Kizilay, G., Uygun, M., 2003. Effects of estrogen on ultrastruc-ture of testis germinal epithelium in Wistar rats. Biologia 58,1015–1022.
Kramer, V.J., Miles-Richardson, S., Pierens, S., Giesy, J.P., 1998.Reproductive impairment and induction of alkaline-labile phos-phate, a biomarker of estrogen exposure, in fathead minnows
.
L ty. In:logy.
M N.,recur-my.
M ., Sob-tige-
N ., Leor-
cations
P P.,the
Miller, R., McMaster, S., Colborn, T., 1997. Endocrine screemethods. Reproduct. Toxicol. 11, 719–750.
iddings, J.M., Anderson, T.A., Hall, L.W.J., Kendall, RRichards, R.P., Solomon, K.R., Williams, W.M., 2000. Aquecological risk assessment of Atrazine—a tiered probabilistiproach. A Report of an Expert Panel. Technical Report 709Novartis Crop Protection, Greensboro, NC, USA.
alm, S., Pounds, N., Maddix, S., Rand-Weaver, M., SumpterHutchinson, T.H., Tyler, C.R., 2002. Exposure to exogenous�-oestradiol disrupts P450aromB mRNA expression in the band gonad of adult fathead minnows (Pimephales promelas).Aquat. Toxicol. 60, 285–299.
ayes, T.B., Collins, A., Lee, M., Mendoza, M., Noriega, N., Sart, A.A., Vonk, A., 2002. Hermaphroditic, demasculinized frafter exposure to the herbicide, atrazine, at low ecologicallyevant doses. Proc. Natl. Acad. Sci. U.S.A. 99, 5476–5480.
ecker, M., Tyler, C.R., Hoffmann, M., Maddix, S., Karbe, L., 20Plasma biomarkers in fish provide evidence for endocrine mulation in the Elbe River, Germany. Environ. Sci. Technol.2311–2321.
ecker, M., Giesy, J.P., Jones, P.D., Jooste, A.M., Carr,Solomon, K.R., Smith, E.E., Van Der Kraak, G., Kendall, R
(Pimephales promelas) exposed to waterborne 17�-estradiolAquatic. Toxicol. 40, 335–360.
ephart, E.D., Simpson, E.R., 1991. Assay for aromatase activiWaterman, M.R., Johnson, E.F. (Eds.), Methods of EnzymoAcademic Press, New York, NY, USA, pp. 477–483.
aeda, T., Itoh, N., Kobayashi, K., Takahashi, A., Masumori,Tsukamoto, T., 2002. Elevated serum estradiol suggestingrence of Leydig cell tumor mine after years radial orchiectoInt. J. Urol. 9, 659–661.
anochantr, S., Sretarugsa, P., Wanichanon, C., Chavadej, Jhon, P., 2003. Classification of spermatogenic cells in Ranarina based on ultrastructure. Sci. Asia 29, 241–254.
ash, J.P., Davail-Cuisset, B., Bhattacharyya, S., Suter, H.CMenn, F., Kime, D.E., 2000. An enzyme linked immunosbant assay (ELISA) for T, estradiol, and 17,20�-dihydroxy-4-pregnen-3-one using acetylcholinesterase as tracer: applito measurement of diel patterns in rainbow trout (Oncorhynchumykiss). Fish Physiol. Biochem. 22, 255–263.
risco, M., Liguoro, A., D’Onghia, B., Ricchiari, L., Andreuccetti,Angelini, F., 2002. Fine structure of Leydig and Sertoli cells intestis of immature and mature spotted rayTorpedo marmorata.Mol. Reprod. Dev. 63, 192–201.

396 M. Hecker et al. / Aquatic Toxicology 72 (2005) 383–396
Reed, S.C., Stanley, H.P., 1972. Fine structure of spermatogenesis inthe South African clawedXenopus laevisDaudin. J. Ultrastruct.Res. 41, 277–295.
Sanderson, J.T., Seinen, W., Giesy, J.P., Van den Berg, M., 2000. 2-Chloro-s-triazine herbizides induce aromatase activity in H295Rhuman adreno cortical carcinoma cells. A novel mechanism forestrogenicity. Toxicol. Sci. 54, 127.
Stampal, J.G., Ward, R.T., 1964. An improvement staining methodfor electron microscopy. J. Cell Biol. 22, 697–701.
Stebbins, R.C., Cohen, N.W., 1995. Declining amphibians. In: A Nat-ural History of Amphibians. Princeton University Press, Prince-ton, NJ, USA, pp. 210–251.
Toyama, Y., Hosoi, I., Ichikawa, S., Maruoka, M., Yashiro, E., Ito, H.,Yuasa, S., 2001.�-Estradiol 3-benzoate affects spermatogenesisin the adult mouse. Mol. Cell. Endocrinol. 178, 161–168.
Von Wettstein, D., 1984. The synaptonemal complex and geneticsegregation. In: Evans, C.W., Dickinson, H.G. (Eds.), ControllingEvents in Meiosis. Cambridge University Press, Cambridge, pp.195–231.
Weller, W.F., Green, D.M., 1997. Checklist and current status ofCanadian amphibians. Herpetol. Conserv. 1, 309–328.
Yasuda, Y., Konish, H., Tanimura, T., 1986. Leydig cell hyperplasiain fetal mice transplacentally with ethinyl estradiol. Teratology33, 281–288.