planning and prospects for renewable power: west africa · use of all forms of renewable energy,...
TRANSCRIPT

Planning and prospects for renewable power:
WEST AFRICA
2018

Copyright © IRENA 2018
Unless otherwise stated, material in this publication may be freely used, shared, copied, reproduced, printed and/or stored, provided that appropriate acknowledgement is given to IRENA as the source and copyright holder. Material in this publication that is attributed to third parties may be subject to separate terms of use and restrictions, and appropriate permissions from these third parties may need to be secured before any use of such material.
ISBN: 978-92-9260-081-5
This report is also available in a French-language edition, Planification et perspectives pour les énergies renouvelables: Afrique de l’Ouest (978-92-9260-082-2).
Report citation: IRENA (2018), IRENA Planning and prospects for renewable power: West Africa, International Renewable Energy Agency, Abu Dhabi.
ACKNOWLEDGEMENTS
The report draws upon discussions and inputs developed over two in-depth SPLAT-W training sessions held in Dakar, Senegal, in December 2015 and January 2016, as part of a six-month capacity development programme organised by IRENA and the ECOWAS Centre for Renewable Energy and Energy Efficiency (ECREEE), in collaboration with the International Atomic Energy Agency (IAEA) and the United Nations Framework Convention on Climate Change (UNFCCC). The sessions were attended by experts from planning offices in ministries, electric utilities and specialised agencies from Benin, Burkina Faso, Cabo Verde, Gambia, Guinea, Liberia, Niger, Senegal, Sierra Leone, and Togo. A full list of expert participants can be found at the back of this report.
IRENA is grateful to those experts for permitting the use of their national models in this regional analysis. The national models have been altered to some extent, so that the results presented here do not necessarily reflect the national experts’ original analysis.
The report was developed under the guidance of Asami Miketa (IRENA) and drafted by Daniel Russo (IRENA) in close collaboration with Bruno Merven (Energy Research Centre, University of Cape Town, South Africa), who conducted major development work with IRENA on the System Planning Test model for Western Africa (SPLAT-W) and provided modelling support. Anjana Das (VITO) contributed to the development of an earlier version of the SPLAT-W model.
Valuable review and consultation were also provided by Hannes Bauer (ECREEE); Debabrata Chattopadhyay, Samuel Oguah and Fernando de Sisternes (World Bank); and IRENA colleagues Safiatou Alzouma, Nopenyo Dabla, Paul Komor, Thomas Nikolakakis, Sakari Oksanen and Tijana Radojicic.
For further information or to provide feedback: [email protected]
This report is available for download: www.irena.org/publications
DISCLAIMERThis publication and the material herein are provided “as is”. All reasonable precautions have been taken by IRENA to verify the reliability of the material in this publication. However, neither IRENA nor any of its officials, agents, data or other third-party content providers provide a warranty of any kind, either expressed or implied, and they accept no responsibility or liability for any consequence of use of the publication or material herein.
The information contained herein does not necessarily represent the views of the Members of IRENA. The mention of specific companies or certain projects or products does not imply that they are endorsed or recommended by IRENA in preference to others of a similar nature that are not mentioned. The designations employed and the presentation of material herein do not imply the expression of any opinion on the part of IRENA concerning the legal status of any region, country, territory, city or area or of its authorities, or concerning the delimitation of frontiers or boundaries.
Photographs are from Shutterstock unless otherwise indicated.
About IRENA
The International Renewable Energy Agency (IRENA) is an intergovernmental organisation that supports countries in their transition to a sustainable energy future and serves as the principal platform for international co-operation, a centre of excellence, and a repository of policy, technology, resource and financial knowledge on renewable energy. IRENA promotes the widespread adoption and sustainable use of all forms of renewable energy, including bioenergy, geothermal, hydropower, ocean, solar and wind energy, in the pursuit of sustainable development, energy access, energy security and low-carbon economic growth and prosperity.
www.irena.org

•3 •WEST AFRIC A
Figures . . . . . . . . . . . . . . . . . . . . . . . . . . . . . . . . . . . . . . . . . . . . . . . . . . . . . . . . . . . . . . 5
Boxes . . . . . . . . . . . . . . . . . . . . . . . . . . . . . . . . . . . . . . . . . . . . . . . . . . . . . . . . . . . . . . . 6
Tables . . . . . . . . . . . . . . . . . . . . . . . . . . . . . . . . . . . . . . . . . . . . . . . . . . . . . . . . . . . . . . . 7
Abbreviations . . . . . . . . . . . . . . . . . . . . . . . . . . . . . . . . . . . . . . . . . . . . . . . . . . . . . . . . 8
Units of measurement . . . . . . . . . . . . . . . . . . . . . . . . . . . . . . . . . . . . . . . . . . . . . . . . . 9
Executive summary . . . . . . . . . . . . . . . . . . . . . . . . . . . . . . . . . . . . . . . . . . . . . . . . . . 10
Introduction . . . . . . . . . . . . . . . . . . . . . . . . . . . . . . . . . . . . . . . . . . . . . . . . . . . . . . . . 15
1.1 Background . . . . . . . . . . . . . . . . . . . . . . . . . . . . . . . . . . . . . . . . . . . . . . . . . . . . . . . . . . . . 15
1.2 This report . . . . . . . . . . . . . . . . . . . . . . . . . . . . . . . . . . . . . . . . . . . . . . . . . . . . . . . . . . . . . . 16
Overview of methodology . . . . . . . . . . . . . . . . . . . . . . . . . . . . . . . . . . . . . . . . . . . . 19
Scenario assumptions . . . . . . . . . . . . . . . . . . . . . . . . . . . . . . . . . . . . . . . . . . . . . . . . 23
3.1 General definition of scenarios . . . . . . . . . . . . . . . . . . . . . . . . . . . . . . . . . . . . . . . . . . . .23
3.2 Overall assumptions . . . . . . . . . . . . . . . . . . . . . . . . . . . . . . . . . . . . . . . . . . . . . . . . . . . . .25
3.3 Electricity demand . . . . . . . . . . . . . . . . . . . . . . . . . . . . . . . . . . . . . . . . . . . . . . . . . . . . . .26
3.4 Local transmission and distribution . . . . . . . . . . . . . . . . . . . . . . . . . . . . . . . . . . . . . . . 30
3.5 Renewable resource potential . . . . . . . . . . . . . . . . . . . . . . . . . . . . . . . . . . . . . . . . . . . . .33
3.6 Fuel availability and prices . . . . . . . . . . . . . . . . . . . . . . . . . . . . . . . . . . . . . . . . . . . . . . . .33
3.7 Electricity generation options . . . . . . . . . . . . . . . . . . . . . . . . . . . . . . . . . . . . . . . . . . . . .35
3.8 Cross-border trade . . . . . . . . . . . . . . . . . . . . . . . . . . . . . . . . . . . . . . . . . . . . . . . . . . . . . .47
3.9 Constraints related to system and unit operation . . . . . . . . . . . . . . . . . . . . . . . . . . . 48
1
2
3
CONTENTS

• 4 • PL ANNING AND PROSPEC TS FOR RENE WABLE POWER
Modelling results . . . . . . . . . . . . . . . . . . . . . . . . . . . . . . . . . . . . . . . . . . . . . . . . . . . . 51
4.1 Reference Scenario . . . . . . . . . . . . . . . . . . . . . . . . . . . . . . . . . . . . . . . . . . . . . . . . . . . . . . 51
4.2 Renewable target scenarios . . . . . . . . . . . . . . . . . . . . . . . . . . . . . . . . . . . . . . . . . . . . . .55
Conclusions . . . . . . . . . . . . . . . . . . . . . . . . . . . . . . . . . . . . . . . . . . . . . . . . . . . . . . . . . 69
References . . . . . . . . . . . . . . . . . . . . . . . . . . . . . . . . . . . . . . . . . . . . . . . . . . . . . . . . . . 71
Appendices . . . . . . . . . . . . . . . . . . . . . . . . . . . . . . . . . . . . . . . . . . . . . . . . . . . . . . . . . 73
Appendix A. Detailed demand data . . . . . . . . . . . . . . . . . . . . . . . . . . . . . . . . . . . . . . . . . . . .73
Appendix B. Detailed power plant assumptions . . . . . . . . . . . . . . . . . . . . . . . . . . . . . . . . .74
Appendix C. Generic technology parameters . . . . . . . . . . . . . . . . . . . . . . . . . . . . . . . . . . . .85
Appendix D. Detailed transmission data . . . . . . . . . . . . . . . . . . . . . . . . . . . . . . . . . . . . . . . . 91
Appendix E. Select regional results by scenario . . . . . . . . . . . . . . . . . . . . . . . . . . . . . . . . 94
Appendix F. Detailed build plan in the National Renewable Targets Scenario . . . . . . . .95
Appendix G. Detailed country dispatch in 2030 in the National Renewable Targets Scenario . . . . . . . . . . . . . . . . . . . . . . . . . . . . . . . . . . . . . . 101
4
5
CONTENTS
•5 •WEST AFRIC A
Figure 1 Electricity capacity in Reference, Regional Target and National Targets Scenarios . . . . . . . . . . . . . . .12
Figure 2 Country power sector model structure . . . . . . . . . . . . . . . . . . . . . . . . . . . . . . . . . . . . . . . . . . . . . . . . . . . . 21
Figure 3 Secondary electricity demand projections, 2015–2030, by country (GWh) . . . . . . . . . . . . . . . . . . . . . 27
Figure 4 Final electricity demand projections, 2015–2030, by sector (GWh) . . . . . . . . . . . . . . . . . . . . . . . . . . . . 28
Figure 5 Daily time slice aggregation . . . . . . . . . . . . . . . . . . . . . . . . . . . . . . . . . . . . . . . . . . . . . . . . . . . . . . . . . . . . . . 28
Figure 6 Example of sector-specific load profiles: modelled Côte d’Ivoire demand, 2015 . . . . . . . . . . . . . . . . . 29
Figure 7 Fuel price projections . . . . . . . . . . . . . . . . . . . . . . . . . . . . . . . . . . . . . . . . . . . . . . . . . . . . . . . . . . . . . . . . . . . . 35
Figure 8 Country-level detail on technical potential (MW) by suitability category: Example of solar PV in Benin . . . . . . . . . . . . . . . . . . . . . . . . . . . . . . . . . . . . . . . . . . . . . . . . . . . . . . . . . . . . . 39
Figure 9 Selection of representative resource locations using suitability maps on IRENA’s Global Atlas: Example of solar PV in Benin . . . . . . . . . . . . . . . . . . . . . . . . . . . . . . . . . . . . . . . . . . . . . . . . . . . . . . . . . . . . .40
Figure 10 Example of SPLAT-W hourly solar PV and wind generation profiles: Benin . . . . . . . . . . . . . . . . . . . . . 42
Figure 11 Overnight investment cost assumptions for generic non-renewable technologies . . . . . . . . . . . . . . 43
Figure 12 Overnight investment cost assumptions for generic renewable technologies . . . . . . . . . . . . . . . . . . . 44
Figure 13 LCOE: Distribution of 97 site-specific large hydropower projects . . . . . . . . . . . . . . . . . . . . . . . . . . . . . 46
Figure 14 Electricity production shares in the Reference Scenario. . . . . . . . . . . . . . . . . . . . . . . . . . . . . . . . . . . . . . 51
Figure 15 Electricity production in the Reference Scenario . . . . . . . . . . . . . . . . . . . . . . . . . . . . . . . . . . . . . . . . . . . . 52
Figure 16 Electricity capacity in the Reference Scenario . . . . . . . . . . . . . . . . . . . . . . . . . . . . . . . . . . . . . . . . . . . . . . 52
Figure 17 Evolution of existing capacity mix . . . . . . . . . . . . . . . . . . . . . . . . . . . . . . . . . . . . . . . . . . . . . . . . . . . . . . . . . 53
Figure 18 New capacity additions under the Reference Scenario . . . . . . . . . . . . . . . . . . . . . . . . . . . . . . . . . . . . . . . 54
Figure 19 Electricity capacity in Reference, Regional Target and National Targets Scenarios . . . . . . . . . . . . . . 56
Figure 20 Electricity production in Reference, Regional Target and National Targets Scenarios . . . . . . . . . . . . 56
Figure 21 Solar PV, wind and biomass capacity in Reference, Regional Target and National Targets Scenarios . . . . . . . . . . . . . . . . . . . . . . . . . . . . . . . . . . . . . . . . . . . . . . . . . . . . . . . . . . . . . . . 57
Figure 22 Electricity production shares by country (2015–2030) in Reference, Regional Target and National Targets Scenario . . . . . . . . . . . . . . . . . . . . . . . . . . . . . . . . . . . . . . . . . . . . . 58
Figure 23 New capacity additions under the National Targets Scenario . . . . . . . . . . . . . . . . . . . . . . . . . . . . . . . . . 59
Figure 24 New solar PV capacity additions under the National Targets Scenario . . . . . . . . . . . . . . . . . . . . . . . . . 60
FIGURES

•6 • PL ANNING AND PROSPEC TS FOR RENE WABLE POWER
FIGURES
Figure 25 Solar PV and wind capacity in 2030 by country under the National Targets Scenario . . . . . . . . . . . 61
Figure 26 Hourly SPLAT-W generation mix of Ghana over three model seasons in 2030 – National Targets Scenario . . . . . . . . . . . . . . . . . . . . . . . . . . . . . . . . . . . . . . . . . . . . . . . . . . . . . . . . . . . . . . . . 61
Figure 27 Renewable energy share of centralised electricity production across scenarios . . . . . . . . . . . . . . . . . 62
Figure 28 Regional trade in 2030 in the National Targets Scenario (GWh) . . . . . . . . . . . . . . . . . . . . . . . . . . . . . . . 64
Figure 29 Carbon dioxide emissions across scenarios . . . . . . . . . . . . . . . . . . . . . . . . . . . . . . . . . . . . . . . . . . . . . . . . . 65
Figure 30 Total undiscounted system costs in the National Targets Scenario . . . . . . . . . . . . . . . . . . . . . . . . . . . . 66
Figure 31 Difference in undiscounted system costs (itemised) between the National Targets Scenario and Reference Scenario . . . . . . . . . . . . . . . . . . . . . . . . . . . . . . . . . . . . . . . . . . 67
Box 1 Renewable energy targets: Implications of metric choice . . . . . . . . . . . . . . . . . . . . . . . . . . . . . . . . . . . . 57
BOXES

•7•WEST AFRIC A
TABLES
Table 1 EREP grid-connected renewable energy targets . . . . . . . . . . . . . . . . . . . . . . . . . . . . . . . . . . . . . . . . . . . . 24
Table 2 National grid-connected renewable energy generation targets . . . . . . . . . . . . . . . . . . . . . . . . . . . . . . . 25
Table 3 Assumptions for T&D infrastructure costs and losses . . . . . . . . . . . . . . . . . . . . . . . . . . . . . . . . . . . . . . . . 30
Table 4 Existing and identified hydropower projects. . . . . . . . . . . . . . . . . . . . . . . . . . . . . . . . . . . . . . . . . . . . . . . . 31
Table 5 Estimates of technical potential for other renewable energy . . . . . . . . . . . . . . . . . . . . . . . . . . . . . . . . . 32
Table 6 Assumptions on fuel availability . . . . . . . . . . . . . . . . . . . . . . . . . . . . . . . . . . . . . . . . . . . . . . . . . . . . . . . . . . 34
Table 7 Fuel price projections . . . . . . . . . . . . . . . . . . . . . . . . . . . . . . . . . . . . . . . . . . . . . . . . . . . . . . . . . . . . . . . . . . . . 34
Table 8 Existing power generation capacity as of 2015 (MW) . . . . . . . . . . . . . . . . . . . . . . . . . . . . . . . . . . . . . . . . 36
Table 9 Capacity of planned and committed (second row) projects (MW) . . . . . . . . . . . . . . . . . . . . . . . . . . . . 37
Table 10 Solar PV and wind capacity factor by country . . . . . . . . . . . . . . . . . . . . . . . . . . . . . . . . . . . . . . . . . . . . . . 41
Table 11 LCOE assumptions for generic power technologies . . . . . . . . . . . . . . . . . . . . . . . . . . . . . . . . . . . . . . . . . 45
Table 12 LCOE assumptions for generic variable power technologies: example of Senegal . . . . . . . . . . . . . . . 46
Table 13 Existing cross-border transmission infrastructure summary . . . . . . . . . . . . . . . . . . . . . . . . . . . . . . . . . . 47
Table 14 New cross-border transmission projects . . . . . . . . . . . . . . . . . . . . . . . . . . . . . . . . . . . . . . . . . . . . . . . . . . . 47
Table 15 Diversity of national electricity supply mix across scenarios . . . . . . . . . . . . . . . . . . . . . . . . . . . . . . . . . . 63
Table 16 Final electricity demand projections (GWh) . . . . . . . . . . . . . . . . . . . . . . . . . . . . . . . . . . . . . . . . . . . . . . . . 73
Table 17 Existing non-hydropower plants . . . . . . . . . . . . . . . . . . . . . . . . . . . . . . . . . . . . . . . . . . . . . . . . . . . . . . . . . . 74
Table 18 Existing hydropower plants . . . . . . . . . . . . . . . . . . . . . . . . . . . . . . . . . . . . . . . . . . . . . . . . . . . . . . . . . . . . . . 77
Table 19 Planned and committed non-hydropower plants . . . . . . . . . . . . . . . . . . . . . . . . . . . . . . . . . . . . . . . . . . . . 78
Table 20 Planned and committed hydropower plants . . . . . . . . . . . . . . . . . . . . . . . . . . . . . . . . . . . . . . . . . . . . . . . . 82
Table 21 Other parameters for renewable energy technologies . . . . . . . . . . . . . . . . . . . . . . . . . . . . . . . . . . . . . . . 85
Table 22 Levelised cost of electricity: generic technologies . . . . . . . . . . . . . . . . . . . . . . . . . . . . . . . . . . . . . . . . . . . 85
Table 23 Levelised cost of electricity: generic wind and solar technologies . . . . . . . . . . . . . . . . . . . . . . . . . . . . . 86
Table 24 Detailed data for existing cross-border transmission infrastructure . . . . . . . . . . . . . . . . . . . . . . . . . . . 91
Table 25 Detailed data for future cross-border transmission projects . . . . . . . . . . . . . . . . . . . . . . . . . . . . . . . . . . 91
Table 26 Detailed transmission and distribution losses by country . . . . . . . . . . . . . . . . . . . . . . . . . . . . . . . . . . . . 92

• 8 • PL ANNING AND PROSPEC TS FOR RENE WABLE POWER
CCGT combined-cycle gas turbine
CLSG Interconnection Côte d’Ivoire-Liberia-Sierra
Leone-Guinea
CO₂ carbon dioxide
CSP concentrated solar power
DDO distillate diesel oil
ECOWAS Economic Community of West African States
ECREEE ECOWAS Centre for Renewable Energy and
Energy Efficiency
EREP ECOWAS Renewable Energy Policy
GDP gross domestic product
GIS geographic information system
HFO heavy fuel oil
IAEA International Atomic Energy Agency
IIASA International Institute of Applied System Analysis
IRENA International Renewable Energy Agency
LCO light crude oil
LCOE levelised cost of electricity
LNG liquefied natural gas
MESSAGE Model for Energy Supply Strategy Alternatives
and their General Environmental Impact
n/a not applicable
NDC Nationally Determined Contribution
NREAP National Renewable Energy Action Plan
OCGT open-cycle gas turbine
OMVG The Gambia River Basin Development
Organisation
OMVS Senegal River Basin Development Organisation
O&M operation and maintenance
PV photovoltaic
RE renewable energy model constraint includes
large hydropower
RExH renewable energy model constraint excludes
large hydropower
ROR run-of-river
SEforALL Sustainable Energy for All
SPLAT-W System Planning Test model for Western Africa
SWI Shannon-Weiner Index
T&D transmission and distribution
UNFCCC United Nations Framework Convention on
Climate Change
VRE variable renewable energy
WAPP West African Power Pool
ABBREVIATIONS

•9 •WEST AFRIC A
GJ gigajoule
GW gigawatt
GWh gigawatt hour
h hour
km kilometre
ktCO₂ thousand tonnes of carbon dioxide
kV kilovolt
kW kilowatt
MtCO₂ million tonnes of carbon dioxide
MW megawatt
MWh megawatt hour
tCO₂ tonne of carbon dioxide
TWh terawatt hour
UNITS OF MEASUREMENT

•10 • PL ANNING AND PROSPEC TS FOR RENE WABLE POWER
EXECUTIVE SUMMARY
West Africa, like many other parts of the world, is grappling with daunting energy
challenges. These include the urgent need to extend energy access and reshape energy matrices in line with the 2015 Paris Agreement, which calls for rapid decarbonisation to reduce the impact of climate change. The Sustainable Development Goals adopted by the United Nations to guide social development processes also call for a shift to new energy systems, based largely on renewables. Such global climate and sustainability imperatives have provided further impetus to the West African region’s own drive to establish clear-sighted long-term energy plans.
In 2013, the International Renewable Energy Agency (IRENA) performed its first assessment of the prospects for renewable energy in the continental countries of the Economic Community of West African States (ECOWAS). That assessment, presented in the 2013 report West African Power Pool: Planning and Prospects for Renewable Energy, came on the heels of two major regional policy developments – the formal adoption of the 2011/12 West African Power Pool (WAPP) Master Plan, and the ECOWAS Renewable Energy Policy (EREP), which aims to increase the share of renewable energy in the region’s overall electricity generation mix to 23 % in 2020 and 31 % in 2030 (ECREEE, 2013).1
1 Including large hydropower, and 5 % in 2020 and 12 % in 2030 when excluding large hydropower. Unless otherwise noted, shares of renewable electricity generation quoted in this report include large hydropower.
IRENA’s own power sector planning model for West African countries, called the System Planning Test model for Western Africa (SPLAT-W), was used to develop a “Renewable Promotion Scenario” in the 2013 West African Power Pool report. This scenario elaborated on the WAPP Master Plan to enhance the representation of renewable technology options, and showed their share in the region could increase from 22 % of electricity generation in a base year of 2010 to as much as 52 % in 2030, in a supportive environment.
Since that analysis, the energy landscape in West Africa has remained dynamic. Ambitious efforts have continued at both the national and regional level to further develop and harmonise policy targets and frameworks to take advantage of the region’s vast renewable potential, enhance energy access and meet fast-growing demand.
In this report, three scenarios have been developed to better reflect the recent local and global context for renewable energy prospects in the region – a Reference Scenario, a Regional EREP Target Scenario, and a National Targets Scenario. The Reference Scenario describes renewable energy deployment in the absence of national or regional targets, based on a detailed project pipeline and range of other assumptions, with cost-competitiveness as the key driver for
•1 1 •WEST AFRIC A
the deployment of various technologies. It builds on the Renewable Promotion Scenario from the 2013 version of this analysis, and is updated to reflect inputs from national experts, as well as the latest research from IRENA, particularly around resource availability and the cost of renewable energy technologies. The Regional EREP Target Scenario describes how the Reference Scenario changes with regional renewable targets set by the EREP, while the National Targets Scenario imposes national renewable targets based on specific input from national experts and/or Sustainable Energy for All (SEforALL) Action Agenda documents.
Using IRENA’s SPLAT-W model to explore the three scenarios, this report presents the following main findings:2
• Despite a projected fourfold increase in regional demand, updated assumptions to reflect significantly lower fossil fuel price projections, and limited large hydropower potential relative to IRENA’s 2013 analysis, the share of renewable power capacity increases in this report’s Reference Scenario to exceed EREP capacity targets, reaching 65 % of peak load by 2030.
• While renewable power capacity deployment in the Reference Scenario exceeds expectations, renewable generation in the same scenario is 6 percentage points short of the 31 % EREP target, reflecting the complexity of renewable energy target setting using various metrics. This is mainly due to dry-year assumptions used for hydropower generation, and a lower average capacity factor in the non-hydro renewable mix than assumed in the EREP target-setting process.
2 The results in this report reflect discussions and inputs developed over two in-depth SPLAT-W training sessions held in Dakar, Senegal. These sessions were part of a six-month capacity development programme in 2015 and 2016 organised by IRENA and the ECOWAS Centre for Renewable Energy and Energy Efficiency (ECREEE), in collaboration with the International Atomic Energy Agency (IAEA) and the United Nations Framework Convention on Climate Change (UNFCCC). During the sessions, ten ECOWAS member country teams, made up of local experts from energy planning offices in ministries, electric utilities and specialised agencies, developed new model input data and created national renewable deployment scenarios using SPLAT-W country models. SPLAT-W models of five ECOWAS member countries that did not take part in the training programme were also updated as part of this report, based on IRENA research.
• National renewable targets would deliver an even greater amount of renewable capacity relative to the Reference and Regional Target Scenarios, and in aggregate those targets do surpass the regional 2030 renewable generation target of 31 % five years earlier than expected, resulting in a 38 % share of renewable energy in total regional generation by 2030.
• Projected reductions in solar photovoltaic (PV) and wind technology costs make non-hydro renewables the primary driver of new capacity additions across all scenarios in the mid- to late-2020s, with solar PV, wind and biomass generating 23 % of total regional generation by 2030 in the National Targets Scenario.
• Depending on the scenario analysed, the amount of solar PV in the ECOWAS region ranges from 8 gigawatts (GW) to over 20 GW by 2030, implying an annual average deployment of 1.5 GW under a National Targets Scenario.
• The diversity, and therefore the resiliency, of the electricity supply mix in the vast majority of ECOWAS member countries significantly increases with the addition of various renewable sources to the capacity mix.
• The development of nearly all cross-border transmission infrastructure projects currently in the pipeline proves to be beneficial across all scenarios analysed.
• The increased capacity investment costs required to deliver national renewable targets are consistently offset by savings in fuel costs from displaced fossil fuel generation, resulting in overall system costs that are essentially equivalent to the Reference Scenario.

•12 • PL ANNING AND PROSPEC TS FOR RENE WABLE POWER
Figure 1 Electricity capacity in Reference, Regional Target and National Targets Scenarios
Note: MW = megawatt.
0
10,000
20,000
30,000
40,000
50,000
60,000
70,000
2015
Tota
l cap
acity
(MW
)
Wind
Distributed solar PV
Solar PV
Solar thermal
Biomass
Mini-hydro
Hydro
Gas
Distributed oil
Oil
Coal2030
Reference
2030
Regional Target
2030
National Targets

•13 •WEST AFRIC A
As the scenarios in this report are meant to align more closely with national expert inputs during 2015 and 2016 IRENA capacity building sessions, as well as more current market conditions, they contain certain important updates to assumptions relative to the 2013 edition of this report. These include the limitation of large hydropower potential to projects identified by national experts, the omission of an import option from Central Africa, the inclusion of lower fossil fuel price projections, and significant renewable energy cost reductions.
Equally important, this report also reflects major enhancements to IRENA’s SPLAT-W model itself. Rather than assigning generic capacity factors to variable renewable energy (VRE, i. e. wind and solar) the updated SPLAT-W model now includes individual wind and solar generation profiles for each ECOWAS member country, based on analysis of 30 years of hourly historical data. To further improve the representation of VRE, the temporal resolution of the SPLAT-W model has also been increased, and time slice calibration improved to better capture the potential alignment of VRE supply and variable demand, the time-linked operational constraints of a power system (e. g. flexibility), and other aspects.
With the updated SPLAT-W model, analysts can now perform a country-level analysis of hourly dispatch in representative days, taking into account each country’s particular composition of demand, available resources and resource profiles, and connection within the regional transmission network. This enables a more refined analysis of VRE generation, the sources of system flexibility that can support that generation, and opportunities for complimentary trade that would benefit both resource-rich and resource-poor countries.
These enhancements further the SPLAT-W model’s capability to design and explore medium- to long-term power system pathways, prioritise investment options and assess the economic implications of a given investment path.
While IRENA has used publicly available information – as well as inputs from national representatives – as the basis for the analysis presented here, further validation by local experts would always serve to enhance the robustness of model results. Moreover, the assessment is based on certain assumptions, including, but not limited to, fuel costs, infrastructure and policy developments, which various stakeholders in the region might regard differently. Local experts are advised to continue exploring different assumptions in order to develop and compare their own scenarios so as to analyse the benefits and challenges of accelerated deployment of renewables.
The results from this updated analysis are intended to support that effort, act as a starting point for further analysis and elaboration, and contribute to national and regional dialogue as ECOWAS member states prepare to meet ambitious renewable energy targets. The fact that the national-level renewable energy targets analysed here collectively surpass the current regional target also highlights the opportunity and benefit of establishing a regular data-informed target update process; such a process can act as a rallying point to build consensus among stakeholders, and align energy plans with broader climate goals reflected in regularly updated Nationally Determined Contributions (NDCs) under the Paris Agreement.
If, as revealed in this analysis, national energy plans and NDCs correspond to a higher level of renewable electricity than anticipated at the regional level, these increased ambitions will have to be reflected in an eventual update of the ECOWAS Renewable Energy Plan.

•14 • PL ANNING AND PROSPEC TS FOR RENE WABLE POWER

•15 •WEST AFRIC A
INTRODUCTION
1.1 BACKGROUND
The International Renewable Energy Agency (IRENA) aims to assist its Members in planning for a transition to energy systems that make maximum use of environmentally benign, fossil-free renewable technologies. This aim is particularly relevant in many African contexts, where substantial domestic renewable energy potential could be used to enhance modern energy access for growing populations, in an affordable and secure manner.
In 2011, IRENA’s Scenarios and Strategies for Africa established the agency’s role in promoting renewable energy to accelerate African infrastructure development (IRENA, 2011). Following that analysis, a more focused assessment of renewable energy prospects in the continental countries of the Economic Community of West African States (ECOWAS) was performed in IRENA’s 2013 report West African Power Pool: Planning and Prospects for Renewable Energy (IRENA 2013).
3 For greater detail on SPLAT-W, see Chapter 2, Overview of Methodology.
4 The 2011/12 WAPP Master Plan was formally adopted by ECOWAS member countries to provide an overall strategy and framework to prepare for and implement priority WAPP power sector projects (WAPP, 2011).
5 One Reference Scenario and three variations of that scenario – Renewable Promotion, No Central Africa Import, and Energy Security – were assessed in the 2013 edition of this report. The Reference Scenario in that report was compatible with the 2011/12 WAPP Master Plan reference scenario, but with important differences, including: the inclusion of mining demand and segregation of rural/urban/industrial demand; the inclusion of decentralised electricity supply options; updated renewable energy resource potential and technology costs; and a conservative “dry-year” hydro generation assumption. In the Renewable Promotion Scenario, cost reductions due to anticipated technology learning were taken into account for renewable energy technologies, fossil fuel prices were assumed to escalate relative to current values, and an option to import electricity from the Central African region was included. In the No Central Africa Import Scenario, the electricity import option from Central Africa was excluded, and in the Energy Security Scenario, import shares were limited to 25 % of total electricity demand for each country.
The assessment in that report was based on IRENA’s own power sector planning model for West African countries, called the System Planning Test model for Western Africa (SPLAT-W, or SPLAT for short), which enables analysts to explore power system development that meets various system requirements, including reliability amid growing and fluctuating electricity demand, taking into account investment and running costs. The SPLAT-W model is built on a database of the West African Power Pool (WAPP) system, consisting of existing generation units and international transmission lines, and a range of future technology options.3
The first version of the SPLAT-W model – used in IRENA’s 2013 West African Power Pool report – took the 2011/12 WAPP Master Plan as a starting point to build the system database.4 The model was then used to develop more elaborated scenarios, to explore the potential for renewable technology development under coordinated policies that would allow ECOWAS member countries to benefit from global cost reduction trends in renewable-based power generation.5 The “Renewable Promotion Scenario” in IRENA’s
1

•1 6 • PL ANNING AND PROSPEC TS FOR RENE WABLE POWER
2013 West African Power Pool report showed that the share of renewable technologies in the region could potentially increase from 22 % of electricity generation at the time (2010 base year) to as much as 52 % in 2030.
In July 2013, the Authority of ECOWAS Heads of State and Government expressed its commitment to provide access to sustainable energy services in West Africa by adopting a ground-breaking policy – the ECOWAS Renewable Energy Policy (EREP) – which aims to increase the share of renewable energy in the region’s overall electricity generation mix to 23 % in 2020 and 31 % in 2030 (ECREEE, 2013).6
To operationalise this regional goal, each ECOWAS member country is mandated to develop a National Renewable Energy Action Plan (NREAP). NREAPs are built on a systematic assessment of future energy mixes, for which energy planning tools like IRENA’s SPLAT-W need to be used.
With the aim of assisting ECOWAS member states to enhance their energy planning capacity, particularly within the context of NREAP development under the EREP, IRENA and the ECOWAS Centre for Renewable Energy and Energy Efficiency (ECREEE) have cooperated to develop templates for NREAP preparation and enhance the SPLAT-W model for further use in the region.
In December 2015 and January 2016, two in-depth SPLAT-W training sessions were held in Dakar,
6 The target officially adopted by heads of state and government on 18 July 2013 was given under Article 2 of the supplementary act on the ECOWAS Renewable Energy Policy. The specific targets of the regional policy for grid-connected renewable energy are given as “increase the share of renewable energy in the overall electricity mix, including large hydro, to 35 % by 2020 and 48 % by 2030” and “increase the share of renewable energy in the overall energy mix, excluding large hydro, to 10 % by 2020 and 19 % by 2030. This will lead to the installation of 2,424 MW renewable energy generation capacity from wind, solar, bioenergy and small-scale hydro power by 2030, and to 7,606 MW by 2030”. Although the metric for electricity/energy mix is not clearly articulated in the official document, the supplementary document “Baseline report for the ECOWAS Renewable Energy Policy” prepared by ECREEE shows these targets in terms of installed capacity of renewable energy as percentage of peak load. The report further presents these targets translated into shares of generation, according to which the target shares for non-hydro renewables is 12 % by 2030, and for total renewables including hydro as 31 %. This is the metric used throughout the analysis presented in this report. For the implications of adopting this metric, see Box 1, Renewable targets: Implications of metric choice.
7 The ten ECOWAS member countries represented at the SPLAT-W training and enhancement sessions were: Benin, Burkina Faso, Cabo Verde, Gambia, Guinea, Liberia, Niger, Senegal, Sierra Leone and Togo.
8 For more detail on the scenarios and analysis presented in IRENA’s 2013 West Africa Power Pool report, see the previous section.
Senegal, as part of a six-month capacity development programme organised by IRENA and ECREEE in collaboration with the International Atomic Energy Agency (IAEA) and the United Nations Framework Convention on Climate Change (UNFCCC). During the sessions ten ECOWAS member country teams, made up of local experts from energy planning offices in ministries, electric utilities and specialised agencies, developed scenarios to explore cost-optimised integration of renewable energy into the power sector.7
The new input data and improved SPLAT-W scenarios emerging from the IRENA training sessions described above can be expected to provide valuable inputs as ECOWAS member states and ECREEE continue to enhance regionally harmonised NREAPs. This is happening in light of the EREP adopted in 2013 and other commitments, such as Action Agendas under the Sustainable Energy for All (SEforALL) initiative and Nationally Determined Contributions (NDCs) under the Paris Agreement.
1.2 THIS REPORT
This report serves to update the scenarios and analysis presented in IRENA’s 2013 West African Power Pool report, taking into account new regional policy developments, inputs and outputs from national experts in the IRENA/ECREEE training sessions described above, and various improvements to IRENA’s SPLAT-W model.8

•17•WEST AFRIC A
A detailed elaboration of the inputs to this report is provided throughout Chapter 3, Scenario Assumptions.
The important updates made in this report include:
• The specification of regional renewable energy targets as defined in the EREP, published in 2013.
• The specification of national renewable energy targets as defined in SEforALL Action Agendas (if applicable), and/or by country teams present at the 2015–2016 regional training workshops held by IRENA on SPLAT-W.
• Updates to existing and projected power system parameters and site-specific projects, based on national expert input, IRENA research and the 2016–2019 WAPP Business Plan (WAPP, 2015).9
• Updates to the characterisation of some generic renewable energy technologies, based on recent work by IRENA around cost projections and recent projects in Africa.
• Refinement of variable renewable resource potential to reflect more granular geographic dispersion and assessment of exclusion zones.
• Improved SPLAT-W model representation of variable renewable energy (VRE) generation, to include individual wind and solar generation profiles for each ECOWAS member country, based on 30 years of hourly data, rather than generic capacity factor assumptions.
• Increased temporal resolution and improved time slice calibration in the SPLAT-W model, to better capture variable renewable generation and system dynamics.
9 This includes a limitation of large hydropower generation to align only with projects identified in country team inputs, and the removal of import potential from Central Africa.
10 The ten ECOWAS member country teams that attended the SPLAT-W training sessions did not develop the results presented in this report, which are a product of IRENA’s modelling and analysis.
11 Several SPLAT model tutorials have been developed by IRENA and ECREEE, and are available upon request from the authors.
• Updated bottom-up projections of demand for electricity, to incorporate commercial sector demand.
• Updated fuel price assumptions, to better reflect recent market conditions and industry outlooks.
The updated SPLAT-Wa model covers all continental ECOWAS member countries: Benin, Burkina Faso, Côte d’Ivoire, Gambia, Ghana, Guinea, Guinea-Bissau, Liberia, Mali, Niger, Nigeria, Senegal, Sierra Leone and Togo. Cabo Verde is considered as a separate entity in the modelling, as it is not connected to the WAPP regional grid.
While IRENA has used publicly available information – as well as inputs from a number of national experts – to represent the current power supply infrastructure, further validation by local experts would always serve to enhance the model’s robustness.10 Moreover, the assessment is based on certain assumptions, including but not limited to fuel costs, infrastructure and policy developments, which energy planners in the region might regard differently. Local experts are advised to continue exploring different assumptions in order to develop and compare their own scenarios so as to analyse the benefits and challenges of accelerated deployment of renewables.
The results from this updated analysis are intended to support that effort and contribute to the national and regional dialogue to come, as ECOWAS member states prepare to meet ambitious renewable energy targets. They also serve to highlight the utility of SPLAT-W model as a free and well-maintained tool for IRENA Members to explore alternative national and regional power sector development scenarios.11

•1 8 • PL ANNING AND PROSPEC TS FOR RENE WABLE POWER

•19 •WEST AFRIC A
The SPLAT-W model used in this report was developed using the modelling platform
software called Model for Energy Supply Strategy Alternatives and their General Environmental Impact (MESSAGE), a dynamic, bottom-up, multi-year energy system model applying linear and mixed-integer optimisation techniques. The modelling platform was originally developed at the International Institute of Applied System Analysis (IIASA), but has been further enhanced more recently by the IAEA. The modelling platform is a flexible framework within which the actual model is developed.
The MESSAGE modelling platform consists of a set of demand projections, a database of transmission infrastructure, power supply technologies characterised by economic and technical parameters, and information regarding existing capital stock and its remaining life span. From the point of existing power infrastructure in the region, the model calculates an evolution of technically feasible technology mixes that achieve a least-cost objective over the planning period (i. e. minimal total discounted system costs, including investment, operation and maintenance [O&M], fuel and any other user-
defined costs), while meeting various system requirements (e. g. supply matching demand at a given time; sufficient resources and capacity in place to supply desired production) and user-defined constraints (e. g. reserve margin, speed of technology deployment, emission limits, policy targets).
The model inputs described above can be varied according to the user’s preference, to explore different scenarios of system evolution under particular sets of assumptions. The model’s “solution” includes, inter alia, investment in new technologies, production, fuel use and trade. Economic and environmental implications associated with the identified least-cost energy systems can be easily calculated with the model.
Using the MESSAGE platform described above, the IAEA developed a model and training materials to analyse power system evolutions over the coming 20 years in the ECOWAS region. IRENA’s SPLAT-W model was adapted in 2012–2013 from that earlier work by the IAEA, and continues to be enhanced. The key characteristics of the most recent SPLAT-W model are:
OVERVIEW OF METHODOLOGY 2

•20 • PL ANNING AND PROSPEC TS FOR RENE WABLE POWER
• Countries modelled as separate nodes, interlinked by transmission lines. Each node, representing the power system of a single country, is characterised as shown in Figure 2.
• Bottom-up projections of demand for electricity split into four categories (heavy industry; commercial and small industry; urban residential; and rural residential) to allow for a better representation of different decentralised power supply options and improve the representation of the load curve. See Section 3.3 (Electricity demand) for more detail.
• Different levels of transmission and distribution (T&D) infrastructure required for the four modelled demand categories, each incurring specified levels of losses. See Section 3.4 (Local transmission and distribution) for more detail.
• Computation of a least-cost power supply system that meets the given demand while satisfying all user-defined constraints, with “least-cost” defined for the region as a whole, over the entire modelling period.
• Explicit modelling of four types of cross-border transmission and power generation options: existing capacity; projects to be commissioned; site-specific projects under consideration (candidate projects); and non-site specific (generic) projects. See Sections 3.7 (Electricity generation options) and 3.8 (Cross-border trade) for more detail.
• The reliability of supply addressed by assuring 10 % reserve margins, while variable renewable technologies are given levels of “firm” capacity based on the nature of the resource (i. e. not fully contributing to the reserve margin at times). See Section 3.9 (Constraints related to system and unit operation) for more detail.
• Significantly expanded and refined renewable energy supply options, reflecting the latest technology cost and capacity factor data, based on cost curves and hourly generation profiles in IRENA’s most recent costing and resource assessment studies. See Sections 3.5 (Renewable resource potential) and 3.7 (Electricity generation options) for more detail.

•2 1 •WEST AFRIC A
Figure 2 Country power sector model structure
Resour
ces
Primary
Second
ary
Tertia
ry
Urban
and
commerc
ial
final
Rural
final
Heavy
indus
try
final
Distribution to urban areas
Distribution to rural areas
Distributed generation
rooftop PV
Distributed generation
e. g.
e. g.
mini-hydro
CO2
Fuel imports
e. g. gas
Domestic production of
fuels 1 e. g. coal
Electricity imports from
country 1
Large power station 1
e.g. CCGT
Large power station 2e.g. coal
Domestic
fuels 2
Transmission network
Electricity export to country 2
Electricity
imports from country 2
Electricity export to country 1
Large power station 3
e. g. hydropower
Medium power station
CO2
e. g. biomass
e. g. biomassproduction of

•22 • PL ANNING AND PROSPEC TS FOR RENE WABLE POWER

•2 3 •WEST AFRIC A
3.1 GENERAL DEFINITION OF SCENARIOS
Three main scenarios were developed in this update report:
• Reference Scenario • Regional EREP Target Scenario• National Targets Scenario.
These are described in the sections below. For the two “Target” scenarios, targets are set for the SPLAT-W model’s optimisation of capacity expansion, to meet specified minimum percentages of renewable energy supply in total generation by the years 2020 and 2030.
For the Regional EREP Target Scenario, these targets are imposed at the overall level, meaning that renewable generation capacity can be deployed in any country to contribute to the regional target, without national minimum requirements.
For the National Targets Scenario, targets are set only at country level, so that each country must at least meet its minimum specified percentage of renewable energy supply. Cross-border trade is treated equally across scenarios, limited to the extent of existing and planned transmission projects.
Reference Scenario
The Reference Scenario describes renewable energy deployment in the absence of national or regional targets, based on a detailed project pipeline and range of assumptions set out in the remainder of this chapter, with cost-competitiveness as the key driver for the deployment of various technologies. It builds on the Renewable Promotion Scenario from the 2013 version of this analysis, with wide-ranging updates to reflect expert national team inputs and IRENA’s own research, as described in Chapter 1 Introduction.
Apart from updating renewable resource and cost information to align with the latest IRENA estimates, the most influential revisions include: updated electricity demand projections, removal of the option to develop non-site-specific hydropower resource potential (this includes ca. 7 gigawatts [GW] of generic large hydropower capacity developed in Nigeria in IRENA’s previous study results), the exclusion of import potential from Central Africa, and a downward revision of fossil fuel price assumptions.
The scenario assumes a supportive institutional environment, in which policies and market developments allow for rapid reductions in renewable energy costs that are consistent with global observations and past trends.
SCENARIO ASSUMPTIONS 3

•24 • PL ANNING AND PROSPEC TS FOR RENE WABLE POWER
Regional EREP Target Scenario
The Regional EREP Target Scenario imposes a region-wide minimum target on the Reference Scenario in line with EREP targets. As displayed in Table 1, the EREP aims to increase the share of grid-connected renewable energy in the region’s overall electricity mix (defined as the share of
renewable energy capacity as a percentage of peak load) to 35 % in 2020 and 48 % in 2030, which respectively include 25 % and 29 % of medium-sized/large hydropower (ECREEE, 2013). In this analysis, the generation-equivalent targets are used in the modelling of regional targets, with a linear trajectory between target years in the SPLAT-W model.
2010 2020 2030
Capacity targets in MW – 2,425 7,606
Peak load forecast ECOWAS in MW – 25,128 39,131
EREP targets as percentage of peak load 0 % 10 % 19 %
Implied medium and large hydro in MW – 6,370 11,177
EREP targets as percentage of peak load (incl. medium and large hydro) 32 % 35 % 48 %
Power generation targets in GWh – 8,350 29,229
Load forecast ECOWAS in GWh – 155,841 243,901
EREP targets as percentage of generation 0 % 5 % 12 %
Implied medium and large hydro in GWh – 27,493 46,380
EREP targets as percentage of generation (incl. medium and large hydro) 26 % 23 % 31 %
Notes: GWh = gigawatt hour; MW = megawatt.
Source: ECREEE (2013), ECOWAS Renewable Energy Policy, www.ecreee.org/page/ecowas-renewable-energy-policy-erep.
National Targets Scenario
Rather than a region-wide target, the National Targets Scenario sets minimum country-level targets for the percentage of renewable energy in total domestic generation, based on specific input from national experts attending IRENA’s 2015–2016 regional SPLAT-W training workshops. In the absence of such inputs, targets are based on national SEforALL Action Agenda documents.
As seen in Table 2, five country targets exclude large hydropower (RExH). Note that although certain national action plans mention goals to deploy specific non-hydro renewable technologies, the targets imposed here are not technology-specific, i. e. they only set a minimum overall target for the percentage of renewable generation, which can be met by any renewable electricity generation option at least cost (outside of large hydropower for RExH targets). For an overview of renewable generation options included in this analysis, see Section 3.7 (Electricity generation options).
Table 1 EREP grid-connected renewable energy targets

•25 •WEST AFRIC A
Country National target constraint 2020 2030 Source
Benin RE 20 % 44 % Benin SPLAT-W training team (2015)
Burkina Faso RE 23 % 50 % Burkina Faso SPLAT-W training team (2015)
Cabo Verde RE 50 % 100 % Cabo Verde SPLAT-W training team (2015)
Côte d’Ivoire RExH 0 % 16 % N’Goran (2015)
Gambia RE 35 % 48 % Gambia SPLAT-W training team (2015)
Ghana RExH 10 % 20 % Tettey (2015)
Guinea RExH 25 % 30 % Guinea SPLAT-W training team (2015)
Guinea-Bissau RE 30 % 50 % Raul (2015)
Liberia RE 25 % 30 % Liberia SPLAT-W training team (2015)
Mali RExH 0 % 30 % Touré (2015)
Niger RE 40 % 57 % Niger SPLAT-W training team (2015)
Nigeria RE 20 % 30 % Adebisi (2015)
Senegal RExH 20 % 30 % Niane (2015)
Sierra Leone RE 30 % 50 % Sierra Leone SPLAT-W training team (2015)
Togo RE 17 % 30 % Togo SPLAT-W training team (2015)
3.2 OVERALL ASSUMPTIONS
Overall assumptions across all scenarios are as follows:
• The real discount rate applied is 10 %, consistent with the assumption in the 2011/12 WAPP Master Plan.
• The monetary unit used throughout is the 2015 USD rate, and adjustments to reported data in USD from other years are made using the US gross domestic product (GDP) deflator from the World Bank (World Bank, 2017).
• The study horizon spans 2015 (“current” or “present”) to 2030.
• A “dry-year” scenario is assumed for all hydropower sites through the modelling horizon, across all scenarios. See Section 3.5 (Renewable resource potential).
Note: RE = renewable energy model constraint includes large hydropower; RExH = renewable energy model constraint excludes large hydropower.
Table 2 National grid-connected renewable energy generation targets

•26 • PL ANNING AND PROSPEC TS FOR RENE WABLE POWER
3.3 ELECTRICITY DEMAND
Electricity demand assumptions were previously based on secondary (i. e. at the utility level, before transmission) electricity demand projections given in the 2011/12 WAPP Master Plan and a simplified sectoral split. They have been updated in this report to reflect a more detailed bottom-up sectoral analysis, including progress related to electricity access and economic development, cross-referenced with inputs from national experts present at IRENA’s 2015–2016 regional SPLAT-W training workshops.
Figure 3 presents the evolution of secondary electricity demand assumed in this analysis.12 Relative to previous assumptions, demand in the early years of the model horizon has been revised downward, reflecting lower actual GDP growth than what was expected by the 2011/12 WAPP Master Plan. However, the growth rate of electricity demand is now higher, as total electricity demand is still expected to approach high long-term levels and reflects a fourfold increase between 2015 and 2030.
12 As in the previous edition of this report, demand across all scenarios includes demand from some mining projects. In Guinea, Guinea Bissau, Liberia and Sierra Leone, this mining demand is projected to be several times larger than all other electricity demand. Other mining projects in the West African region, such as gold mining in Burkina Faso, were not identified in the WAPP Master Plan and are not included in this analysis.
Each country’s final electricity demand was divided into the following four end-use categories:
• Heavy industry (e. g. mining) – connected to generation at a high voltage and generally requires little transmission and distribution (T&D) infrastructure per unit of consumption;
• Commercial and small industry – connected via a moderate amount of T&D infrastructure per unit of consumption;
• Urban residential – connected via a moderate amount of T&D infrastructure per unit of consumption;
• Rural residential – requires the most extensive T&D infrastructure per unit of consumption.
Final electricity demand divided into these categories is given in Figure 4. Detailed country-by-country data can be found in Table 15 in Appendix A.

•27•WEST AFRIC A
2015
2016
2017
2018
2019
2020 20
2120
2220
2320
2420
2520
2620
2720
2820
2920
30
2015
2016
2017
2018
2019
2020 20
2120
2220
2320
2420
2520
2620
2720
2820
2920
30
Guinnea-Bissau
Liberia
Gambia
Cabo Verde
Sierra Leone
Togo
Benin
Niger
Burkina Faso
Guinea
Mali
5,000
10,000
15,000
20,000
25,000
30,000
35,000
0
Senegal
Côte d'Ivoire
Ghana
Nigeria
50,000
100,000
150,000
200,000
250,000
0
Figure 3 Secondary electricity demand projections, 2015–2030, by country (GWh)

•28 • PL ANNING AND PROSPEC TS FOR RENE WABLE POWER
In order to capture the key features of electricity demand patterns, SPLAT-W model years are characterised by sector-specific load profiles for the various seasons and parts of the day. The model contains three seasons, namely pre-summer (January – April), summer (May – August), and post-summer (September – December).
13 Load profile construction described here was performed in the following sequence. First, hourly annual electricity demand data provided by Côte d’Ivoire and Ghana was used to develop a representative overall load shape; within that overall shape, daily industrial sector demand was assumed to be spread flat, and commercial demand was assumed to have a midday increase, based on expert South African regional experience. Urban residential demand was then assumed to fill the balance remaining to form the predefined overall load shape. Given the small share of rural residential demand, the sector’s demand was added on top as a final step, with daily load profile developed on the basis of recent research into prospective mini-grid demand profiles in sub-Saharan Africa (Hughes et al., 2017).
For each season, days are characterised by ten blocks of equal demand (including an 8pm “peak”), as presented in Figure 5 below, resulting in a total of 30 model “time slices”. Since different countries have different shares of the four specified demand categories, the resulting load series are specific to each country.13
Hour 1 2 3 4 5 6 7 8 9 10 11 12 13 14 15 16 17 18 19 20 21 22 23 24
Block 1 1 1 1 1 1 2 2 3 3 4 4 5 5 6 6 7 7 7 8 9 9 10 10
20
1520
1620
1720
1820
1920
20 2021
2022
2023
2024
2025
2026
2027
2028
2029
2030
50,000
100,000
150,000
200,000
250,000
Rural Urban CommercialI ndustrial
0
Final Electricity Demand (GWh)
20
1520
1620
1720
1820
1920
20 2021
2022
2023
2024
2025
2026
2027
2028
2029
2030
50,000
100,000
150,000
200,000
250,000
Rural Urban Commercial Industrial
0
Figure 4 Final electricity demand projections, 2015–2030, by sector (GWh)
Figure 5 Daily time slice aggregation

•29 •WEST AFRIC A
100
0
200
300
400
500
600
700
800
900
1,000
1 3 5 7 9 11 13 15 17 19 21 23
Summer Day
MW
100
0
200
300
400
500
600
700
800
900
1,000
1 3 5 7 9 11 13 15 17 19 21 23
Pre-Summer Day
MW
100
0
200
300
400
500
600
700
800
900
1,000
1 3 5 7 9 11 13 15 17 19 21 23
Industry
Commerce
Urban
Rural
Industry
Commerce
Urban
Rural
Industry
Commerce
Urban
Rural
Post-Summer Day
MW
Figure 6 Example of sector-specific load profiles: modelled Côte d’Ivoire demand, 2015

•30 • PL ANNING AND PROSPEC TS FOR RENE WABLE POWER
3.4 LOCAL TRANSMISSION AND DISTRIBUTION
T&D infrastructure requires investment to meet peak system demand. In SPLAT-W, the required investment in T&D infrastructure is modelled to exceed peak system demand by some margin, which in turn determines installed T&D capacity.14 Costs and losses are defined for each demand category, reflecting the different levels of T&D infrastructure required. Off-grid technologies, requiring no T&D infrastructure, entail no costs and losses. Costs and losses for distribution through mini-grid solutions are not considered for the sake of simplification.
Assumptions around T&D costs and average losses are given in Table 3.15 Costs are kept constant over time and assumed to be the lowest for heavy industry, moderate for urban and commercial demand, and highest for the rural demand category.
14 Note that this is a simplified approach – the model does not represent specific domestic transmission or distribution lines, but rather assigns a generic investment cost for both transmission and distribution infrastructure to each unit of demand. Total investment in domestic T&D infrastructure is therefore a function of a country’s sectoral demand and specified T&D losses.
15 Cost and loss assumptions by sector based on benchmarks from 2011/12 WAPP Master Plan, data provided by national experts present at IRENA’s 2015–2016 regional SPLAT-W training workshops, and expert opinion from South African regional experience. Sectoral loss differences are developed to preserve mean overall value in source (2011/12 WAPP Master Plan). Losses displayed in tables are in terms of percentage of generation, and include non-technical losses.
The assumptions on T&D losses are specific to each country, and fully detailed in Table 25 in Appendix D. For industry, losses are assumed to be 7 % in 2015 across all countries, and are reduced to 5 % by 2030. For the urban and commercial demand categories, they are assumed to range between 16 % and 22.5 % in 2015 depending on the country, falling to 13 % by 2030 in all countries.
Like costs, losses are highest for the rural demand category, and fall from 22.5–30 % in 2015 depending on the country, to 20 % by 2030 in all countries. The average T&D losses discussed here are used to calculate the levelised cost of electricity (LCOE) discussed in Section 3.7 (Electricity generation options).
Cost (USD/kW) Losses (%)
2015 2020 2030
Heavy industry 160 7 7 5
Urban residential/commercial 320 16–22.5 15 13
Rural residential 460 22.5–30 25 25
Notes: The costs of the distribution technologies are modelled as investment cost based on the load factor of each of the demand categories and not as a variable cost; kW = kilowatt.
Source: IRENA analysis, incorporating data from WAPP (2011), Update of the ECOWAS Revised Master Plan for the Generation and Transmission of Electrical Energy, www.ecowapp.org/en/documentation.
Table 3 Assumptions for T&D infrastructure costs and losses

•3 1 •WEST AFRIC A
3.5 RENEWABLE RESOURCE POTENTIAL
Large hydropower
Large hydropower potential is summarised in Table 4. Detailed parameters for existing and planned hydropower projects are given in Table 17 and Table 19 in Appendix B. Unlike the 2013 edition of this report, in which generic large hydropower projects were allowed to be built in the SPLAT-W model, hydropower potential in this study is limited to the sites identified in the WAPP Master Plan (2011), with updates from
16 Plant-level dry-year capacity factors are based on WAPP (2011) and national team inputs during IRENA’s 2015–2016 SPLAT-W training sessions. For detailed values see Appendix B.
17 A more comprehensive stochastic approach (as used in WAPP 2011) was not possible due to current limitations of the MESSAGE modelling platform.
national experts present at IRENA’s 2015–2016 regional SPLAT-W training workshops. Like in the 2013 edition of this report, however, a “dry-year” scenario is still assumed for all hydropower sites in all years within the modelling horizon, across all scenarios.16 This underplays the role of hydropower in the region, but is considered to be prudent in view of the vulnerability of West Africa to drought years.17 In terms of modelling outcomes, both of these assumptions – the limitation of new generic large hydropower projects, and conservative dry-year power generation – have significant influence on national and regional energy system evolution.
Existing hydropower Identified hydropower projects
Country Capacity Capacity
MW MW
Benin 0 436
Burkina Faso 23 110
Cabo Verde 0 0
Côte d’Ivoire 585 1,179
Gambia 0 0
Ghana 1,580 307
Guinea 367 5,148
Guinea-Bissau 0 20
Liberia 5 967
Mali 249 240
Niger 0 359
Nigeria 1,900 3,750
Senegal 68 0
Sierra Leone 56 749
Togo 67 108
Total 4,899 13,371
Source: IRENA analysis, incorporating data from WAPP (2011), Update of the ECOWAS Revised Master Plan for the Generation and Transmission of Electrical Energy, www.ecowapp.org/en/documentation.
Table 4 Existing and identified hydropower projects

•32• PL ANNING AND PROSPEC TS FOR RENE WABLE POWER
Other renewable energy potential
Estimates for the technical potential of non-large-hydropower renewable resources are shown in Table 5. Estimates of regional potential for solar photovoltaic (PV) and wind are based on analysis carried out in IRENA (2016a). Instead of categorising land in a binary way, as either “available” or “unavailable” for development, the analysis in that report takes an opportunity-based approach to measure resource potential, by ranking the quality of areas for development according to scores assigned to a range of relevant factors.18
Concentrated solar power (CSP) potential is based on unpublished updates of IRENA (2014a),
18 Six factors were included in the analysis: renewable energy resource intensity, distance to the grid, population density, topography, land cover, and protected areas. Underlying datasets include wind speed (1 km resolution, from DTU Global Wind Atlas) and solar irradiation (global horizontal irradiance) (1 km resolution, HelioClim-3 data from MINES ParisTech). For further detail on methodology and underlying data, see IRENA (2016a).
19 As in the previous edition of this report, the solar and wind potential shown here may underestimate actual potential in some areas, due to conservative assumptions regarding the use of land areas. Even so, they are still vast enough that no country would be expected to reach its resource constraints by 2030.
which applies exclusion criteria (e. g. geographic, technical, ecological, legislative) to theoretical renewable energy potential derived from high-resolution solar irradiation and wind speed datasets (Helioclim-3 data for solar, provided by Mines ParisTech, and 9 kilometre [km] resolution wind data provided by Vortex).19
Small or mini-hydropower (<10 MW) data are based on estimates from the United Nations Industrial Development Organization and the International Center on Small Hydro Power (UNIDO and ICSHP, 2016). Biomass data have been updated based on analysis in both IRENA (2014a) and (2014b), and represent conservative technical resource potential for co-generation.
Small hydro Solar CSP Solar PV Biomass Wind
MW MW MW MW MW
Benin 187 0 3,532 761 322
Burkina Faso 38 0 82,556 1,075 9,881
Côte d’Ivoire 41 213 28,919 3,260 2,548
Gambia 12 953 428 60 44
Ghana 1,245 229 20,295 4,449 2,014
Guinea 198 2,774 37,569 1,732 2,114
Guinea-Bissau 0 2,583 1,043 205 101
Liberia 66 41 2,871 1,375 192
Mali 117 103,658 298,812 447 7,962
Niger 0 171,136 442,931 266 54,156
Nigeria 735 36,683 492,471 7,291 44,024
Senegal 0 5,424 37,233 466 4,531
Sierra Leone 330 111 1,885 587 131
Togo 144 0 2,686 378 73
Note: TWh = terawatt hour.
Source: IRENA analysis, incorporating data from UNIDO and ICSHP (2016), World Small Hydropower Development Report 2016, www.smallhydroworld.org/menu-pages/reports/2016/.
Table 5 Estimates of technical potential for other renewable energy

•33 •WEST AFRIC A
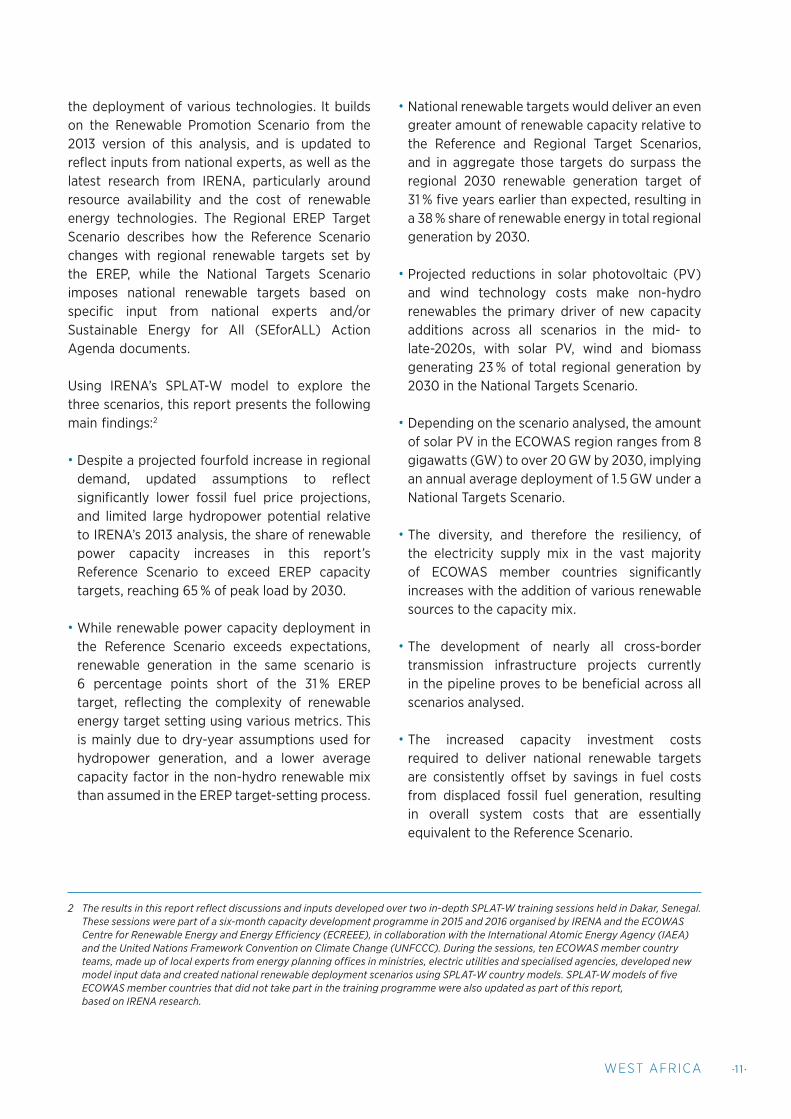
3.6 FUEL AVAILABILITY AND PRICES
Assumptions on fuel availability in the ECOWAS region are summarised in Table 6.
Three types of gas are assumed to be available for supply: locally produced gas (in Côte d’Ivoire, Ghana and Nigeria); Nigerian gas, supplied through the Western African Gas Pipeline (in Benin, Ghana and Togo, with eventual extension to Côte d’Ivoire);20 and imported liquefied natural gas (LNG) (in other coastal countries).21
For petroleum products, three types of fuel are distinguished: heavy fuel oil (HFO), distillate diesel oil (DDO) and light crude oil (LCO). Different prices are assumed for petroleum products delivered to coastal countries as opposed to inland countries.
For coal, only Nigeria and Niger are assumed to have resources for local production. All coastal countries other than Nigeria have the option of coal imports, which are assumed to be available. Inland countries other than Niger are assumed to have no domestic coal resource or coal transport infrastructure, and costs to these countries are assumed to be prohibitively expensive.
20 Assumed that the option for Côte d’Ivoire to access regional pipeline supply occurs in 2025 at the earliest.
21 Annual limits are placed on gas availability via domestic production and pipeline supply, based on national documents detailing typical production and pipeline flow values. While this analysis does not set cumulative production limits across the modelling horizon to reflect proven commercial reserve estimates, the results presented here have been cross-checked and reflect plausible levels of gas infrastructure development and utilisation over the modelling horizon. Supply of LNG is not tied to specific projects or regasification terminals, but rather assumed to be available given the existing use of floating storage regasification terminals in the region – the timeline of this availability is an area for further improvement by local experts.
22 High-level benchmarks (e. g. crude oil and LNG price) are first taken from the IEA New Policy Scenario, with more granular oil/diesel and natural gas categories derived from the price ratios between those categories in the WAPP Master Plan. Given the correspondence of South African and Australian thermal coal prices, Coastal China was used as a benchmark for the imported coal price, corrected for freight rate differential to reflect transport from South Africa to West Africa. The domestic coal price in Niger and Nigeria continues to be set at a lower level in this update, based on Idrissa (2004). The price of biomass, produced domestically, is assumed to remain constant over the planning horizon, and remains based on the projections in the 2011/12 WAPP Master Plan.
For biomass, two fuel types are distinguished: moderately priced biomass and more expensive biomass in countries where biomass resource is relatively scarce. Countries where the agricultural industry could potentially make biomass available to the power sector were allocated to the moderate category, while resources in Cabo Verde and the three inland countries of Burkina Faso, Mali and Niger are assumed to be scarce, based on analysis presented in Section 3.5 (Renewable resource potential).
The price evolution assumed for the fuel categories described above is summarised in Table 7 and Figure 7 below. While fuel prices in the previous edition of this report were based on those in the 2011/12 WAPP Master Plan, which were derived from an assumed benchmark oil price of USD 100 per barrel, price evolution in this update is largely based on the IEA New Policies Scenario in its 2016 World Energy Outlook (2016).22 Although the fossil fuel price trajectory is still assumed to be increasing, the base-year price level of fossil fuels in this update is noticeably lower, reflecting the recent global commodity price slump. As fuel prices are critical determinants of future technology choice, price sensitivity analyses are recommended as part of any further expansion of the modelling undertaken in this report.
•3 4 • PL ANNING AND PROSPEC TS FOR RENE WABLE POWER
Note: GJ = gigajoule.
Source: IRENA analysis, incorporating data from IEA (2016), World Energy Outlook 2016, http://dx.doi.org/10.1787/weo-2016-en; WAPP (2011), Update of the ECOWAS Revised Master Plan for the Generation and Transmission of Electrical Energy, www.ecowapp.org/en/documentation; and Idrissa (2004), “Projet de création d’une société de traitement et de commercialisation du charbon minéral à des fins domestiques (SNTCD)”, www.cilss.bf/predas/Activites%20par%20Pays/NE/34Projet%20de%20creation%20societe%20charbon%20mineral.pdf.
Coal Gas Oil Biomass
Benin Import Pipeline/LNG Coastal Moderate
Burkina Faso n/a n/a Inland Scarce
Cabo Verde Import LNG Coastal Scarce
Côte d’Ivoire Import Domestic/pipeline/LNG Coastal Moderate
Gambia Import LNG Coastal Moderate
Ghana Import Domestic/pipeline/LNG Coastal Moderate
Guinea Import LNG Coastal Moderate
Guinea-Bissau Import LNG Coastal Moderate
Liberia Import LNG Coastal Moderate
Mali n/a n/a Inland Scarce
Niger Domestic n/a Inland Scarce
Nigeria Domestic Domestic Coastal Moderate
Senegal Import LNG Coastal Moderate
Sierra Leone Import LNG Coastal Moderate
Togo Import Pipeline Coastal Moderate
USD/GJ 2015 2020 2030
HFO (delivered to the coast) 6.6 10.2 14.3
HFO (delivered inland) 8.3 12.9 18.1
Diesel (delivered to the coast) 11.2 17.3 24.3
Diesel (delivered inland) 12.9 19.9 28.0
LCO (delivered to the coast) 9.1 14.1 19.8
Gas (domestic) 7.1 7.1 8.5
Gas (pipeline) 8.6 8.6 10.3
Gas (imported) [LNG] 9.2 8.7 11.0
Coal (domestic) 3.3 3.4 3.6
Coal (imported) 4.9 5.1 5.5
Biomass (moderate) 1.6 1.6 1.6
Biomass (scarce) 3.9 3.9 3.9
Note: n/a = not applicable.
Table 6 Assumptions on fuel availability
Table 7 Fuel price projections

•35 •WEST AFRIC A
3.7 ELECTRICITY GENERATION OPTIONS
The core of IRENA’s SPLAT model is its power system database, which consists of existing generation and international transmission capacity in the ECOWAS region, as well as a range of future technology options.
Existing generating capacity
Existing power generation in the ECOWAS region, based on the 2011/12 WAPP Master Plan in the previous edition of this report, has been updated by IRENA and national experts present at IRENA’s 2015–2016 regional SPLAT-W training workshops.23
23 IRENA has conducted the update of data for four countries not in attendance at the 2015–2016 regional SPLAT-W training workshops – Côte d’Ivoire, Ghana, Guinea-Bissau and Nigeria.
24 A significant portion of this installed capacity in Nigeria (nearly 40 %) is known to be unavailable for various technical reasons.
A summary of existing generation capacity is presented in Table 8 below. As of 2015, installed power generation capacity in the ECOWAS region stood at roughly 20 GW, of which Nigeria accounted more than a half.24 Detailed parameters surrounding existing capacity by country are given in Appendix B.
Figure 7 Fuel price projections
2015 2020 20300
5
10
15
20
25
30
HFO (delivered to the coast)
Diesel (delivered to the coast)
Diesel (delivered to the inland)
LCO (delivered to the coast)
LCO (delivered to the inland)
Gas (domestic)
Gas (pipeline)
Gas (imported) [LNG]
Coal (domestic)
Coal (imported)
Biomass (moderate)
Biomass (scarce)
USD
/GJ

•36 • PL ANNING AND PROSPEC TS FOR RENE WABLE POWER
Oil Gas Coal Hydro Biomass Solar Wind Total
Benin 77 100 0 0 0 0 0 177
Burkina Faso 256 0 0 23 0 0 0 279
Cabo Verde 165 0 0 0 0 5 9 179
Côte d’Ivoire 0 1,628 0 585 0 0 0 2,213
Gambia 84 0 0 0 0 0 0 84
Ghana 690 310 0 1,580 0 3 0 2,583
Guinea 252 0 0 367 0 0 0 619
Guinea-Bissau 19 0 0 0 0 0 0 19
Liberia 23 0 0 5 0 0 0 27
Mali 300 0 0 249 0 10 0 560
Niger 92 20 32 0 0 0 0 144
Nigeria 0 10,302 0 1,900 0 0 0 12,202
Senegal 605 49 0 68 0 0 0 721
Sierra Leone 21 0 0 56 8 0 0 85
Togo 49 120 0 67 0 0 0 235
Total 2,631 12,529 32 4,899 8 18 9 20,126
Future generating capacity options
Two types of future power generation options are available in the model: site-specific projects and generic technology options.
Site-specific projects – originally based on the project listings in the 2011/12 WAPP Master Plan – have been updated based on national expert input during IRENA’s 2015–2016 regional SPLAT workshops, IRENA research and the 2016–2019 WAPP Business Plan. Projects are specified by unit size, capacity factor, efficiency, O&M costs, investment costs, etc.
Some site-specific projects are already “committed” and are thus included as part of the future energy mix. Other projects are in a separate “under consideration” category and may or may not be included in the optimal solution computed by the model under a set of assumptions for the respective scenarios. A summary of site-specific project capacity is presented in Table 9 below, with more detailed tables provided in Appendix B. Committed projects are commissioned at fixed dates, while projects under consideration are regarded as investment options from 2016 to the end of the study horizon.
Table 8 Existing power generation capacity as of 2015 (MW)

•37•WEST AFRIC A
Source: IRENA analysis, incorporating data from WAPP (2015), 2016–2019 WAPP Business Plan, www.ecowapp.org/en/documentation.
Oil Gas Coal Hydro Biomass Solar Wind Total
Benin0 810 0 436 20 135 10 1,411
0 570 0 436 0 40 0 1,046
Burkina Faso346 0 0 110 0 147 0 603
8 0 0 38 0 147 0 192
Cabo Verde0 0 0 0 0 0 0 0
0 0 0 0 0 0 0 0
Côte d’Ivoire0 450 0 1,179 0 0 0 1,629
0 0 0 0 0 0 0 0
Gambia44 0 0 0 0 3 1 48
44 0 0 0 0 3 1 48
Ghana525 445 0 307 0 20 225 1,522
425 430 0 0 0 20 225 1,100
Guinea131 0 0 5,148 0 92 0 5,370
125 0 0 1,332 0 0 0 1,457
Guinea-Bissau0 0 0 20 0 0 0 20
0 0 0 0 0 0 0 0
Liberia28 0 0 967 8 0 0 1,003
28 0 0 66 0 0 0 94
Mali166 0 0 240 33 30 0 470
0 0 0 140 0 0 0 140
Niger97 8 625 359 0 7 30 1,125
0 0 0 130 0 7 0 137
Nigeria0 6,300 0 3,750 0 0 0 10,050
0 0 0 0 0 0 0 0
Senegal122 0 425 0 0 130 150 827
122 0 125 0 0 0 150 397
Sierra Leone57 0 0 749 8 11 0 824
57 0 0 0 8 11 0 76
Togo0 200 0 108 0 45 25 378
0 0 0 0 0 0 0 0
Total1,516 8,213 1,050 13,371 69 620 441 25,279
809 1,000 125 2,141 8 228 376 4,686
Table 9 Capacity of planned and committed (second row) projects (MW)

•38 • PL ANNING AND PROSPEC TS FOR RENE WABLE POWER
In the SPLAT-W model, electricity demand that cannot be met by existing technologies and committed projects requires the further development of site-specific projects that are under consideration but not yet committed, and/or generic power generation technologies.
Generic power generation technologies are modelled without a specific reference to any unit size, although limits on annual deployment are enforced. Certain technologies are assumed to provide electricity only via the grid (i. e. connected to upstream transmission), while others are assumed to provide on-site electricity.
For thermal technologies, the following are included as generic options:
• Diesel/gasoline 1 kW system to supply urban and rural demand.
• Diesel 100 kW system to supply industrial demand.
• Diesel centralised connected to upstream transmission.
• Heavy fuel oil connected to upstream transmission.
• Open-cycle gas turbine (OCGT) connected to upstream transmission.
• Combined-cycle gas turbine (CCGT) connected to upstream transmission.
• Supercritical coal connected to upstream transmission.
For renewable energy technologies, the following are included as generic options:
• Small or mini-hydropower (<10 MW) to supply rural demand.
• Onshore wind connected to upstream transmission.
• Biomass mainly in the form of co-generation to be consumed on site, with surplus exported to the grid (upstream of transmission).
• Utility-scale solar PV or PV farms managed by the utility and connected to upstream transmission.
• Distributed or rooftop solar PV to supply either urban residential, commercial and small industry demand, or rural residential and commercial demand.
• Distributed or rooftop solar PV with 2 hours of storage in the form of a battery, for extended use beyond daylight hours.
• CSP in the form of medium- to large-scale CSP connected to upstream transmission.
• CSP with storage in the form of medium- to large-scale CSP with thermal storage, able to supply electricity during the daytime and in the evening.
Detailed technical parameters for these generic technologies (e. g. load factor, O&M costs, efficiency, construction duration, lifetime) are summarised in Table 20 in Appendix C. As discussed in Section 3.5 (Renewable resource potential), only site-specific projects are included as future generation options for large hydropower.

•39 •WEST AFRIC A
Variable renewable power generation
Model treatment of VRE generation (i. e. onshore wind and solar PV) has been improved as part of the update to this report. Rather than assigning a generic capacity factor to all wind and solar PV installations, the SPLAT-W model has been updated to reflect individual generation profiles for each ECOWAS member country, at a more refined time resolution.
To develop country-specific generation profiles, broadly representative wind and solar resource locations were first chosen based on IRENA’s
25 This resource map, along with a range of other GIS data visualisations, can be found on IRENA’s online Global Atlas platform: www.irena.org/globalatlas.
2016 report Investment Opportunities in West Africa: Suitability Maps for Grid-Connected and Off-Grid Solar and Wind (2016a).
That report provides pre-feasibility assessment of solar and wind opportunities, resulting in a high-resolution (1 km) suitability map of the ECOWAS region that accounts for a range of exclusion criteria.25 The map was used to select locations in each country’s most prevalent suitability category (e. g. 80–90 % suitable), situated on relatively flat land, and near existing transmission infrastructure. An example of the representative solar PV location selection in Benin can be seen in Figure 8 and Figure 9.
Figure 8 Country-level detail on technical potential (MW) by suitability category: Example of solar PV in Benin
Source: IRENA (2016a), Investment Opportunities in West Africa: Suitability Maps for Grid-Connected and Off-Grid Solar and Wind Projects. Figure taken from IRENA’s REsource Knowledge Gateway (resourceirena.irena.org/gateway).

• 40 • PL ANNING AND PROSPEC TS FOR RENE WABLE POWER
Source: IRENA (2016a), Investment Opportunities in West Africa: Suitability Maps for Grid-Connected and Off-Grid Solar and Wind Projects. Map taken from: http://irena.masdar.ac.ae/?map=2742. Map data: IRENA, Google and TerraMetrics.
Figure 9 Selection of representative resource locations using suitability maps on IRENA’s Global Atlas: Example of solar PV in Benin
For each representative country location, hourly annual solar irradiation and wind speed datasets from the past 30 years were provided by Vortex, based on NASA’s MERRA dataset. This was done as part of IRENA’s Solar and Wind Site Appraisal Programme.
To preserve the variability inherent in the wind and solar time series, hourly annual country data from one representative historical year were used, rather than a 30-year average. The choice of representative year was based on proximity of the year’s annual average capacity factor to the 30-year average. Only years from a subset of regional dry years were considered, to correspond with this analysis’ dry-year hydropower generation assumption across all scenarios.

• 41 •WEST AFRIC A
For final input into the SPLAT-W model, the resulting hourly generation profiles for wind and solar PV in each country in the ECOWAS region were then calibrated into 30 annual time slices (3 seasons, 10 daily time blocks) to correspond with the model’s updated load profile categorisation. While long-term generation expansion models such as SPLAT-W are not designed to assess the full impact of VRE deployment, the increased temporal model resolution and improved time slice calibration described above can be critical to better model the economic impact of VRE, by capturing the potential alignment of VRE supply and variable demand, and the time-linked operational constraints of a power system (e. g., flexibility), among other aspects.26
26 In addition to increased or improved temporal resolution, future analyses would do well to also expand upon the geospatial resolution of VRE options. An example of one methodology and data available for better geospatial representation can be found in IRENA’s Renewable Energy Zones for the Africa Clean Energy Corridor report (IRENA and LBNL, 2015).
The average annual country-specific solar and wind capacity factors employed in this study are presented in Table 10. An example of actual hourly wind and solar generation profiles for Benin (in light blue and light orange), and the SPLAT-W model’s time slice approximation for those profiles (in dark blue and dark orange) is given in Figure 10.
Solar PV Wind
Benin 18.8 % 12.6 %
Burkina Faso 20.5 % 19.1 %
Cabo Verde 20.4 % 27.6 %
Côte d’Ivoire 19.2 % 12.7 %
Gambia 20.0 % 10.9 %
Ghana 19.5 % 16.5 %
Guinea 20.2 % 14.4 %
Guinea-Bissau 19.7 % 15.3 %
Liberia 17.6 % 5.3 %
Mali 20.5 % 21.7 %
Niger 21.9 % 38.2 %
Nigeria 19.2 % 15.7 %
Senegal 20.4 % 27.6 %
Sierra Leone 18.1 % 7.9 %
Togo 19.3 % 15.0 %
Table 10 Solar PV and wind capacity factor by country

• 42 • PL ANNING AND PROSPEC TS FOR RENE WABLE POWER
Figure 10 Example of SPLAT-W hourly solar PV and wind generation profiles: Benin
1 3 5 7 9 11 13 15 17 19 21 23 1 3 5 7 9 11 13 15 17 19 21 23 1 3 5 7 9 11 13 15 17 19 21 23
Pre-Summer Summer Post-Summer
0.1 %
0.2 %
0.3 %
0.4 %
0.5 %
0.6 %
0.7 %
0
Modelled wind capacity factor
Actual hourly wind capacity factor
Modelled solar capacity factor
Actual hourly solar capacity factor

• 43 •WEST AFRIC A
Source: IRENA analysis, incorporating data from WAPP (2011), Update of the ECOWAS Revised Master Plan for the Generation and Transmission of Electrical Energy, www.ecowapp.org/en/documentation; World Bank (2007), Technical and Economic Assessment of Off-Grid, Mini-Grid and Grid Electrification Technologies (English), http://documents.worldbank.org/curated/en/634581468333897517/Technical-and-economic-assessment-of-off-grid-mini-grid-and-grid-electrification-technologies.
Figure 11 Overnight investment cost assumptions for generic non-renewable technologies
Cost of future power generation options
Figure 11 shows the overnight investment cost assumptions for generic non-renewable thermal generation technologies. As in the previous edition of this report, these assumptions are mainly based on the 2011/12 WAPP Master Plan, with the exception of distributed diesel generators, where parameters are sourced from the World Bank (2007).
No cost reduction is assumed for non-renewable technologies in the scenarios explored in this report.
0
500
1,000
1,500
2,000
2,500
3,000
2015 2020 2025 2030
)Wk/
DSU( tsoc latipac thginrev
O
Diesel/gasoline 1 kWsystem (urban/rural)
Diesel 100 kW system(industry)
Diesel centralised
HFO
OCGT
CCGT
Supercritical coal

• 4 4 • PL ANNING AND PROSPEC TS FOR RENE WABLE POWER
Figure 12 shows the overnight investment cost assumptions for generic renewable generation technologies. Investment costs of certain renewable technologies have fallen drastically in recent years, and all scenarios explored in this report reflect a continuation of that trend to some
extent. The assumed cost reductions for solar PV have been updated in this report to reflect the latest research by IRENA on project costs in Africa (2016b), and the remaining renewable cost assumptions are based on the most recent updates to IRENA’s internal costing database.
Figure 12 Overnight investment cost assumptions for generic renewable technologies
0
1,000
2,000
3,000
4,000
5,000
6,000
7,000
2015 2020 2025 2030
)Wk/DS
U( tsoc latipac thginrevO
Small hydro
Biomass
Onshore wind
Solar PV (utility)
Solar PV (rooftop – urbancommercial)
Solar PV (rooftop – urbanresidential)
Solar PV (rooftop – rural)
PV with battery (2 hour storage – rural)
Solar CSP no storage
Solar CSP with storage
The LCOE of generic future power generation options, although not a model input, is presented for reference in Table 11, based on the above assumptions around current and projected investment costs, fuel costs, O&M costs, capacity factor, generation capacity and expected years of operation. T&D costs and losses in delivery for the three specified consumer groups in the SPLAT model (as detailed previously in Table 3) are included in the LCOE calculation for electricity delivered through the grid.27
27 E. g.: LCOE for the industrial customer = LCOE of generation / (1-loss) + T&D costs of industry.
As generation profiles of generic wind and solar PV technologies are country-specific, the LCOE for these technologies is similarly country-specific – for reference the LCOE values for wind and solar PV technologies in Senegal are presented in Table 11. For LCOE values of wind and solar PV technologies by country, see Appendix C.
Notably, technology choice in the SPLAT model is not based solely on the factors behind LCOE: system requirements in terms of both reliability

• 45 •WEST AFRIC A
and the correlation of supply and demand profiles are also taken into account during optimisation. Additionally, the LCOE results shown here assume a load factor equal to the availability factor of the technologies (for availability factors by technology see Appendix B and Appendix C). Given differences in investment and fuel costs, the ranking of different technologies would change at different load factors. For example, gas plants at an 80 % load factor may be less competitive than coal on a levelised basis, but more competitive at a 40 % load factor. Diesel or OCGT would be competitive at very low load factors and may well play a role in meeting peak loads, which occur for short durations.
The MESSAGE platform on which the SPLAT model is built accounts for such aspects in its optimisation, and results may therefore differ from what could be expected from a simple LCOE analysis.
As noted earlier, generic technology options and costs are not applicable to large hydropower in the SPLAT-W model, as only site-specific projects are included as future generation options. Figure 13 shows the LCOE range for the large hydropower projects that are included in the latest model update as future options. Costs are highly site-dependent and can vary considerably from one plant to the next.
LCOE (USD/MWh) Generation Industry Urban Rural
2015 2030 2015 2030 2015 2030 2015 2030
Diesel/gasoline 1 kW system (urban/rural) 311 607 n/a n/a 311 607 311 607
Diesel 100 kW system (industry) 131 266 131 266 n/a n/a n/a n/a
Diesel centralised 138 273 148 288 171 313 188 360
HFO 98 178 105 187 121 203 133 234
OCGT (imported gas/LNG) 123 144 132 152 157 165 172 190
OCGT (pipeline gas) 116 136 124 143 143 156 157 179
OCGT (domestic gas) 91 106 98 112 108 122 128 140
CCGT (imported gas/LNG) 92 105 98 111 117 120 129 138
CCGT (pipeline gas) 87 100 94 105 108 114 119 131
CCGT (domestic gas) 72 81 77 86 85 93 101 107
Supercritical coal (imported) 97 103 105 108 124 117 137 135
Supercritical coal (domestic) 83 86 89 91 98 99 109 114
Biomass 95 95 102 100 117 109 129 125
Small hydropower 134 134 n/a n/a n/a n/a 134 134
Note: MWh = megawatt hour.
Table 11 LCOE assumptions for generic power technologies

• 46 • PL ANNING AND PROSPEC TS FOR RENE WABLE POWER
Note: MWh = megawatt hour; n/a = not applicable; h = hour.
LCOE (USD/MWh) Generation Industry Urban Rural
2015 2030 2015 2030 2015 2030 2015 2030
Solar PV (rooftop – commercial) 203 109 203 109 203 109 203 109
Solar PV (rooftop – rural) 420 218 n/a n/a n/a n/a 420 218
Solar PV (rooftop – urban) 213 126 n/a n/a 213 126 n/a n/a
Solar PV with 2 h storage (rooftop – rural) 864 455 n/a n/a n/a n/a 864 455
Solar PV with 2 h storage (rooftop – urban) 228 132 n/a n/a 228 132 n/a n/a
Solar PV (utility) 143 68 153 72 177 78 194 89
CSP no storage 327 209 351 220 406 239 444 275
CSP with storage 332 212 357 224 412 243 451 280
Wind far from grid 154 94 166 99 192 108 210 124
Wind near grid 136 77 147 81 170 88 185 101
Figure 13 LCOE: Distribution of 97 site-specific large hydropower projects
0
5
10
15
20
25
30
Num
ber o
f pro
ject
s
LCOE USD/MWh
0–50
50–10
0
100–15
0
150–2
00
200–2
50
250–3
00
300–3
50
350–4
00
400–450
450–5
00
Table 12 LCOE assumptions for generic variable power technologies: example of Senegal

• 47•WEST AFRIC A
3.8 CROSS-BORDER TRADE
Trade between countries is limited by existing infrastructure and planned transmission projects. Any hypothetical projects that are not currently identified are not included as options. Existing transmission infrastructure and planned projects for transmission are based on the WAPP Master Plan and are summarised in Table 13 and in Table 14, with further details in Appendix D. The earliest year that new cross-border transmission lines can be built has been updated in this report,
based on input from national experts, the 2016–19 WAPP Business Plan, and IRENA research. These updated assumptions largely reflect delays to projects that were expected to be completed over the past several years.
Importantly, unlike the 2013 edition of this report, the option to import electricity from the Central African region is no longer included in the scenarios analysed here, as it is not included as a key expectation in the 2011/12 WAPP Master Plan or recent regional discussions.
Country 1 Country 2 Line capacity (MW)
Ghana Côte d’Ivoire 327
Ghana Togo 438
Senegal Mali 100
Côte d’Ivoire Burkina Faso 327
Nigeria Benin 686
Togo Benin 345
Nigeria Niger 169
Source: IRENA analysis, incorporating data from WAPP (2011), Update of the ECOWAS Revised Master Plan for the Generation and Transmission of Electrical Energy, www.ecowapp.org/en/documentation.
Project name Capacity of line (MW) Earliest year
Committed projects
Dorsale 330 kV (Ghana, Togo/Benin, Côte d’Ivoire) ~650 2017–2019
CLSG (Côte d’Ivoire, Liberia, Sierra Leone) ~330 2018
OMVG (Senegal, Guinea, Gambia, Guinea Bissau) ~315 2019
Hub Intrazonal (Ghana, Burkina Faso, Mali, Côte d’Ivoire, Guinea) ~320 2017–2020
Planned projects
Corridor Nord (Nigeria, Niger, Togo/Benin, Burkina Faso) ~650 2020
Dorsale Mediane (Nigeria, Togo/Benin, Ghana) ~650 2020
OMVS (Mali, Senegal) ~330 2020
Notes: CLSG = Interconnection Côte d’Ivoire-Liberia-Sierra Leone-Guinea; kV = kilovolt; OMVG = The Gambia River Basin Development Organisation; OMVS = Senegal River Basin Development Organisation.
Source: IRENA analysis, incorporating data from WAPP (2011), Update of the ECOWAS Revised Master Plan for the Generation and Transmission of Electrical Energy, www.ecowapp.org/en/documentation; WAPP (2015), 2016–2019 WAPP Business Plan, www.ecowapp.org/en/documentation.
Table 13 Existing cross-border transmission infrastructure summary
Table 14 New cross-border transmission projects

• 4 8 • PL ANNING AND PROSPEC TS FOR RENE WABLE POWER
3.9 CONSTRAINTS RELATED TO SYSTEM AND UNIT OPERATION
In the SPLAT-W model, key system constraints are introduced to ensure the system is reliably operated, and that variable renewable generation – i. e. wind and solar power – is represented more accurately.
Reserve margin
To ensure power system reliability, excess operational capacity needs to be installed over and above peak demand requirements. This is referred to as a reserve margin and is defined as the difference between operable capacity and the peak demand for a particular year, as a percentage of peak demand. In all scenarios, a minimum reserve margin constraint of 10 % has been imposed on every country.28 Only “firm” capacity, which is guaranteed to be available to meet demand, is considered to contribute to this requirement.
The “capacity credit”, or the share of capacity that is considered firm, is set to 1.0 for dispatchable technologies such as thermal and large hydropower with dams.29 For variable renewable generation technologies, however, the capacity credit values that can be applied in such a modelling exercise typically depend on a statistical analysis of the correlation between a country’s variable resource and its demand profile.
28 While reserve margin is defined in the model, progress toward this target for countries currently below the 10 % level is practically constrained by the combination of existing capacity and available future capacity options in a given year. This essentially results in a gradual approach to 10 % reserve margins in certain contexts.
29 Note that capacity credit values assigned to conventional generation can depend on the methodology behind the value calculation. Values less than 1.0 are reasonably applied to account for plant availability in certain approaches .
The capacity credit of these technologies wis generally lower than their capacity factor, as no single site can be relied upon to generate power at any given time, considering the natural variability of wind and solar conditions. As reflected in the following section, the capacity credit of solar PV and wind is treated conservatively in this report, given that no country-level analysis has been performed.
The reserve margin constraint is defined as follows:
Where:
• α(i) is the capacity credit given to plant/technology (i) or share of capacity that is accounted as “firm” (fraction)
• CP(i) is the capacity of power plant/technology (i) in MW (centralised only)
• D is the peak demand on the centralised grid system in MW
• RM is the reserve margin (fraction).

• 49 •WEST AFRIC A
Constraints on variable renewables
Given that the model has an aggregate representation of the load, the variability of wind and solar PV is accounted for in an aggregate and conservative manner:
• Flexibility of dispatch: Both wind and solar PV are not given any flexibility in the way they can be dispatched to meet demand.
• Capacity credit: Centralised solar PV plants are given a 5 % capacity credit, and wind capacity is not considered to contribute to the reserve margin.30
In addition to conservative assumptions regarding the contribution of wind and solar PV to the reserve margin (i. e. their capacity credit), upper limits on the share of centrally dispatched generation (upstream of transmission) coming from these sources have also been set for all countries in this analysis – 25 % for wind and 50 % for solar PV on an annual basis, and 70 % for both sources combined on an instantaneous (i. e. hourly) basis.
These generic constraints have been assumed to ensure reliable systems are projected, in the absence of country-specific analyses of capacity credit values and/or operational constraints related to system flexibility. Performing such country-specific analyses would help to refine the constraints applied here, by capturing dynamics such as the potential increase in firm capacity of wind and solar PV due to the geographical spread of resources, which may reduce meteorological variability through diversification of site-specific generation profiles.
30 Detailed country-specific analyses of variable renewable production are recommended to improve upon these simplified assumptions. Note that solar PV could alternatively be modelled without a capacity credit, though sensitivity analysis run in parallel to this analysis found that the value assigned is not unduly favourable, with regional solar PV capacity deployment only marginally affected (e. g. decrease of <3 % by 2030 in the National Targets Scenario) if the technology is not considered to contribute to the reserve margin.
Load-following capability of power plants
There are some technical limitations as to how fast certain thermal plants – such as coal or biomass – can ramp up or down production. To represent this limitation, all coal plants in the model were de-rated by (1-availability). For example, a 100 MW coal plant with an availability of 85 % can only produce up to 85 MW at any given point in time. Biomass power plants were de-rated by the availability factor (50 %).
Run-of-river (ROR) hydropower plants as well as mini-hydropower options are modelled as non-dispatchable, with capacity de-rated by (1-availability). While seasonal generation profiles of ROR sites may warrant further investigation in more detailed analyses, they have not been incorporated in this report. Hydropower plants with dams are modelled as dispatchable to reflect the more flexible operation that a dam allows.
•50 • PL ANNING AND PROSPEC TS FOR RENE WABLE POWER

•5 1 •WEST AFRIC A
4.1 REFERENCE SCENARIO
As discussed in Section 3.1 (General definition of scenarios), the Reference Scenario in this study represents a wide-ranging update to the work presented in the 2013 edition of this report. The Reference Scenario here has been updated to reflect, inter alia, national expert input during IRENA’s 2015–2016 regional SPLAT training (particularly regarding generation and transmission capacity development), updated information around fuel costs and renewable technology costs, and enhancements in the representation of renewable energy generation in IRENA’s SPLAT-W model. For a full list of such updates, see Section 1.2 (This report).
Figure 14 presents the electricity generation mix in the updated Reference Scenario. As was the case in the 2013 edition of this report, the results regarding the prevalence of hydro and gas generation are broadly consistent with the reference scenario of the 2011/12 WAPP Master Plan. However, differences between the SPLAT-W results and the WAPP Master Plan continue to appear in the emergence of non-hydro renewables, and a lower share of hydropower due to a “dry-year” assumption imposed over the modelling period.
MODELLING RESULTS 4
Figure 14 Electricity production shares in the Reference Scenario
0 %
10 %
20 %
30 %
40 %
50 %
60 %
70 %
80 %
90 %
100 %
2015
2016
2017
2018
2019
2020 20
2120
2220
2320
2420
2520
2620
2720
2820
2920
30
Wind
Distributed solar PV
Solar PV
Solar thermal
Biomass
Mini-hydro
Hydro
Gas
Distributed oil
Oil
Coal
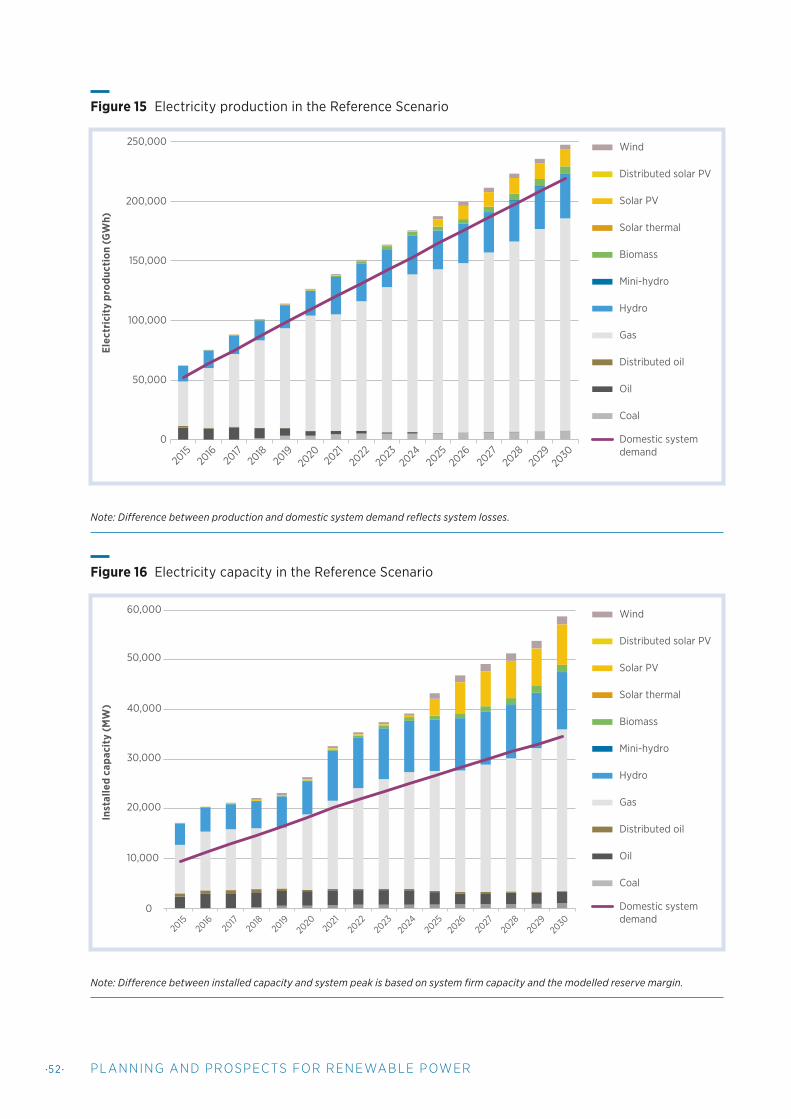
•52• PL ANNING AND PROSPEC TS FOR RENE WABLE POWER
Note: Difference between production and domestic system demand reflects system losses.
Figure 15 Electricity production in the Reference Scenario
Figure 16 Electricity capacity in the Reference Scenario
0
50,000
100,000
150,000
200,000
250,000
Elec
tric
ity
prod
ucti
on (G
Wh)
Wind
Distributed solar PV
Solar PV
Solar thermal
Biomass
Mini-hydro
Hydro
Gas
Distributed oil
Oil
Coal
Domestic systemdemand
2015
2016
2017
2018
2019
2020 20
2120
2220
2320
2420
2520
2620
2720
2820
2920
30
0
10,000
20,000
30,000
40,000
50,000
60,000
20
1520
1620
1720
1820
1920
2020
2120
2220
2320
2420
2520
2620
2720
2820
2920
30
Wind
Distributed solar PV
Solar PV
Solar thermal
Biomass
Mini-hydro
Hydro
Gas
Distributed oil
Oil
Coal
Domestic systemdemand
Inst
alle
d ca
paci
ty (
MW
)
Note: Difference between installed capacity and system peak is based on system firm capacity and the modelled reserve margin.

•53 •WEST AFRIC A
As discussed in Section 3.3 (Electricity demand), and reflected in Figure 15 and Figure 16, electricity demand in ECOWAS member countries is expected to increase nearly fourfold between 2015 and 2030, mainly driven by growth in Nigeria, Ghana and Côte d’Ivoire (together accounting for roughly 80 % of regional demand, both currently and in 2030). At the same time, as seen in Figure 17, around 3.5 GW of currently installed capacity is scheduled to retire across the region, mainly consisting of oil and gas generation in the early and mid-2020s.
To fill the supply-demand gap, the capacity of the region’s most widely used generation technologies
31 This represents a significant difference to the 2013 edition of this report, in which the options to build generic large hydropower capacity and import hydropower production from Central Africa were available, leading to a 41 % share of large hydropower in regional electricity supply by 2030 under the Renewable Promotion Scenario explored in that study.
– gas and hydropower – roughly triples in the Reference Scenario by 2030 (to 32 GW and 11.5 GW, respectively).
The share of hydropower in overall generation decreases over the same period (from 22 % of generation in 2015 to 15 % in 2030), however, as increasingly competitive solar PV, wind and biomass capacity is also deployed to meet demand growth and replace retired capacity in the mid-2020s.31 Regional electricity production observes a general trend of new renewable and gas generation displacing generation from existing oil-fuelled capacity, even though less utilised oil-fuelled capacity remains online to fulfil reserve margin requirements and meet certain instances of peak demand.
Figure 17 Evolution of existing capacity mix
0
2,000
4,000
6,000
8,000
10,000
12,000
14,000
16,000
18,000
20,000
2016
2017
2018
2019
2020 20
2120
2220
2320
2420
2520
2620
2720
2820
2920
30
Wind
Solar PV
Biomass
Hydro
Gas
Oil
Coal
MW

•5 4 • PL ANNING AND PROSPEC TS FOR RENE WABLE POWER
Interestingly, in the updated Reference Scenario, solar PV and wind make up roughly 10 % of total grid-connected electricity production in the region by 2030, compared to essentially 0 % in the 2013 edition of this report. This competitiveness reflects the impressive cost reductions observed in wind and solar PV technology in recent years.
This is perhaps even more notable given that projections of oil and gas fuel costs in 2030 have also fallen in the updated Reference Scenario, by 20–30 % relative to 2013 (in real terms).
Figure 18 New capacity additions under the Reference Scenario
0
1,000
2,000
3,000
4,000
5,000
6,000
7,000
2016
2017
2018
2019
2020 20
2120
2220
2320
2420
2520
2620
2720
2820
2920
30
Wind
Distributed solar PV
Solar PV
Solar thermal
Biomass
Mini-hydro
Hydro
Gas
Oil
Coal
MW

•55 •WEST AFRIC A
4.2 RENEWABLE TARGET SCENARIOS
Capacity and generation
Figure 19 and Figure 20 display a comparison of the capacity and generation mixes in the Reference Scenario with those in the two alternative scenarios explored in this report, in which regional and national renewable energy targets are met. Although the Reference Scenario sees a significant share of renewable generation by 2030, at 25 % of total grid-connected generation, additional capacity deployment is required in the Regional EREP Target Scenario to meet the EREP target of 31 %.
Based on the regional optimisation performed by the SPLAT-W model, greater renewable deployment is mainly achieved through the substitution of gas consumption by biomass and solar PV (particularly in Ghana and Côte d’Ivoire, where utilisation of additional biomass and solar PV capacity replaces both domestic gas production and imported gas from Nigeria). As seen in Figure 21, by 2030 biomass and solar PV capacity increases in the Regional EREP Target Scenario by 3 GW and 1 GW, respectively, relative to the Reference Scenario.
Renewable energy targets: Implications of metric choice
Renewable energy targets – and the extent to which they are achieved – can be quite different depending on the metric used. This is important to keep in mind when reviewing the results of the scenarios presented in this analysis. As noted in Sections 1.1 (Background) and 3.1 (General definition of scenarios), the region’s EREP contains targets for grid-connected renewables both in capacity terms (as a percentage of peak load) and in generation terms.
In the Reference Scenario presented here, the 2030 results for the renewable share of generation – the metric used in the modelling of regional targets in this analysis – fall short of the EREP target of 31 % by six percentage points (with large hydro producing 15 % vs an envisaged 19 %, and other renewables producing 10 % vs an envisaged 12 %). However, the renewable share of capacity (percentage of peak load) in 2030 under the same Reference Scenario not only meets but exceeds the official EREP target of 48 % by 17 percentage points (with large hydro at 33 % and 11,386 MW vs an envisaged 29 % and 11,177 MW, and other renewables at 32 % and 11,165 MW vs an envisaged 19 % and 7,606 MW).
This discrepancy points to the importance of underlying assumptions behind renewable energy targets, such as technology mix and capacity factors of future technologies in the system. While there is more hydro capacity in the Reference Scenario than envisaged in the EREP, the dry-year assumption used in this analysis means the actual generation from that capacity – its capacity factor – is less than anticipated. A similar dynamic is at play for non-hydro renewables in the Reference Scenario – although the results here show nearly 4 GW more capacity than the EREP targets, they do not include the CSP technology anticipated in the EREP, which has a higher capacity factor than both solar PV and wind. As a result, generation from the non-hydro renewable technology mix is lower than anticipated in the target-setting methodology.
These results underline the fact that caution should be exercised if considering renewable energy targets in both capacity and generation terms. Ensuring consistency is often difficult, given the uncertainty around future technology mix and system dynamics. IRENA’s Renewable Energy Target Setting report (2015) provides an overview of the advantages and disadvantages surrounding both types of target design.
Box 1

•56 • PL ANNING AND PROSPEC TS FOR RENE WABLE POWER
In the National Targets Scenario, ECOWAS member countries’ domestic ambitions would, in aggregate, clearly deliver an even greater share of renewable energy in the regional power generation mix. In comparison with the Regional EREP Target Scenario, over 12 GW of additional solar PV capacity and 1 GW of additional biomass capacity
are built in Nigeria alone over the model horizon to meet its national renewable energy targets. As seen in Figure 21, under the National Targets Scenario, the size of the grid-connected solar PV market would be over 20 GW by 2030, compared to just over 8 GW in the Reference Scenario.
Figure 19 Electricity capacity in Reference, Regional Target and National Targets Scenarios
Figure 20 Electricity production in Reference, Regional Target and National Targets Scenarios
2015 2020 2030 2015 2020 20302015 2020 2030
10,000
40,000
20,000
30,000
50,000
60,000
70,000
0
Wind
Distributed solar PV
Solar PV
Solar thermal
Biomass
Mini-hydro
Hydro
Gas
Distributed oil
Oil
Coal
System Peak Demand
Reference Regional Target National Targets
MW
Reference Regional Target National Targets
2015
2016
2017
2018
2019
202020
2120
2220
2320
2420
2520
2620
2720
2820
2920
30 2015
2016
2017
2018
2019
202020
2120
2220
2320
2420
2520
2620
2720
2820
2920
30 2015
2016
2017
2018
2019
202020
2120
2220
2320
2420
2520
2620
2720
2820
2920
300 %
10 %
20 %
30 %
40 %
50 %
60 %
70 %
80 %
90 %
100 %

•57•WEST AFRIC A
Figure 21 Solar PV, wind and biomass capacity in Reference, Regional Target and National Targets Scenarios
2015
2016
2017
2018
2019
2020 20
2120
2220
2320
2420
2520
2620
2720
2820
2920
300
10,000
15,000
20,000
5,000
National Targets Scenario
Regional Targets Scenario
Reference Scenario
MW
Solar PV
2015
2016
2017
2018
2019
2020 20
2120
2220
2320
2420
2520
2620
2720
2820
2920
300
500
1,000
5,000
1,500
2,000
2,500
3,000
3,500
4,000
4,500
National Targets Scenario
Regional Targets Scenario
Reference Scenario
MW
Biomass
2015
2016
2017
2018
2019
2020 20
2120
2220
2320
2420
2520
2620
2720
2820
2920
300
200
400
1,800
600
800
1,000
1,200
1,400
1,600
National Targets Scenario
Regional Targets Scenario
Reference Scenario
MW
Wind

•58 • PL ANNING AND PROSPEC TS FOR RENE WABLE POWER
Wind
Distributed solar PV
Solar PV
Solar thermal
Biomass
Mini-hydro
Hydro
Gas
Distributed oil
Oil
Coal
Net imports
2015
Guinne
a-Biss
au
Liber
ia
Gambia
Cabo V
erde
Sierra
Leone
Togo
Benin
NigerBur
kina F
aso
Guinea
Mali Sene
gal
Côte d'Iv
oire
Ghana
Nigeria
Tota
l
0 %
-20 %
20 %
40 %
60 %
80 %
100 %Guin
nea-
Bissau
Liber
ia
Gambia
Cabo V
erde
Sierra
Leone
Togo
Benin
NigerBur
kina F
aso
Guinea
Mali Sene
gal
Côte d'Iv
oire
Ghana
Nigeria
Tota
l
0 %
-20 %
20 %
40 %
60 %
80 %
100 %
-40 %
Guinne
a-Biss
au
Liber
ia
Gambia
Cabo V
erde
Sierra
Leone
Togo
Benin
NigerBur
kina F
aso
Guinea
Mali Sene
gal
Côte d'Iv
oire
Ghana
Nigeria
Tota
l
0 %
-20 %
20 %
40 %
60 %
80 %
100 %
-40 %
Guinne
a-Biss
au
Liber
ia
Gambia
Cabo V
erde
Sierra
Leone
Togo
Benin
NigerBur
kina F
aso
Guinea
Mali Sene
gal
Côte d'Iv
oire
Ghana
Nigeria
Tota
l
0 %
-20 %
20 %
40 %
60 %
80 %
100 %
-40 %
2030 – Reference
2030 – National Targets – Regional Target 2030
Figure 22 Electricity production shares by country (2015–2030) in Reference, Regional Target and National Targets Scenario

•59 •WEST AFRIC A
Taking a closer look at the National Targets Scenario, Figure 23 and Figure 24 show the annual investment schedule for the region as a whole, and for solar PV capacity by country. Appendix E provides a detailed list of the specific projects deployed in the SPLAT model under this scenario.
As in the Reference Scenario, under the National Targets Scenario the majority of capacity additions in the coming decade are gas and hydropower, which account for 13 GW (46 %) and 6 GW (21 %)
of total new capacity added between 2016 to 2025, respectively. This is to be expected to some extent, given that hydropower and gas projects together make up 85 % of the region’s current planned capacity pipeline (53 % hydropower and 32 % gas). However, between 2025 and 2030, ahead of 2030 national targets and as solar PV and wind technology costs decline, non-hydro renewable capacity becomes the driver of new additions, accounting for around 19 GW (66 %) over the period.
Figure 23 New capacity additions under the National Targets Scenario
0
1,000
2,000
3,000
4,000
5,000
6,000
7,000
8,000
Wind
Distributedsolar PV
Solar PV
Solar thermal
Biomass
Mini-hydro
Hydro
Gas
Oil
Coal
MW
2016
2017
2018
2019
2020 20
2120
2220
2320
2420
2520
2620
2720
2820
2920
30

•60 • PL ANNING AND PROSPEC TS FOR RENE WABLE POWER
Looking at solar PV in particular, the majority of new capacity in the National Targets Scenario is deployed in Nigeria, Ghana and Côte d’Ivoire, reflecting their large share of regional electricity demand. Relatively smaller countries with better solar resources (i. e. >20 % average capacity factor), such as Guinea, Burkina Faso, Senegal and Mali, also deploy significant amounts of solar PV capacity to meet their national targets.
Altogether, the solar PV deployment depicted in Figure 24 reflects an average annual addition of roughly 1.5 GW under the National Targets Scenario. As seen in Figure 25, due to the nature of the wind resource in West Africa, wind capacity deployment is less widespread, with smaller – though nationally significant – amounts concentrated in Senegal and Niger.
32 For all countries’ hourly dispatch profiles, see Appendix F. Values 1, 2 and 3 in Figure 26 represent the three seasons modelled in SPLAT-W in this report, namely pre-summer (January–April), summer (May–August) and post-summer (September–December). For shares of solar PV and wind in overall generation by country, see Figure 22.
An example of how such VRE capacity is reflected in the SPLAT-W model’s generation mix can be seen in Figure 26, which displays the modelled generation for Ghana in the year 2030. Complemented by a range of flexible supply options, such as hydropower, biomass, imports, gas and peaking thermal plant, the share of VRE in the overall generation of several countries reaches levels over 25 % by 2030 in the National Targets Scenario.32
Figure 24 New solar PV capacity additions under the National Targets Scenario
0
500
1,000
1,500
2,000
2,500
3,000
3,500
4,000 Togo
Sierra Leone
Senegal
Nigeria
Niger
Mali
Liberia
Guinea-Bissau
Guinea
Ghana
Gambia
Côte d'Ivoire
Cape Verde
Burkina Faso
Benin
MW
2016
2017
2018
2019
2020 20
2120
2220
2320
2420
2520
2620
2720
2820
2920
30

•6 1 •WEST AFRIC A
Figure 25 Solar PV and wind capacity in 2030 by country under the National Targets Scenario
Guinne
a-Biss
au
Liber
ia
Gambia
Cabo V
erde
Sierra
Leone
Togo
Benin
Niger
Burkin
a Fas
o
GuineaMali
Sene
gal
Côte d'Iv
oire
Ghana
Nigeria
0
500
1,000
1,500
2,000
2,500
3,000
3,500
4,000
12,000
14,000
MW
Solar PV Wind
Figure 26 Hourly SPLAT-W generation mix of Ghana over three model seasons in 2030 – National Targets Scenario
1 2 3
1,000
2,000
3,000
4,000
5,000
6,000
01 3 5 7 9 11 13 15 17 19 21 232 4 6 8 10 12 14 1616 18 2220 24 1 3 5 7 9 11 13 15 17 19 21 232 4 6 8 10 12 14 1616 18 2220 24 1 3 5 7 9 11 13 15 17 19 21 232 4 6 8 10 12 14 1616 18 2220 24
Wind
Distributed solar PV
Solar PV
Solar thermal
Biomass
Mini-hydro
Hydro
Gas
Distributed oil
Oil
Coal
Net imports
MW

•62• PL ANNING AND PROSPEC TS FOR RENE WABLE POWER
Renewable targets and diversity of supply mix
The fact that national ambitions would deliver more renewable capacity in the region, relative to the Reference Scenario explored in this study, is reflected in the renewable energy share of generation across scenarios. As seen in Figure 27, the trajectory of the National Targets Scenario suggests the regional share of renewables in centralised generation would meet the EREP target of 31 % five years earlier than anticipated, by 2025. By 2030 aggregated national targets result in renewable production equivalent to 38 % of the regional total.
Across the scenarios, the main driver of the transition is the addition of solar PV, wind and biomass (together 23 % of total generation by 2030 in the National Targets Scenario),
as hydropower settles into a share of about 15–20 % throughout the model horizon (for further discussion see Box 1).
As regards diversity of supply, systems that rely on multiple sources of primary energy are also more robust to shocks, constraints and crises affecting one or another form of supply. A commonly used indicator of systems diversity (in both richness – i. e. category count – and evenness – i. e. balance) is the Shannon-Weiner Index (SWI), defined as:
where pi is the share of installed capacity for resource i.
Figure 27 Renewable energy share of centralised electricity production across scenarios
0 %
5 %
10 %
15 %
20 %
25 %
30 %
35 %
40 %
2015 2020 2025 2030
RE (Reference)
RExH (Reference)
RE (Regional)
RExH (Regional)
RE (National)
RExH (National)
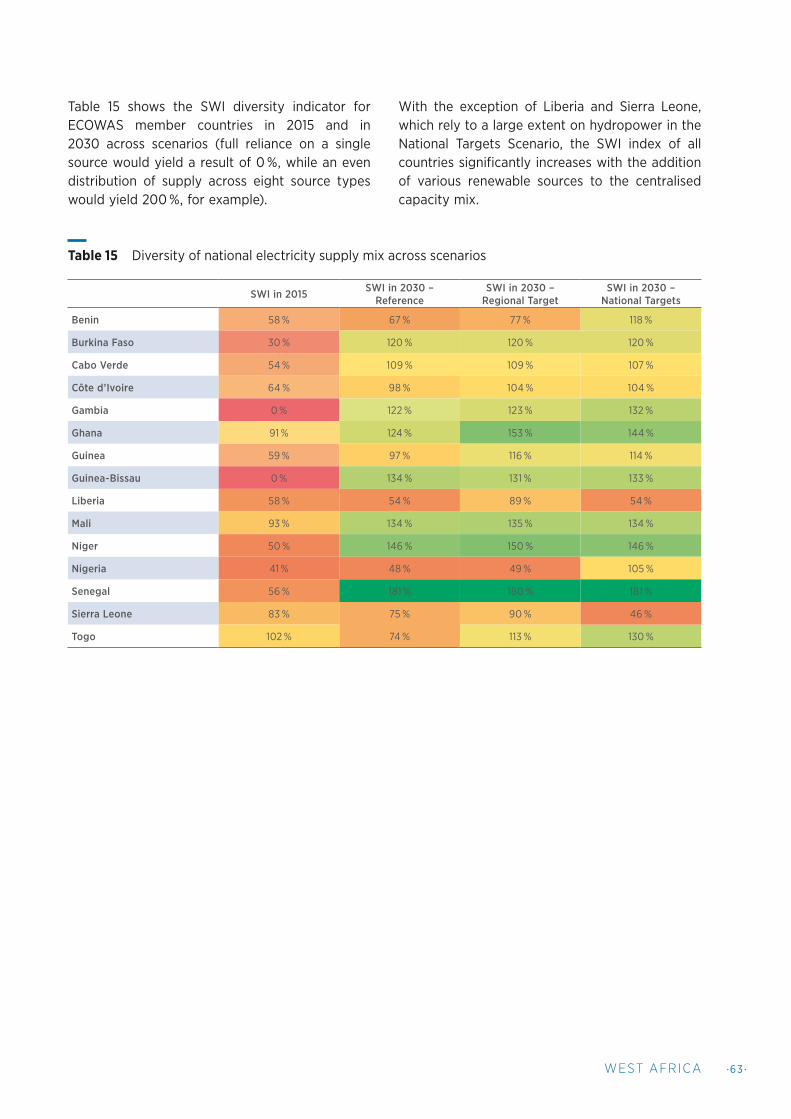
•63 •WEST AFRIC A
SWI in 2015 SWI in 2030 – Reference
SWI in 2030 – Regional Target
SWI in 2030 – National Targets
Benin 58 % 67 % 77 % 118 %
Burkina Faso 30 % 120 % 120 % 120 %
Cabo Verde 54 % 109 % 109 % 107 %
Côte d’Ivoire 64 % 98 % 104 % 104 %
Gambia 0 % 122 % 123 % 132 %
Ghana 91 % 124 % 153 % 144 %
Guinea 59 % 97 % 116 % 114 %
Guinea-Bissau 0 % 134 % 131 % 133 %
Liberia 58 % 54 % 89 % 54 %
Mali 93 % 134 % 135 % 134 %
Niger 50 % 146 % 150 % 146 %
Nigeria 41 % 48 % 49 % 105 %
Senegal 56 % 181 % 180 % 181 %
Sierra Leone 83 % 75 % 90 % 46 %
Togo 102 % 74 % 113 % 130 %
Table 15 shows the SWI diversity indicator for ECOWAS member countries in 2015 and in 2030 across scenarios (full reliance on a single source would yield a result of 0 %, while an even distribution of supply across eight source types would yield 200 %, for example).
With the exception of Liberia and Sierra Leone, which rely to a large extent on hydropower in the National Targets Scenario, the SWI index of all countries significantly increases with the addition of various renewable sources to the centralised capacity mix.
Table 15 Diversity of national electricity supply mix across scenarios

•6 4 • PL ANNING AND PROSPEC TS FOR RENE WABLE POWER
Regional trade flows
To give an example of the regional trade flows behind the modelling results presented here, Figure 28 displays net cross-border trade direction and volumes (in GWh) under the National Targets Scenario in 2030. Cross-border transmission projects considered in this study are summarised in Appendix D.
As evident in the figure, the main conduit of net cross-border electricity trade flows is the Coastal Backbone/Dorsale infrastructure between Nigeria, Benin, Togo and Ghana. Both committed and planned expansion of this infrastructure is developed across all scenarios explored here, to allow for the export of Nigeria’s major domestic hydro, gas and other renewable generation. The Intrazonal Hub (linking Ghana, Burkina Faso, Côte d’Ivoire and Mali) and North-core/Corridor Nord (linking Nigeria, Niger, Benin and Burkina Faso) projects are the next largest sources of net cross-border electricity exchange, and are both significantly expanded across scenarios.
While the Intrazonal Hub is important from 2017 onward to allow export of gas-generated and hydro power from Côte d’Ivoire to Mali, it also becomes important in the late 2020s to facilitate the export of Burkina Faso’s daytime surplus of low-cost solar production to Ghana. Similarly, the main development of the North-core/Corridor Nord project occurs in the mid- to late-2020s, to facilitate the export of wind production in Niger, where resource quality is highest in the region.
Although there is relatively less net exchange across the CLSG infrastructure connecting Côte d’Ivoire, Liberia, Sierra Leone and Guinea, this project becomes particularly important for exploiting the diurnal complementarity and exchange between low-cost hydropower in Sierra Leone and solar power in Guinea. The OMVG project between Guinea, Guinea-Bissau, Gambia and Senegal, which is taken to be committed, sees the relatively lowest net trade flows, but plays an important role for Gambia, which relies on a significant national share of imports across all scenarios. The OMVS project, to expand transmission capacity between Mali and Senegal, was not selected for development in the scenarios modelled here.
Figure 28 Regional trade in 2030 in the National Targets Scenario (GWh)
Senegal
Mali
Nigeria
Niger
Burkina Faso
Togo
Benin
Ghana
Côte d'Ivoire
Liberia
Sierra Leone
GuineaGuinea Bissau
Gambia
7,812
10,384
9,160
84
211
33
28
1,619
1,221
1,728
8725
100 166
102
2,511
608 81
274

•65 •WEST AFRIC A
Climate and NDC implications of the National Targets Scenario
The level of carbon dioxide (CO₂) emissions from the power sector across scenarios largely follows the trajectory of renewable energy deployment and the achievement of renewable energy generation targets. Differences in scenario emissions become larger over the modelling horizon and, as seen in Figure 29, by 2030 the National Targets Scenario delivers an emissions reduction of 12.5 MtCO₂, or 15 %, versus the Reference Scenario in this analysis.
The current emphasis on NDCs under the Paris Agreement heightens the significance of the indicative climate benefits in the National Targets Scenario presented here. As IRENA’s recent report, Untapped Potential for Climate Action shows, there is often room to expand NDC ambition simply by reflecting targets set in national energy plans (IRENA, 2017). Robust techno-economic analysis of power systems, using tools such as IRENA’s SPLAT-W model, has an integral role to play in exploring such untapped potential, by ensuring regular renewable energy target and NDC updates are supported by transparent, data-informed analysis.
0
10
20
30
40
50
60
70
80
90
2015 2020 2025 2030
Reference Regional Target National Target
MtC
O2
Figure 29 Carbon dioxide emissions across scenarios

•66 • PL ANNING AND PROSPEC TS FOR RENE WABLE POWER
Figure 30 Total undiscounted system costs in the National Targets Scenario
0
50,000
100,000
150,000
200,000
250,000
0
5,000
10,000
15,000
20,000
25,000
2015 2016 2017 2018 2019 2020 2021 2022 2023 2024 2025 2026 2027 2028 2029 2030
O&M Generation capacity FuelDomestic T&D Cross-border transmission Cumulative (RHS)
USD
mill
ion
Economic implications of the National Targets Scenario
The SPLAT model computes economic implications of a given scenario in terms of investment cost (in generation and T&D), fuel costs and O&M costs. The sum of these cost elements constitutes the system costs that the model aims to minimise.
Figure 30 shows the breakdown of undiscounted system costs between 2015 and 2030 in the National Targets Scenario. Note that the investment costs are annualised over the lifetime of each technology. The figure shows that while fuel costs remain the largest portion of total system costs, their overall share declines substantially as large
investments in hydropower and other renewable energy sources are deployed in the 2020s to meet growing demand and national targets.
Between 2016 and 2030, regional spending on fuel falls from 75 % to 50 % of overall system costs, while capacity investment rises from roughly 10 % to 30 %. Despite the buildout of cross-border transmission in the 2020s, both international and domestic T&D remain a less substantial piece of overall system costs, never surpassing 7 % of the total. Cumulatively, system costs between 2016 and 2030 would amount to USD 192 billion (undiscounted), reaching an annualised cost of around USD 20 billion (undiscounted) by 2030.

•67•WEST AFRIC A
Figure 31 Difference in undiscounted system costs (itemised) between the National Targets Scenario and Reference Scenario
(2,000)
(1,500)
(1,000)
(500)
0
500
1,000
1,500
2,000
2015 2016 2017 2018 2019 2020 2021 2022 2023 2024 2025 2026 2027 2028 2029 2030
O&M Generation capacity Fuel
Domestic T&D Cross-border transmission Annualised costs
USD
mill
ion
Figure 31 compares the annualised system costs of the National Targets Scenario and the Reference Scenario over the modelling horizon by cost component. Differences up to 2020 are insignificant, as many of the same committed projects would be implemented in both scenarios during this time.
The differences between individual cost components become increasingly large in the
longer term, however, as greater capacity investment in renewables such as solar PV, biomass and wind is offset by savings in fuel costs from displaced gas generation. Due to this dynamic, the results here suggest that meeting national renewable targets in ECOWAS would entail essentially the same overall system cost to 2030, with differences in annualised undiscounted costs in the National Targets Scenario never surpassing +/- 1 % of the total.

•68 • PL ANNING AND PROSPEC TS FOR RENE WABLE POWER

•69 •WEST AFRIC A
IRENA’s SPLAT-W model was developed to provide decision makers and analysts from IRENA
member countries in the ECOWAS region with a planning tool to design power systems for the medium to long term, prioritise investment options and assess the economic implications of a given investment path. More specifically, SPLAT-W allows analysts to explore power system pathways that meet various requirements (including reliability and renewable energy targets), while taking into account investment and operation costs to meet daily/seasonally fluctuating demand.
This report is based on recent regional policy developments, inputs and outputs from national experts in 2015–2016 IRENA/ECREEE SPLAT-W model training sessions, and various improvements to the representation of renewables in SPLAT-W. It describes how three scenarios were developed for ECOWAS member countries as a basis for further analysis and possible elaboration.
The main findings from analysing the Reference, Regional Renewable Target, and National Renewable Targets scenarios in this report include the following:
• Despite a projected fourfold increase in regional demand, updated assumptions to reflect significantly lower fossil fuel price projections, and limited large hydropower potential relative to IRENA’s 2013 analysis, the share of renewable energy sources increases in this report’s Reference Scenario to exceed EREP capacity targets, reaching 65 % of peak load by 2030.
• While renewable capacity deployment in the Reference Scenario exceeds expectations, renewable generation in the same scenario is 6 % points short of the 31 % EREP target, reflecting the complexity of renewable energy target-setting using various metrics. This is mainly due to dry-year assumptions used for hydropower generation, and a lower average capacity factor in the non-hydro renewable mix than assumed in the EREP target-setting process.
• National renewable targets would deliver an even greater amount of renewable capacity relative to the Reference and Regional Target Scenarios, and in aggregate those targets do surpass the regional 2030 renewable generation target of 31 % five years earlier than expected, resulting in a 38 % share of renewable energy in total regional generation by 2030.
CONCLUSIONS 5

•70 • PL ANNING AND PROSPEC TS FOR RENE WABLE POWER
• Projected reductions in solar PV and wind technology costs make non-hydro renewables the primary driver of new capacity additions across all scenarios in the mid- to late-2020s, with solar PV, wind and biomass generating 23 % of total regional generation by 2030 in the National Targets Scenario.
• Depending on the scenario analysed, the amount of solar PV in the ECOWAS region ranges from 8 GW to over 20 GW by 2030, implying an annual average deployment of 1.5 GW under a National Targets Scenario.
• The diversity, and thus the resiliency, of the electricity supply mix in the vast majority of ECOWAS member countries significantly increases with the addition of various renewable sources to the capacity mix.
• The development of nearly all cross-border transmission infrastructure projects currently in the pipeline proves to be beneficial across all scenarios analysed.
• The increased capacity investment costs required to deliver national renewable targets are consistently offset by savings in fuel costs from displaced fossil fuel generation, resulting in overall system costs that are essentially equivalent to the Reference Scenario.
The SPLAT-W model allows for the quantification and substantiation of the above points. In the updated version of the SPLAT-W model employed here, improvements to the representation of renewable energy, including increased temporal resolution, improved time slice calibration and country-specific solar and wind generation profiles, allow for additional insights.
With the updated SPLAT-W model, analysts can now perform a country-level analysis of hourly dispatch in representative days, taking into account each country’s particularities of composition of demand, available resources and resource profiles, and connection within the regional transmission network.
As seen in this report, this enables a more refined analysis of VRE generation, the sources of system flexibility that can support that generation, and opportunities for complementary trade that would benefit both resource-rich and resource-poor countries.

•7 1 •WEST AFRIC A
Adebisi, A. (2015), “Sustainable Energy for All (SE4ALL) Action Agenda for Nigeria”, Abidjan, 13–15 September 2015, www.ecreee.org/sites/default/files/events/presentation_se4all_action_agenda_nigeria.pdf (accessed January 2017).
ECREEE (ECOWAS Centre for Renewable Energy and Energy Efficiency) (2013), ECOWAS Renewable Energy Policy, ECREEE, Praia, www.ecreee.org/page/ecowas-renewable-energy-policy-erep (accessed December 2016).
Hughes et al. (2017), “Hybrid renewable energy and hydrogen fuel cell mini-grids for rural off-grid electrification in South Africa”, Energy Research Centre, University of Cape Town and the South African National Energy Development Institute, South Africa.
Idrissa, H. (2004), “Projet de création d’une société de traitement et de commercialisation du charbon minéral à des fins domestiques (SNTCD)” (Project to establish a company for the processing and marketing of coal for domestic purposes), Ministry of Mines and Energy, Republic of Niger, www.cilss.bf/predas/Activites%20par%20Pays/NE/34-Projet%20de%20creation%20societe%20charbon%20mineral.pdf (accessed December 2016).
IEA (International Energy Agency) (2016), World Energy Outlook 2016, OECD/IEA, Paris, http://dx.doi.org/10.1787/weo-2016-en.
IRENA (International Renewable Energy Agency) (2017), Untapped Potential for Climate Action: Renewable Energy in Nationally Determined Contributions, IRENA, Abu Dhabi.
IRENA (2016a), Investment Opportunities in West Africa: Suitability Maps for Grid-Connected and Off-Grid Solar and Wind Projects, IRENA, Abu Dhabi.
IRENA (2016b), Solar PV in Africa: Costs and Markets, IRENA, Abu Dhabi.
IRENA (2015), Renewable Energy Target Setting, IRENA, Abu Dhabi.
IRENA (2014a), Estimating the Renewable Energy Potential in Africa: A GIS-based Approach, IRENA, Abu Dhabi.
IRENA (2014b), Global Bioenergy Supply and Demand Projections: A Working Paper for REmap 2030, IRENA, Abu Dhabi.
IRENA (2013), West African Power Pool: Planning and Prospects for Renewable Energy, IRENA, Abu Dhabi.
IRENA (2011), Scenarios and Strategies for Africa, IRENA, Abu Dhabi.
IRENA and LBNL (Lawrence Berkeley National Laboratory) (2015), Renewable Energy Zones for the Africa Clean Energy Corridor, IRENA, Abu Dhabi.
N’Goran, N. (2015), “Energie Durable pour Tous (SE4ALL) Agenda d’Actions Côte d’Ivoire”, Abidjan, 13–15 September 2015, www.ecreee.org/sites/default/files/events/presentation_se4all_action_agenda_cote_divoire.pdf (accessed January 2017).
Niane, I. (2015), “Energie Durable pour Tous (SE4ALL) Agenda d’Actions Sénégal”, Abidjan, 13–15 September 2015, www.ecreee.org/sites/default/files/events/presentation_se4all_action_agenda_senegal.pdf (accessed January 2017).
REFERENCES

•72• PL ANNING AND PROSPEC TS FOR RENE WABLE POWER
Raul, J. A. (2015), “Agenda de Ação para a Energia Sustentável para Todos (SE4ALL) Guiné-Bissau”, Abidjan, 13–15 September 2015, www.ecreee.org/sites/default/files/events/presentation_se4all_action_agenda_guinea_bissau.pdf (accessed January 2017).
Tettey, G. D. (2015), “Sustainable Energy for All (SE4ALL) Action Agenda for Ghana”, Abidjan, 13–15 September 2015, www.ecreee.org/sites/default/files/events/sustainable_energy_action_plan_ghana.pdf (accessed January 2017).
Touré, I. (2015), “Energie Durable pour Tous (SE4ALL) Agenda d’Actions Mali”, Abidjan, 13–15 September 2015 www.ecreee.org/sites/default/files/events/sustainable_energy_action_plan_mali.pdf (accessed January 2017).
UNIDO (United Nations Industrial Development Organization) and ICSHP (International Center on Small Hydro Power) (2016), World Small Hydropower Development Report 2016, UNIDO, Vienna, and ICSHP, Hangzhou, www.smallhydroworld.org/menu-pages/reports/2016/ (accessed April 2017).
WAPP (West African Power Pool) (2015), 2016– 2019 WAPP Business Plan, WAPP, Cotonou, www.ecowapp.org/en/documentation (accessed January 2017).
WAPP (2011), Update of the ECOWAS Revised Master Plan for the Generation and Transmission of Electrical Energy, WAPP, Cotonou, www.ecowapp.org/en/documentation (accessed December 2016).
World Bank (2017), “GDP deflator”, World Development Indicators (database), http://d a t a b a n k .wo r l d b a n k . o r g /d a t a /r e p o r t s .aspx?source=world-development-indicators (accessed January 2017).
World Bank (2007), Technical and Economic Assessment of Off-Grid, Mini-Grid and Grid Electrification Technologies (English), Energy Sector Management Assistance Programme (ESMAP) technical paper series, ESM 121/07, Washington, DC, http://documents.worldbank.org/curated/en/634581468333897517/Technical-and-economic-assessment-of-off-grid-mini-grid-and-grid-electrification-technologies.

•73 •WEST AFRIC A
APPENDIX A. DETAILED DEMAND DATA
APPENDICES
GW
h
Ben
in
Bur
kina
Fas
o
Cab
o Ve
rde
Côt
e d’
Ivoi
re
Gam
bia
Gha
na
Gui
nea
Gui
nea-
Bis
sau
Libe
ria
Mal
i
Nig
er
Nig
eria
Sene
gal
Sier
ra L
eone
Togo
Sum
2015 1,057 1,201 309 6,362 221 10,121 707 38 88 1,416 873 25,467 3,664 216 738 52,479
2016 1,173 1,332 325 6,881 225 11,043 938 64 117 1,569 1,033 34,080 3,979 302 791 63,853
2017 1,289 1,462 341 7,399 230 11,965 1,170 90 145 1,721 1,194 42,693 4,294 388 844 75,227
2018 1,405 1,593 357 7,918 235 12,886 1,401 117 174 1,873 1,355 51,307 4,609 475 897 86,601
2019 1,521 1,723 372 8,436 240 13,808 1,633 143 202 2,025 1,516 59,920 4,924 561 951 97,975
2020 1,637 1,854 388 8,954 244 14,730 1,864 169 230 2,178 1,677 68,533 5,239 647 1,004 109,349
2021 1,847 2,176 410 10,256 275 16,651 2,231 194 262 2,510 1,904 74,000 5,785 742 1,105 120,347
2022 2,057 2,498 432 11,558 306 18,572 2,598 218 293 2,842 2,131 79,467 6,331 836 1,205 131,345
2023 2,267 2,820 454 12,859 337 20,493 2,965 243 325 3,174 2,358 84,934 6,877 931 1,306 142,342
2024 2,477 3,142 476 14,161 367 22,414 3,332 267 356 3,506 2,585 90,401 7,423 1,025 1,407 153,340
2025 2,687 3,465 498 15,463 398 24,335 3,699 292 388 3,838 2,812 95,868 7,969 1,120 1,508 164,338
2026 2,897 3,787 520 16,764 429 26,256 4,066 316 419 4,170 3,038 101,335 8,515 1,214 1,608 175,335
2027 3,107 4,109 542 18,066 460 28,177 4,433 341 451 4,502 3,265 106,802 9,061 1,309 1,709 186,333
2028 3,317 4,431 564 19,368 490 30,098 4,800 365 482 4,834 3,492 112,269 9,607 1,404 1,810 197,331
2029 3,527 4,753 586 20,669 521 32,019 5,167 390 513 5,166 3,719 117,736 10,153 1,498 1,911 208,328
2030 3,737 5,076 608 21,971 552 33,940 5,534 414 545 5,498 3,946 123,203 10,699 1,593 2,011 219,326
Table 16 Final electricity demand projections (GWh)

•74 • PL ANNING AND PROSPEC TS FOR RENE WABLE POWER
APPENDIX B. DETAILED POWER PLANT ASSUMPTIONS
33 Lifespan should be taken as indicative, as many plants operate beyond reported figures.
Name of station Plant type Plant capacity MW
Availability %
Efficiency %
Fixed O&M USD/kW
Installation year
Life³³ Years
Benin
CAI Gas 80 0.86 0.28 20.65 2011 25
Gas Turbine GAS Gas 20 0.86 0.24 36.8 1998 27
Diesel Generators ODS Oil 22.95 0.80 0.34 36.8 1998 17
Diesel Generators OHF Oil 29.75 0.80 0.32 36.8 1998 17
DINa HFO Plant Oil 12 0.30 0.34 36.8 2005 25
Port Novo HFO Plant Oil 12 0.40 0.34 36.8 2005 25
Burkina Faso
Bobo 2 Oil 32.26 0.80 0.38 36.63 2014 30
Diesel Generators ODS Oil 25.92 0.78 0.34 36.8 1977 30
Diesel Generators OHF Oil 107 0.79 0.37 36.8 1978 30
Dori Oil 0.64 0.80 0.35 36.63 2011 30
Gaoua Oil 0.64 0.80 0.35 36.63 2012 30
Komsilga Oil 89.59 0.80 0.38 36.63 2012 30
Cabo Verde
Diesel Generators OHF Oil 69 0.80 0.38 36.8 2000 30
Existing Diesels 1 Oil 38 0.80 0.35 36.8 2003 10
Existing Diesels 2 Oil 45.59 0.80 0.35 36.8 2005 10
Existing Diesels 3 Oil 7.4 0.80 0.35 36.8 2006 10
Solar PV Solar PV 5 0.25 1.00 29.35 2011 25
Wind30 Wind 9.35 1.00 1.00 91.31 2011 25
Côte d’Ivoire
5e centrale IPP (Bassam) Gas 430 0.86 0.50 31.21 2013 25
Gas Turbine GAS Gas 290 0.88 0.32 36.8 2000 25
Lushann Gas 100 0.86 0.50 31.21 2013 25
Vridi (CIPREL) Gas 333 0.86 0.50 31.21 2014 25
GTVridi Gas 84 0.89 0.25 36.8 1990 25
GTC1prel Gas 210 0.88 0.30 36.8 1995 25
GTC3prel Gas 111 0.88 0.30 36.8 2010 25
Aggreko Gas 70 0.88 0.30 36.8 2010 25
Table 17 Existing non-hydropower plants

•75 •WEST AFRIC A
Name of station Plant type Plant capacity MW
Availability %
Efficiency %
Fixed O&M USD/kW
Installation year
Life³³ Years
Gambia
Diesel Generators ODS Oil 8.2 0.80 0.29 36.8 1981 30
Diesel Generators OHF Oil 75.4 0.80 0.37 36.8 1990 30
Ghana
Aboadze T3 phase 1 (TEMA 1, 2, 2X) Gas 130 0.86 0.30 31.2 2013 25
Combined Cycle GAS Gas 180 0.85 0.30 36.8 2010 25
Combined Cycle OLC Oil 300 0.72 0.30 36.8 1998 35
Gas Turbine ODS Oil 70 0.80 0.29 36.8 2007 25
Gas Turbine OLC Oil 320 0.82 0.29 36.8 2001 25
VRA+BXC (2016) Solar PV 22.5 0.12 1.00 21.74 2013 20
Guinea
Boké Oil 1.4 0.80 0.38 35.8 2012 33
Diesel Oil 3.2 0.80 0.40 36.8 2005 30
Diesel Generators OHF Oil 41 0.80 0.40 36.8 2006 30
Kaloum1 (rehab) 2014 Oil 24 0.80 0.40 36.7 2014 38
Kaloum2 (rehab) 2012 Oil 26 0.80 0.40 36.7 2012 38
Kamsar Mine (rehab) Oil 34 0.80 0.39 36.6 2015 30
Tombo 3 (rehab) 2012 Oil 89.6 0.80 0.40 36.7 2012 38
Kaloum5 Oil 32.4 0.80 0.40 36.8 2004 30
Guinea-Bissau
Bissau Oil 15 0.80 0.38 36.63 2012 30
Diesel Generators ODS Oil 3.67 0.67 0.36 36.8 2005 30
Liberia
Bushrod Oil 10 0.80 0.31 36.63 2013 30
Diesel Generators ODS Oil 12.64 0.80 0.31 36.8 2006 30
Mali
Albatros BOOT Oil 92 0.80 0.38 36.63 2012 30
Balingue BID Oil 60 0.80 0.38 36.63 2011 30
Diesel Generators ODS Oil 56.85 0.80 0.37 36.8 2000 30
Diesel Generators OHF Oil 57.5 0.80 0.38 36.8 2010 30
Gas Turbine ODS Oil 20 0.86 0.23 36.8 1999 25
KANGABA (CI) Oil 0.47 0.80 0.31 36.63 2014 30
KOUTIALA (CI) Oil 4.4 0.80 0.33 36.63 2012 30
SIKASSO (CO) Oil 9.2 0.80 0.34 36.63 2011 30
Mopti SOLAR Solar PV 10 0.12 1.00 21.74 2012 20

•76 • PL ANNING AND PROSPEC TS FOR RENE WABLE POWER
Name of station Plant type Plant capacity MW
Availability %
Efficiency %
Fixed O&M USD/kW
Installation year
Life³³ Years
Niger
Steam Turbine COA Coal 32 0.86 0.33 78.2 1980 35
Gas Turbine GAS Gas 10 0.86 0.28 36.8 1980 50
TAG Niamey 2 Gas 10 0.86 0.28 20.65 2010 25
Diesel Generators ODS Oil 36.9 0.80 0.35 36.8 1980 30
Diesel Generators OHF Oil 10 0.80 0.38 36.8 1985 30
Niamey 2 Oil 15 0.80 0.38 36.63 2011 30
AGr diesel Oil 30 0.80 0.35 36.8 2010 30
Nigeria
Combined Cycle GAS Gas 1,460 0.48 0.40 36.8 2005 35
Gas Turbine GAS Gas 3,002 0.37 0.28 36.8 1982 25
ICSPower(Alaoji) Gas 600 0.86 0.45 34.86 2015 25
OlorunsogoII Gas 675 0.86 0.45 34.86 2012 25
Sapele, Geregu, Ihovbor, Omotosho Gas 2,345 0.86 0.28 20.65 2012 25
Steam Turbine GAS Gas 2,220 0.30 0.34 36.8 1978 35
Senegal
Combined Cycle GAS Gas 49 0.86 0.39 36.8 2000 25
Diesel Generators OHF Oil 335.5 0.80 0.40 36.8 1989 30
Gas Turbine ODS Oil 66 0.86 0.22 36.8 1984 25
Location Oil 150 0.80 0.35 36.63 2011 30
Steam Turbine OHF Oil 53 0.86 0.28 36.8 1966 30
Sierra Leone
Addax Biomass 7.5 0.86 0.38 20.4 2014 30
Diesel Generators ODS Oil 5 0.80 0.35 36.8 1987 30
Diesel Generators OHF Oil 16 0.80 0.38 36.8 2006 30
Togo
Diesel Generators
OHFGas 100 0.86 0.28 36.8 2010 30
Gas Turbine GAS Gas 20 0.86 0.28 36.8 2008 27
Diesel Generators
ODSOil 48.7 0.80 0.27 36.8 1968 45

•77•WEST AFRIC A
Name of station
Hydro type
Plant capacity
MW
Availability (Avg. year)
%
Availability (Dry year)
%
Fixed O&M
USD/kW
Installation year
Burkina Faso
Bagre DAM 12 0.55 0.21 66.24 1993
Kompienga DAM 10 0.36 0.19 66.24 1988
Niofila ROR 1 0.28 0.24 66.24 1996
Tourni ROR 1 0.24 0.17 66.24 1996
Côte d’Ivoire
Ayame 1 DAM 19.2 0.36 0.27 66.24 1998
Ayame 2 DAM 30.4 0.34 0.26 66.24 1998
Buyo DAM 164.7 0.62 0.47 66.24 1980
Kossou DAM 175.5 0.33 0.25 66.24 2004
Taabo DAM 190 0.51 0.39 66.24 2004
Faye ROR 5 0.43 0.33 66.24 1984
Ghana
Akosombo DAM 1020 0.53 0.37 66.24 2005
Bui DAM 400 0.33 0.26 78.26 2013
Kpong ROR 160 0.70 0.45 66.24 1982
Guinea
Baneah (Rehab) DAM 5 0.15 0.10 78.26 2015
Donkéa (Rehab) ROR 15 0.55 0.42 78.26 2015
Garafiri DAM 75 0.39 0.31 66.24 1999
Grandes Chutes (Rehab) DAM 27 0.54 0.42 78.26 2015
Kaleta (OMVG) part Guinée 30 % DAM 240 0.45 0.11 78.26 2015
Kinkon DAM 3.4 0.39 0.36 66.24 2006
Tinkisso ROR 1.7 0.44 0.35 66.24 2005
Liberia
Existing Fire DAM 4 1.00 0.90 66.24 2009
Existing Yand DAM 1 0.39 0.30 66.24 2009
Mali
Manantali (OMVS) part Mali 52 % DAM 200 0.46 0.29 66.24 1988
Selingué DAM 43.5 0.59 0.52 66.24 1980
Sotuba ROR 5.7 0.77 0.75 66.24 1966
Table 18 Existing hydropower plants

•78 • PL ANNING AND PROSPEC TS FOR RENE WABLE POWER
Name of station
Hydro type
Plant capacity
MW
Availability (Avg. year)
%
Availability (Dry year)
%
Fixed O&M
USD/kW
Installation year
Nigeria
Jebba DAM 540 0.59 0.35 66.24 1986
Kainji DAM 760 0.67 0.35 66.24 1968
Shiroro DAM 600 0.62 0.46 66.24 1989
Senegal
Manantali (OMVS) part Sénégal 33 % DAM 67.7 0.45 0.28 66.24 1988
Sierra Leone
Bumbuna 1 DAM 50 0.66 0.36 66.24 2007
Goma 1 ROR 6 0.59 0.03 66.24 2010
Togo
Kpime ROR 1.6 0.41 0.31 66.24 1963
Nangbeto DAM 65 0.21 0.16 66.24 1987

•79 •WEST AFRIC A
Name of station
Plant type
Plant capacity
MW
Availability %
Efficiency %
Fixed O&M
USD/kW
Inv. cost
USD/kW
Earliest year
Life
Years
Status
Benin
20 MW Biomass Project Biomass 20 0.50 0.38 20.4 2,718 2020 30 Planned
IPP_THERMAL Gas 90 0.86 0.28 20.65 688 2016 25 Planned
MariaGleta Gas 450 0.86 0.41 64.7 2,157 2020 25 Committed
150 MW CCGT project Gas 150 0.86 0.28 20.65 688 2035 25 Planned
Satar Gas Project Gas 20 0.85 0.28 20.65 688 2016 25 Committed
GTBID Gas Project Gas 100 0.17 0.28 20.65 688 2016 25 Committed
AFD_SOLAR Solar PV 5 0.12 1.00 21.74 3,978 2016 20 Planned
CEB_SOLAR Solar PV 5 0.12 1.00 21.74 3,978 2016 20 Planned
IPP_SOLAR Solar PV 85 0.12 1.00 514.05 3,978 2016 20 Planned
IPP_WIND Wind 10 0.30 1.00 94.57 1,902 2016 20 Planned
Burkina Faso
Diapaga Oil 0.46 0.80 0.35 36.63 1,221 2020 30 Planned
Donsin Oil 100 0.80 0.38 36.63 1,221 2020 30 Planned
Fada Oil 7.5 0.80 0.38 36.63 1,221 2018 30 Committed
Gorom-Gorom Oil 0.3 0.80 0.35 36.63 1,221 2020 30 Planned
Ouaga Est Oil 108 0.80 0.38 36.63 1,221 2020 30 Planned
Ouahigouya Oil 30 0.80 0.35 36.63 1,221 2019 30 Planned
PIE Thermique Oil 100 0.80 0.38 36.63 1,221 2020 30 Planned
Mana (SEMAFO) Solar PV 20 0.24 1.00 488.06 3,978 2018 20 Committed
Ouaga Solaire Solar PV 30 0.12 1.00 21.74 3,978 2017 20 Committed
PPP/PIE Solaire BID Solar PV 12.73 0.12 1.00 21.74 3,978 2017 20 Committed
PPP/PIE Solaire EMOA Solar PV 18.18 0.12 1.00 21.74 3,978 2018 20 Committed
PPP/PIE Solaire Kodeni Solar PV 15.45 0.12 1.00 488.06 3,978 2017 20 Committed
PPP/PIE Solaire Pa Solar PV 15.45 0.12 1.00 488.06 3,978 2017 20 Committed
PPP/PIE Solaire Patte d’Oie Solar PV 5.82 0.12 1.00 488.06 3,978 2017 20 Committed
PPP/PIE Solaire AfD Solar PV 2.86 0.12 1.00 21.74 3,978 2016 20 Committed
PPP/PIE Solaire Zig Solar PV 1.18 0.12 1.00 21.74 3,978 2017 20 Committed
PPP/PIE Solaire Zagtouli Solar PV 15.45 0.12 1.00 488.06 3,978 2017 20 Committed
PPP/PIE Solaire Zano Solar PV 10 0.12 1.00 488.06 3,978 2017 20 Committed
Cabo Verde
Planned Pump Storage 1
Pumped storage 20 0.33 1.00 4,348 2018 60 Planned
Planned Pump Storage 2
Pumped storage 20 0.33 1.00 4,348 2023 60 Planned
Côte d’Ivoire
4e centrale IPP (Abbata) Gas 450 0.86 0.50 31.2 1,040 2015 25 Planned
Table 19 Planned and committed non-hydropower plants

• 80 • PL ANNING AND PROSPEC TS FOR RENE WABLE POWER
Name of station
Plant type
Plant capacity
MW
Availability %
Efficiency %
Fixed O&M
USD/kW
Inv. cost
USD/kW
Earliest year
Life
Years
Status
Gambia
Brikama Oil 33 0.80 0.38 23.12 1,541 2015 30 Committed
Kotu Oil 11 0.80 0.38 1,541 2018 30 Committed
Brikama Solar PV 3 0.22 1.00 2,174 2018 25 Committed
Bakau Wind 0.6 0.28 1.00 32.61 2,067 2016 25 Committed
Ghana
Aboadze T3 phase 1 (TEMA 1,2,2X) Gas 45 0.86 0.30 31.2 1,040 2013 25 Planned
AMERI Gas 230 0.86 0.30 31.2 1,040 2016 25 Committed
Sunon Asogli phase 2 Gas 170 0.86 0.30 31.2 1,040 2016 25 Committed
CENIT Energy Oil 100 0.75 0.30 20.65 688 2014 25 Planned
Karpower Oil 225 0.86 0.30 31.2 1,040 2016 10 Committed
KTPP Oil 200 0.86 0.30 31.2 1,040 2016 10 Committed
Ayitepa Wind Farm Wind 225 0.30 1.00 21.74 1,932 2018 20 Committed
Guinea
Boké Oil 1.4 0.80 0.38 35.85 1,163 2012 33 Planned
K-Energie Oil 75 0.80 0.39 36.63 1,221 2016 30 Committed
Kipé Oil 50 0.80 0.39 36.63 1,221 2016 30 Committed
Iles de loos Solar PV 1 0.21 1.00 30.43 1,946 2016 25 Planned
Kankan Solar PV 8 0.21 1.00 30.43 1,946 2019 25 Planned
Kerouané Solar PV 1 0.21 1.00 30.43 1,946 2016 25 Planned
Khoummaguély Solar PV 80 0.21 1.00 30.43 1,946 2017 25 Planned
Kouroussa Solar PV 1 0.21 1.00 30.43 1,946 2016 25 Planned
Madiana Solar PV 1 0.21 1.00 30.43 1,946 2016 25 Planned
Liberia
Biomass MSW Biomass 5.7 0.50 0.38 20.4 2,718 2022 30 Planned
Bushrod 2 Oil 28 0.80 0.38 36.63 1,221 2017 30 Committed
Mali
Sosumar 1 Biomass 3 0.86 0.38 140.87 3,917 2014 30 Planned
VICA BOOT Biomass 30 0.86 0.41 20.4 1,040 2012 25 Planned
BOUGOUNI (CI) Oil 2.5 0.80 0.33 36.63 1,221 2015 30 Planned
DJENNE (CI) Oil 0.91 0.80 0.29 36.63 1,221 2018 30 Planned
MOPTI (CI) Oil 8.4 0.80 0.34 36.63 1,221 2018 30 Planned
OUELESSEBOUGOU (CI) Oil 0.44 0.80 0.31 36.63 1,221 2016 30 Planned
SAN (CI) Oil 3.7 0.80 0.35 36.63 1,221 2017 30 Planned
TOMINIAN (CI) Oil 0.36 0.80 0.31 36.63 1,221 2017 30 Planned
WAPP CC Oil 150 0.86 0.41 31.2 1,040 2019 25 Planned
WAPP SOLAR Solar PV 30 0.12 1.00 21.74 3,978 2020 20 Planned

• 8 1 •WEST AFRIC A
Name of station
Plant type
Plant capacity
MW
Availability %
Efficiency %
Fixed O&M
USD/kW
Inv. cost
USD/kW
Earliest year
Life
Years
Status
Niger
Salkadamna Coal 600 0.86 0.33 279.63 9,321 2018 35 Planned
Tchiro Coal 25 0.85 0.37 78.37 2,612 2017 30 Planned
Zinder Gas 8 0.86 0.41 57.04 1,901 2020 25 Planned
Dosso Oil 1.5 0.80 0.35 36.63 1,221 2016 30 Planned
Gaya Oil 1.2 0.80 0.35 36.63 1,221 2016 30 Planned
Goudel Oil 12 0.80 0.38 67.11 2,237 2020 30 Planned
Niamey 2 Oil 0.4 0.80 0.38 36.63 1,221 2011 30 Planned
Tillabery Oil 1.5 0.80 0.35 36.63 1,221 2016 30 Planned
Gourou Banda Oil 80 0.80 0.35 36.65 1,222 2016 30 Planned
Solar Mal Solar PV 7 0.12 1.00 21.74 4,698 2016 20 Committed
Wind Wind 30 0.30 1.00 18.48 1,715 2020 20 Planned
Nigeria
CPG Okija Gas 1,500 0.86 0.45 34.86 1,162 2016 25 Planned
Ethiope Gas 2,800 0.86 0.28 20.65 688 2017 25 Planned
SupertekNig. Gas 1,000 0.86 0.45 34.86 1,162 2017 25 Planned
Westcom Gas 1,000 0.86 0.28 20.65 688 2020 25 Planned
Senegal
Mboro Coal 300 0.86 0.33 575 2,489 2019 35 Planned
Sendou Coal 125 0.86 0.33 399.9 971 2018 35 Committed
IPP Tobene Oil 70 0.80 0.38 321.23 1,418 2016 30 Committed
IPP Contour Global Oil 52 0.80 0.38 289.5 1,418 2016 1 Committed
Centrale Diass financement Kfw Solar PV 15 0.19 1.00 61.96 5,030 2017 20 Planned
Centrale Niass financement EAU Solar PV 15 0.19 1.00 61.96 5,030 2018 20 Planned
ziguinchor Solar PV 7.5 0.19 1.00 330.45 5,030 2021 20 Committed
5 IPP de 20 MW Solar PV 100 0.19 1.00 330.45 5,030 2017 25 Planned
taiba ndiaye Wind 150 0.30 1.00 380.45 1,934 2017 20 Committed
Sierra Leone
Addax Biomass 7.5 0.86 0.38 20.4 3,917 2014 30 Committed
Western Area Power Project (WB) Oil 57 0.80 0.38 44.02 2,208 2018 25 Committed
Solar2 Solar PV 11 0.12 1.00 21.74 1,840 2017 20 Committed
Togo
Diesel Generators OHF Gas 200 0.86 0.28 36.8 1,163 2010 30 Planned
IPP_THERMAL Gas 50 0.86 0.28 19.66 655 2020 25 Planned
CEB_SOLAR Solar PV 5 0.12 1.00 29.35 2,261 2017 20 Planned
IPP_SOLAR Solar PV 5 0.12 1.00 29.35 2,261 2017 20 Planned
IPP_SOLAR 3 (Kara) Solar PV 5 0.47 1.00 29.35 2,261 2019 20 Planned
IPP_WIND Wind 25 0.30 1.00 91.31 2,890 2018 25 Planned

• 82 • PL ANNING AND PROSPEC TS FOR RENE WABLE POWER
Name of station
Hydro type
Plant capacity
MW
Availability (Avg. year)
%
Availability (Dry year)
%
Fixed O&M
USD/kW
Inv. cost
USD/kW
Earliest year
Life
Years
Status
Benin
Adjarala DAM 147 0.28 0.18 73.83 2,461 2020 50 Committed
Dogo-bis DAM 128 0.35 0.27 68.65 2,288 2018 50 Committed
Ketou DAM 160 0.35 0.27 68.65 2,288 2018 50 Committed
Yeri Hydro Dam DAM 1 0.24 0.18 66.24 2,288 2016 50 Committed
Burkina Faso
Aval DAM 14 0.29 0.22 330.17 11,006 2023 50 Committed
Bontioli DAM 5.1 0.29 0.22 330.17 11,006 2022 50 Committed
Bougouriba DAM 12 0.29 0.22 330.17 11,006 2025 50 Planned
Folonzo DAM 10.8 0.29 0.22 330.17 11,006 2022 50 Committed
Gongourou DAM 5 0.29 0.22 330.17 11,006 2022 50 Committed
Noumbiel DAM 60 0.39 0.29 155.46 5,182 2025 50 Planned
Samandéni DAM 2.6 0.29 0.22 330.17 11,006 2017 50 Committed
Côte d’Ivoire
AboissoComoé DAM 90 0.50 0.38 89.87 2,996 2026 50 Planned
Boutoubré DAM 156 0.57 0.44 83.81 2,794 2021 50 Planned
GriboPopoli DAM 112 0.52 0.40 105.95 3,532 2027 50 Planned
Louga DAM 280 0.54 0.41 154.93 5,164 2020 50 Planned
Soubre DAM 270 0.47 0.36 74.88 2,496 2018 50 Planned
Tiassalé ROR 51 0.48 0.37 132.66 4,422 2030 50 Planned
Tiboto/Cavally (Intl.) part CI 50 % DAM 220 0.61 0.46 83.81 2,794 2022 50 Planned
Ghana
Daboya DAM 43 0.52 0.39 153.2 5,107 2020 50 Planned
Hemang ROR 93 0.42 0.32 87.65 2,922 2020 50 Planned
Juale DAM 87 0.53 0.40 115.83 3,861 2020 50 Planned
Kulpawn DAM 36 0.53 0.40 264.5 8,817 2020 50 Planned
Pwalugu DAM 48 0.44 0.33 118.22 3,940 2020 50 Planned
Table 20 Planned and committed hydropower plants

• 83 •WEST AFRIC A
Name of station
Hydro type
Plant capacity
MW
Availability (Avg. year)
%
Availability (Dry year)
%
Fixed O&M
USD/kW
Inv. cost
USD/kW
Earliest year
Life
Years
Status
Guinea
Amaria DAM 280 0.61 0.42 43.89 1,463 2020 50 Committed
Balassa DAM 181 0.30 0.20 49.89 1,663 2030 50 Committed
Bouréya DAM 114 0.73 0.38 68.48 2,283 2023 50 Planned
Daboya (recherche de Finance) DAM 2.8 0.31 0.20 139.35 4,645 2021 50 Planned
Fomi DAM 90 0.47 0.33 253.64 8,455 2029 50 Planned
Keno (recherche de Finance) DAM 2.1 0.31 0.20 139.35 4,645 2021 50 Planned
Kogbedou (recherche de Finance) DAM 44 0.11 0.01 139.35 4,645 2021 50 Planned
Koukoutamba DAM 294 0.34 0.26 45.66 1,522 2021 50 Committed
Morissananko DAM 100 0.60 0.48 67.18 2,239 2026 50 Planned
N’Zebela (recherche de Finance) DAM 27 0.50 0.24 139.35 4,645 2021 50 Planned
Poudaldé DAM 90 0.43 0.38 54.36 1,812 2040 50 Planned
Samankou (rehab) DAM 130 0.44 0.49 175.63 5,855 2020 100 Planned
Touba (recherche de Finance) DAM 5 0.54 0.01 139.35 4,645 2021 50 Planned
Korafindi DAM 100 0.63 0.48 67.18 2,239 2045 50 Planned
Other Hydro Projects DAM 61.7 0.30 0.19 81.53 2,718 2030 50 Committed
Digan (OMVG) part Guinée 40 % DAM 93 0.30 0.03 39.16 1,305 2018 50 Planned
FelloSounga (OMVG) part Guinée 40 % DAM 82 0.46 0.38 113.28 3,776 2018 50 Planned
Other Dams DAM 2930 0.50 0.40 78.26 2,609 2031 50 Planned
Souapiti (Construction) DAM 515 0.52 0.48 139.35 4,645 2021 50 Committed
Tinkisso Upgrade ROR 4.6 0.44 0.30 130.44 4,348 2016 50 Planned
Guinea-Bissau
Saltinho (OMVG) part Guinée-Bissau 8 % ROR 20 0.45 0.13 139.35 4,645 2020 50 Planned
Liberia
DAMEnvisagée DAM 702.5 0.49 0.37 97.28 3,243 2030 50 Planned
Mount Coffee (+via reservoir) DAM 66 0.75 0.59 189.24 6,308 2017 50 Committed
SaintPaul -1B DAM 78 0.75 0.57 101.84 3,395 2025 50 Planned
SaintPaul -2 DAM 120 0.75 0.57 101.84 3,395 2027 50 Planned
Mali
Felou (OMVS) part Mali 45 % DAM 60 0.48 0.57 64 2,145 2018 50 Planned
Gouina (OMVS) part Mali 45 % ROR 140 0.48 0.19 83.19 2,773 2019 50 Committed
Kenié ROR 34 0.66 0.54 119.71 3,990 2015 50 Planned
Sotuba2 ROR 6 0.74 0.71 78.26 2,609 2014 50 Planned

• 8 4 • PL ANNING AND PROSPEC TS FOR RENE WABLE POWER
Name of station
Hydro type
Plant capacity
MW
Availability (Avg. year)
%
Availability (Dry year)
%
Fixed O&M
USD/kW
Inv. cost
USD/kW
Earliest year
Life
Years
Status
Niger
Dyodyonga DAM 26 0.49 0.37 74.77 2,492 2020 50 Planned
Gambou DAM 122.5 0.49 0.37 153.66 5,122 2020 50 Planned
Kandadji DAM 130 0.55 0.42 101.58 3,386 2017 50 Committed
Namari Goungo DAM 80 0.49 0.37 74.77 2,492 2020 50 Planned
Nigeria
Mambilla DAM 3050 0.49 0.37 50.16 1,672 2021 50 Planned
Zungeru DAM 700 0.49 0.37 50.16 1,672 2019 50 Planned
Sierra Leone
Benkongor1 DAM 34.8 0.78 0.66 79.8 2,660 2025 50 Planned
Benkongor2 DAM 80 0.59 0.48 79.8 2,660 2026 50 Planned
Benkongor3 DAM 85.5 0.69 0.56 79.8 2,660 2027 50 Planned
Bumbuna2 DAM 40 0.63 0.68 63.59 2,120 2022 50 Planned
Bumbuna3 (Yiben) DAM 90 0.50 0.40 63.59 2,120 2023 50 Planned
Bumbuna4&5 DAM 95 0.59 0.56 63.59 2,120 2024 50 Planned
DAM Envisagée DAM 323 0.66 0.53 83.51 2,784 2028 50 Planned
Togo
Amou Oblo DAM 2 0.34 0.26 103.51 3,450 2019 50 Planned
Banga DAM 6 0.34 0.26 103.51 3,450 2020 50 Planned
Glei DAM 2 0.34 0.26 103.51 3,450 2019 50 Planned
Kara (Collège Militaire) DAM 16 0.34 0.26 103.51 3,450 2022 50 Planned
Kpéssi DAM 8 0.34 0.26 103.51 3,450 2020 50 Planned
Landa DAM 4 0.34 0.26 103.51 3,450 2020 50 Planned
Tetetou DAM 50 0.34 0.26 103.51 3,450 2020 50 Planned
Titira DAM 12 0.34 0.26 103.51 3,450 2021 50 Planned
Tomegbé DAM 8 0.34 0.26 103.51 3,450 2021 50 Planned

• 85 •WEST AFRIC A
APPENDIX C. GENERIC TECHNOLOGY PARAMETERS
Availability
%
Fixed O&M (2015)
USD/kW
Thermal efficiency
Construction duration
Years
Life
Years
Diesel/gasoline 1 kW system (urban/rural) 30 % 23 16 % 0 10
Diesel 100 kW system (industry) 80 % 21 35 % 0 20
Diesel centralised 80 % 35 35 % 2 25
Heavy fuel oil 80 % 44 35 % 2 25
OCGT 85 % 20 30 % 2 25
CCGT 85 % 35 48 % 3 30
Supercritical coal 85 % 78 37 % 4 35
Small hydropower 50 % 124 – 2 30
Biomass 50 % 82 38 % 4 30
Onshore wind By country 95 – 2 25
Solar PV (utility) By country 30 – 1 25
Solar PV (rooftop) By country 50 – 1 20
PV with battery 2 h storage By country 61 – 1 20
CSP no storage By country 65 – 4 25
CSP with storage By country 93 – 4 25
Generation (without T&D) Industry Urban Rural
LCOE (USD/MWh) 2015 2030 2015 2030 2015 2030 2015 2030
Diesel/gasoline 1 kW system (urban/rural) 311 607 311 607 311 607
Diesel 100 kW system (industry) 131 266 131 266
Diesel centralised 138 273 148 288 171 313 188 360
Heavy fuel oil 98 178 105 187 121 203 133 234
OCGT (imported gas/LNG) 123 144 132 152 157 165 172 190
OCGT (pipeline gas) 116 136 124 143 143 156 157 179
OCGT (domestic gas) 91 106 98 112 108 122 128 140
CCGT (imported gas/LNG) 92 105 98 111 117 120 129 138
CCGT (pipeline gas) 87 100 94 105 108 114 119 131
CCGT (domestic gas) 72 81 77 86 85 93 101 107
Supercritical coal (imported) 97 103 105 108 124 117 137 135
Supercritical coal (domestic) 83 86 89 91 98 99 109 114
Biomass 95 95 102 100 117 109 129 125
Small hydropower 134 134 134 134
Table 22 Levelised cost of electricity: generic technologies
Table 21 Other parameters for renewable energy technologies

• 86 • PL ANNING AND PROSPEC TS FOR RENE WABLE POWER
34 As resource quality of generic wind and solar PV technologies are country-specific in this analysis, the LCOE for these technologies is similarly country-specific. For more detail, see Section 3.7 (Electricity generation options).
Generation (without T&D) Industry Urban Rural
LCOE (USD/MWh) 2015 2030 2015 2030 2015 2030 2015 2030
Benin
Solar PV (rooftop – commercial) 221 119 221 119 221 119 221 119
Solar PV (rooftop – rural) 481 249 481 249
Solar PV (rooftop – urban) 232 136 232 136
Solar PV with 2 h storage (rooftop – rural) 938 493 938 493
Solar PV with 2 h storage (rooftop – urban) 247 143 247 143
Solar PV (utility) 155 74 166 78 191 84 210 97
CSP no storage 355 227 381 239 438 260 482 299
CSP with storage 360 231 387 243 445 264 489 303
Wind far from grid 337 206 362 217 416 236 458 271
Wind near grid 298 168 320 176 368 192 405 220
Burkina Faso
Solar PV (rooftop – commercial) 203 109 203 109 203 109 203 109
Solar PV (rooftop – rural) 442 229 442 229
Solar PV (rooftop – urban) 213 125 213 125
Solar PV with 2 h storage (rooftop – rural) 861 453 861 453
Solar PV with 2 h storage (rooftop – urban) 227 131 227 131
Solar PV (utility) 142 68 153 71 168 78 181 89
CSP no storage 326 208 350 219 385 238 415 274
CSP with storage 331 212 355 223 391 242 422 279
Wind far from grid 222 136 239 143 263 156 284 179
Wind near grid 197 111 211 116 233 127 251 146
Côte d’Ivoire
Solar PV (rooftop – commercial) 216 116 216 116 216 116 216 116
Solar PV (rooftop – rural) 470 243 470 243
Solar PV (rooftop – urban) 226 133 226 133
Solar PV with 2 h storage (rooftop – rural) 916 482 916 482
Solar PV with 2 h storage (rooftop – urban) 242 140 242 140
Solar PV (utility) 151 72 162 76 187 82 205 95
CSP no storage 346 222 372 233 428 254 471 292
CSP with storage 352 225 378 237 434 258 478 296
Wind far from grid 335 205 359 216 413 234 455 270
Wind near grid 296 166 318 175 366 190 402 219
Table 23 Levelised cost of electricity: generic wind and solar technologies³⁴

• 87•WEST AFRIC A
Generation (without T&D) Industry Urban Rural
LCOE (USD/MWh) 2015 2030 2015 2030 2015 2030 2015 2030
Gambia
Solar PV (rooftop – commercial) 207 112 207 112 207 112 207 112
Solar PV (rooftop – rural) 453 234 453 234
Solar PV (rooftop – urban) 218 128 218 128
Solar PV with 2 h storage (rooftop – rural) 882 464 882 464
Solar PV with 2 h storage (rooftop – urban) 233 134 233 134
Solar PV (utility) 145 69 156 73 186 79 204 91
CSP no storage 334 214 358 225 426 244 468 281
CSP with storage 339 217 364 228 432 248 475 285
Wind far from grid 389 238 418 251 496 273 546 313
Wind near grid 344 193 370 204 439 221 483 255
Ghana
Solar PV (rooftop – commercial) 212 114 212 114 212 114 212 114
Solar PV (rooftop – rural) 463 240 463 240
Solar PV (rooftop – urban) 223 131 223 131
Solar PV with 2 h storage (rooftop – rural) 902 474 902 474
Solar PV with 2 h storage (rooftop – urban) 238 137 238 137
Solar PV (utility) 149 71 160 75 184 81 202 93
CSP no storage 341 218 366 230 421 250 463 287
CSP with storage 346 222 372 233 428 254 470 292
Wind far from grid 257 158 276 166 318 180 350 207
Wind near grid 228 128 245 135 281 146 309 168
Guinea
Solar PV (rooftop – commercial) 205 111 205 111 205 111 205 111
Solar PV (rooftop – rural) 448 232 448 232
Solar PV (rooftop – urban) 216 127 216 127
Solar PV with 2 h storage (rooftop – rural) 873 459 873 459
Solar PV with 2 h storage (rooftop – urban) 230 133 230 133
Solar PV (utility) 144 69 155 72 184 79 202 90
CSP no storage 330 211 355 223 421 242 463 278
CSP with storage 335 215 360 226 428 246 471 282
Wind far from grid 295 180 316 190 376 206 414 237
Wind near grid 261 147 280 154 333 168 366 193

• 8 8 • PL ANNING AND PROSPEC TS FOR RENE WABLE POWER
Generation (without T&D) Industry Urban Rural
LCOE (USD/MWh) 2015 2030 2015 2030 2015 2030 2015 2030
Guinea-Bissau
Solar PV (rooftop – commercial) 211 113 211 113 211 113 211 113
Solar PV (rooftop – rural) 460 238 460 238
Solar PV (rooftop – urban) 221 130 221 130
Solar PV with 2 h storage (rooftop – rural) 896 471 896 471
Solar PV with 2 h storage (rooftop – urban) 236 137 236 137
Solar PV (utility) 148 71 159 74 189 81 207 93
CSP no storage 339 217 364 228 432 248 476 285
CSP with storage 344 220 370 232 439 252 483 290
Wind far from grid 279 171 299 180 355 195 391 224
Wind near grid 246 139 265 146 314 158 346 182
Liberia
Solar PV (rooftop – commercial) 235 127 235 127 235 127 235 127
Solar PV (rooftop – rural) 514 266 514 266
Solar PV (rooftop – urban) 247 145 247 145
Solar PV with 2 h storage (rooftop – rural) 1,000 526 1,000 526
Solar PV with 2 h storage (rooftop – urban) 264 152 264 152
Solar PV (utility) 165 79 177 83 210 90 232 104
CSP no storage 378 242 406 255 483 277 531 319
CSP with storage 384 246 413 259 490 281 539 324
Wind far from grid 802 491 862 517 1,024 562 1,126 646
Wind near grid 710 399 762 420 906 456 996 525
Mali
Solar PV (rooftop – commercial) 202 109 202 109 202 109 202 109
Solar PV (rooftop – rural) 442 229 442 229
Solar PV (rooftop – urban) 213 125 213 125
Solar PV with 2 h storage (rooftop – rural) 860 452 860 452
Solar PV with 2 h storage (rooftop – urban) 227 131 227 131
Solar PV (utility) 142 68 152 71 175 77 193 89
CSP no storage 325 208 349 219 401 238 442 274
CSP with storage 330 212 355 223 407 242 449 278
Wind far from grid 197 120 211 127 242 138 267 158
Wind near grid 174 98 187 103 214 112 236 129
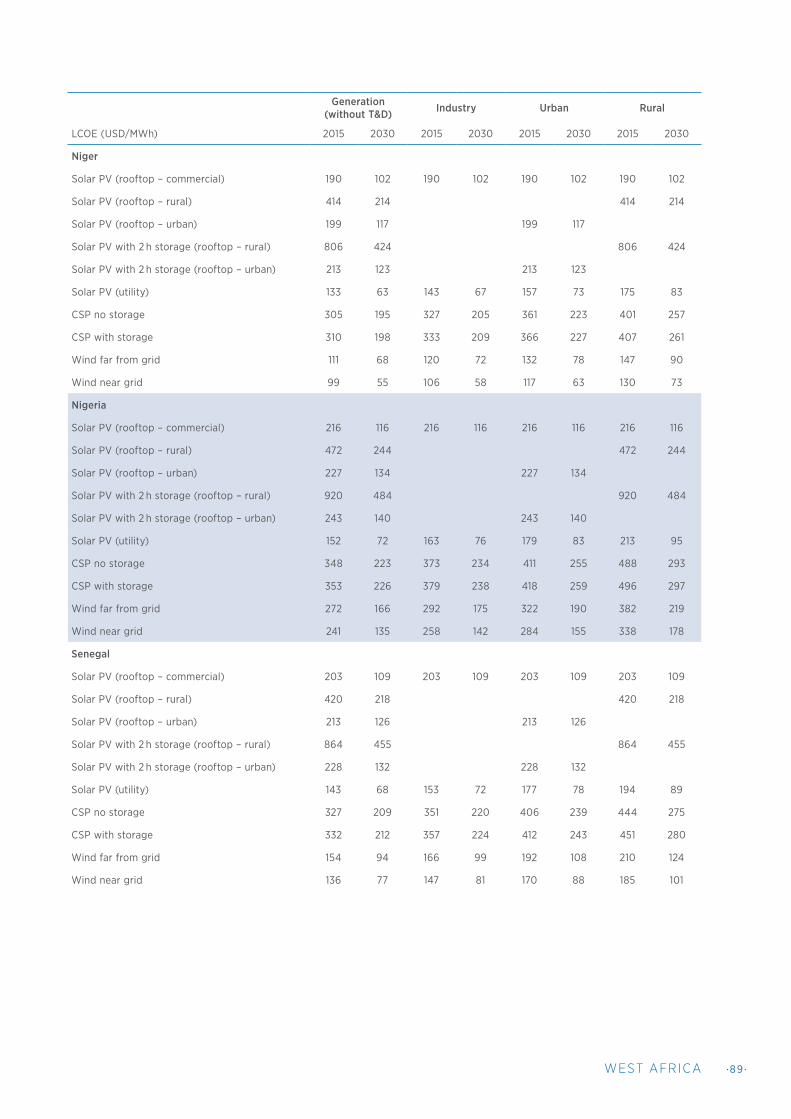
• 89 •WEST AFRIC A
Generation (without T&D) Industry Urban Rural
LCOE (USD/MWh) 2015 2030 2015 2030 2015 2030 2015 2030
Niger
Solar PV (rooftop – commercial) 190 102 190 102 190 102 190 102
Solar PV (rooftop – rural) 414 214 414 214
Solar PV (rooftop – urban) 199 117 199 117
Solar PV with 2 h storage (rooftop – rural) 806 424 806 424
Solar PV with 2 h storage (rooftop – urban) 213 123 213 123
Solar PV (utility) 133 63 143 67 157 73 175 83
CSP no storage 305 195 327 205 361 223 401 257
CSP with storage 310 198 333 209 366 227 407 261
Wind far from grid 111 68 120 72 132 78 147 90
Wind near grid 99 55 106 58 117 63 130 73
Nigeria
Solar PV (rooftop – commercial) 216 116 216 116 216 116 216 116
Solar PV (rooftop – rural) 472 244 472 244
Solar PV (rooftop – urban) 227 134 227 134
Solar PV with 2 h storage (rooftop – rural) 920 484 920 484
Solar PV with 2 h storage (rooftop – urban) 243 140 243 140
Solar PV (utility) 152 72 163 76 179 83 213 95
CSP no storage 348 223 373 234 411 255 488 293
CSP with storage 353 226 379 238 418 259 496 297
Wind far from grid 272 166 292 175 322 190 382 219
Wind near grid 241 135 258 142 284 155 338 178
Senegal
Solar PV (rooftop – commercial) 203 109 203 109 203 109 203 109
Solar PV (rooftop – rural) 420 218 420 218
Solar PV (rooftop – urban) 213 126 213 126
Solar PV with 2 h storage (rooftop – rural) 864 455 864 455
Solar PV with 2 h storage (rooftop – urban) 228 132 228 132
Solar PV (utility) 143 68 153 72 177 78 194 89
CSP no storage 327 209 351 220 406 239 444 275
CSP with storage 332 212 357 224 412 243 451 280
Wind far from grid 154 94 166 99 192 108 210 124
Wind near grid 136 77 147 81 170 88 185 101

•90 • PL ANNING AND PROSPEC TS FOR RENE WABLE POWER
Generation (without T&D) Industry Urban Rural
LCOE (USD/MWh) 2015 2030 2015 2030 2015 2030 2015 2030
Sierra Leone
Solar PV (rooftop – commercial) 228 123 228 123 228 123 228 123
Solar PV (rooftop – rural) 499 258 499 258
Solar PV (rooftop – urban) 240 141 240 141
Solar PV with 2 h storage (rooftop – rural) 971 511 971 511
Solar PV with 2 h storage (rooftop – urban) 256 148 256 148
Solar PV (utility) 160 76 172 80 204 87 225 101
CSP no storage 367 235 394 247 469 269 515 309
CSP with storage 373 239 401 251 476 273 523 314
Wind far from grid 538 330 578 347 687 377 756 434
Wind near grid 476 268 512 282 608 306 669 352
Togo
Solar PV (rooftop – commercial) 197 107 197 107 197 107 197 107
Solar PV (rooftop – rural) 444 230 444 230
Solar PV (rooftop – urban) 207 122 207 122
Solar PV with 2 h storage (rooftop – rural) 885 466 885 466
Solar PV with 2 h storage (rooftop – urban) 220 127 220 127
Solar PV (utility) 159 76 171 80 196 87 216 100
CSP no storage 365 234 392 246 451 267 496 307
CSP with storage 371 237 398 250 458 271 503 312
Wind far from grid 283 173 304 182 349 198 384 228
Wind near grid 250 141 269 148 309 161 340 185

•9 1 •WEST AFRIC A
APPENDIX D. DETAILED TRANSMISSION DATA
Country 1 Country 2 Line voltage kV
Line capacity MW
Distance km
Loss coefficient Forced outage rate
Ghana Côte d’Ivoire 225 327 220 3.03 % 0.40 %
Ghana Togo 161×2 438 91 2.50 % 0.20 %
Senegal Mali 225 100 1,200 5.46 % 2.20 %
Côte d’Ivoire Burkina Faso 225 327 222 3.48 % 0.40 %
Nigeria Benin 330 686 75 2.50 % 0.10 %
Togo Benin 161 345 65 2.50 % 0.10 %
Nigeria Niger 132×2 169 162 2.62 % 0.30 %
From
To
Stations
Voltage
kV
Capacity per line
MW
Distance
km
Losses %
Total investment USD million
Investment cost
USD/kW
Earliest year
Dorsale 330 kV (Committed)
Ghana Togo/Benin Volta–Sakete 330 655.2 240 2.50 % 90 137.4 2017
Côte d’Ivoire Ghana Riviera–Presea 330 655.2 240 2 % 90 137.4 2017
CLSG (Committed)
Côte d’Ivoire Liberia Man (CI)–Yekepa (LI) 225 337.6 140 2.50 % 59.7 176.9 2018
Liberia Guinea Yekepa (LI)– Nzerekore (GU) 225 337.6 140 2.50 % 59.7 176.9 2018
Liberia Sierra Leone
Yekepa (LI)–Buchanan (LI) – Monrovia (LI)–Bumbuna (SI)
225 303.4 580 6.79 % 247.5 815.6 2018
Sierra Leone Guinea Bumbuna (SI)–Linsan (GU) 225 333.7 190 2.50 % 81.1 242.9 2018
OMVG (Committed)
Senegal Guinea Kaolack (SE)–Linsan (GU) 225 286.3 800 9.37 % 289.8 1 012.3 2019
Senegal Gambia Birkelane (SE)–Soma (GA) 225 340.7 100 2.50 % 36.2 106.3 2019
Gambia Guinea-Bissau
Soma (GA)–Bissau (GB) 225 329.1 250 2.93 % 90.6 275.3 2019
Guinea-Bissau Guinea Mansoa (GB)–Linsan (GU) 225 309.6 500 5.86 % 181.2 585 2019
Corridor Nord
Nigeria Niger Birnin Kebbi (NG)–Niamey (NI) 330 653.1 268 3.14 % 143.1 219.1 2020
Niger Togo/Benin Zabori (NI)–Bembereke (TB) 330 649.7 312 3.65 % 166.6 256.4 2020
Niger Burkina FasoNiamey (NI)–Ouagadougou (BU)
330 637.5 469 5.49 % 250.4 392.8 2020
Table 24 Detailed data for existing cross-border transmission infrastructure
Table 25 Detailed data for future cross-border transmission projects
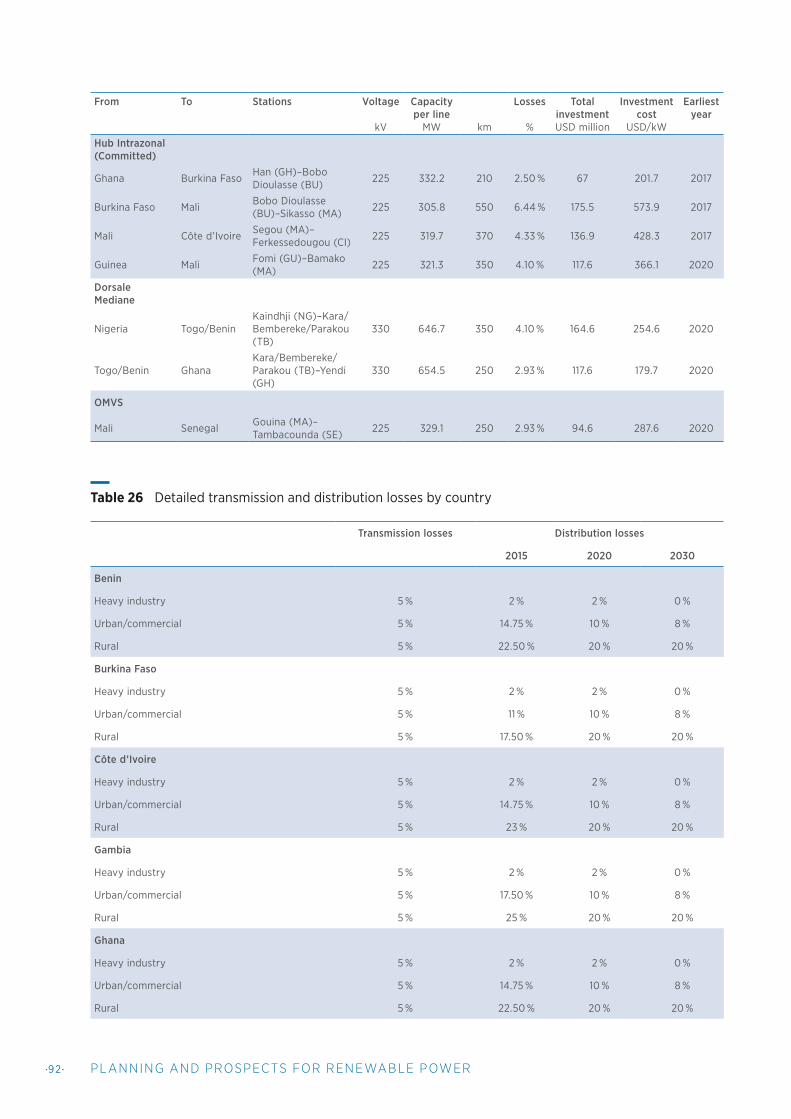
•92• PL ANNING AND PROSPEC TS FOR RENE WABLE POWER
From
To
Stations
Voltage
kV
Capacity per line
MW
km
Losses %
Total investment USD million
Investment cost
USD/kW
Earliest year
Hub Intrazonal (Committed)
Ghana Burkina Faso Han (GH)–Bobo Dioulasse (BU) 225 332.2 210 2.50 % 67 201.7 2017
Burkina Faso Mali Bobo Dioulasse (BU)–Sikasso (MA) 225 305.8 550 6.44 % 175.5 573.9 2017
Mali Côte d’Ivoire Segou (MA)–Ferkessedougou (CI) 225 319.7 370 4.33 % 136.9 428.3 2017
Guinea Mali Fomi (GU)–Bamako (MA) 225 321.3 350 4.10 % 117.6 366.1 2020
Dorsale Mediane
Nigeria Togo/BeninKaindhji (NG)–Kara/Bembereke/Parakou (TB)
330 646.7 350 4.10 % 164.6 254.6 2020
Togo/Benin GhanaKara/Bembereke/Parakou (TB)–Yendi (GH)
330 654.5 250 2.93 % 117.6 179.7 2020
OMVS
Mali Senegal Gouina (MA)–Tambacounda (SE) 225 329.1 250 2.93 % 94.6 287.6 2020
Transmission losses Distribution losses
2015 2020 2030
Benin
Heavy industry 5 % 2 % 2 % 0 %
Urban/commercial 5 % 14.75 % 10 % 8 %
Rural 5 % 22.50 % 20 % 20 %
Burkina Faso
Heavy industry 5 % 2 % 2 % 0 %
Urban/commercial 5 % 11 % 10 % 8 %
Rural 5 % 17.50 % 20 % 20 %
Côte d’Ivoire
Heavy industry 5 % 2 % 2 % 0 %
Urban/commercial 5 % 14.75 % 10 % 8 %
Rural 5 % 23 % 20 % 20 %
Gambia
Heavy industry 5 % 2 % 2 % 0 %
Urban/commercial 5 % 17.50 % 10 % 8 %
Rural 5 % 25 % 20 % 20 %
Ghana
Heavy industry 5 % 2 % 2 % 0 %
Urban/commercial 5 % 14.75 % 10 % 8 %
Rural 5 % 22.50 % 20 % 20 %
Table 26 Detailed transmission and distribution losses by country

•93 •WEST AFRIC A
Transmission losses Distribution losses
2015 2020 2030
Guinea
Heavy industry 5 % 2 % 2 % 0 %
Urban/commercial 5 % 17.50 % 10 % 8 %
Rural 5 % 25 % 20 % 20 %
Guinea-Bissau
Heavy industry 5 % 2 % 2 % 0 %
Urban/commercial 5 % 17.50 % 10 % 8 %
Rural 5 % 25 % 20 % 20 %
Liberia
Heavy industry 5 % 2 % 2 % 0 %
Urban/commercial 5 % 17.50 % 10 % 8 %
Rural 5 % 25 % 20 % 20 %
Mali
Heavy industry 5 % 2 % 2 % 0 %
Urban/commercial 5 % 14.50 % 10 % 8 %
Rural 5 % 22.50 % 20 % 20 %
Niger
Heavy industry 5 % 2 % 2 % 0 %
Urban/commercial 5 % 11 % 10 % 8 %
Rural 5 % 20 % 20 % 20 %
Nigeria
Heavy industry 5 % 2 % 2 % 0 %
Urban/commercial 5 % 11 % 10 % 8 %
Rural 5 % 25 % 20 % 20 %
Senegal
Heavy industry 5 % 2 % 2 % 0 %
Urban/commercial 5 % 15.25 % 10 % 8 %
Rural 5 % 22.50 % 20 % 20 %
Sierra Leone
Heavy industry 5 % 2 % 2 % 0 %
Urban/commercial 5 % 17.50 % 10 % 8 %
Rural 5 % 25 % 20 % 20 %
Togo
Heavy industry 5 % 2 % 2 % 0 %
Urban/commercial 5 % 14.75 % 10 % 8 %
Rural 5 % 22.50 % 20 % 20 %

•94 • PL ANNING AND PROSPEC TS FOR RENE WABLE POWER
APPENDIX E. SELECT REGIONAL RESULTS BY SCENARIO
Scenario Reference Regional EREP Target National Targets
Description
Full background and description provided in
Chapters 1 and 3
Reference Scenario, with region-wide minimum target
of 23 % renewable energy in overall grid-connected
power generation by 2020, and 31 % by 2030, in line
with EREP targets
Reference Scenario, with minimum country-level
targets for the percentage of renewable energy in total domestic generation based
on national renewable energy targets
Additional solar PV capacity 2015–2030 (total capacity by 2030) (GW) 8.2 (8.2) 9.0 (9.0) 21.5 (21.5)
Additional wind capacity 2015–2030 (total capacity by 2030) (GW) 1.6 (1.6) 1.6 (1.6) 1.6 (1.6)
Additional biomass capacity 2015–2030 (total capacity by 2030) (GW) 1.4 (1.4) 4.5 (4.5) 3.1 (3.1)
Additional hydropower capacity 2015–2030 (total capacity by 2030) (GW) 7.3 (11.4) 7.4 (11.5) 7.4 (11.5)
Renewable energy share of centralised electricity production by 2030 (non-hydro)
25 % (10 %) 31 % (16 %) 37 % (22 %)
Total emissions 2015–2030 (MtCO₂) 936 891 855
Average emissions intensity of centralised power generation in 2030 (tCO₂/MWh)
0.34 0.31 0.29
Total undiscounted system costs 2015–2030 (USD billion) 195.4 193.6 195.4
Total undiscounted O&M costs 2015–2030 (% of total system costs) (USD billion)
25.6 (13 %) 26.9 (14 %) 27.6 (14 %)
Total undiscounted CAPEX costs 2015–2030 (% of total system costs) (USD billion)
40.4 (21 %) 44.3 (23 %) 50.1 (26 %)
Total undiscounted fuel costs 2015–2030 (% of total system costs) (USD billion)
116.8 (60 %) 109.7 (56 %) 105.1 (54 %)
Total undiscounted domestic T&D costs 2015–2030 (% of total system costs) (USD billion)
10.7 (5 %) 10.7 (5 %) 10.7 (5 %)
Total undiscounted cross-border transmission costs 2015–2030 (% of total system costs) (USD billion)
1.9 (1 %) 1.9 (1 %) 2 (1 %)
Average electricity price 2015–2030 (average price in 2030) (USD/MWh) 89 (95) 88 (94) 89 (94)
Note: tCO₂/MWh = tonnes of carbon dioxide per megawatt hour.
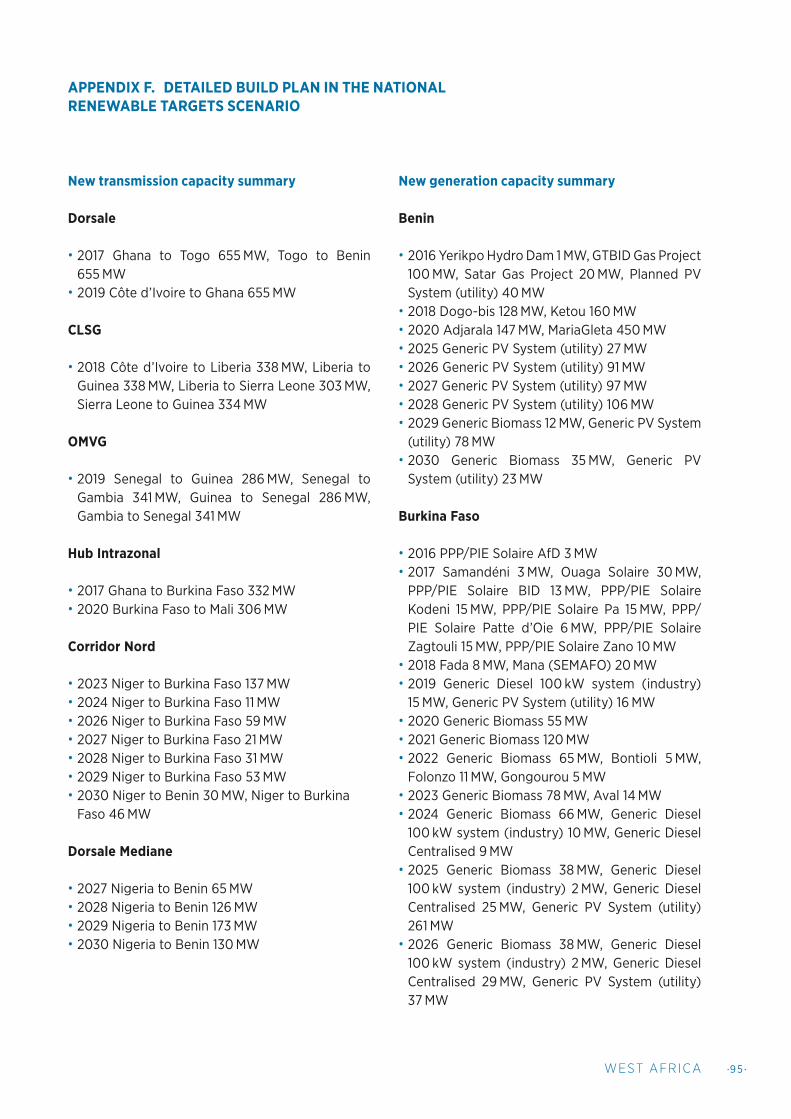
•95 •WEST AFRIC A
APPENDIX F. DETAILED BUILD PLAN IN THE NATIONAL RENEWABLE TARGETS SCENARIO
New transmission capacity summary
Dorsale
• 2017 Ghana to Togo 655 MW, Togo to Benin 655 MW
• 2019 Côte d’Ivoire to Ghana 655 MW
CLSG
• 2018 Côte d’Ivoire to Liberia 338 MW, Liberia to Guinea 338 MW, Liberia to Sierra Leone 303 MW, Sierra Leone to Guinea 334 MW
OMVG
• 2019 Senegal to Guinea 286 MW, Senegal to Gambia 341 MW, Guinea to Senegal 286 MW, Gambia to Senegal 341 MW
Hub Intrazonal
• 2017 Ghana to Burkina Faso 332 MW• 2020 Burkina Faso to Mali 306 MW
Corridor Nord
• 2023 Niger to Burkina Faso 137 MW• 2024 Niger to Burkina Faso 11 MW• 2026 Niger to Burkina Faso 59 MW• 2027 Niger to Burkina Faso 21 MW• 2028 Niger to Burkina Faso 31 MW• 2029 Niger to Burkina Faso 53 MW• 2030 Niger to Benin 30 MW, Niger to Burkina
Faso 46 MW
Dorsale Mediane
• 2027 Nigeria to Benin 65 MW• 2028 Nigeria to Benin 126 MW• 2029 Nigeria to Benin 173 MW• 2030 Nigeria to Benin 130 MW
New generation capacity summary
Benin
• 2016 Yerikpo Hydro Dam 1 MW, GTBID Gas Project 100 MW, Satar Gas Project 20 MW, Planned PV System (utility) 40 MW
• 2018 Dogo-bis 128 MW, Ketou 160 MW• 2020 Adjarala 147 MW, MariaGleta 450 MW• 2025 Generic PV System (utility) 27 MW• 2026 Generic PV System (utility) 91 MW• 2027 Generic PV System (utility) 97 MW• 2028 Generic PV System (utility) 106 MW• 2029 Generic Biomass 12 MW, Generic PV System
(utility) 78 MW• 2030 Generic Biomass 35 MW, Generic PV
System (utility) 23 MW
Burkina Faso
• 2016 PPP/PIE Solaire AfD 3 MW• 2017 Samandéni 3 MW, Ouaga Solaire 30 MW,
PPP/PIE Solaire BID 13 MW, PPP/PIE Solaire Kodeni 15 MW, PPP/PIE Solaire Pa 15 MW, PPP/PIE Solaire Patte d’Oie 6 MW, PPP/PIE Solaire Zagtouli 15 MW, PPP/PIE Solaire Zano 10 MW
• 2018 Fada 8 MW, Mana (SEMAFO) 20 MW• 2019 Generic Diesel 100 kW system (industry)
15 MW, Generic PV System (utility) 16 MW• 2020 Generic Biomass 55 MW• 2021 Generic Biomass 120 MW• 2022 Generic Biomass 65 MW, Bontioli 5 MW,
Folonzo 11 MW, Gongourou 5 MW• 2023 Generic Biomass 78 MW, Aval 14 MW• 2024 Generic Biomass 66 MW, Generic Diesel
100 kW system (industry) 10 MW, Generic Diesel Centralised 9 MW
• 2025 Generic Biomass 38 MW, Generic Diesel 100 kW system (industry) 2 MW, Generic Diesel Centralised 25 MW, Generic PV System (utility) 261 MW
• 2026 Generic Biomass 38 MW, Generic Diesel 100 kW system (industry) 2 MW, Generic Diesel Centralised 29 MW, Generic PV System (utility) 37 MW

•9 6 • PL ANNING AND PROSPEC TS FOR RENE WABLE POWER
• 2027 Generic Biomass 38 MW, Generic Diesel 100 kW system (industry) 2 MW, Generic Diesel Centralised 29 MW, Generic PV System (utility) 52 MW
• 2028 Generic Biomass 38 MW, Generic Diesel Centralised 37 MW, Generic PV System (utility) 38 MW
• 2029 Generic Biomass 38 MW, Generic Diesel Centralised 37 MW, Generic PV System (utility) 20 MW
• 2030 Generic Biomass 37 MW, Generic Diesel 100 kW system (industry) 7 MW, PIE Thermique 40 MW, Generic PV System (utility) 36 MW
Cabo Verde
• 2018 Planned Pump Storage 1 2 MW, Generic PV System (utility) 5 MW, Generic Wind Near Grid 5 MW
• 2019 Generic Diesel 100 kW system (industry) 3 MW, Generic PV system (rooftop – commercial) 1 MW, Generic PV System (utility) 10 MW, Generic Wind Near Grid 10 MW
• 2020 Generic PV System (utility) 27 MW, Generic Wind Near Grid 32 MW
• 2021 Generic PV System (utility) 9 MW• 2022 Planned Pump Storage 1 5 MW, Generic PV
System (utility) 14 MW, Generic Wind Near Grid 6 MW
• 2023 Generic Diesel 100 kW system (industry) 2 MW, Planned Pump Storage 1 6 MW, Generic PV System (utility) 13 MW, Generic Wind Near Grid 4 MW
• 2024 Generic Diesel 100 kW system (industry) 2 MW, Generic Diesel/Gasoline 1 kW system (residential/commercial) 1 MW, Planned Pump Storage 1 6 MW, Planned Pump Storage 2 2 MW, Generic PV system (rooftop – commercial) 18 MW, Generic PV System (utility) 2 MW, Generic Wind Near Grid 1 MW
• 2025 Generic Diesel 100 kW system (industry) 1 MW, Generic Diesel/Gasoline 1 kW system (residential/commercial) 1 MW, Planned Pump Storage 2 9 MW, Generic PV system (rooftop – commercial) 19 MW, Generic PV system (rooftop – urban) 4 MW, Generic PV System (utility) 5 MW, Generic Wind Near Grid 2 MW
• 2026 Generic Diesel 100 kW system (industry) 1 MW, Generic Diesel/Gasoline 1 kW system (commercial) 1 MW, Generic Diesel/Gasoline 1 kW system (residential/commercial) 1 MW, Planned Pump Storage 2 7 MW, Generic PV system (rooftop – commercial) 7 MW, Generic PV system (rooftop – urban) 15 MW, Generic PV System (utility) 3 MW
• 2027 Generic Diesel 100 kW system (industry) 1 MW, Generic Diesel/Gasoline 1 kW system (commercial) 7 MW, Generic Diesel/Gasoline 1 kW system (residential/commercial) 1 MW, Generic Diesel/Gasoline 1 kW system (Rural) 4 MW, Planned Pump Storage 2 1 MW, Generic PV system (rooftop – commercial) 3 MW
• 2028 Generic Diesel 100 kW system (industry) 1 MW, Generic Diesel/Gasoline 1 kW system (commercial) 10 MW, Generic Diesel/Gasoline 1 kW system (residential/commercial) 4 MW, Generic PV with 2 h Battery (rooftop – rural) 2 MW
• 2029 Generic Diesel 100 kW system (industry) 1 MW, Generic Diesel/Gasoline 1 kW system (commercial) 6 MW, Generic Diesel/Gasoline 1 kW system (residential/commercial) 4 MW, Generic PV with 2 h Battery (rooftop – rural) 5 MW
• 2030 Generic Diesel 100 kW system (industry) 12 MW, Generic Diesel/Gasoline 1 kW system (commercial) 3 MW, Generic Diesel/Gasoline 1 kW system (residential/commercial) 10 MW, Generic PV with 2 h Battery (rooftop – rural) 5 MW

•97•WEST AFRIC A
Côte d’Ivoire
• 2016 4e centrale IPP (Abbata) 150 MW• 2017 4e centrale IPP (Abbata) 150 MW• 2020 Generic Gas Combined Cycle 545 MW• 2021 Generic PV System (utility) 112 MW• 2022 Generic PV System (utility) 140 MW• 2023 Generic Gas Combined Cycle 299 MW,
Generic PV System (utility) 168 MW• 2024 Generic Gas Combined Cycle 141 MW,
Generic PV System (utility) 186 MW• 2025 Generic PV System (utility) 222 MW• 2026 Generic Gas Combined Cycle 42 MW,
Generic Hydro (small) 16 MW, Generic PV System (utility) 498 MW
• 2027 Generic Gas Combined Cycle 181 MW, Generic Hydro (small) 17 MW, Generic PV System (utility) 86 MW
• 2028 Tiboto/Cavally (Intl.) part CI 50 % 81 MW, Generic Gas Combined Cycle 101 MW, Generic Hydro (small) 4 MW, Generic PV System (utility) 417 MW
• 2029 Boutoubré 82 MW, Tiboto/Cavally (Intl.) part CI 50 % 113 MW, Generic Hydro (small) 4 MW, Generic PV System (utility) 135 MW
• 2030 Boutoubré 74 MW, Soubre 85 MW, Tiboto/Cavally (Intl.) part CI 50 % 27 MW, Generic PV System (utility) 340 MW
Gambia
• 2016 Bakau 1 MW• 2017 Brikama 20 MW• 2018 Generic PV System (utility) 18 MW• 2019 Generic PV System (utility) 18 MW• 2020 Generic Biomass 6 MW• 2021 Generic Biomass 6 MW• 2022 Generic Biomass 4 MW, Generic Gas
Combined Cycle 29 MW• 2023 Generic Biomass 8 MW• 2024 Generic Biomass 6 MW• 2025 Generic PV System (utility) 5 MW• 2026 Generic PV System (utility) 3 MW
• 2027 Generic Biomass 3 MW, Generic PV System (utility) 3 MW
• 2028 Generic Biomass 4 MW, Generic PV System (utility) 3 MW
• 2029 Generic Biomass 4 MW, Generic PV System (utility) 3 MW
• 2030 Generic Biomass 4 MW, Generic PV System (utility) 3 MW
Ghana
• 2016 Karpower 225 MW, Aboadze T3 phase 1 (TEMA1, 2, 2X) 30 MW, AMERI 230 MW, Sunon Asogli phase 2,170 MW, KTPP 200 MW, VRA+BXC(2016) 20 MW
• 2018 Generic PV System (utility) 74 MW, Ayitepa Wind Farm 225 MW
• 2019 Generic PV System (utility) 325 MW• 2020 Generic Biomass 141 MW, Generic Gas
Combined Cycle 1000 MW• 2021 Generic Biomass 94 MW• 2022 Generic Biomass 99 MW, Generic Gas
Combined Cycle 129 MW• 2023 Generic Biomass 113 MW, Generic Gas
Combined Cycle 104 MW• 2024 Generic Biomass 75 MW, Generic Gas
Combined Cycle 210 MW, Generic Hydro (small) 33 MW, Generic PV System (utility) 92 MW
• 2025 Generic Gas Combined Cycle 67 MW, Generic PV System (utility) 845 MW
• 2026 Generic Gas Combined Cycle 276 MW, Generic PV System (utility) 40 MW
• 2027 Generic Gas Combined Cycle 98 MW, Generic Hydro (small) 33 MW, Generic PV System (utility) 1423 MW
• 2028 Generic Gas Combined Cycle 136 MW, Generic Hydro (small) 13 MW
• 2029 Generic Gas Combined Cycle 55 MW, Generic Hydro (small) 4 MW
• 2030 Generic Diesel/Gasoline 1 kW system (Rural) 9 MW, Generic Gas Combined Cycle 280 MW, Generic Hydro (small) 4 MW

•98 • PL ANNING AND PROSPEC TS FOR RENE WABLE POWER
Guinea
• 2016 K-Energie 75 MW, Kipé 50 MW, Loffa(rehab) 1 MW
• 2018 Generic PV System (utility) 10 MW, Kerouané 1 MW, Khoummaguély 64 MW
• 2019 Generic Diesel 100 kW system (industry) 23 MW, Generic PV System (utility) 50 MW, Iles de loos 1 MW, Kankan 8 MW, Khoummaguély 16 MW, Kouroussa 1 MW, Madiana 1 MW
• 2020 Generic Biomass 56 MW, Amaria 280 MW, Generic Hydro (small) 3 MW
• 2021 Generic Biomass 26 MW, Koukoutamba 294 MW
• 2022 Generic Biomass 27 MW, Generic Hydro (small) 1 MW
• 2023 Generic Biomass 27 MW• 2024 Generic Biomass 13 MW, Generic PV System
(utility) 36 MW• 2025 Generic PV System (utility) 240 MW• 2026 Morissananko 100 MW, Generic PV System
(utility) 42 MW• 2027 Generic PV System (utility) 42 MW• 2028 Generic PV System (utility) 42 MW• 2029 Generic PV System (utility) 41 MW• 2030 Other Hydro Projects 62 MW, Generic PV
System (utility) 57 MW
Guinea-Bissau
• 2018 Generic Diesel 100 kW system (industry) 1 MW, Generic PV System (utility) 7 MW
• 2019 Generic PV System (utility) 11 MW• 2020 Generic Biomass 19 MW• 2021 Generic Biomass 5 MW, Generic Gas
Combined Cycle 2 MW• 2022 Generic Gas Combined Cycle 26 MW• 2025 Generic PV System (utility) 14 MW• 2026 Generic PV System (utility) 3 MW• 2027 Generic PV System (utility) 3 MW• 2028 Generic Biomass 4 MW, Generic PV System
(utility) 3 MW• 2029 Generic Biomass 8 MW, Generic PV System
(utility) 3 MW• 2030 Generic Biomass 8 MW, Generic PV System
(utility) 3 MW
Liberia
• 2016 Generic Diesel 100 kW system (industry) 2 MW, Generic Diesel/Gasoline 1 kW system (Rural) 1 MW
• 2017 Mount Coffee (+via reservoir) 22 MW• 2018 Mount Coffee (+via reservoir) 44 MW• 2022 Biomass MSW 2 MW• 2028 Generic Hydro (small) 1 MW• 2029 Generic Hydro (small) 2 MW• 2030 Generic Biomass 3 MW, Saint Paul -2 7 MW,
Generic Hydro (small) 2 MW
Mali
• 2017 Diesel Generators OHF 2 MW• 2018 Diesel Generators OHF 2 MW, Felou (OMVS)
part Mali 45 % 60 MW• 2019 Gouina (OMVS) part Mali 45 % 140 MW• 2021 Diesel Generators OHF 2 MW• 2022 Generic Biomass 10 MW, Diesel Generators
OHF 2 MW• 2023 Generic Biomass 30 MW, Diesel Generators
OHF 2 MW• 2024 Generic Biomass 34 MW, Diesel Generators
OHF 2 MW• 2025 Diesel Generators OHF 2 MW, Generic PV
System (utility) 447 MW• 2026 Generic Biomass 43 MW, Diesel Generators
OHF 2 MW, Generic PV System (utility) 47 MW• 2027 Generic Biomass 60 MW, Diesel Generators
OHF 2 MW, Generic PV System (utility) 39 MW• 2028 Generic Diesel/Gasoline 1 kW system (Rural)
2 MW, Diesel Generators OHF 2 MW, Generic PV System (utility) 29 MW
• 2029 Generic Diesel/Gasoline 1 kW system (Rural) 2 MW, Diesel Generators OHF 2 MW, Generic PV System (utility) 26 MW
• 2030 Generic Biomass 85 MW, Generic Diesel 100 kW system (industry) 5 MW, Generic Diesel/Gasoline 1 kW system (residential/commercial) 17 MW, Generic Diesel/Gasoline 1 kW system (Rural) 2 MW, Diesel Generators OHF 2 MW

•99 •WEST AFRIC A
Niger
• 2016 Generic Diesel 100 kW system (industry) 6 MW, Solar Mal 7 MW
• 2017 Tchiro 11 MW, Kandadji 130 MW• 2018 Tchiro 14 MW• 2020 Generic Biomass 27 MW, Generic Wind
Near Grid 12 MW, Generic Wind Away From Grid 30 MW
• 2021 Generic Coal 99 MW, Generic Wind Near Grid 49 MW
• 2022 Generic Coal 39 MW, Generic Wind Near Grid 44 MW
• 2023 Generic Coal 39 MW, Generic Wind Near Grid 47 MW
• 2024 Generic Coal 39 MW, Generic Wind Near Grid 49 MW
• 2025 Generic Coal 39 MW, Generic PV System (utility) 6 MW, Generic Wind Away From Grid 89 MW, Generic Wind Near Grid 27 MW
• 2026 Generic Coal 40 MW, Generic Wind Away From Grid 12 MW, Generic Wind Near Grid 18 MW
• 2027 Generic Coal 38 MW, Generic PV System (utility) 9 MW, Generic Wind Near Grid 18 MW
• 2028 Generic Coal 36 MW, Generic PV System (utility) 55 MW, Generic Wind Near Grid 20 MW
• 2029 Generic Coal 36 MW, Generic PV System (utility) 76 MW, Generic Wind Near Grid 22 MW
• 2030 Generic Biomass 33 MW, Generic Coal 31 MW, Generic PV System (utility) 4 MW, Generic Wind Near Grid 16 MW
Nigeria
• 2016 Jebba 80 MW, Kainji 340 MW, Shiroro 150 MW, CPG Okija 1277 MW
• 2018 Generic PV System (utility) 417 MW• 2019 Zungeru 700 MW, Generic PV System
(utility) 750 MW• 2020 Generic Biomass 729 MW, Generic Gas
Combined Cycle 2000 MW, Generic PV System (utility) 1250 MW
• 2021 Mambilla 2305 MW, Generic Gas Combined Cycle 2000 MW
• 2022 Mambilla 745 MW, Generic Gas Combined Cycle 2000 MW
• 2023 Generic Gas Combined Cycle 1221 MW• 2024 Generic Gas Combined Cycle 793 MW• 2025 Generic Gas Combined Cycle 509 MW,
Generic PV System (utility) 882 MW• 2026 Generic Gas Combined Cycle 434 MW,
Generic PV System (utility) 1608 MW• 2027 Generic Gas Combined Cycle 236 MW,
Generic PV System (utility) 2000 MW• 2028 Generic Gas Combined Cycle 370 MW,
Generic PV System (utility) 2000 MW• 2029 Generic Gas Combined Cycle 577 MW,
Generic Gas Open Cycle 276 MW, Generic PV System (utility) 2000 MW
• 2030 Generic Gas Combined Cycle 2000 MW, Generic Gas Open Cycle 2000 MW, Generic PV System (utility) 2000 MW
Senegal
• 2016 IPP Contour Global 52 MW, IPP Tobene 70 MW
• 2017 Centrale Diass financement Kfw 15 MW, taiba ndiaye 50 MW
• 2018 Sendou 125 MW, Centrale Niass financement 15 MW, Generic Wind Near Grid 22 MW, taiba ndiaye 50 MW
• 2019 Mboro 300 MW, Generic PV System (utility) 156 MW, taiba ndiaye 50 MW
• 2020 Generic Biomass 47 MW, Generic PV System (utility) 134 MW
• 2021 Generic Biomass 44 MW• 2022 Generic Biomass 50 MW, Generic Gas
Combined Cycle 100 MW• 2023 Generic Biomass 47 MW, Generic Gas
Combined Cycle 100 MW• 2024 Generic Biomass 47 MW, Generic Gas
Combined Cycle 100 MW, Generic PV System (utility) 5 MW
• 2025 Generic PV System (utility) 308 MW, Generic Wind Near Grid 400 MW
• 2026 Generic Wind Near Grid 212 MW• 2027 Generic Gas Combined Cycle 57 MW,
Generic Wind Near Grid 109 MW• 2028 Generic Biomass 158 MW, Generic PV
System (utility) 63 MW, Generic Wind Near Grid 13 MW

•100 • PL ANNING AND PROSPEC TS FOR RENE WABLE POWER
• 2029 Generic Biomass 76 MW, Generic Gas Combined Cycle 81 MW, Generic PV System (utility) 72 MW
• 2030 Generic Coal 34 MW, Generic Diesel 100 kW system (industry) 42 MW, Generic Gas Open Cycle 56 MW, Generic PV System (utility) 72 MW
Sierra Leone
• 2016 Generic Diesel 100 kW system (industry) 7 MW
• 2017 Addax 8 MW, Generic Diesel 100 kW system (industry) 7 MW, Solar2 6 MW
• 2018 Western Area Power Project (WB) 57 MW, Solar2 6 MW
• 2021 Generic Biomass 6 MW• 2022 Bumbuna2 40 MW• 2023 Bumbuna3 (Yiben) 90 MW• 2024 Bumbuna4&5 95 MW• 2025 Benkongor1 35 MW• 2026 Benkongor2 80 MW• 2027 Benkongor3 86 MW• 2028 DAM Envisagée 100 MW• 2029 DAM Envisagée 100 MW• 2030 DAM Envisagée 100 MW
Togo
• 2019 Generic PV System (utility) 17 MW• 2020 Generic Biomass 16 MW, Generic Gas
Combined Cycle 5 MW• 2021 Generic Biomass 8 MW• 2022 Generic Biomass 9 MW• 2023 Generic Biomass 10 MW• 2024 Generic Biomass 10 MW, Generic Gas
Combined Cycle 17 MW• 2025 Generic Biomass 9 MW, Generic Gas
Combined Cycle 10 MW, Generic Hydro (small) 5 MW
• 2026 Generic Biomass 10 MW, Generic Gas Combined Cycle 10 MW, Generic Hydro (small) 5 MW
• 2027 Generic Biomass 12 MW, Generic Gas Combined Cycle 12 MW, Generic Hydro (small) 1 MW
• 2028 Generic Biomass 12 MW, Generic Gas Combined Cycle 11 MW, Generic Hydro (small) 1 MW
• 2029 Generic Biomass 26 MW, Generic Gas Combined Cycle 4 MW, Generic Hydro (small) 1 MW
• 2030 Generic Diesel/Gasoline 1 kW system (Rural) 1 MW, Generic Gas Open Cycle 16 MW, Generic Hydro (small) 1 MW

•101 •WEST AFRIC A
APPENDIX G. DETAILED COUNTRY DISPATCH IN 2030 IN THE NATIONAL RENEWABLE TARGETS SCENARIO
Benin
Burkina Faso
1 2 31 3 5 7 9 11 13 15 17 19 21 232 4 6 8 10 12 14 1616 18 2220 241 3 5 7 9 11 13 15 17 19 21 232 4 6 8 10 12 14 1616 18 2220 24 1 3 5 7 9 11 13 15 17 19 21 232 4 6 8 10 12 14 1616 18 2220 240
-200
-400
200
400
600
800
1,000
Benin
MW
Wind
Distributed solar PV
Solar PV
Solar thermal
Biomass
Mini-hydro
Hydro
Gas
Distributed oil
Oil
Coal
Net imports
1 2 3
1 3 5 7 9 11 13 15 17 19 21 232 4 6 8 10 12 14 1616 18 2220 240
-100
200
400
600
800
900
Burkina Faso
1 3 5 7 9 11 13 15 17 19 21 232 4 6 8 10 12 14 1616 18 2220 241 3 5 7 9 11 13 15 17 19 21 232 4 6 8 10 12 14 1616 18 2220 24
-200
100
300
500
700
MW
Wind
Distributed solar PV
Solar PV
Solar thermal
Biomass
Mini-hydro
Hydro
Gas
Distributed oil
Oil
Coal
Net imports

•102• PL ANNING AND PROSPEC TS FOR RENE WABLE POWER
Cabo Verde
Côte d’Ivoire
Cabo Verde
1 2 3
1 3 5 7 9 11 13 15 17 19 21 232 4 6 8 10 12 14 1616 18 2220 241 3 5 7 9 11 13 15 17 19 21 232 4 6 8 10 12 14 1616 18 2220 24 1 3 5 7 9 11 13 15 17 19 21 232 4 6 8 10 12 14 1616 18 2220 24
40
20
0
60
80
100
120
MW
Wind
Distributed solar PV
Solar PV
Solar thermal
Biomass
Mini-hydro
Hydro
Gas
Distributed oil
Oil
Coal
Net imports
Wind
Distributed solar PV
Solar PV
Solar thermal
Biomass
Mini-hydro
Hydro
Gas
Distributed oil
Oil
Coal
Net imports
3
1,000
500
0
1,500
2,000
2,500
Côte d'Ivoire
3,000
4,000
3,500
-500
-1000
1 3 5 7 9 11 13 15 17 19 21 232 4 6 8 10 12 14 16 18 2220 241 3 5 7 9 11 13 15 17 19 21 232 4 6 8 10 12 14 16 18 2220 24 1 3 5 7 9 11 13 15 17 19 21 232 4 6 8 10 12 14 16 18 2220 24
21
MW

•103 •WEST AFRIC A
Gambia
Ghana
31 3 5 7 9 11 13 15 17 19 21 232 4 6 8 10 12 14 1616 18 2220 241 3 5 7 9 11 13 15 17 19 21 232 4 6 8 10 12 14 1616 18 2220 24 1 3 5 7 9 11 13 15 17 19 21 232 4 6 8 10 12 14 1616 18 2220 24
0
Gambia
21
20
40
60
80
100
120
-20
MW
Wind
Distributed solar PV
Solar PV
Solar thermal
Biomass
Mini-hydro
Hydro
Gas
Distributed oil
Oil
Coal
Net imports
Wind
Distributed solar PV
Solar PV
Solar thermal
Biomass
Mini-hydro
Hydro
Gas
Distributed oil
Oil
Coal
Net imports
MW
31 3 5 7 9 11 13 15 17 19 21 232 4 6 8 10 12 14 1616 18 2220 241 3 5 7 9 11 13 15 17 19 21 232 4 6 8 10 12 14 1616 18 2220 24 1 3 5 7 9 11 13 15 17 19 21 232 4 6 8 10 12 14 1616 18 2220 24
0
Ghana
21
1,000
2,000
3,000
4,000
5,000
6,000

•104 • PL ANNING AND PROSPEC TS FOR RENE WABLE POWER
Guinea
Guinea-Bissau
Guinea
MW
1 3 5 7 9 11 13 15 17 19 21 232 4 6 8 10 12 14 1616 18 2220 241 3 5 7 9 11 13 15 17 19 21 232 4 6 8 10 12 14 1616 18 2220 24 1 3 5 7 9 11 13 15 17 19 21 232 4 6 8 10 12 14 16 18 2220 24
200
0
-200
400
600
800
1,000
1,400
1,200
-400
-600
Wind
Distributed solar PV
Solar PV
Solar thermal
Biomass
Mini-hydro
Hydro
Gas
Distributed oil
Oil
Coal
Net imports
MW
-20
31 3 5 7 9 11 13 15 17 19 21 232 4 6 8 10 12 14 16 18 2220 241 3 5 7 9 11 13 15 17 19 21 232 4 6 8 10 12 14 16 18 2220 24 1 3 5 7 9 11 13 15 17 19 21 232 4 6 8 10 12 14 16 18 2220 24
21
0
20
40
60
80
100
-40
Guinea-BissauWind
Distributed solar PV
Solar PV
Solar thermal
Biomass
Mini-hydro
Hydro
Gas
Distributed oil
Oil
Coal
Net imports

•105 •WEST AFRIC A
Liberia
Mali
Liberia
MW
31 3 5 7 9 11 13 15 17 19 21 232 4 6 8 10 12 14 16 18 2220 241 3 5 7 9 11 13 15 17 19 21 232 4 6 8 10 12 14 1616 18 2220 24 1 3 5 7 9 11 13 15 17 19 21 232 4 6 8 10 12 14 16 18 2220 24
-20
21
0
20
40
60
80
100
Wind
Distributed solar PV
Solar PV
Solar thermal
Biomass
Mini-hydro
Hydro
Gas
Distributed oil
Oil
Coal
Net imports
Mali
MW
31 3 5 7 9 11 13 15 17 19 21 232 4 6 8 10 12 14 1616 18 2220 241 3 5 7 9 11 13 15 17 19 21 232 4 6 8 10 12 14 1616 18 2220 24 1 3 5 7 9 11 13 15 17 19 21 232 4 6 8 10 12 14 1616 18 2220 24
21
400
300
200
500
600
700
800
1,000
900
100
0
Wind
Distributed solar PV
Solar PV
Solar thermal
Biomass
Mini-hydro
Hydro
Gas
Distributed oil
Oil
Coal
Net imports

•10 6 • PL ANNING AND PROSPEC TS FOR RENE WABLE POWER
Niger
Nigeria
1
MW
-200
316
2
0
200
400
600
800
1,000
-400
Niger
1 3 5 7 9 11 13 15 17 19 21 232 4 6 8 10 12 14 16 18 2220 241 3 5 7 9 11 13 15 17 19 21 232 4 6 8 10 12 14 16 18 2220 241 3 5 7 9 11 13 15 17 19 21 232 4 6 8 10 12 14 16 18 2220 24
Wind
Distributed solar PV
Solar PV
Solar thermal
Biomass
Mini-hydro
Hydro
Gas
Distributed oil
Oil
Coal
Net imports
Nigeria
MW
-5,000
0
5,000
10,000
15,000
20,000
25,000
1 3 5 7 9 11 13 15 17 19 21 232 4 6 8 10 12 14 16 18 2220 241 3 5 7 9 11 13 15 17 19 21 232 4 6 8 10 12 14 1616 18 2220 24 1 3 5 7 9 11 13 15 17 19 21 232 4 6 8 10 12 14 16 18 2220 24
321
Wind
Distributed solar PV
Solar PV
Solar thermal
Biomass
Mini-hydro
Hydro
Gas
Distributed oil
Oil
Coal
Net imports

•107•WEST AFRIC A
Sierra Leone
MW
-400
-200
0
200
400
600
800
1 3 5 7 9 11 13 15 17 19 21 232 4 6 8 10 12 14 16 18 2220 241 3 5 7 9 11 13 15 17 19 21 232 4 6 8 10 12 14 16 18 2220 24 1 3 5 7 9 11 13 15 17 19 21 232 4 6 8 10 12 14 1616 18 2220 24
321
-600
1,000
Wind
Distributed solar PV
Solar PV
Solar thermal
Biomass
Mini-hydro
Hydro
Gas
Distributed oil
Oil
Coal
Net imports
Senegal
Sierra Leone
Senegal
MW
-500
0
500
1,000
1,500
2,000
3
1 3 5 7 9 11 13 15 17 19 21 232 4 6 8 10 12 14 16 18 2220 241 3 5 7 9 11 13 15 17 19 21 232 4 6 8 10 12 14 16 18 2220 24 1 3 5 7 9 11 13 15 17 19 21 232 4 6 8 10 12 14 16 18 2220 24
21
Wind
Distributed solar PV
Solar PV
Solar thermal
Biomass
Mini-hydro
Hydro
Gas
Distributed oil
Oil
Coal
Net imports

•108 • PL ANNING AND PROSPEC TS FOR RENE WABLE POWER
Togo
Togo
MW
50
100
150
200
250
300
350
1 3 5 7 9 11 13 15 17 19 21 232 4 6 8 10 12 14 1616 18 2220 241 3 5 7 9 11 13 15 17 19 21 232 4 6 8 10 12 14 16 18 2220 24 1 3 5 7 9 11 13 15 17 19 21 232 4 6 8 10 12 14 16 18 2220 24
321
0
400
Wind
Distributed solar PV
Solar PV
Solar thermal
Biomass
Mini-hydro
Hydro
Gas
Distributed oil
Oil
Coal
Net imports

•109 •WEST AFRIC A
Note: Honorific titles are omitted.
National experts participating in SPLAT-W workshops, 2015–2016
Todéman F. Assan, Directorate General of Energy, Benin
Massombé Crespin Kabore, Ministry of Mines and Energy, Burkina Faso
Ariel Cruz Assunção, Directorate-General for Energy, Cabo Verde
Lamin K. Marong, Ministry of Energy, The Gambia
Momodou Lamin Sompo Ceesay, Public Utilities Regulatory Authority, The Gambia
Alhaji Salifu Cham, National Water and Electricity Company, The Gambia
Momo Maninka Bangoura, Ministry of Energy and Water, Guinea
Albert Saa Dembadouno, Ministry of Energy and Water, Guinea
Mamadou Diouma Bah, Ministry of Energy and Water, Guinea
Prince C. Wilson, Ministry of Lands, Mines and Energy, Liberia
Varney K. Garpue, Rural and Renewable Energy Agency, Liberia
Oumarou Adamou, Ministry of Energy and Oil, Niger
Pape Daouda Tine, National Power Company, Senegal
Issa Rouhou Laye Sonko, Ministry of Energy and Development of Renewable Energy, Senegal
Sinneh Abdulsallam Kamara, Electricity Generation and Transmission Company, Sierra Leone
Robin Fola Mansaray, Ministry of Energy, Sierra Leone
Paul Charles Saffa, Ministry of Energy, Sierra Leone
Gbaty Tiadja Gbandey, Ministry of Mines and Energy, Togo
Hodabalo Assih, Ministry of Mines and Energy, Togo
N’bouéké Afanou, Ministry of Mines and Energy, Togo
