placental amino acid transport and placental leptin resistance in pregnancies complicated by...
TRANSCRIPT
lable at ScienceDirect
Placenta 31 (2010) 718e724
Contents lists avai
Placenta
journal homepage: www.elsevier .com/locate/placenta
Placental Amino Acid Transport and Placental Leptin Resistance in PregnanciesComplicated by Maternal Obesityq
D.M. Farley*, J. Choi, D.J. Dudley, C. Li, S.L. Jenkins, L. Myatt, P.W. NathanielszCenter for Pregnancy and Newborn Research, Department of Obstetrics and Gynecology, Division of Maternal-Fetal Medicine, University of Texas Health Science Center at SanAntonio, Texas, USA
a r t i c l e i n f o
Article history:Accepted 9 June 2010
Keywords:PregnancyObesityLeptinSNATPlacental dysfunctionAmino acid transporter
q Study conducted in San Antonio, Texas, USA.* Corresponding author. Department of Obstetrics a
Texas Health Science Center at San Antonio, Mail codeSan Antonio, TX 78229-3900, USA. Tel.: þ1 210 567 5
E-mail address: [email protected] (D.M. Farley
0143-4004/$ e see front matter � 2010 Elsevier Ltd.doi:10.1016/j.placenta.2010.06.006
a b s t r a c t
Hypothesis and study objectives: We hypothesized that maternal obesity is associated with increasedplacental amino acid transport and hyperleptinemia. Our objectives were to study placental amino acidtransport and the effect of leptin on placental amino acid transport in vitro in the setting of maternalobesity.Materials and methods: Seven lean, BMI at entry 22.4, and seven obese, BMI at entry 31.5 (p < 0.001),pregnant women were studied at 39 weeks. We measured baseline and leptin-stimulated placentalsystem A sodium-dependent neutral amino acid transporter (SNAT) activity, placental immunoreactiveprotein expression of SNAT, leptin and leptin receptor, and maternal and fetal plasma leptin concen-trations, with significance set at p � 0.05. The primary outcome measure was placental SNAT activity.Results: The obese group had decreased placental SNAT activity (p ¼ 0.005), maternal hyperleptinemia(p ¼ 0.01) and decreased syncytiotrophoblast expression of leptin receptor (p ¼ 0.01) and SNAT-4(p < 0.001). Placental amino acid uptake was significantly stimulated by leptin in the lean group ascompared to the obese group. Maternal weight gain and offspring birth weights were not differentbetween groups.Conclusion: Maternal obesity was accompanied by decreased placental SNAT activity associated withmaternal hyperleptinemia and placental leptin resistance in spite of appropriate maternal weight gainand normally grown neonates. These findings suggest altered placental function that may have clinicalimplications in obese pregnant women.
� 2010 Elsevier Ltd. All rights reserved.
1. Introduction
The prevalence of pre-pregnancy obesity has increased and isestimated to be almost 30% among reproductive aged women[1e3]. Moreover the prevalence of obesity is more than 50% in somegroups of Hispanic women [4]. Maternal obesity is associated withadverse pregnancy outcomes related to altered placental function(e.g. fetal macrosomia, hypertensive disease and fetal death)although pathogenic mechanisms are not understood [5e13].Placental dysfunction, in turn, is associated with abnormal aminoacid transport [14e16]. Investigation into the effects of obesity onplacental amino acid transport is timely and needed.
nd Gynecology, University of7836, 7703 Floyd Curl Drive,035; fax: þ1 210 567 3013.).
All rights reserved.
Fetal growth depends on placental amino acid transport. ThesystemA sodium-dependent neutral amino acid transporter (SNAT)consists of three isoforms (SNAT 1, 2, 4) that are well characterizedin the placenta in relation to fetal growth in various situations[16e20]. Decreased placental SNAT activity has been illustrated inpregnancies complicated by fetal growth restriction [21]. However,little is known about the effects of maternal obesity on placentalSNAT activity. Leptin is a peptide hormone originally described asbeing produced by adipocytes with an increase noted in obesepatients [22e25]. However, leptin has been found to increaseduring pregnancy due to placental production [26e30]. Leptin hasbeen shown to increase placental SNATactivity in the first trimesterand at term [20]. Also, leptin resistance is apparent in both obesity[22e25] and pregnancy [26e30]. Whether maternal obesity duringpregnancy increases leptin resistance or to what extent if any leptinaffects placental SNAT activity is not known.
We hypothesized that maternal obesity would increaseplacental SNAT activity due to the association of obesity with fetalovergrowth and maternal hyperleptinemia. The primary outcome
D.M. Farley et al. / Placenta 31 (2010) 718e724 719
of our study was to evaluate placental SNATactivity in the setting ofmaternal obesity. Additionally, we studied the effect of leptin onplacental SNAT activity in this setting.
2. Materials and methods
This study was approved by the Institutional Review Boards of the University ofTexas Health Science Center and University Hospital of San Antonio, Texas. Afterinformed consent, blood samples and placentas were collected from 14 patientsundergoing elective cesarean delivery at 39weeks gestation fromNovember 2007 toJune 2009. The inclusion criteria were a first trimester entry body mass index (BMI)of 18.5e24.9 kg/m2 for lean and 30e40 kg/m2 for obese subjects [31]. Exclusioncriteria were labor, ruptured membranes, and bleeding which were determined byhistory and physical examination upon admission for delivery. Womenwithmedicalcomplications such as hypertension, pre-gestational and gestational diabetes(abnormal screening and diagnostic glucose testing) were also excluded. Maternaldata collected included height and weight at entry and delivery (measured onstandard scales approved by the hospital system), pregnancy weight gain, estimatedgestational age (by last menstrual period and ultrasound), blood pressure atdelivery, and medical and prenatal history. Fasting maternal venous blood samples(EDTA-treated plasma) were obtained preoperatively the morning of delivery.Neonatal data included birth weight, height, ponderal index, and APGAR scores asdetermined by a neonatal nurse practitioner. Umbilical cord blood samples (EDTA-treated plasma) were taken after delivery. Arterial cord blood (heparin-treated tube)gas analysis was performed within 5 min of delivery (37 �C, NICU lab GEM 3000-14633, internal QA). Blood samples (maintained on ice) and the placenta (not on iceso as to not affect estimation of amino acid transport) were processed in the medicalschool adjacent to the hospital, which involved minimal transport time (<5 min).Blood samples were centrifuged at 4 �C (300 rpm, 90 min) and the plasma was snapfrozen and immediately stored at �80 �C. Within 30 min of delivery, the placenta,fetal membranes and umbilical cord were trimmed, weighed and measured.Random 1�1-cm full thickness sections of placentawere dissected using awire grid(12 � 6-cm wire rectangle with 3 rows of 2 � 2 cm squares) that was laid on theplacenta. Using a random numbering sequence, 10e15 biopsies from each placentawere taken for amino acid transporter analysis, paraffin embedding and frozenstorage. Using 6e7 of these biopsies, villous tissue was dissected by removing thechorionic plate and decidual layers. Then, triplicate 5-mm3 ’fragments’ of villoustissue were dissected, hung on specially designed hooks and bathed continuously infresh buffer (Dulbecco’s Modifed Eagle Medium and Tyrode’s solution, 1:3, pH 7.4,37 �C).
2.1. Placental SNAT activity analysis
Placental SNAT activity was measured as an index of placental amino acidtransport via uptake of the neutral non-metabolized synthetic amino acid, 14C-methyl-amino-isobutyric acid (14C-MeAIB, 10 nM). Placental SNAT activity wasestimated by amount of 14C-MeAIB uptake into the 5-mm3 villous ’fragments’ over160 min measured as picomoles of 14C-MeAIB taken up per milligram of villousprotein per minute (pmol mg-protein�1 min�1) [17,20]. The uptake analysis wasdone within 6 h of delivery so as to approximate in vivo activity as previouslydescribed [20]. Briefly, the ’fragments’ were hung on hooks and moved througha series of solutions including an uptake solution containing 14C-MeAIB. Two sets oftriplicate hooks were used, one in Naþ-containing solution and one in Naþ-freesolution, because system A is Naþ-dependent. The effect of leptin stimulation onplacental SNAT activity was measured by incubating villous ’fragments’ in humanrecombinant leptin (Sigma Corp, 100 ng mL�1 or 500 ng mLˉ1) for 60 min just beforeplacing them into uptake solution over 40 min [20]. Leptin concentrations of 100and 500 ng mL�1, which are higher than physiologic levels, were used to studyresponsiveness of system A because the villous tissue was subject to hyper-leptinemia of pregnancy and obesity, thus higher leptin concentrations would beneeded to illustrate an effect on placental SNAT activity [20]. After ’fragments’ werein uptake solution, theywere placed in chilled Tyrode’s buffer to stop SNAT uptake of14C-MeAIB. Then, fragments were incubated in distilled water for 18 h to lyse cellmembranes releasing 14C-MeAIB, which was measured with a scintillation counterto estimate 14C counts per minute. Differences in ‘fragment’ size were accounted forby measuring denatured protein concentrations [mg mLˉ1] using the Bradfordmethod. Using 14C-MeAIB standards, amino acid uptake was calculated [pmol mg-proteinˉ1 minˉ1]. System A uptake activity is Naþ-dependent and was calculatedfrom the difference of uptake between fragments in Naþ-free and Naþ-containinguptake solution. Transporter activity was quantified using area under the curve(AUC) and linear regression. The AUC was calculated between the 2 uptake curves[pmol mg-proteinˉ1] generated by fragments in Naþ-free and Naþ-containing uptakesolution from 5 to 160 min, and AUC values were compared and used for correla-tions. We estimated the transport activity with linear regression to determine theline of best fit of uptake activity (linear to 120 min); the slope of this line was theuptake rate [pmol mg-proteinˉ1 minˉ1]. Placental SNAT activity was comparedbetween groups. Effect of leptin stimulation on placental SNAT activity was esti-mated using the 20- and 40-min time points on the leptin-incubated fragments.
2.2. Placental immunohistochemistry
Tissue sections were cut at 5-mm and 2 random sections from each placentawere analyzed. Antibodies were purchased from Santa Cruz Biotechnology Inc, SantaCruz, CA. Syncytiotrophoblast expression of leptin (sc-842), leptin receptor (sc-1832,long-form, ObR-b), SNAT isoforms 1 (sc-33441), 2 (sc-33444), and 4 (sc-33448) wasstudied using standard immunohistochemical techniques [32]. Tissue sections fromthe lean and obese groups were processed in parallel and handled identically interms of antibody exposure and processing times. Paraffin blocks were deparaffi-nized, rehydrated, and antigen retrieval was achieved by microwaving slidessubmersed in 0.01 M citrate buffer (pH 6.0). Endogenous peroxidase activity wasblocked with 1.5% hydrogen peroxideemethanol solution. Sections were rinsed andincubated in 10% blocking serum (leptin e goat serum; leptin receptor, SNAT 1,2,4 e
rabbit serum), then rinsed again and incubated overnight at 4 �C in primary antibody(primary antibody for leptin - rabbit; primary antibody for leptin receptor, SNAT1,2,4 e goat) at concentrations previously determined by titration studies (leptin1:250; leptin receptor 1:50; SNAT 1 1:300; SNAT 2,4 1:100). Concurrent negativecontrols were treated with nonimmune serum (leptin e nonimmune rabbit serum;leptin receptor, SNAT 1,2,4 e nonimmune goat serum). Sections were incubated inbiotinylated secondary antibody, rinsed, then incubated in avidin-biotin (VectorLabs, Burlingame CA) solution diluted in 1:333 Triton X-100. After rinsing with KPBSand 0.175 M sodium acetate, antigens were localized using 3,30-diaminobenzidinechromagen-nickel sulfate solution. After final rinsing, sections were counterstained,dehydrated and mounted. One examiner (blinded to the source of tissue) recordedimages using light microscopy. Twelve pictures were taken (20�) of each slide witheach image having >50% of the high-power field containing terminal villi. Quanti-fication was performed using the Image J program (NIH) to estimate percent areastained (fraction ¼ area of slide immunostained divided by total area of slide � 100(%)) and the density of staining (arbitrary units). The ObR-b (leptin receptor) waspresent in both syncytiotrophoblast (threshold 100) and villous stroma (threshold170), so the difference in fraction and density staining between the syncytio-trophoblast and villous stroma was used to estimate leptin receptor staining in thesyncytiotrophoblast.
2.3. Maternal and fetal plasma analyses
Maternal fasting plasma insulin levels were determined using the Coat-A-Count125I solid-phase radioimmunoassay (Siemens, TKIN1) and the intra-assay coefficientof variation was <1%. Leptin was measured in the maternal and fetal venous plasmaby sandwich ELISA (R&D systems, SLP00). All samples were analyzed in the sameassay. Intra-assay coefficient of variation was 5.5% for umbilical cord and 10.9% formaternal samples.
2.4. Statistical analysis
Differences between the two groups were analyzed with Student’s unpaired ttest. The ManneWhitney U test was used to compare levels of leptin and insulin asthese were not normally distributed and these data are reported as median (inter-quartile range). Linear regression was used to analyze the placental SNAT activity.Analysis of variance was used to compare the slopes of the regression line betweenthe lean and obese groups. Correlation analysis among the entire study group wasperformed with linear regression and Pearson’s coefficient. Data are presented asmean � SEM, lean data first, and statistical significance was set at p � 0.05.
3. Results
3.1. Demographic data
Maternal, neonatal, and placental characteristics are presentedin Table 1. There were no differences between the two groupsexcept for entry and delivery BMI; maternal weight gain duringpregnancy was not different. One lean subject was non-Hispanicwhite and the remainder of the study population was Hispanic.There were no smokers in either group. Results of the 1-hourglucose screen and maternal blood pressure at delivery betweenthe 2 groups were not different (Table 1). Overall neonatal birthweights were average for gestational age and similar betweengroups and the ponderal index was the same in each group (Table1). Umbilical arterial cord pH measurements (7.2 � 0.1 vs. 7.2 � 0.1,p ¼ 0.90) and neonatal APGAR scores at 1 min (lean 9, obese 8) and5 min (lean 9, obese 9) were not different. Other neonatal bio-graphical parameters and placental morphometric measurementswere not different between groups (Table 1).
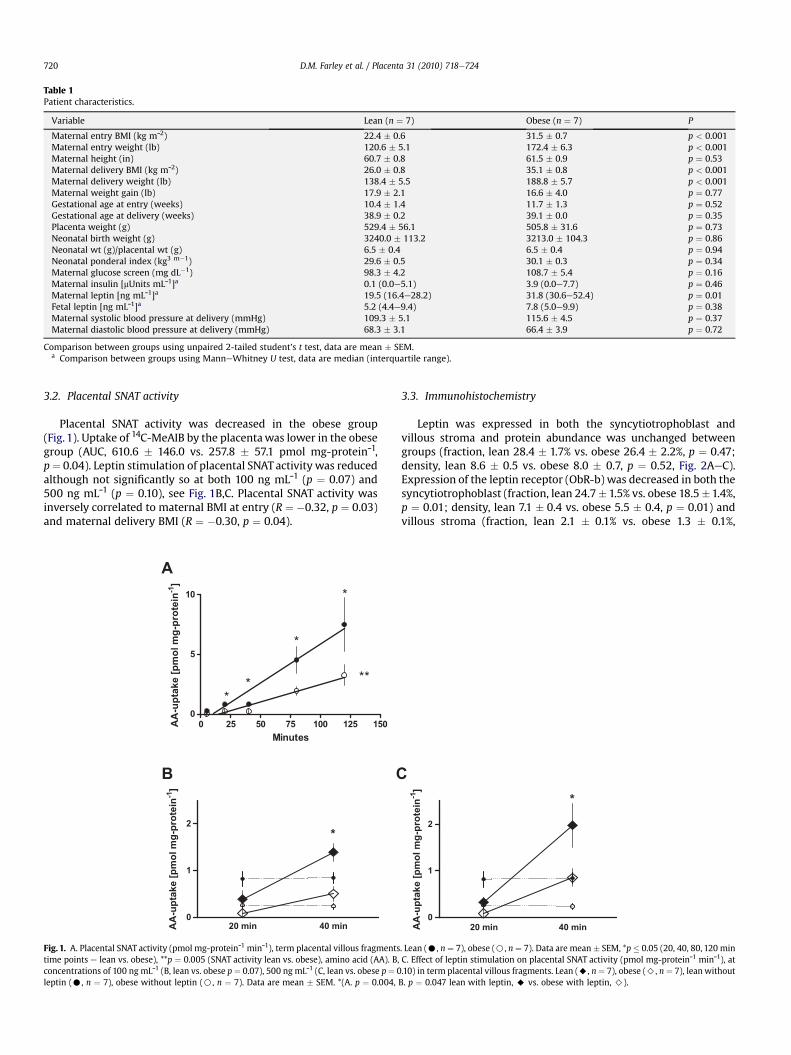
Table 1Patient characteristics.
Variable Lean (n ¼ 7) Obese (n ¼ 7) P
Maternal entry BMI (kg mˉ2) 22.4 � 0.6 31.5 � 0.7 p < 0.001Maternal entry weight (lb) 120.6 � 5.1 172.4 � 6.3 p < 0.001Maternal height (in) 60.7 � 0.8 61.5 � 0.9 p ¼ 0.53Maternal delivery BMI (kg mˉ2) 26.0 � 0.8 35.1 � 0.8 p < 0.001Maternal delivery weight (lb) 138.4 � 5.5 188.8 � 5.7 p < 0.001Maternal weight gain (lb) 17.9 � 2.1 16.6 � 4.0 p ¼ 0.77Gestational age at entry (weeks) 10.4 � 1.4 11.7 � 1.3 p ¼ 0.52Gestational age at delivery (weeks) 38.9 � 0.2 39.1 � 0.0 p ¼ 0.35Placenta weight (g) 529.4 � 56.1 505.8 � 31.6 p ¼ 0.73Neonatal birth weight (g) 3240.0 � 113.2 3213.0 � 104.3 p ¼ 0.86Neonatal wt (g)/placental wt (g) 6.5 � 0.4 6.5 � 0.4 p ¼ 0.94Neonatal ponderal index (kg3 m�1) 29.6 � 0.5 30.1 � 0.3 p ¼ 0.34Maternal glucose screen (mg dL�1) 98.3 � 4.2 108.7 � 5.4 p ¼ 0.16Maternal insulin [mUnits mLˉ1]a 0.1 (0.0e5.1) 3.9 (0.0e7.7) p ¼ 0.46Maternal leptin [ng mLˉ1]a 19.5 (16.4e28.2) 31.8 (30.6e52.4) p ¼ 0.01Fetal leptin [ng mLˉ1]a 5.2 (4.4e9.4) 7.8 (5.0e9.9) p ¼ 0.38Maternal systolic blood pressure at delivery (mmHg) 109.3 � 5.1 115.6 � 4.5 p ¼ 0.37Maternal diastolic blood pressure at delivery (mmHg) 68.3 � 3.1 66.4 � 3.9 p ¼ 0.72
Comparison between groups using unpaired 2-tailed student’s t test, data are mean � SEM.a Comparison between groups using ManneWhitney U test, data are median (interquartile range).
D.M. Farley et al. / Placenta 31 (2010) 718e724720
3.2. Placental SNAT activity
Placental SNAT activity was decreased in the obese group(Fig. 1). Uptake of 14C-MeAIB by the placentawas lower in the obesegroup (AUC, 610.6 � 146.0 vs. 257.8 � 57.1 pmol mg-proteinˉ1,p¼ 0.04). Leptin stimulation of placental SNAT activity was reducedalthough not significantly so at both 100 ng mLˉ1 (p ¼ 0.07) and500 ng mLˉ1 (p ¼ 0.10), see Fig. 1B,C. Placental SNAT activity wasinversely correlated to maternal BMI at entry (R ¼ �0.32, p ¼ 0.03)and maternal delivery BMI (R ¼ �0.30, p ¼ 0.04).
A
0 25 50 75 100 125 150
0
5
10 *
*
**
**
Minutes
AA
-u
pta
ke
[p
mo
l m
g-p
ro
te
in
-1]
20 min 40 min
0
1
2
B
*
AA
-u
ptake [p
mo
l m
g-p
ro
tein
-1]
C
Fig. 1. A. Placental SNAT activity (pmol mg-proteinˉ1 minˉ1), term placental villous fragmentstime points e lean vs. obese), **p ¼ 0.005 (SNAT activity lean vs. obese), amino acid (AA). B,concentrations of 100 ng mLˉ1 (B, lean vs. obese p¼ 0.07), 500 ng mLˉ1 (C, lean vs. obese p¼ 0leptin (C, n ¼ 7), obese without leptin (B, n ¼ 7). Data are mean � SEM. *(A. p ¼ 0.004,
3.3. Immunohistochemistry
Leptin was expressed in both the syncytiotrophoblast andvillous stroma and protein abundance was unchanged betweengroups (fraction, lean 28.4 � 1.7% vs. obese 26.4 � 2.2%, p ¼ 0.47;density, lean 8.6 � 0.5 vs. obese 8.0 � 0.7, p ¼ 0.52, Fig. 2AeC).Expression of the leptin receptor (ObR-b) was decreased in both thesyncytiotrophoblast (fraction, lean 24.7� 1.5% vs. obese 18.5�1.4%,p ¼ 0.01; density, lean 7.1 � 0.4 vs. obese 5.5 � 0.4, p ¼ 0.01) andvillous stroma (fraction, lean 2.1 � 0.1% vs. obese 1.3 � 0.1%,
20 min 40 min
0
1
2
*
AA
-u
pta
ke
[p
mo
l m
g-p
ro
te
in
-1]
. Lean (C, n ¼ 7), obese (B, n ¼ 7). Data are mean � SEM, *p � 0.05 (20, 40, 80, 120 minC. Effect of leptin stimulation on placental SNAT activity (pmol mg-proteinˉ1 minˉ1), at.10) in term placental villous fragments. Lean (A, n ¼ 7), obese (>, n ¼ 7), lean withoutB. p ¼ 0.047 lean with leptin, A vs. obese with leptin, >).
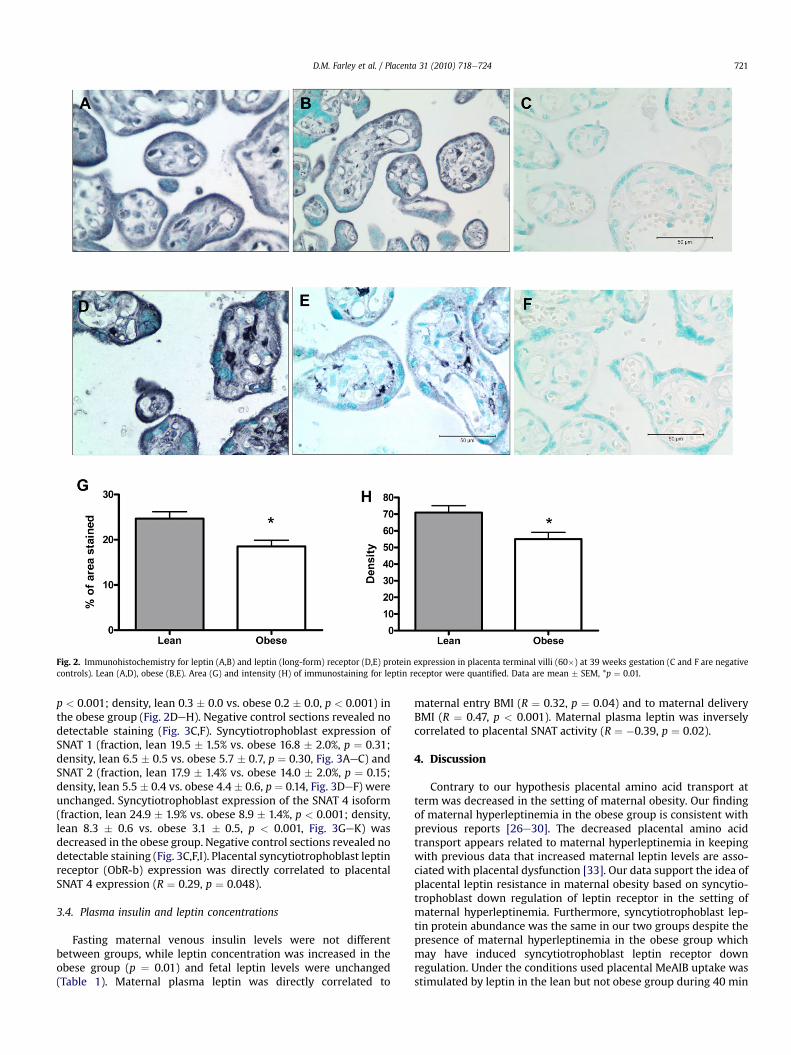
Fig. 2. Immunohistochemistry for leptin (A,B) and leptin (long-form) receptor (D,E) protein expression in placenta terminal villi (60�) at 39 weeks gestation (C and F are negativecontrols). Lean (A,D), obese (B,E). Area (G) and intensity (H) of immunostaining for leptin receptor were quantified. Data are mean � SEM, *p ¼ 0.01.
D.M. Farley et al. / Placenta 31 (2010) 718e724 721
p < 0.001; density, lean 0.3 � 0.0 vs. obese 0.2 � 0.0, p < 0.001) inthe obese group (Fig. 2DeH). Negative control sections revealed nodetectable staining (Fig. 3C,F). Syncytiotrophoblast expression ofSNAT 1 (fraction, lean 19.5 � 1.5% vs. obese 16.8 � 2.0%, p ¼ 0.31;density, lean 6.5 � 0.5 vs. obese 5.7 � 0.7, p ¼ 0.30, Fig. 3AeC) andSNAT 2 (fraction, lean 17.9 � 1.4% vs. obese 14.0 � 2.0%, p ¼ 0.15;density, lean 5.5 � 0.4 vs. obese 4.4 � 0.6, p ¼ 0.14, Fig. 3DeF) wereunchanged. Syncytiotrophoblast expression of the SNAT 4 isoform(fraction, lean 24.9 � 1.9% vs. obese 8.9 � 1.4%, p < 0.001; density,lean 8.3 � 0.6 vs. obese 3.1 � 0.5, p < 0.001, Fig. 3GeK) wasdecreased in the obese group. Negative control sections revealed nodetectable staining (Fig. 3C,F,I). Placental syncytiotrophoblast leptinreceptor (ObR-b) expression was directly correlated to placentalSNAT 4 expression (R ¼ 0.29, p ¼ 0.048).
3.4. Plasma insulin and leptin concentrations
Fasting maternal venous insulin levels were not differentbetween groups, while leptin concentration was increased in theobese group (p ¼ 0.01) and fetal leptin levels were unchanged(Table 1). Maternal plasma leptin was directly correlated to
maternal entry BMI (R ¼ 0.32, p ¼ 0.04) and to maternal deliveryBMI (R ¼ 0.47, p < 0.001). Maternal plasma leptin was inverselycorrelated to placental SNAT activity (R ¼ �0.39, p ¼ 0.02).
4. Discussion
Contrary to our hypothesis placental amino acid transport atterm was decreased in the setting of maternal obesity. Our findingof maternal hyperleptinemia in the obese group is consistent withprevious reports [26e30]. The decreased placental amino acidtransport appears related to maternal hyperleptinemia in keepingwith previous data that increased maternal leptin levels are asso-ciated with placental dysfunction [33]. Our data support the idea ofplacental leptin resistance in maternal obesity based on syncytio-trophoblast down regulation of leptin receptor in the setting ofmaternal hyperleptinemia. Furthermore, syncytiotrophoblast lep-tin protein abundance was the same in our two groups despite thepresence of maternal hyperleptinemia in the obese group whichmay have induced syncytiotrophoblast leptin receptor downregulation. Under the conditions used placental MeAIB uptake wasstimulated by leptin in the lean but not obese group during 40 min
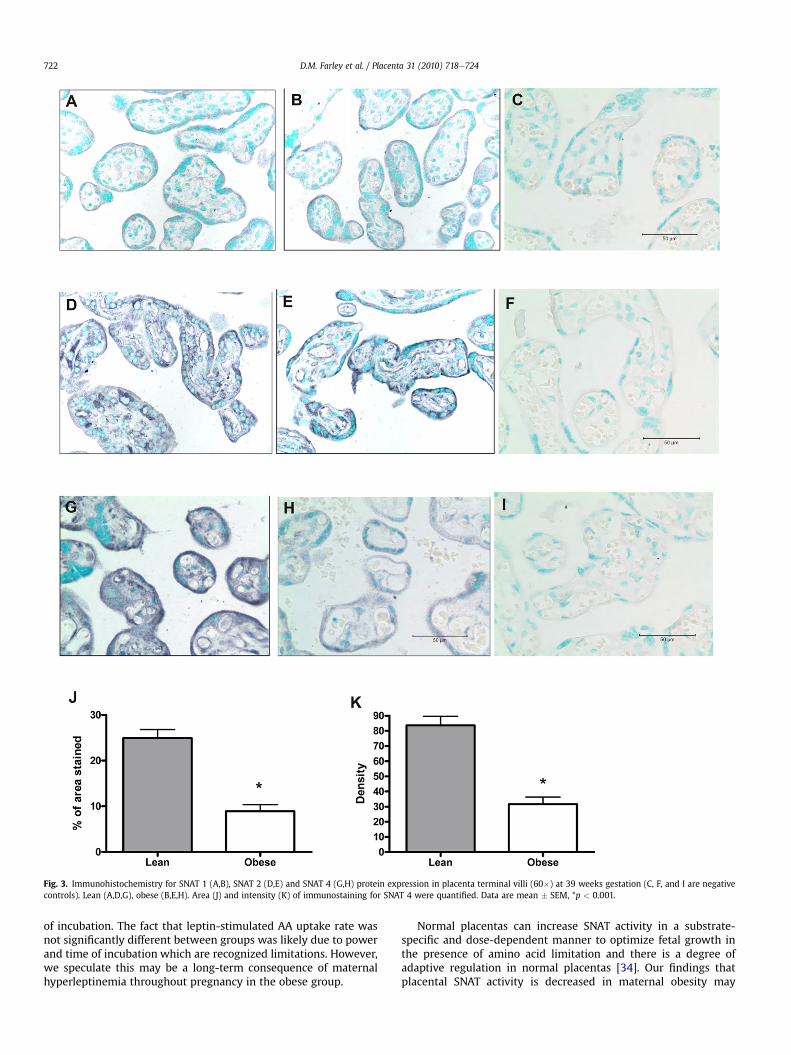
Fig. 3. Immunohistochemistry for SNAT 1 (A,B), SNAT 2 (D,E) and SNAT 4 (G,H) protein expression in placenta terminal villi (60�) at 39 weeks gestation (C, F, and I are negativecontrols). Lean (A,D,G), obese (B,E,H). Area (J) and intensity (K) of immunostaining for SNAT 4 were quantified. Data are mean � SEM, *p < 0.001.
D.M. Farley et al. / Placenta 31 (2010) 718e724722
of incubation. The fact that leptin-stimulated AA uptake rate wasnot significantly different between groups was likely due to powerand time of incubation which are recognized limitations. However,we speculate this may be a long-term consequence of maternalhyperleptinemia throughout pregnancy in the obese group.
Normal placentas can increase SNAT activity in a substrate-specific and dose-dependent manner to optimize fetal growth inthe presence of amino acid limitation and there is a degree ofadaptive regulation in normal placentas [34]. Our findings thatplacental SNAT activity is decreased in maternal obesity may
D.M. Farley et al. / Placenta 31 (2010) 718e724 723
represent a placental adaptive regulation. However, the obesegroup gained the recommended amount of weight and we feel thiscontributed to the appropriately grown neonates. A limitation ofour study is that we do not have maternal serum amino acidconcentrations, which if decreased compared to the lean groupwhen gaining the recommended amount of weight, may supportour belief that decreased SNAT activity represents a degree ofplacental dysfunction, not adaptive regulation. We feel that thedecrease in SNAT 4 expression is evidence that this isoform is likelyto contribute most to the decrease in overall SNAT activity betweenthese 2 groups as SNAT 1 and 2 expression were not different. Thecontribution of SNAT 4 to placental system A amino acid transporthas been shown to be less at term [19], a time when it has beenspeculated that SNAT 1 and 2 may contribute more. However, SNAT4 expression has been shown to be increased at term, whereasSNAT 1 and 2 expression was unchanged [35]. To determine whatisoform contributes most to the decrease in system A activity thatwe found in maternal obesity is an area of future research.
The SNAT4 isoform is amajor component of the placental systemA amino acid transporter [19] and the decrease in this isoform in theabsence of changes in other SNAT isoformswould indicate that SNAT4 plays amajor role in decreased amino acid transport in the settingof maternal obesity and potentially in placental dysfunction.Notably, SNAT 4 is an imprinted gene susceptible to regulation bylevels of methylation [36]. Alterations in methylation may be onemechanism that explains the increased incidence of birth defectsassociated with maternal obesity [37e39].
Our goal was to enroll well defined lean and obese mothers atentry and delivery and exclude patients withmedical co-morbiditiesto increase the likelihood that the changeswe observed in amino acidtransportwere due tomaternal hyperleptinemia and placental leptinresistance. The plasma leptin levels in our lean groupwere consistentwith previous reports in pregnancy [26e30] as was the stimulatoryeffect of leptin on placental SNAT activity [20]. The lack of statisticalsignificance when measuring the effect of leptin on placental SNATactivity was likely secondary to power with respect to this variablesince it was not the primary outcome. However, placental SNATactivity was inversely correlated with maternal plasma leptinconcentration. This finding indicates that the decreased placentalamino acid transportwe found in the setting ofmaternal obesitymaybe related tomaternalhyperleptinemiaanddevelopmentofplacentalleptin resistance evidenced by leptin receptor down regulation inassociation with a decrease in SNAT 4 expression.
Neither group had overt insulin resistance evidenced by normalantenatal screening glucose challenge tests and maternal fastingplasma insulin levels in the normal range on the day of delivery[40]. The absence of fetal overgrowth in our obese group may beexplained as follows. Hyperleptinemia in the obese groupmay haveattenuated the tendency of maternal obesity to increase fetalgrowth in some way. Leptin correlates negatively with insulinsensitivity in pregnancy [41] so the possibility of hyperleptinemiaincreasing insulin sensitivity and attenuating fetal growth isunlikely [42]. We speculate that maternal hyperleptinemia impairsplacental amino acid transport. In addition, maternal weight gain inthe obese group was consistent with current recommendations[43], but maternal weight gain in the lean group was not. Gainingthe recommended amount of weight in the obese group may haveprevented excessive fetal growth. Furthermore, if gaining the rec-ommended amount of weight in the obese group prevents exces-sive fetal growth, then our finding of decreased placental aminoacid transport signifies altered placental function despite normalfetal growth. Further research is needed to determine whethergaining the recommended amount of weight prevents excess fetalgrowth and the clinical significance of decreased placental aminoacid transport in the setting of maternal obesity.
We conclude that maternal obesity and associated hyper-leptinemia appear to have a negative impact on placental aminoacid transport. Our data suggest a certain degree of alteredplacental function that may have clinical implications in obesepregnant women. Further studies on the overweight and morbidlyobese maternal populations are needed to determine if the nega-tive impact on placental amino acid transport seen in our study ispart of a continuum.
Acknowledgements
We are grateful to Dr. Jocelyn Glazier, Dr. Colin Sibley and RalfWimmer for their help with setting up the amino acid fragmentuptake method. A special thanks to Dr. Elly Xenakis for her intel-lectual input, and the labor and delivery staff at University Hospitalfor assistance in collecting specimens, Susan Carvajal for her helpwith the neonatal measurements, Greg Langone for histologyexpertise, Michelle Zavala for assistance with the ELISA technique,Phylis Eagen at the Texas Diabetes Institute, and the University ofTexas Health Science Center at San Antonio’s radiation safetylaboratory for use of their scintillation counter. This study wasapproved by University of Texas Health Science Center at SanAntonio’s IRB and the ID number is HSC20070723H. This study wassupported by HD 21350-17.
References
[1] Kim SY, Dietz PM, England L, Morrow B, Callaghan WM. Trends in pre-preg-nancy obesity in nine states, 1993e2003. Obesity (Silver Spring) 2007;15(4):986e93.
[2] Ogden CL, Carroll MD, Curtin LR, McDowell MA, Tabak CJ, Flegal KM. Preva-lence of overweight and obesity in the United States, 1999e2004. JAMA2006;295:1549e55.
[3] Artal R, Lockwood CJ, Brown HL. Weight gain recommendations in pregnancyand the obesity epidemic. Obstet Gynecol 2010;115(1):152e5.
[4] Wang Y, Beydoun MA. The obesity epidemic in the United Statesdgender,age, socioeconomic, racial/ethnic, and geographic characteristics: a systematicreview and meta-regression analysis. Epidemiol Rev 2007;29:6e28.
[5] Cnattingius S, Bergstrom R, Lipworth L, Kramer MS. Prepregnancy weight andthe risk of adverse pregnancy outcomes. N Engl J Med 1998;338:147e52.
[6] Leddy MA, Power ML, Schulkin J. The impact of obesity on maternal and fetalhealth. Rev Obstet Gynecol 2008;1(4):170e8.
[7] Villamor E, Cnattingius S. Interpregnancy weight change and risk of adversepregnancy outcomes: a population-based study. Lancet 2006;368:1164e70.
[8] Chu SY, Kim SY, Lau J, Schmid CH, Dietz PM, Callaghan WM, et al. Maternalobesity and risk of stillbirth: a metaanalysis. Am J Obstet Gynecol 2007;197(3):223e8.
[9] Crane JM, White J, Murphy P, Burrage L, Hutchens D. The effect of gestationalweight gain by body mass index on maternal and neonatal outcomes. J ObstetGynaecol Can 2009;31(1):28e35.
[10] Nohr EA, Vaeth M, Bech BH, Henriksen TB, Cnattingius S, Olsen J. Maternalobesity and neonatal mortality according to subtypes of preterm birth. ObstetGynecol 2007;110:1083e90.
[11] Kristensen J, Vestergaard M, Wisborg K, Kesmodel U, Secher NJ. Pre-preg-nancy weight and the risk of stillbirth and neonatal death. BJOG 2005;112(4):403e8.
[12] Bodnar LM, Catov JM, Klebanoff MA, Ness RB, Roberts JM. Prepregnancy bodymass index and the occurrence of severe hypertensive disorders of pregnancy.Epidemiology 2007;18(2):234e9.
[13] Bhattacharya S, Campbell DM, Liston WA, Bhattacharya S. Effect of Body MassIndex on pregnancy outcomes in nulliparous women delivering singletonbabies. BMC Public Health 2007;7:168.
[14] Roos S, Powell TL, Jansson T. Human placental taurine transporter in uncom-plicated and IUGR pregnancies: cellular localization, protein expression, andregulation. Am J Physiol Regul Integr Comp Physiol 2004;287(4):R886e93.
[15] Jansson T. Amino acid transporters in the human placenta. Pediatr Res2001;49(2):141e7.
[16] Kuruvilla AG, D’Souza SW, Glazier JD, Mahendran D, Maresh MJ, Sibley CP.Altered activity of the system A amino acid transporter in microvillousmembrane vesicles from placentas of macrosomic babies born to diabeticwomen. J Clin Invest 1994;94(2):689e95.
[17] Greenwood SL, Sibley CP. In vitro methods for studying human placentalamino acid transport placental villous fragments. Methods Mol Med2006;122:253e64.
[18] Jones HN, Powell TL, Jansson T. Regulation of placental nutrient transporteareview. Placenta 2007;28(8e9):763e74.
D.M. Farley et al. / Placenta 31 (2010) 718e724724
[19] Desforges M, Mynett KJ, Jones RL, Greenwood SL, Westwood M, Sibley CP,et al. The SNAT4 isoform of the system A amino acid transporter is functionalin human placental microvillous plasma membrane. J Phys2009;587.1:61e72.
[20] Jansson N, Greenwood SL, Johansson BR, Powell TL, Jansson T. Leptin stimu-lates the activity of the system A amino acid transporter in human placentalvillous fragments. J Clin Endocrinol Metab 2003;88(3):1205e11.
[21] Glazier JD, Cetin I, Perugino G, Ronzoni S, Grey AM, Mahendran D, et al.Association between the activity of the system A amino acid transporter in themicrovillous plasma membrane of the human placenta and severity of fetalcompromise in intrauterine growth restriction. Pediatr Res 1997;42(4):514e9.
[22] Havel PJ, Kasim-Karakas S, Mueller W, Johnson PR, Gingerich RL, Stern JS.Relationship of plasma leptin to plasma insulin and adiposity in normalweight and overweight women: effects of dietary fat content and sustainedweight loss. J Clin Endocrinol Metab 1996;81(12):4406e13.
[23] Ogier V, Ziegler O, Mejean L, Nicolas JP, Stricker-Krongrad A. Obesity isassociated with decreasing levels of the circulating soluble leptin receptor inhumans. Int J Obes Relat Metab Disord 2002;26(4):496e503.
[24] Van Dielen FM, van’t Veer C, Buurman WA, Greve JW. Leptin and solubleleptin receptor levels in obese and weight-losing individuals. J Clin EndocrinolMetab 2002;87(4):1708e16.
[25] Vendrell J, Broch M, Vilarrasa N, Molina A, Gomez JM, Gutierrrez C, et al.Resistin, adiponectin, ghrelin, leptin, and proinflammatory cytokines: rela-tionships in obesity. Obes Res 2004;12(6):962e71.
[26] Masuzaki H, Ogawa Y, Sagawa N, Hosoda K, Matsumoto T, Mise H, et al.Nonadipose tissue production of leptin: leptin as a novel placenta-derivedhormone in humans. Nat Med 1997;3(9):1029e33.
[27] Sattar N, Greer IA, Pirwani I, Gibson J, Wallace AM. Leptin levels in pregnancy:marker for fat accumulation and mobilization? Acta Obstet Gynecol Scand1998;77(3):278e83.
[28] Hauguel-de Mouzon S, Lepercq J, Catalano P. The known and unknown ofleptin in pregnancy. Am J Obstet Gynecol 2006;194:1537e45.
[29] Highman T, Friedman J, Huston L, Wong W, Catalano P. Longitudinal changesin maternal leptin serum concentrations, body composition and restingmetabolic rate in pregnancy. Am J Obstet Gynecol 1998;178:1010e5.
[30] Schubring C, Kiess W, Englaro P, Rascher W, Dotsch J, Hanitsch S, et al. Levelsof leptin in maternal serum, amniotic fluid, and arterial and venous cord
blood: relation to neonatal and placental weight. J Clin Endocrinol Metab1997;82(5):1480e3.
[31] Borecki IB, Higgins M, Schreiner PJ, Arnett DK, Mayer-Davis E, Hunt SC, et al.Evidence for multiple determinants of the body mass index: the NationalHeart, Lung, and Blood Institute Family Heart Study. Obes Res 1998;6(2):107e14.
[32] Li C, Levitz M, Hubbard GB, Jenkins SL, Han V, Ferry Jr RJ, et al. The IGF axis inbaboon pregnancy: placental and systemic responses to feeding 70% global Adlibitum diet. Placenta 2007;28(11e12):1200e10.
[33] Lepercq J, Guerre-Millo M, Andre J, Cauzac M, Hauguel-de Mouzon S. Leptin:a potential marker of placental insufficiency. Gynecol Obstet Invest 2003;55(3):151e5.
[34] Parrott MS, Versen-Hoeynck Fv, Ness RB, Markovik N, Roberts J. System Aamino acid transporter activity in term placenta is substrate specific andinversely related to amino acid concentration. Reprod Sci 2007;14(7):687e93.
[35] Desforges M, Lacey HA, Glazier JD, Greenwood SL, Mynett KJ, Speake PF, et al.SNAT4 isoform of system A amino acid transporter is expressed in humanplacenta. Am J Physiol Cell Physiol 2006;290:305e12.
[36] Smith RJ, Dean W, Konfortova G, Kelsey G. Identification of novel imprintedgenes in a genome-wide screen for maternal methylation. Genome Res2003;13:558e69.
[37] Waller DK, Shaw GM, Rasmussen SA, Hobbs CA, Canfield MA, Siega-Riz AM,et al. Prepregnancy obesity as a risk factor for structural birth defects. ArchPediatr Adolesc Med 2007;161(8):745e50.
[38] Koleganova N, Piecha G, Ritz E. Prenatal causes of kidney disease. Blood Purif2009;27(1):48e52.
[39] Henriksen T, Haugen G, Bollerslev J, Kolset SO, Drevon CA, Iverson PO, et al.Fetal nutrition and future health. Tidsskr Nor Laegeforen 2005;125(4):442e4.
[40] Laakso M. How good a marker is insulin level for insulin resistance? Am JEpidemiol 1993;137(9):959e65.
[41] McIntyre HD, Chang AM, Callaway LK, Cowley DM, Dyer AR, Radaelli T, et al.Hormonal and metabolic factors associated with variations in insulin sensi-tivity in human pregnancy. Diabetes Care 2010;33:356e60.
[42] Sagawa N, Yura S, Itoh H, Mise H, Kakui K, Korita D, et al. Role of leptin inpregnancy e a review. Placenta 2002;23(Suppl. A16):S80e6.
[43] Rasmussen KM, Yaktine AL, editors. Weight gain during pregnancy: reex-amining the recommendations. Washington, DC: The National AcademiesPress; May 2009. Report brief.