piper jaffray on ignite restaurants
TRANSCRIPT
C O M P A N Y N O T E
A u g u s t 1 4 , 2 0 1 4
Ignite Restaurant Group (IRG) Neutral Rebalancing Act: Downgrading IRG Shares To Neutral
PRICE: US$8.13 Note: Price as of the close August 14,2014.
TARGET: US$8.00 ~9x FY15E ev/EBITDA of $39M (net debt$125M and 26M s/o)
Nicole Miller ReganSr Research Analyst, Piper Jaffray & Co.612 303-6637, [email protected]
Joshua C. Long, CFAResearch Analyst, Piper Jaffray & Co.612 303-6928, [email protected]
Changes Previous CurrentRating Overweight NeutralPrice Tgt US$14.00 US$8.00FY14E Rev (mil) — US$845.3FY15E Rev (mil) US$879.5 US$856.3FY14E EPS US$(0.17) US$(0.18)FY15E EPS US$0.26 US$(0.14)
52-Week High / Low US$17.50 / US$7.60Shares Out (mil) 25.7Market Cap. (mil) US$208.9Avg Daily Vol (000) 89Book Value/Share US$4.06Net Cash Per Share NADebt to Total Capital 55%Div (ann) NAFiscal Year End Dec
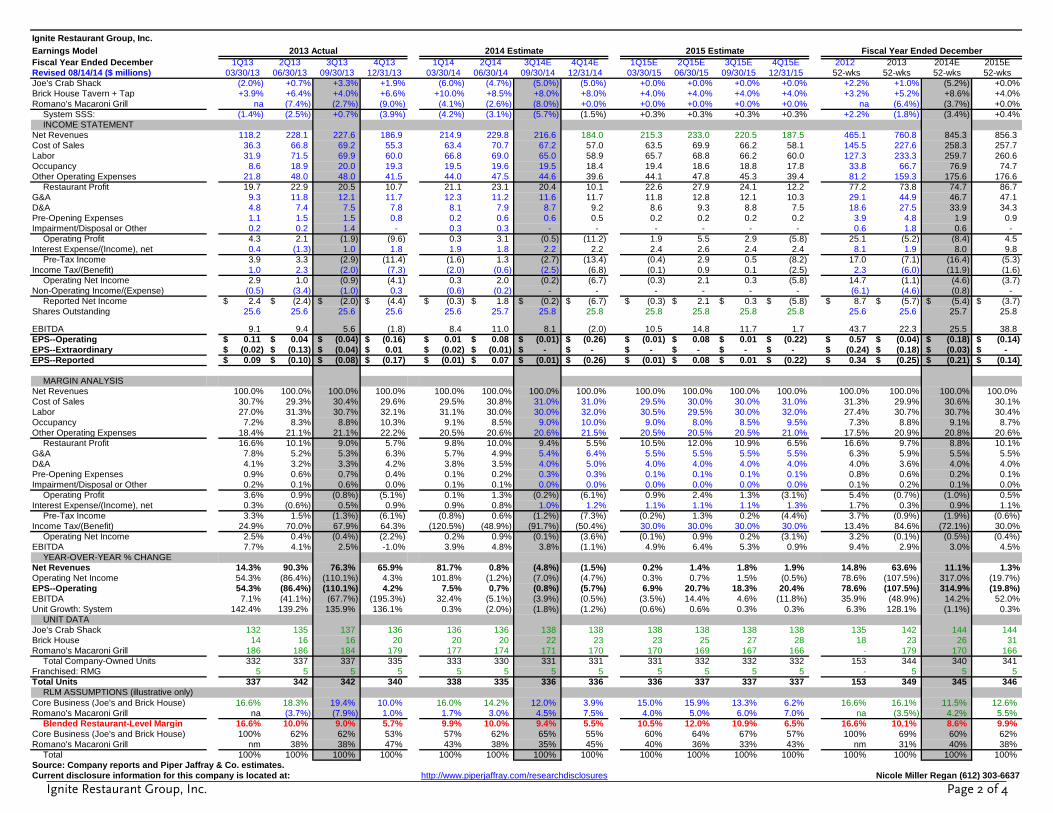
Price Performance - 1 Year
Aug-13 Oct-13 Dec-13 Feb-14 Apr-14 Jun-14 Aug-14
18
16
14
12
10
8
6
USD
Source: Bloomberg
CONCLUSIONWe continue to view the restaurant industry as investable, but are revisiting our thesis onsome of our covered companies today in an effort to re-align and rebalance expectations.Specific to IRG shares, we are downgrading our rating to Neutral from Overweightand lowering our target to $8 from $14. While we remain encouraged by the long-termgrowth profile of the company's entire portfolio, we are discouraged by the softness inthe core Joe's Crab Shack business. This, along with inherent uncertainties in timingrelated to the ongoing Macaroni Grill turnaround, delays our expectation for consistentfinancial performance. Albeit positive, the Brick House comp performance is not enoughto overcome our more muted expectations at the larger Joe's brand and specifically asit relates to operating margin recovery of the consolidated Ignite system. Our targetremains based on ~9x FY15E EV/EBITDA.• Rebalancing Act: We continue to view the restaurant industry as investable but
are revisiting our thesis on some of our covered companies in an effort to re-alignand rebalance expectations given the disparity of 2Q14 results and ensuing stockreactions. Specific to IRG, we are downgrading our rating to Neutral from OW andlowering our PT to $8 from $14. While we remain encouraged by the long-termgrowth profile of IRG's entire portfolio, we are discouraged by the softness in the coreJoe's Crab Shack business as surprisingly announced late last week. This, along withinherent uncertainties in timing related to the ongoing Macaroni Grill turnaround,delays our expectation for consistent financial performance. Albeit positive, the BrickHouse comp performance is not enough to overcome our more muted expectations,specifically as it relates to operating mgn recovery of the broader restaurant portfolio.
• Lowering forward estimates: We are largely maintaining our FY14 estimate, now apenny lower due to increased interest expense. We are lowering our FY15 EPS estto ($0.14) vs. $0.26 prior. Our FY15 ests reflect more muted top line assumptions,with our system-wide comp of +0.4% as compared to +2.1% prior. Changes toour FY15 bottom-line ests largely reflect a 0.5% operating margin vs. 1.9% prior asthe recent softness at Joe's paired with the inherent uncertainties of timing in theMacaroni Grill turnaround leave us with limited visibility into a path to consistentfinancial performance. Our model also reflects the interest associated with the newcredit facility, as announced yesterday.
• Restaurant industry remains investable: While we thematically believe the broaderrestaurant space remains relevant and “investable” during the remainder of thisfavorable cycle, we hold no expectation that all operators (and therefore stocks) withinthe industry should benefit equally. Specific to IRG shares, we note that sitting on thesidelines now could lead to meaningful missed upside should a recovery of both Joe'sCrab Shack and Macaroni Grill play out sooner than we currently expect.
RISKS TO ACHIEVEMENT OF PRICE TARGETRisks include regional concentrations, crab commodity concentration at JCS, alcoholsales concentration at BHTT and the inherent risks of recently acquiring RMG.
COMPANY DESCRIPTIONIgnite Restaurant Group, Inc. is the owner of a portfolio of casual-dining concepts,including Joe's Crab Shack, Brick House Tavern+Tap, and Romano's Macaroni Grill.
YEAR
2013A
2014E
2015E
REVENUE (US$ m)
Mar Jun Sep Dec FY FY RM
118.2 228.1 227.6 186.9 760.8 0.3x
214.9A 229.8A 216.6 184.0 845.3 0.2x
215.3 233.0 220.5 187.5 856.3 0.2x
EARNINGS PER SHARE (US$)
Mar Jun Sep Dec FY FY P/E
0.11 0.04 (0.04) (0.16) (0.04) NM
0.01A 0.08A (0.01) (0.26) (0.18) NM
(0.01) 0.08 0.01 (0.22) (0.14) NM
Page 1 of 4Ignite Restaurant Group, Inc.
Piper Jaffray does and seeks to do business with companies covered in its research reports. As a result, investors should be awarethat the firm may have a conflict of interest that could affect the objectivity of this report. Investors should consider this report asonly a single factor in making their investment decisions. This report should be read in conjunction with important disclosureinformation, including an attestation under Regulation Analyst certification, found on pages 3 - 4 of this report or at the followingsite: http://www.piperjaffray.com/researchdisclosures.
Ignite Restaurant Group, Inc.
Earnings Model 2013 Actual 2014 Estimate 2015 Estimate Fiscal Year Ended December
Fiscal Year Ended December 1Q13 2Q13 3Q13 4Q13 1Q14 2Q14 3Q14E 4Q14E 1Q15E 2Q15E 3Q15E 4Q15E 2012 2013 2014E 2015E
Revised 08/14/14 ($ millions) 03/30/13 06/30/13 09/30/13 12/31/13 03/30/14 06/30/14 09/30/14 12/31/14 03/30/15 06/30/15 09/30/15 12/31/15 52-wks 52-wks 52-wks 52-wks
Joe's Crab Shack (2.0%) +0.7% +3.3% +1.9% (6.0%) (4.7%) (5.0%) (5.0%) +0.0% +0.0% +0.0% +0.0% +2.2% +1.0% (5.2%) +0.0%
Brick House Tavern + Tap +3.9% +6.4% +4.0% +6.6% +10.0% +8.5% +8.0% +8.0% +4.0% +4.0% +4.0% +4.0% +3.2% +5.2% +8.6% +4.0%
Romano's Macaroni Grill na (7.4%) (2.7%) (9.0%) (4.1%) (2.6%) (8.0%) +0.0% +0.0% +0.0% +0.0% +0.0% na (6.4%) (3.7%) +0.0%
System SSS: (1.4%) (2.5%) +0.7% (3.9%) (4.2%) (3.1%) (5.7%) (1.5%) +0.3% +0.3% +0.3% +0.3% +2.2% (1.8%) (3.4%) +0.4%
INCOME STATEMENT
Net Revenues 118.2 228.1 227.6 186.9 214.9 229.8 216.6 184.0 215.3 233.0 220.5 187.5 465.1 760.8 845.3 856.3
Cost of Sales 36.3 66.8 69.2 55.3 63.4 70.7 67.2 57.0 63.5 69.9 66.2 58.1 145.5 227.6 258.3 257.7
Labor 31.9 71.5 69.9 60.0 66.8 69.0 65.0 58.9 65.7 68.8 66.2 60.0 127.3 233.3 259.7 260.6
Occupancy 8.6 18.9 20.0 19.3 19.5 19.6 19.5 18.4 19.4 18.6 18.8 17.8 33.8 66.7 76.9 74.7
Other Operating Expenses 21.8 48.0 48.0 41.5 44.0 47.5 44.6 39.6 44.1 47.8 45.3 39.4 81.2 159.3 175.6 176.6
Restaurant Profit 19.7 22.9 20.5 10.7 21.1 23.1 20.4 10.1 22.6 27.9 24.1 12.2 77.2 73.8 74.7 86.7
G&A 9.3 11.8 12.1 11.7 12.3 11.2 11.6 11.7 11.8 12.8 12.1 10.3 29.1 44.9 46.7 47.1
D&A 4.8 7.4 7.5 7.8 8.1 7.9 8.7 9.2 8.6 9.3 8.8 7.5 18.6 27.5 33.9 34.3
Pre-Opening Expenses 1.1 1.5 1.5 0.8 0.2 0.6 0.6 0.5 0.2 0.2 0.2 0.2 3.9 4.8 1.9 0.9
Impairment/Disposal or Other 0.2 0.2 1.4 - 0.3 0.3 - - - - - - 0.6 1.8 0.6 -
Operating Profit 4.3 2.1 (1.9) (9.6) 0.3 3.1 (0.5) (11.2) 1.9 5.5 2.9 (5.8) 25.1 (5.2) (8.4) 4.5
Interest Expense/(Income), net 0.4 (1.3) 1.0 1.8 1.9 1.8 2.2 2.2 2.4 2.6 2.4 2.4 8.1 1.9 8.0 9.8
Pre-Tax Income 3.9 3.3 (2.9) (11.4) (1.6) 1.3 (2.7) (13.4) (0.4) 2.9 0.5 (8.2) 17.0 (7.1) (16.4) (5.3)
Income Tax/(Benefit) 1.0 2.3 (2.0) (7.3) (2.0) (0.6) (2.5) (6.8) (0.1) 0.9 0.1 (2.5) 2.3 (6.0) (11.9) (1.6)
Operating Net Income 2.9 1.0 (0.9) (4.1) 0.3 2.0 (0.2) (6.7) (0.3) 2.1 0.3 (5.8) 14.7 (1.1) (4.6) (3.7)
Non-Operating Income/(Expense) (0.5) (3.4) (1.0) 0.3 (0.6) (0.2) - - - - - - (6.1) (4.6) (0.8) -
Reported Net Income 2.4$ (2.4)$ (2.0)$ (4.4)$ (0.3)$ 1.8$ (0.2)$ (6.7)$ (0.3)$ 2.1$ 0.3$ (5.8)$ 8.7$ (5.7)$ (5.4)$ (3.7)$
Shares Outstanding 25.6 25.6 25.6 25.6 25.6 25.7 25.8 25.8 25.8 25.8 25.8 25.8 25.6 25.6 25.7 25.8
EBITDA 9.1 9.4 5.6 (1.8) 8.4 11.0 8.1 (2.0) 10.5 14.8 11.7 1.7 43.7 22.3 25.5 38.8
EPS--Operating 0.11$ 0.04$ (0.04)$ (0.16)$ 0.01$ 0.08$ (0.01)$ (0.26)$ (0.01)$ 0.08$ 0.01$ (0.22)$ 0.57$ (0.04)$ (0.18)$ (0.14)$
EPS--Extraordinary (0.02)$ (0.13)$ (0.04)$ 0.01$ (0.02)$ (0.01)$ -$ -$ -$ -$ -$ -$ (0.24)$ (0.18)$ (0.03)$ -$
EPS--Reported 0.09$ (0.10)$ (0.08)$ (0.17)$ (0.01)$ 0.07$ (0.01)$ (0.26)$ (0.01)$ 0.08$ 0.01$ (0.22)$ 0.34$ (0.25)$ (0.21)$ (0.14)$
MARGIN ANALYSIS
Net Revenues 100.0% 100.0% 100.0% 100.0% 100.0% 100.0% 100.0% 100.0% 100.0% 100.0% 100.0% 100.0% 100.0% 100.0% 100.0% 100.0%
Cost of Sales 30.7% 29.3% 30.4% 29.6% 29.5% 30.8% 31.0% 31.0% 29.5% 30.0% 30.0% 31.0% 31.3% 29.9% 30.6% 30.1%
Labor 27.0% 31.3% 30.7% 32.1% 31.1% 30.0% 30.0% 32.0% 30.5% 29.5% 30.0% 32.0% 27.4% 30.7% 30.7% 30.4%
Occupancy 7.2% 8.3% 8.8% 10.3% 9.1% 8.5% 9.0% 10.0% 9.0% 8.0% 8.5% 9.5% 7.3% 8.8% 9.1% 8.7%
Other Operating Expenses 18.4% 21.1% 21.1% 22.2% 20.5% 20.6% 20.6% 21.5% 20.5% 20.5% 20.5% 21.0% 17.5% 20.9% 20.8% 20.6%
Restaurant Profit 16.6% 10.1% 9.0% 5.7% 9.8% 10.0% 9.4% 5.5% 10.5% 12.0% 10.9% 6.5% 16.6% 9.7% 8.8% 10.1%
G&A 7.8% 5.2% 5.3% 6.3% 5.7% 4.9% 5.4% 6.4% 5.5% 5.5% 5.5% 5.5% 6.3% 5.9% 5.5% 5.5%
D&A 4.1% 3.2% 3.3% 4.2% 3.8% 3.5% 4.0% 5.0% 4.0% 4.0% 4.0% 4.0% 4.0% 3.6% 4.0% 4.0%
Pre-Opening Expenses 0.9% 0.6% 0.7% 0.4% 0.1% 0.2% 0.3% 0.3% 0.1% 0.1% 0.1% 0.1% 0.8% 0.6% 0.2% 0.1%
Impairment/Disposal or Other 0.2% 0.1% 0.6% 0.0% 0.1% 0.1% 0.0% 0.0% 0.0% 0.0% 0.0% 0.0% 0.1% 0.2% 0.1% 0.0%
Operating Profit 3.6% 0.9% (0.8%) (5.1%) 0.1% 1.3% (0.2%) (6.1%) 0.9% 2.4% 1.3% (3.1%) 5.4% (0.7%) (1.0%) 0.5%
Interest Expense/(Income), net 0.3% (0.6%) 0.5% 0.9% 0.9% 0.8% 1.0% 1.2% 1.1% 1.1% 1.1% 1.3% 1.7% 0.3% 0.9% 1.1%
Pre-Tax Income 3.3% 1.5% (1.3%) (6.1%) (0.8%) 0.6% (1.2%) (7.3%) (0.2%) 1.3% 0.2% (4.4%) 3.7% (0.9%) (1.9%) (0.6%)
Income Tax/(Benefit) 24.9% 70.0% 67.9% 64.3% (120.5%) (48.9%) (91.7%) (50.4%) 30.0% 30.0% 30.0% 30.0% 13.4% 84.6% (72.1%) 30.0%
Operating Net Income 2.5% 0.4% (0.4%) (2.2%) 0.2% 0.9% (0.1%) (3.6%) (0.1%) 0.9% 0.2% (3.1%) 3.2% (0.1%) (0.5%) (0.4%)
EBITDA 7.7% 4.1% 2.5% -1.0% 3.9% 4.8% 3.8% (1.1%) 4.9% 6.4% 5.3% 0.9% 9.4% 2.9% 3.0% 4.5%
YEAR-OVER-YEAR % CHANGE
Net Revenues 14.3% 90.3% 76.3% 65.9% 81.7% 0.8% (4.8%) (1.5%) 0.2% 1.4% 1.8% 1.9% 14.8% 63.6% 11.1% 1.3%
Operating Net Income 54.3% (86.4%) (110.1%) 4.3% 101.8% (1.2%) (7.0%) (4.7%) 0.3% 0.7% 1.5% (0.5%) 78.6% (107.5%) 317.0% (19.7%)
EPS--Operating 54.3% (86.4%) (110.1%) 4.2% 7.5% 0.7% (0.8%) (5.7%) 6.9% 20.7% 18.3% 20.4% 78.6% (107.5%) 314.9% (19.8%)
EBITDA 7.1% (41.1%) (67.7%) (195.3%) 32.4% (5.1%) (3.9%) (0.5%) (3.5%) 14.4% 4.6% (11.8%) 35.9% (48.9%) 14.2% 52.0%
Unit Growth: System 142.4% 139.2% 135.9% 136.1% 0.3% (2.0%) (1.8%) (1.2%) (0.6%) 0.6% 0.3% 0.3% 6.3% 128.1% (1.1%) 0.3%
UNIT DATA
Joe's Crab Shack 132 135 137 136 136 136 138 138 138 138 138 138 135 142 144 144
Brick House 14 16 16 20 20 20 22 23 23 25 27 28 18 23 26 31
Romano's Macaroni Grill 186 186 184 179 177 174 171 170 170 169 167 166 - 179 170 166
Total Company-Owned Units 332 337 337 335 333 330 331 331 331 332 332 332 153 344 340 341
Franchised: RMG 5 5 5 5 5 5 5 5 5 5 5 5 - 5 5 5
Total Units 337 342 342 340 338 335 336 336 336 337 337 337 153 349 345 346
RLM ASSUMPTIONS (illustrative only)
Core Business (Joe's and Brick House) 16.6% 18.3% 19.4% 10.0% 16.0% 14.2% 12.0% 3.9% 15.0% 15.9% 13.3% 6.2% 16.6% 16.1% 11.5% 12.6%
Romano's Macaroni Grill na (3.7%) (7.9%) 1.0% 1.7% 3.0% 4.5% 7.5% 4.0% 5.0% 6.0% 7.0% na (3.5%) 4.2% 5.5%
Blended Restaurant-Level Margin 16.6% 10.0% 9.0% 5.7% 9.9% 10.0% 9.4% 5.5% 10.5% 12.0% 10.9% 6.5% 16.6% 10.1% 8.6% 9.9%
Core Business (Joe's and Brick House) 100% 62% 62% 53% 57% 62% 65% 55% 60% 64% 67% 57% 100% 69% 60% 62%
Romano's Macaroni Grill nm 38% 38% 47% 43% 38% 35% 45% 40% 36% 33% 43% nm 31% 40% 38%
Total 100% 100% 100% 100% 100% 100% 100% 100% 100% 100% 100% 100% 100% 100% 100% 100%
Source: Company reports and Piper Jaffray & Co. estimates.
Current disclosure information for this company is located at: http://www.piperjaffray.com/researchdisclosures Nicole Miller Regan (612) 303-6637
Page 2 of 4Ignite Restaurant Group, Inc.
C O M P A N Y N O T E
A u g u s t 1 4 , 2 0 1 4
IMPORTANT RESEARCH DISCLOSURES
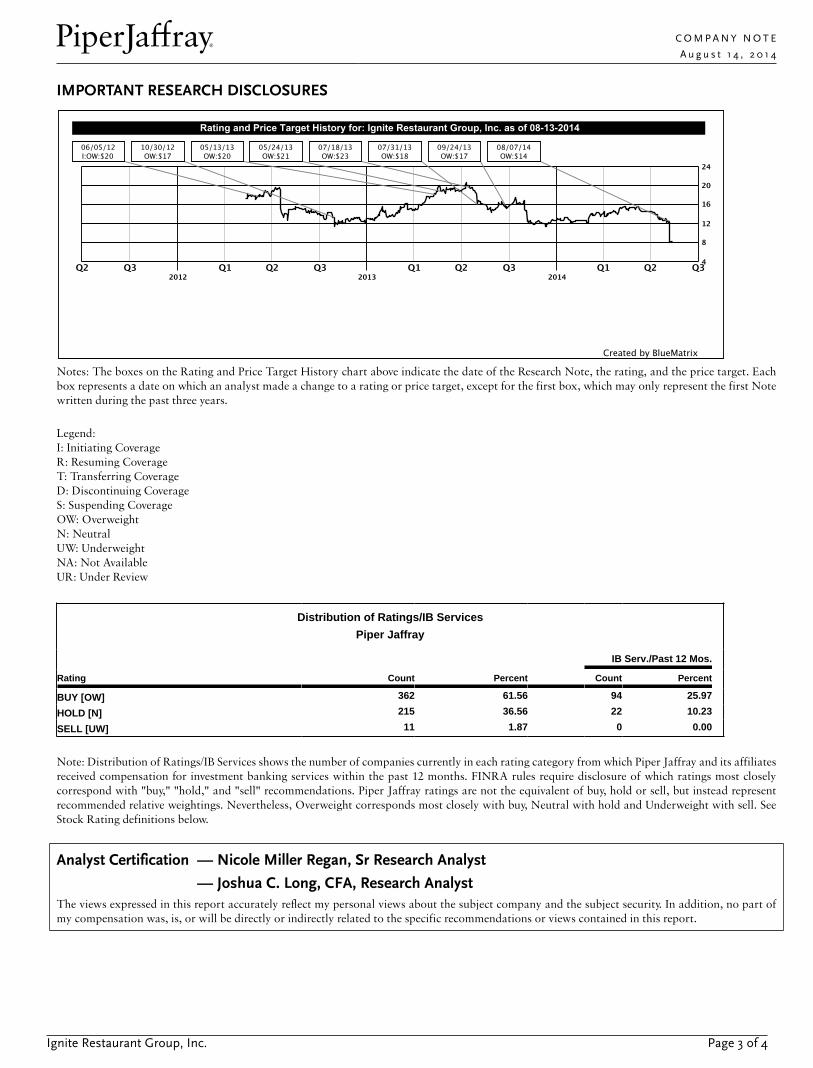
Notes: The boxes on the Rating and Price Target History chart above indicate the date of the Research Note, the rating, and the price target. Eachbox represents a date on which an analyst made a change to a rating or price target, except for the first box, which may only represent the first Notewritten during the past three years.
Legend:I: Initiating CoverageR: Resuming CoverageT: Transferring CoverageD: Discontinuing CoverageS: Suspending CoverageOW: OverweightN: NeutralUW: UnderweightNA: Not AvailableUR: Under Review
Distribution of Ratings/IB Services
Piper Jaffray
IB Serv./Past 12 Mos.
Rating Count Percent Count Percent
BUY [OW] 362 61.56 94 25.97
HOLD [N] 215 36.56 22 10.23
SELL [UW] 11 1.87 0 0.00
Note: Distribution of Ratings/IB Services shows the number of companies currently in each rating category from which Piper Jaffray and its affiliatesreceived compensation for investment banking services within the past 12 months. FINRA rules require disclosure of which ratings most closelycorrespond with "buy," "hold," and "sell" recommendations. Piper Jaffray ratings are not the equivalent of buy, hold or sell, but instead representrecommended relative weightings. Nevertheless, Overweight corresponds most closely with buy, Neutral with hold and Underweight with sell. SeeStock Rating definitions below.
Analyst Certification — Nicole Miller Regan, Sr Research Analyst
Analyst Certification — Joshua C. Long, CFA, Research AnalystThe views expressed in this report accurately reflect my personal views about the subject company and the subject security. In addition, no part ofmy compensation was, is, or will be directly or indirectly related to the specific recommendations or views contained in this report.
Page 3 of 4Ignite Restaurant Group, Inc.
C O M P A N Y N O T E
A u g u s t 1 4 , 2 0 1 4
Research DisclosuresPiper Jaffray was making a market in the securities of Ignite Restaurant Group, Inc. at the time this research report was published. Piper Jaffray willbuy and sell Ignite Restaurant Group, Inc. securities on a principal basis.
Within the past 3 years Piper Jaffray participated in a public offering of, or acted as a dealer manager for, Ignite Restaurant Group, Inc. securities.
Piper Jaffray research analysts receive compensation that is based, in part, on overall firm revenues, which include investment banking revenues.
Rating DefinitionsStock Ratings: Piper Jaffray ratings are indicators of expected total return (price appreciation plus dividend) within the next 12 months. At timesanalysts may specify a different investment horizon or may include additional investment time horizons for specific stocks. Stock performanceis measured relative to the group of stocks covered by each analyst. Lists of the stocks covered by each are available at www.piperjaffray.com/researchdisclosures. Stock ratings and/or stock coverage may be suspended from time to time in the event that there is no active analyst opinionor analyst coverage, but the opinion or coverage is expected to resume. Research reports and ratings should not be relied upon as individualinvestment advice. As always, an investor’s decision to buy or sell a security must depend on individual circumstances, including existing holdings,time horizons and risk tolerance. Piper Jaffray sales and trading personnel may provide written or oral commentary, trade ideas, or otherinformation about a particular stock to clients or internal trading desks reflecting different opinions than those expressed by the researchanalyst. In addition, Piper Jaffray technical research products are based on different methodologies and may contradict the opinions containedin fundamental research reports.• Overweight (OW): Anticipated to outperform relative to the median of the group of stocks covered by the analyst.
• Neutral (N): Anticipated to perform in line relative to the median of the group of stocks covered by the analyst.
• Underweight (UW): Anticipated to underperform relative to the median of the group of stocks covered by the analyst.
Other Important InformationThe material regarding the subject company is based on data obtained from sources we deem to be reliable; it is not guaranteed as to accuracy anddoes not purport to be complete. This report is solely for informational purposes and is not intended to be used as the primary basis of investmentdecisions. Piper Jaffray has not assessed the suitability of the subject company for any person. Because of individual client requirements, it is not, andit should not be construed as, advice designed to meet the particular investment needs of any investor. This report is not an offer or the solicitationof an offer to sell or buy any security. Unless otherwise noted, the price of a security mentioned in this report is the market closing price as of theend of the prior business day. Piper Jaffray does not maintain a predetermined schedule for publication of research and will not necessarily updatethis report. Piper Jaffray policy generally prohibits research analysts from sending draft research reports to subject companies; however, it should bepresumed that the analyst(s) who authored this report has had discussions with the subject company to ensure factual accuracy prior to publication,and has had assistance from the company in conducting diligence, including visits to company sites and meetings with company management andother representatives.
Notice to customers: This material is not directed to, or intended for distribution to or use by, any person or entity if Piper Jaffray is prohibited orrestricted by any legislation or regulation in any jurisdiction from making it available to such person or entity. Customers in any of the jurisdictionswhere Piper Jaffray and its affiliates do business who wish to effect a transaction in the securities discussed in this report should contact their localPiper Jaffray representative. Europe: This material is for the use of intended recipients only and only for distribution to professional and institutionalinvestors, i.e. persons who are authorised persons or exempted persons within the meaning of the Financial Services and Markets Act 2000 ofthe United Kingdom, or persons who have been categorised by Piper Jaffray Ltd. as professional clients under the rules of the Financial ConductAuthority. United States: This report is distributed in the United States by Piper Jaffray & Co., member SIPC, FINRA and NYSE, Inc., which acceptsresponsibility for its contents. The securities described in this report may not have been registered under the U.S. Securities Act of 1933 and, in suchcase, may not be offered or sold in the United States or to U.S. persons unless they have been so registered, or an exemption from the registrationrequirements is available.
This report is produced for the use of Piper Jaffray customers and may not be reproduced, re-distributed or passed to any other person or publishedin whole or in part for any purpose without the prior consent of Piper Jaffray & Co. Additional information is available upon request.
Copyright 2014 Piper Jaffray. All rights reserved.
Page 4 of 4Ignite Restaurant Group, Inc.